Category-Based Deep CCA for Fine-Grained Venue Discovery from Multimodal Data
Abstract
In this work, travel destination and business location are taken as venues. Discovering a venue by a photo is very important for context-aware applications. Unfortunately, few efforts paid attention to complicated real images such as venue photos generated by users. Our goal is fine-grained venue discovery from heterogeneous social multimodal data. To this end, we propose a novel deep learning model, Category-based Deep Canonical Correlation Analysis (C-DCCA). Given a photo as input, this model performs (i) exact venue search (find the venue where the photo was taken), and (ii) group venue search (find relevant venues with the same category as that of the photo), by the cross-modal correlation between the input photo and textual description of venues. In this model, data in different modalities are projected to a same space via deep networks. Pairwise correlation (between different modal data from the same venue) for exact venue search and category-based correlation (between different modal data from different venues with the same category) for group venue search are jointly optimized. Because a photo cannot fully reflect rich text description of a venue, the number of photos per venue in the training phase is increased to capture more aspects of a venue. We build a new venue-aware multimodal dataset by integrating Wikipedia featured articles and Foursquare venue photos. Experimental results on this dataset confirm the feasibility of the proposed method. Moreover, the evaluation over another publicly available dataset confirms that the proposed method outperforms state-of-the-arts for cross-modal retrieval between image and text.
Index Terms:
Deep CCA, Category-based deep CCA, Fine-grained venue discovery, Multimodal data, Cross-modal correlationI Introduction
Context aware applications are very promising because they can provide suitable services adapted to user context. Assume a user visits a venue for the first time. He does not know exactly where he is, but takes a photo there. Venue discovery helps to find the exact venue where the photo was taken and a group of relevant venues whose textual/visual features also match the photo. The former captures user context while the latter is important for venue recommendation.
Fine-grained venue discovery from a photo was almost impossible years ago since we lack reliable venue data sources. Fostered by multimedia technology innovation and mobile user engagements, business-related social multimedia data and information have been expanding with large volumes over the Internet, e.g., featured articles for business venues in Wikipedia, business venue photos on Foursquare and Yelp, and video advertising on YouTube. On the other hand, the growth of venue photos containing visual business contents has made various business services significantly more visible to a seeker on the Internet, leading to a visit or a purchase in the physical world. The interactions between users and venues result in various multimedia data and information aggregated on the Internet, which brings us new opportunities to fine-grained venue discovery by leveraging the power of social multimodal data. Here, “multimodal” means that each venue has multiple representations in different modalities like text and vision (images).
Some literature has investigated venue discovery, e.g., the prediction of geographic category of a photo [1] or visual concept of a photo [2], or the coarse prediction of the location of a photo [3]. However, few efforts focus on fine-grained venue discovery with more complicated real images generated by users such as venue photos containing objects, geographic categories, and more meaningful semantic descriptions.
Fine-grained venue discovery relies on the correlation analysis between images and text description of venues. This is a “cross-modal” analysis because it compares data in one modality with data in a different modality. Many efforts have been carried out for single modal or cross-modal classification and retrieval tasks. Researches in a single-modal task include, e.g., using deep networks for scene recognition [4], using deeper networks to achieve better performance in image classification [5, 6], generalizing features extracted from a specific dataset in a fully supervised fashion for generic tasks [7]. Some works investigated multiple modalities, e.g., event summarization by leveraging both visual and textual information [8]. Recently, there are some initial work on cross-modal correlation, such as predicting answers given an image and a question as input [9], analyzing pairwise correlation between images and their captions [10], cross-modal retrieval by canonical correlation analysis (CCA) [11] or kernel CCA (KCCA) [12].
In this work, we investigate venue-related multimodal data from Wikipedia and Foursquare, and study (i) exact venue search (find the venue where the photo was taken), and (ii) group venue search (find relevant venues with the same category as that of the photo) in a joint framework for fine-grained venue discovery. To the best of our knowledge, this is the first study that focuses on the joint optimization by visual and textual diversity of venues over an integrated venue-related multimodal data. To this end, we propose a Category-based Deep CCA (C-DCCA) method, where data in different modalities are non-linearly projected to the same space via deep networks so that data of different modalities from the same venue or from different venues with the same category are highly correlated in that space.
The contribution of this paper is three-fold, as follows: (i) The proposed C-DCCA method is an important extension to Deep CCA (DCCA) [13]. Pairwise correlation between different modal data from the same venue and category-based correlation between different modal data from different venues with the same category are jointly optimized so that a rank list of relevant venues with the same category as that of the input photo is predicted, and the exact venue where the photo was taken appears in the top. (ii) Fine-grained venue discovery is done by leveraging heterogeneous multimodal contents. Although each featured article of a venue in Wikipedia contains rich text information about the venue, its accompanying photo cannot well represent all the visual information. Therefore, we further exploit venue photos from Foursquare. In this way, the number of photos per venue in the training phase is increased to capture rich text information of a venue. (iii) Extensive experiments on multimodal venue-related dataset verify the feasibility of the proposed C-DCCA model. Additionally, the evaluation on a publicly available dataset [11] confirms that the proposed method outperforms state-of-the-arts for cross-modal retrieval between image and text.
II Related work
Generally speaking, fine-grained venue discovery by leveraging heterogeneous social multimodal dataset is a very challenging research topic. It is related to two research lines in the following.
II-A Cross modal correlation learning
Automatically learning to represent cross-modal correlations between images and texts has attracted lots of research interests in the areas of computer vision, natural language processing, and machine learning. CCA [14], cross-modal factor analysis (CFA) [15], Bilinear model [16] as joint dimensionality reduction techniques were proposed to learn linear functions that map different modalities to the same canonical (semantic) space where the correlation between two modalities is maximized. It is a very popular embedding method for matching images against texts. KCCA [17] is an extension of CCA to calculate non-linear correlations by leveraging the kernel trick. In comparison, DCCA [13] models non-linear mapping by deep neural networks and on this basis maximizes correlation across different modalities. Cross-modal correlation between images and their captions via DCCA is analyzed in [10]. General cross-modal correlation between images and rich text information is studied in [11] by CCA and in [12] by KCCA.
II-B Predicting venues from images
There are some existing works which concentrate on location or venue category prediction from images [1, 2, 3, 18, 19, 20, 21]. Earliest research [1] related to inferring geo-information from an image is to estimate a distribution of geographic locations by utilizing a data-driven scene matching method. However, it targets for outdoor images at the level of coarse granularity such as a city. Authors in [3] proposed to select the vocabulary by using the most informative features and exploit vocabulary tree search for large-scale location discovery within a city based on investigating street view images. The level of granularity is within a 20 km urban terrain. In [18], the authors leverage multiple sources of information to infer the location of a video. Their location discovery is at region-scale granularity. Moreover, the task of landmark discovery [19, 20] is to recognize buildings or objects from a given image, which is closely related to location prediction. It usually needs to classify images according to objects. Some hand-crafted features such as SIFT are extracted to represent images. For a more recent work in [21], the authors learn deep representations to localize a ground-level image where aerial images are used to help location prediction. They are able to obtain a finer granularity but only applicable to outdoor images with buildings in a city scale. Some researchers have tried to use CNN (Convolutional neural network) to detect visual concepts as textual words, convert them to a word vector, and combine this with visual feature to represent venues for venue recognition [2]. This, however, in essence used only visual information.
II-C A short comparison
Distinguished from state-of-the-art approaches that mainly focus on pairwise correlation [11, 10] (between different view data of the same object), we introduce category information into the two-branch deep network. In contrast, we optimize both pairwise correlation and category-based correlation in a joint framework. Compared with the methods that predict coarse location from images at city-scale granularity [3, 18], fine-grained venue discovery in our work aims to search a relevant venue, the context of a photo indicating where the photo was taken, by leveraging the cross-modal correlation between images and rich text information of venues. In addition, we use more photo resources to better capture different visual aspects of a venue.
III Preliminaries
CCA has been a very popular method for embedding multimodal data in the shared space. Before presenting our C-DCCA model, we first give an outline of CCA and its typical extensions: KCCA and DCCA.
Let (e.g., visual feature) and (e.g., textual feature) be zero mean random (column) vectors with covariances , and cross-covariance . When a linear projection is performed, CCA [14] tries to find two canonical weights and , so that the correlation between the linear projections and is maximized.
| (1) | |||||
When multiple pairs of canonical weights are needed, it is equivalent to solve the following equation
| (2) |
where is an identity matrix, is the trace of a matrix, and are weight matrices with and as their columns. With and let and be the first left- and right- singular vectors of , and can be computed as follows
| (3) |
In the actual computation, and are estimated from instances of and with regularization. Once the canonical weights ( and ) are learned, they can be used to map new data of different modalities to the same space for correlation analysis. One of the known shortcomings of CCA is that its linear projection may not well model the nonlinear relation between different modalities.
KCCA [17] extends CCA to calculate non-linear correlations, and tries to model the nonlinearity of low dimensional space as a linear problem in a high dimensional space. Assume maps as () and maps as (). With pairs of samples and , pairs of data in the logical high dimensional space can be obtained as and . Then, with and , the basic CCA is applied as follows:
| (4) |
and themselves can be represented by and as and , and the above equation can be rewritten as
| (5) |
where and are defined as kernels. Similar to CCA, KCCA also maps and to the same canonical (kernel) space, although non-linearly. These kernels and canonical weights obtained in the training stage can be used to map new data into the canonical space for correlation analysis. One of the potential problems of KCCA is that it may overfit to the training data.
DCCA [13] also tries to calculate non-linear correlations between different modalities by a combination of DNNs (deep neural networks) and CCA. Different from KCCA which relies on kernel functions (corresponding to a logical high dimensional (sparse) space), DNN has the extra capability of compressing features to a low dimensional (dense) space, and then CCA is implemented in the objective function. The DNNs, which realize the non-linear mapping ( and ), and the canonical weights ( and ), are trained to maximize the correlation after the non-linear mapping, as follows.
| (6) |
IV Algorithm
Here, we consider two tasks in the same framework: (i) exact venue search (find the venue where the photo was taken), and (ii) group venue search (find relevant venues with the same category as that of the photo) for a given photo without accurate location information1111Although GPS metadata is available for most outdoor photos, its accuracy may be low in urban canyons with high buildings. In addition, it is not available for indoor or underground environments. Therefore, we consider GPS metadata as an option, not a necessity., by the correlation between the input photo and textual descriptions of venues in the database. Each venue has an assigned category, rich text description and user generated images. Text and images inherit the same category of a venue. In the training phase, text and images of venues are used to learn the cross-modal correlation so that text features and visual features are highly correlated in the canonical space and text feature alone can well represent a venue. In the testing phase, visual feature of an input photo is compared against the textual features of venues. In the future, we will further explore how to use extra images to better represent a venue.
Typically Wikipedia data contains one featured article and one photo per venue. However, a single photo cannot well represent all visual aspects of a venue. In contrast, Foursquare contains many photos generated by users for each venue. In the training phase, we try to use Foursquare photos to represent diverse visual aspects of a specific venue, described in the Wikipedia featured article. In other words, multiple Foursquare photos are used to represent the same Wikipedia article, and featured articles in Wikipedia and Foursquare photos for the same venues are integrated together so as to better learn the correlation between images and text.
Contrary to the existing methods of visual venue discovery, we propose category-based deep canonical correlation analysis (C-DCCA) for the cross-modal search between images and text. Our approach is an important extension of DCCA, which handles the correlation learning of diverse visual and textual contents for the specific venues in the real scenario of multimodal learning.
In the following, we express the motivation of learning strategy, formulate the problem of fine-grained venue discovery, and present the architecture of the proposed deep network in details.
IV-A Motivation of learning strategy
The ability to infer correlations between images and texts of venues is a prerequisite for the prediction of relevant venues for a given photo. As discussed in previous sections, today we can acquire hundreds of venue photos or even more for a specific venue with different venue aspects in various media sharing platforms. Existing cross-modal correlation learning is a flat method which predicts the correlation based on the pairwise similarity between an image and a text article, which is not sufficient for learning the diverse aspects of a specific venue and the correlation between image and text of different venues of the same category. In this work, we make use of the Wikipedia featured article for a specific venue as its knowledge base and the corresponding venue photos in Wikipedia and Foursquare as its visual contents, if the Foursquare image is visually similar to the Wikipedia image and is explicitly described by Wikipedia description. In this way, each venue has multimodal data (geographic categories, visual contents, textual descriptions), and needs to be represented in the same space for the similarity comparison.
In many deep learning methods for recognition and discovery issues, fine-tuning layers suitable for new tasks is non-trivial. Moreover, some architectures are developed to jointly consider two or more tasks by utilizing different branches to concatenate each other. In this study, we tackle fine-grained venue discovery by optimizing the CCA objective function in the joint deep learning framework. Besides the pairwise correlation considered in DCCA, we also try to learn the category-based correlation between data of different venues with the same category.
IV-B Problem formulation
As for a venue , we denote its Wikipedia text as , its Wikipedia photo as , and its Foursquare photo set as . Given a social photo , the system will predict a rank list of venues, which includes the exact venue where the photo was taken and relevant venues with the same category as that of the photo, based on the correlation between the input photo and textual description of venues
| (7) |
Because deep features from image and featured articles of venues are mapped into a common space where they are highly correlated, here textual feature alone is used to represent a venue. The function , which takes into account both the pairwise correlation among data from the same venue and the category-based correlation among data from different venues with the same category, is defined later by C-DCCA.
To improve the accuracy of predicting the category and relevant venues of a photo, in this work, is divided into two parts: is used together with to train the cross-modal model, and is used for the test.
IV-C Architecture of the proposed network
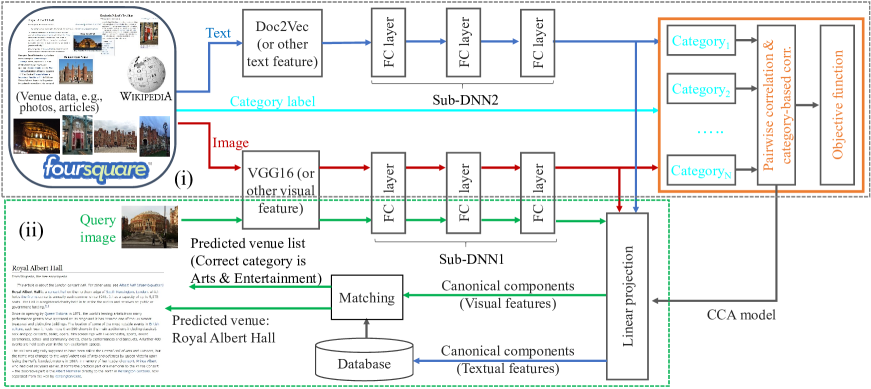
Figure 1 shows the whole framework. Part (i) in dashed, gray line illustrates the proposed network architecture. From the images and text articles, visual features and textual features are extracted respectively. These features, however, belong to different modalities and cannot be compared directly. Therefore, they are mapped to a common space, by using sub-DNNs. To enhance the correlation in this common space, CCA is used as the objective function. Either of the sub-DNN models consists of three fully connected layers. To capture the common features of similar venues, we use geographic categories defined in Foursquare as concepts to divide venues into groups. Both the pairwise correlation between photos and text of the same venue, and the category-based correlation between photos and text of different venues with the same category, are considered in the CCA objective function, which is used to adjust the sub-DNNs.
IV-C1 Visual feature extraction
Recently CNNs have demonstrated excellent performances in image recognition tasks. In particular, CNNs have the great capability in learning complex features for representing visual contents, which is superior to hand-crafted features such as HOG [22] and SIFT [23]. Therefore, in the image branch, we take the VGG16 model [5] pre-trained on ImageNet as an example to extract visual feature for all the images, although other visual feature extraction method is also applicable.
Each venue image is first converted to a fixed size of , and then input into the network. The VGG16 model consists of 13 convolutional layers (conv1-conv13) and three fully connected layers (fc14-fc16). All layers use a ReLU (rectified linear unit) activation except fc16 which uses a softmax activation for the purpose of image classification. Each fully connected layer, except the last one, is followed by a dropout layer, to avoid overfitting. Images are processed sequentially per layer, and finally the 4,096-dimensional feature of fc15 is extracted as the visual feature for each venue image.
IV-C2 Textual feature extraction
Many features have been proposed for representing text articles, e.g., TF-IDF (term frequency-inverse document frequency), topic models such as latent Dirichlet allocation (LDA) model, and word embedding method that represents each word by a vector in a space (Word2Vec) where words with similar meaning are close to each other in the space. Doc2Vec [24] extends the Word2Vec model by converting an entire document into a fixed length vector, taking into account the order of words in the context.
In the text branch, we take the Doc2Vec model as an example to extract textual feature. Text description of each venue, crawled from Wikipedia, consists of much non-relevant information. First, only the main text and category information are extracted by invoking Wikipedia API. Then, it is tokenized by using coreNLP [25], and passed to the Doc2Vec model, generating a fixed 300-dimensional feature for each venue article. We use the pre-trained apnews_dbow weights222https://ibm.ent.box.com/s/9ebs3c759qqo1d8i7ed323i6shv2js7e in the analysis.
IV-C3 Category-based DCCA
Visual features and textual features are further converted into low dimensional features in a common space by using different sub-DNNs. The details of sub-DNNs are shown in Table I. These two sub-DNNs each have 3 fully connected layers. Before the input, there is a batch normalization. In the 1st layer and 2nd layer, there is a dropout sub-layer, used for avoiding over-fitting. Each layer takes the output of its preceding layer to compute its output , where and are the weight matrix and bias for the th layer and is the activation function.
| Sub-DNN1 (Image) | Sub-DNN2 (Text) | |
|---|---|---|
| Input | 4096 | 300 |
| 1st layer | 1024, tanh | 1024, tanh |
| 2nd layer | 1024, tanh | 1024, tanh |
| 3rd layer (output) | 10, linear | 10, linear |
Original visual feature is denoted as and original textual feature is denoted as . The overall functions of sub-DNNs are denoted as and in a similar way.
Assume the th pair of samples after sub-DNNs are and respectively. The covariance matrices and are computed in the same way as in previous works, after removing the average of and and adding a regularization parameter (). Here is the operation of computing the average.
| (8) |
| (9) |
The cross covariance is computed in a way different from that of DCCA. It is computed per group (category) first. Within each group with the same category, the general method is to compute , using the pairs of visual and textual features from the same venue. To enhance the similarity within the same group, here we also compute , using visual/textual features from different venues of the same group. Finally, is computed as a weighted average of and from all data , using a parameter ().
| (10) |
| (11) |
| (12) |
plays an important role here. A large improves the pairwise correlation but degrades the category-based correlation (C-DCCA degenerates to DCCA at ). On the other hand, a small improves the category-based correlation but degrades the pairwise correlation. The two are conflicting targets that cannot be achieved simultaneously. is set empirically to take a tradeoff between the two targets.
In the training phase (part (i) of Fig. 1), is computed as an objective function, which is maximized by adjusting the weights and bias in sub-DNNs. In this process, non-linear functions , , and the linear projections and are jointly obtained as follows
| (13) |
In this optimization, there are four parameters. These parameters are iteratively solved as follows:
-
1.
and are initialized.
-
2.
With a batch of input (, ), their non-linear mapping result and are computed by the sub-DNNs.
-
3.
, , and are computed.
-
4.
and are computed by the CCA.
-
5.
and are updated by the back propagation procedure, in the same way as in [13].
-
6.
Step 2) to 5) are repeated until the training converges.
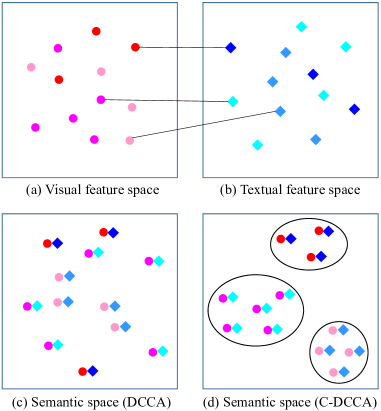
The expected effect of the C-DCCA is shown in Fig. 2. In Fig. 2(a-b), visual features and textual features are located in different spaces and have unclear correlations. In Fig. 2(c), they are mapped to the same semantic space, strengthening their pairwise correlation. As a comparison, in Fig. 2(d), category-based correlation in C-DCCA makes features from different venues with the same category close to each other.
V Evaluation
We evaluate the performance of the proposed C-DCCA method, by comparing it with CCA [14], KCCA [17], DCCA [13], C-CCA (category-based CCA) [12], and C-KCCA (category-based KCCA) [12]. In the evaluation, KCCA uses a Gaussian kernel, and DCCA is based on [13]. On top of DCCA, we implemented the proposed C-DCCA. DCCA shares the same network structure as C-DCCA except that its parameter is set to 1. The category-based correlation in C-CCA and C-KCCA is the same as in C-DCCA, with the same parameter . All methods share the same feature (visual feature, text feature, geographic category), and use the same regularization parameter and the same number of canonical components (10).
V-A Evaluation setup
We investigate the fine-grained venue discovery as shown in part (ii) of Fig. 1. The database is composed of venues each with a featured article (text description) and other related information. Given a photo as an input, the system computes the correlation between the input photo and the text description of venues in the database. The venue with the maximal correlation is regarded as the exact venue where the photo was taken.
In the evaluation, we will use recall-precision curve, mean average precision (MAP), and mean reciprocal rank 1 (MRR1) as main metrics. In the group venue search, the system generates a ranked list of venues, where venues with the same category as that of the input photo are regarded as relevant. Here, group venue search based on the correlation between images and text descriptions is different from the one that merely exploits visual information. It is evaluated by recall-precision and MAP. When considering whether a specific venue can be discovered by a photo taken there, there is only one relevant venue, and MRR1 is a good metric indicating both the accuracy and the rank of the results.
Through integrating venue data including images and texts in Wikipedia and Foursquare, we have 19,792 photos and 1,994 article descriptions for 1,994 venues in our experiments. Wikipedia data are collected from 5 cities (New York City, Los Angeles, London, Sydney, Orlando), and Foursquare photos are collected from two cities (Los Angeles, London). Venues with the same name and coordinates in Wikipedia and Foursquare are regarded as the same. According to the semantics of venues, Foursquare provides 10 primary categories for venues [26]. These venue categories (Arts & Entertainment, College & University, Event, Food, Nightlife Spot, Outdoor & Recreation, Professional & Other place, Residence, Shop & Service, Travel & Transport) used for dividing venue photos and descriptions into groups are indexed from 1 to 10 in our experiment. Category information of venues (images and texts) is directly obtained from Foursquare by public API.
Out of the 1,994 Wikipedia venues, 1,500 are used for training the network. In addition, part of Foursquare images (from both Los Angeles and London) are added into the training set, paired with Wikipedia text of the corresponding venue. In the test phase, the database only consists of textual features of all venues and the queries come from the Foursquare images (either Los Angeles or London) that are not used in the training. In each run, the split of Wikipedia dataset and Foursquare dataset is random for the training, and a new model is trained. All results are averaged over 5 cross validations.
The experiments are conducted on a Centos7.2 server, which contains CUDA8.0, Conda3-4.3.11 (python 3.5), Tensorflow 1.3.0, and Keras 2.0.5. In addition, it is configured with E5-2620v4 CPU (2.1GHz), GeForce GTX 1080 Ti (11GB), and DDR4-2400 Memory (128GB).
V-B Impact of Different Parameters
In the training, the Adam optimizer is used and the learning rate is set to 0.0001. Batch size is set to 100. We tried different regularization parameter (0.01, 0.001, 0.0001, 0.00001), but found no significant difference. In the rest experiments, is set to 0.0001.
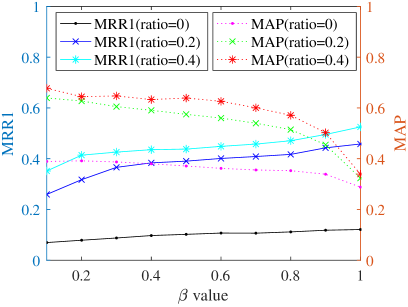
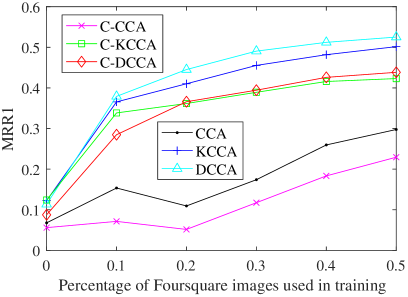
The parameter greatly affects system performance. The results of MRR1 and MAP, under different values of , are shown in Fig. 3. As increases, MRR1 increases while MAP decreases. This is because a large will lead to a large weight for the covariance and a small weight for the cross covariance in Eq. 12. There is no significant variation in the performance when changes within the range of . In the following is set to 0.3.
V-C Evaluation of the Group Venue Search
Here we evaluate the group venue search. We adjust the ratio of Foursquare photos in the training to see how well all methods benefit from the increase of photos in each venue.
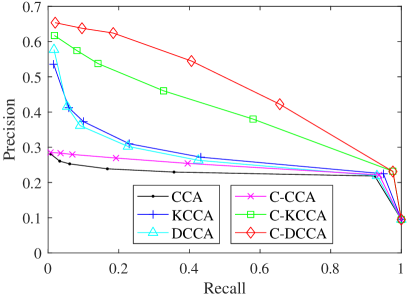
Fig. 4 demonstrates the recall-precision curve using Los Angeles photos as queries, where the ratio of Foursquare photos used in the training is equal to 20%. This pair of recall and precision is obtained by changing the number of output. Generally, C-DCCA outperforms C-KCCA, which outperforms other methods. As the number of output increases, recall gradually increases while precision decreases, but with different trends in different methods. The decrease in precision is slow in C-DCCA and C-KCCA which indicates that most venues in the top have the same category as the input photo, but the decrease in precision is fast in DCCA and KCCA, which implies that except the first venue, other venues may have different categories as the input photo. This confirms the fact that C-DCCA improves the category-based correlation while DCCA only stresses the pairwise correlation.
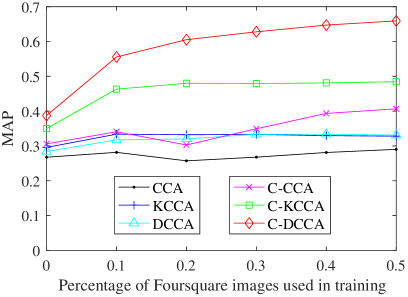
The MAP result is shown in Fig. 5. By increasing the percentage of Foursquare photos in the training, more photos are used to represent venues in learning the correlation between photos and text descriptions. Therefore, the textual feature can better represent a venue. Accordingly, the MAP result usually increases in all methods, but with different trends. MAP in C-DCCA has a much larger gain than that of the other methods.
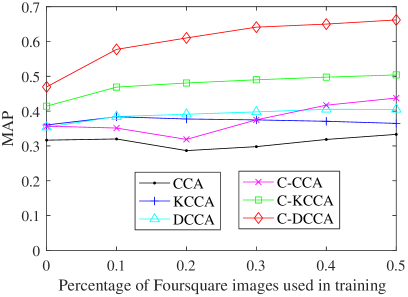
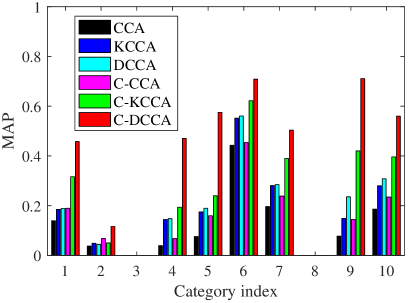
Next we use London photos as queries, which has many more photos than Los Angeles. The MAP result in Fig. 6 shows a similar trend as in Fig. 5. Fig. 7 further shows the MAP per category. There are no venues with 3rd and 8th categories. In other categories, C-DCCA achieves much better performance than other methods.
V-D Evaluation of the Exact Venue Search
The performance of finding the exact venue where a photo was taken is evaluated by the MRR1 metric. The MRR1 result with Los Angeles photos in Foursquare as queries is shown in Fig. 8. Although the MRR1 performance increases with the ratio of Foursquare images used in the training in all methods, there is a clear gap between C-DCCA and DCCA. But compared with the decrease of MRR1 in C-DCCA, the increase of MAP in C-DCCA is much larger.
In the above, we only considered the correlation between the photo and text. Actually, when a photo was taken by a mobile device, the position of the photo can somehow be obtained simultaneously and used to narrow the search range. A coarse positioning method that works in both outdoor and indoor environments is to collect the signal strength and cell ID of nearby cells. Although this accuracy is very coarse, it does help to reduce the search range and improve the performance of finding relevant venues.
Assume that the position of each venue is accurately known and that the positioning accuracy of a photo by using cell ID is 1km. Then, the MRR1 results, using Los Angeles photos or London photos as queries, are shown in Fig. 9 and Fig. 10, respectively. The gap between C-DCCA and DCCA decreases. In Los Angeles, MRR1 is above 0.8. In London, MRR1 is a little lower due to more venues there, but it is still nearly 0.7.

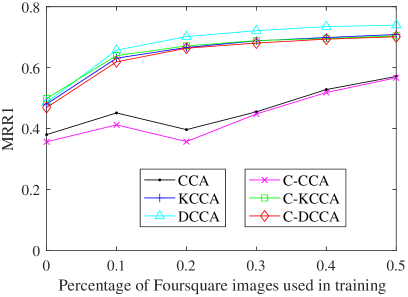
In this way, C-DCCA not only has nearly the same performance (MRR1) as DCCA in the exact venue search, but also achieves much better performance (MAP) in the group venue search compared with DCCA and other methods.
V-E Evaluation with the UCSD Dataset
To demonstrate its applicability and effectiveness in other tasks, we extend our method to the cross-modal retrieval and classification between image and text over a public dataset provided by the UCSD group [11]. This multimodal image-text dataset is completely generated from Wikipedia featured articles without relying on other image resources, which contains 2,866 documents (each contains a pair of text and image) in 10 most popular categories. It is divided into a training set of 2,173 documents and a testing set of 693 documents. The definition of category depends on Wikipedia tags and is different from that of Foursquare with venue-specific semantic tags.
In [11], the textual feature is derived from a LDA model with 10 dimensions. An image is first represented as a bag of SIFT descriptions, and visual feature space is divided into 128 sub-spaces by k-means. Then, a new visual feature is computed as the SIFT histograms (SIFThist) with respect to these sub-spaces, which has 128 dimensions. The results of CM (correlation matching), SM (semantic matching) and SCM (semantic correlation matching) are directly taken from [11].
We explore the different combinations of visual feature (VGG16 or SIFThist) and textual feature (Doc2Vec or LDA) to evaluate the performance of C-DCCA. For VGG16+Doc2Vec, the same network architecture in Table I is used. For other combinations, the input is changed accordingly, and the number of CCA component is adjusted a little to reach their best performance. We also try to fine tune the pretrained models. With the training set and the category information, we refine the fully-connected layers of VGG16. Because the Doc2Vec model does not support fine tuning with a different vocabulary set, we retrain it from the ground.
The MAP results of group venue search are shown in Table II. These results reflect three facts. (i) C-DCCA outperforms the cross-modal retrieval method suggested in [11] in terms of correlation analysis. Compared with CM/SCM, C-DCCA achieves a better performance when using the same hand-crafted SIFThist+LDA feature. (ii) Features also play an important role. Because VGG16 far outperforms SIFThist and Doc2Vec is also a little better than LDA, we can see a large improvement when C–DCCA changes its feature from SIFThist+LDA to VGG16+Doc2Vec. (iii) Refining the pretrained model is also helpful. The re-training of the pre-trained models has an obvious effect (especially when VGG16+Doc2Vec is used) because the statistical property of the UCSD dataset is not completely the same as that of large datasets used for pretraining these models.
VI Conclusion
This paper studies fine-grained venue discovery by learning the cross-modal correlation between photos and the rich text descriptions of venues over heterogeneous multimodal contents. Different from previous research, this work jointly optimizes the pairwise correlation and the category-based correlation, and the exact venue search and group venue search are realized simultaneously. Extensive experiments confirm that (i) The proposed C-DCCA method greatly improves the performance of group venue discovery, compared to state-of-the-art methods. (ii) Using the coarse location information helps to reduce the gap between C-DCCA and DCCA in the exact venue search. (iii) Using extra image resources for representing visual aspects of venues helps to further improve the performance of fine-grained venue discovery.
References
- [1] J. Hays and A. A. Efros, “IM2GPS: estimating geographic information from a single image,” in 2008 IEEE Computer Society Conference on Computer Vision and Pattern Recognition, CVPR, 2008.
- [2] B.-C. Chen, Y.-Y. Chen, F. Chen, and D. Joshi, “Business-aware visual concept discovery from social media for multimodal business venue recognition,” in Proceedings of the Thirtieth AAAI Conference on Artificial Intelligence, ser. AAAI’16, pp. 101–107.
- [3] G. Schindler, M. A. Brown, and R. Szeliski, “City-scale location recognition,” in 2007 IEEE Computer Society Conference on Computer Vision and Pattern Recognition CVPR, 2007.
- [4] B. Zhou, A. Lapedriza, J. Xiao, A. Torralba, and A. Oliva, “Learning deep features for scene recognition using places database,” in Proceedings of the 27th International Conference on Neural Information Processing Systems, ser. NIPS’14, 2014, pp. 487–495.
- [5] K. Simonyan and A. Zisserman, “Very deep convolutional networks for large-scale image recognition,” CoRR, vol. abs/1409.1556, 2014.
- [6] C. Szegedy, W. Liu, Y. Jia, P. Sermanet, S. Reed, D. Anguelov, D. Erhan, V. Vanhoucke, and A. Rabinovich, “Going deeper with convolutions,” in 2015 IEEE Conference on Computer Vision and Pattern Recognition (CVPR), 2015, pp. 1–9.
- [7] J. Donahue, Y. Jia, O. Vinyals, J. Hoffman, N. Zhang, E. Tzeng, and T. Darrell, “Decaf: A deep convolutional activation feature for generic visual recognition,” in Proceedings of the 31st International Conference on International Conference on Machine Learning - Volume 32, ser. ICML’14, 2014, pp. I–647–I–655.
- [8] R. R. Shah, Y. Yu, A. Verma, S. Tang, A. D. Shaikh, and R. Zimmermann, “Leveraging multimodal information for event summarization and concept-level sentiment analysis,” Know.-Based Syst., vol. 108, no. C, pp. 102–109, 2016.
- [9] M. Malinowski, M. Rohrbach, and M. Fritz, “Ask your neurons: A neural-based approach to answering questions about images,” in 2015 IEEE International Conference on Computer Vision, ICCV, 2015, pp. 1–9.
- [10] F. Yan and K. Mikolajczyk, “Deep correlation for matching images and text,” in IEEE Conference on Computer Vision and Pattern Recognition, CVPR, 2015, pp. 3441–3450.
- [11] N. Rasiwasia, J. Costa Pereira, E. Coviello, G. Doyle, G. R. Lanckriet, R. Levy, and N. Vasconcelos, “A new approach to cross-modal multimedia retrieval,” in Proceedings of the 18th ACM International Conference on Multimedia, ser. MM ’10. New York, NY, USA: ACM, 2010, pp. 251–260. [Online]. Available: http://doi.acm.org/10.1145/1873951.1873987
- [12] N. Rasiwasia, D. Mahajan, V. Mahadevan, and G. Aggarwal, “Cluster canonical correlation analysis,” in Proceedings of International Conference on Artificial Intelligence and Statistics, ser. AISTATS’14, vol. 33, pp. 823–831.
- [13] G. Andrew, R. Arora, J. Bilmes, and K. Livescu, “Deep canonical correlation analysis,” in Proceedings of the 30th International Conference on International Conference on Machine Learning - Volume 28, ser. ICML’13, 2013, pp. III–1247–III–1255.
- [14] H. Hotelling, “Relations between two sets of variates,” Biometrika, vol. 28, no. 3/4, pp. 321–377, 1936.
- [15] D. Li, N. Dimitrova, M. Li, and I. K. Sethi, “Multimedia content processing through cross-modal association,” in Proceedings of the Eleventh ACM International Conference on Multimedia, ser. MM ’03. ACM, 2003, pp. 604–611.
- [16] J. B. Tenenbaum and W. T. Freeman, “Separating style and content with bilinear models,” Neural Comput., vol. 12, no. 6, pp. 1247–1283, Jun. 2000.
- [17] N. Cristianini and J. Shawe-Taylor, An Introduction to Support Vector Machines: And Other Kernel-based Learning Methods. Cambridge University Press, 2000.
- [18] G. Friedland, O. Vinyals, and T. Darrell, “Multimodal location estimation,” in Proceedings of the 18th ACM International Conference on Multimedia, ser. MM ’10, 2010, pp. 1245–1252.
- [19] Y. Li, D. J. Crandall, and D. P. Huttenlocher, “Landmark classification in large-scale image collections,” in IEEE 12th International Conference on Computer Vision, ICCV, 2009, pp. 1957–1964.
- [20] D. M. Chen, G. Baatz, K. Koser, S. S. Tsai, R. Vedantham, T. Pylvanainen, K. Roimela, C. Xin, J. Bach, M. Pollefeys, B. Girod, and R. Grzeszczuk, “City-scale landmark identification on mobile devices,” in Proceedings of the 2011 IEEE Conference on Computer Vision and Pattern Recognition, ser. CVPR ’11, 2011, pp. 737–744.
- [21] T. Lin, Y. Cui, S. J. Belongie, and J. Hays, “Learning deep representations for ground-to-aerial geolocalization,” in IEEE Conference on Computer Vision and Pattern Recognition, CVPR, 2015, pp. 5007–5015.
- [22] N. Dalal and B. Triggs, “Histograms of oriented gradients for human detection,” in 2005 IEEE Computer Society Conference on Computer Vision and Pattern Recognition (CVPR’05), vol. 1, 2005, pp. 886–893 vol. 1.
- [23] D. G. Lowe, “Object recognition from local scale-invariant features,” in Proceedings of the International Conference on Computer Vision-Volume 2 - Volume 2, ser. ICCV ’99, 1999, p. 1150.
- [24] J. H. Lau and T. Baldwin, “An empirical evaluation of doc2vec with practical insights into document embedding generation,” CoRR, vol. abs/1607.05368, 2016.
- [25] C. D. Manning, M. Surdeanu, J. Bauer, J. R. Finkel, S. Bethard, and D. McClosky, “The stanford corenlp natural language processing toolkit,” in Proceedings of the 52nd Annual Meeting of the Association for Computational Linguistics, ACL 2014, 2014, pp. 55–60.
- [26] Y. Yu, S. Tang, R. Zimmermann, and K. Aizawa, “Empirical observation of user activities: Check-ins, venue photos and tips in foursquare,” in Proceedings of the First International Workshop on Internet-Scale Multimedia Management, ser. WISMM ’14, 2014, pp. 31–34.