Characterization of a 109Cd gamma-ray source for the two-phase argon detector
Abstract
At present, a two-phase argon detector is being developed in our laboratory for dark matter search and low-energy neutrino experiments. To calibrate its energy scale a 109Cd gamma-ray source was used. In this work a detailed emission spectrum of the 109Cd source was measured using YAP:Ce scintillator and high-purity germanium (HPGe) detectors. It is shown that the 109Cd source, equipped with a W substrate and a Cu filter, can provide a complete set of gamma-ray lines, ranging from 8 to 90 keV, for the energy calibration of two-phase detectors. These measurements allowed us to successfully quantify the shape of the amplitude spectra observed in the two-phase argon detector when irradiated with the 109Cd source.
1 Introduction
The main purpose of this work is to provide reference data on the emission spectrum of a 109Cd gamma-ray source. Such a radioactive source is used to calibrate the energy scale of a two-phase argon detector, which is being developed in our laboratory for dark matter search and low-energy neutrino experiments [1, 2, 3, 4, 5, 6, 7].
This study was motivated by the recent observations in the two-phase argon detector [5]: the standard gamma-ray lines expected from a 109Cd source, at 22-25 and 88 keV [8, 9, 10, 11, 12], were accompanied by additional lines around 60 keV. In this work, we carefully measured the emission spectrum of the 109Cd source using YAP:Ce scintillator and high-purity germanium (HPGe) detectors. This allowed us to successfully quantify the 109Cd emission spectrum measured in the two-phase argon detector. To the best of our knowledge, this is the first time that such a detailed 109Cd emission spectrum has been published in the literature.
2 Description of 109Cd radioactive source
A 109Cd isotope decays into 109Ag with a half-life of 461 days, emitting a number of gamma-ray lines in the energy range of 20-90 keV [8, 9, 10, 11, 12]. A schematic view of the 109Cd source used in our measurements is shown in figure 1. The source was produced by Cyclotron company and had an activity of 2.5108 Bq in April 2014 [13].
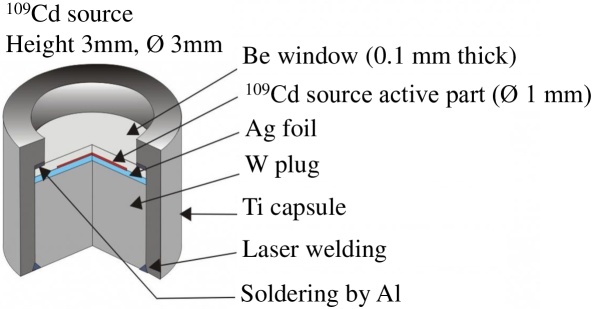
The radionuclide 109Cd was electroplated on a Ag foil. The foil with the radionuclide was hermetically sealed in a Ti capsule. The hermetization of the capsule was provided by laser welding. From one side of the radionuclide a W plug (substrate) was mounted to absorb the radiation; and on the other side there was a thin Be window.
3 Measurements with HPGe detector
The most precise emission spectrum of the 109Cd source was measured using a HPGe detector [14], namely that of GUL/EGX 10-05 Canberra [15]. The measurement conditions were similar to that of the two-phase detector in [5]. In particular, Al and acrylic filters, 3 mm thick each, were placed between the 109Cd source and the detector.
Figure 2 shows the resulting amplitude spectrum. Energy, origin, intensity and energy resolution for identified peaks (except escape peaks) are presented in table 1.


| Energy (keV) | Origin | Area, normalized to 88.03 keV line | |
| 88.03 | 109Cd 109Ag | 1 | 2.2 |
| 69.07 | W k | 0.01 | 2.8 |
| 67.03 | W k + k | 0.037 | 3.6 |
| 59.32 | W k | 0.092 | 2.9 |
| 57.98 | W k | 0.049 | 2.9 |
| 25.45 | Ag k | 0.09 | 5.1 |
| 24.93 | Ag k + k | 0.44 | 5.3 |
| 22.08 | Ag k + k | 0.97 | 7.0 |
First of all, the primary peaks due to 109Cd and 109Ag were identified at 88.03, 25.45, 24.93 and 22.08 keV [11]. In the range of 60-70 keV four secondary peaks due to X-ray fluorescence (characteristic lines) of W were identified at 69.07, 67.03, 59.32 and 57.98 keV. All other identified peaks are due to X-rays escaped from the HPGe detector with the escaped energies of 9.87(Ge k + Ge k) and 10.98(Ge k + Ge k) keV, that is, these are the escape peaks. For example, the 11.10 keV peak is the escape peak induced by absorption of a primary 22.08 keV photon, where a secondary (fluorescent) 10.98 keV photon escaped the detector.
In addition to the peaks, there were two regions with continuous spectra. The first continuum, in the range of 25-88 keV, is produced when the 88.03 keV photons or W fluorescence photons scatter on the surrounding materials and then come back to the detector. The second continuum, in the range of 0-22 keV, is produced when the gamma-rays scatter inside the detector, leaving there some energy, and then escape the detector.
4 Measurements with YAP:Ce scintillator detector
In additional to the measurements with the HPGe detector, the 109Cd emission spectrum was measured using a YAP:Ce (YAlO3, doped with Ce) scintillator coupled to a photomultiplier tube (PMT) Hamamatsu R10233. To match the emission spectra of the scintillator with the quantum efficiency spectrum of the PMT, the crystal was coated with a POPOP + PPO-based wavelength shifter (WLS) [17]. The 109Cd source was separated from the scintillator with an attenuation filter made from a Cu foil (0.17 mm thick).
Figure 3 shows the measured amplitude spectrum.
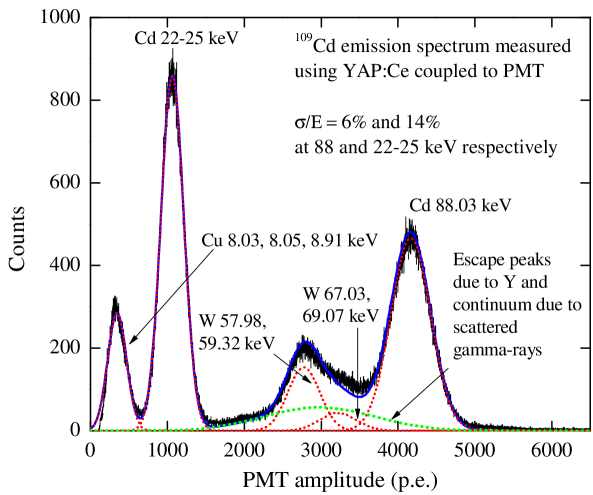
The contributions of different gamma-ray and X-ray lines are shown by the red and green dotted lines, while the blue solid line is the overall fit of the experimental data. On the one hand, the amplitude spectrum is similar to that of HPGe detector: the 109Cd gamma-lines and the X-ray characteristic lines of W are well distinguished. On the other hand, a Cu characteristic line at 8 keV has emerged, while those of the escape peaks due to Ge have disappeared. In addition, the escape lines due to Y and the continuum due to scattered radiation were observed: their total contribution is shown in green dotted line. Since the energy resolution of YAP:Ce detector is worse compared to that of HPGe detector, the softer Cd lines have merged, as well as those of W.
5 Measurements with two-phase detector
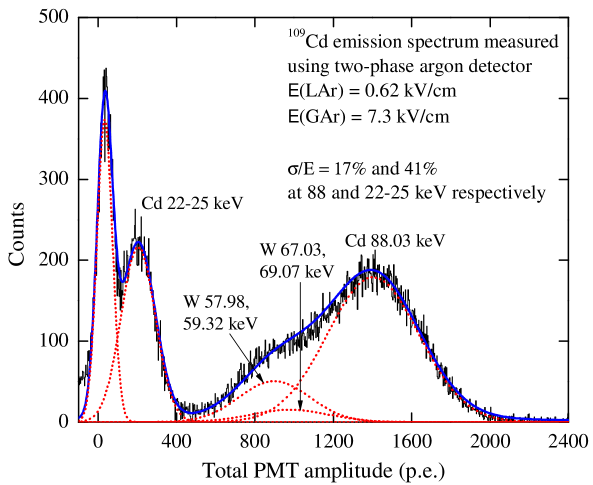
Figure 4 shows the 109Cd emission spectrum measured using a two-phase argon detector with electroluminescence gap described elsewhere [5, 6]. The energy resolution of the two-phase detector was somewhat worse than that of YAP:Ce. Accordingly, the spectrum shape in the two-phase detector was generally similar to that of YAP:Ce, despite the worst separation of the W and Cd lines. The overall spectrum is well described by the model, including the Cd lines, at 22-25 and 88 keV, and W characteristic lines, at 58-60 and 67-69 keV. It should be remarked that in [5] the W-lines in the amplitude spectrum were incorrectly interpreted as those being due to 241Am source. Thus in the current work we have corrected that misinterpretation.
6 Conclusions
In this work the emission spectrum of a 109Cd source was characterized using YAP:Ce scintillator and high-purity germanium (HPGe) detectors. These measurements allowed us to successfully quantify the shape of the amplitude spectrum measured in a two-phase argon detector when irradiated with the 109Cd source. Along with the main gamma-ray lines of 109Cd source, at 22-25 and 88 keV, the associated characteristic lines of W (due to W substrate), at 60-70 keV, and those of Cu (due to Cu filter), at 8 keV, were observed. Thus, the 109Cd source, equipped with a W substrate and a Cu filter, can provide a complete set of gamma-ray lines, ranging from 8 to 90 keV, for the energy calibration of two-phase detectors. To the best of our knowledge, this is the first time that such a detailed Cd emission spectrum has been presented in the literature.
Acknowledgments
This study was supported by Russian Science Foundation (project no. 16-12-10037). The part of the work relating to the measurement of the 109Cd emission spectrum using the HPGe detector was done using the infrastructure of the Shared-Use Center "Siberian Synchrotron and Terahertz Radiation Center (SSTRC)" based on VEPP-4M of BINP SB RAS.
References
- [1] A. Buzulutskov, Advances in cryogenic avalanche detectors, JINST 7 (2012) C02025.
- [2] A. Bondar et al., X-ray ionization yields and energy spectra in liquid argon, Nucl. Instr. Meth. A. 816 (2016) 119.
- [3] A. Buzulutskov, Photon emission and atomic collision processes in two-phase argon doped with xenon and nitrogen, Europhys. Lett. 117 (2017) 39002.
- [4] A. Bondar et al., Measurement of the ionization yield of nuclear recoils in liquid argon using a two-phase detector with electroluminescence gap, JINST 12 (2017) C05010.
- [5] A. Bondar et al., Two-phase cryogenic avalanche detector with electroluminescence gap operated in argon doped with nitrogen, Nucl. Instr. Meth. A. 845 (2017) 206.
- [6] A. Bondar et al., Further studies of proportional electroluminescence in two-phase argon, JINST 12 (2017) C05016.
- [7] A. Buzulutskov et al., Revealing neutral bremsstrahlung in two-phase argon electroluminescence, arXiv:1803.05329 (2018) .
- [8] R. Heath, Scintillation Spectrometry: Gamma-ray Spectrum Catalogue. USAEC Division of Techn. Information Extension, 2 ed., 1964.
- [9] http://www-personal.umich.edu/~ianrit/gammaspec.pdf.
- [10] C. Patrignani et al., Particle data group: Commonly used radioactive sources, Chin. Phys. C 40 (2017) 100001.
- [11] https://www.nndc.bnl.gov.
- [12] http://nucleardata.nuclear.lu.se.
- [13] http://www.cyclotronzao.ru/en/products/sources-of-x-ray-and-gamma-radiation-type-irik-d/.
- [14] G. Knoll, Radiation Detection and Measurement. John Wiley and Sons, Inc., USA, 3 ed., 2000.
- [15] http://www.canberra.com.
- [16] http://xdb.lbl.gov.
- [17] E. Babichev et al., SiPM based photon counting detector for scanning digital radiography, JINST 10 (2015) C03002.