How Cox models react to a study-specific confounder in a patient-level pooled dataset: Random-effects better cope with an imbalanced covariate across trials unless baseline hazards differ.
Abstract
Background: Combining patient-level data from clinical trials can connect rare phenomena with clinical endpoints, but statistical techniques applied to a single trial may become problematical when trials are pooled. Estimating the hazard of a binary variable unevenly distributed across trials showcases a common pooled database issue.
Objectives: We studied how an unevenly distributed binary variable can compromise the integrity of fixed and random effects Cox proportional hazards models.
Methods: We compared fixed effect and random effects Cox proportional hazards models on a set of simulated datasets inspired by a 17-trial pooled database of patients presenting with ST-segment elevation myocardial infarction (STEMI) and non-STEMI undergoing percutaneous coronary intervention.
Results: An unevenly distributed covariate can bias hazard ratio estimates, inflate standard errors, raise type I error, and reduce power. While uneveness causes problems for all Cox proportional hazards models, random effects suffer least. Compared to fixed effect models, random effects suffer lower bias and trade inflated type I errors for improved power. Contrasting hazard rates between trials prevent accurate estimates from both fixed and random effects models.
Conclusions: When modeling a covariate unevenly distributed across pooled trials with similar baseline hazard rates, Cox proportional hazards models with a random trial effect more accurately estimate hazard ratios than fixed effects. Differing between-trial baseline hazard rates bias both random and fixed effect models. With an unevenly-distributed covariate and similar baseline hazard rates across trials, a random effects Cox proportional hazards model outperforms a fixed effect model, but cannot overcome contrasting baseline hazard rates.
I Introduction
Pooling data from several clinical trials lo2015sharing ; mello2013preparing ; ross2013ushering can create robust results for endpoints too rare to study within any single trial prospective2002age ; hart2007meta ; cannon2006meta ; sjauw2009systematic ; mamas2012influence ; spaulding2007pooled ; caixeta20095 ; steg2013effect , but studying a covariate unequally distributed across trials (due to differences in eligibility criteria, definitions, or other study-specific factors) could lead to inaccurate conclusions chalmers1991problems ; flather1997strengths ; berman2002meta . Cox proportional hazards (cph) models cox1984analysis associate endpoints with patient characteristics and control between-trial differences through stratification, or by including trial as a fixed or random effect. Stratifying allows the per-trial baseline hazard rates to take any form, while both fixed and random effects models stiffen assumptions about how the hazard rate varies by trial.
Past studies compared the performance of these three types of models andersen1999testing ; localio2001adjustments ; glidden2004modelling by modifying a simulated trial-effect (i.e. differing numbers of trials, more varied trial baseline hazards), but previous studies have not considered modeling a binary covariate with only one level per clinical trial. Studying an imbalanced covariate across pooled clinical trials will answer whether we can glean sensible statistical estimates from clinical trials with varied purposes. We compared stratified, fixed, and random effects Cox proportional hazards model’s ability to estimate an association between a simulated binary covariate unequally distributed across trials and clinical endpoints.
II Methods
II.1 Pooled DES study data
We pooled data from coronary stent trials comparing drug-eluting stents (1st and 2nd generation) to bare-metal stents from to into a single dataset (pooled-DES). This enabled us to study how the patient’s clinical presentation (ST-segment elevation myocardial infarction [STEMI] versus non ST-segment elevation myocardial infarction [NSTEMI]) impacts mortality, myocardial infarction, bleeding, revascularization, and stent thrombosis at years while also adjusting for trial-specific differences in baseline hazard rates.
The majority of trials enrolled NSTEMI patients and only one pooled trial (HORIZONS-AMI) enrolled STEMI patients. This pooled dataset inspired our simulated datasets to capture key characteristics: (i) a single clinical presentation per trial, (ii) trial-specific baseline hazard rates, and (iii) an association between clinical presentation and endpoint.
II.2 Simulated Data
Our simulated trial data considered: (i) within trial assignment to group or , (ii) the number of pooled trials, (iii) variable baseline hazard rates (frailty) between trials, and (iv) a hazard ratio of (to study type I error) and (to study power) between patients assigned to group versus group . We fixed the number of patients studied to , generated simulated datasets, and uniformly divided patients into trials. For each trial , we either assigned all patients to group with probability (unevenness) or all patients to group with probability . Thus, within each trial, group assignment was a constant (either all or all ). Assuming constant hazards , we drew event and censoring times from an exponential distribution
with a event rate at days, and censoring rate at days.
We defined the hazard rates for group and as
where represents the baseline hazard, HR is the assumed hazard ratio between group and and is a trial-specific quantity (one per trial) drawn from a Log-Normal distribution centered at with standard deviation . Our simulated data: (i) varied the number of pooled trials, , from to , (ii) unevenly assigned the proportion of patients among all pooled data to either group or , and (iii) multiplied half of all pooled trials baseline hazard rates by on average (contrasting baseline hazard rates). Unevenly assigning groups per trial and separating baseline hazard rates was done to mimic our pooled trial data and demonstrate how pooling trials can bias the Cox-proportional hazards model.
II.3 Survival Analysis
We estimated hazard ratios from the simulated data using (i) a stratified cph model (cph-S), (ii) a cph model including trial as a fixed effect (cph-F), (iii) a cph model including trial as a Gamma distributed random effect (cph-G), and (iv) a cph model including trial as a Log-Normal distributed random effect (cph-L). Each model manages trial effects differently.
The cph-S model breaks the overall baseline hazard rate into separate trial-specific baseline hazard rates. Given the th patient within the th trial:
describes a trial specific baseline hazard rate and patient specific function that depends on patient ’s set of covariates and population parameters . By separating trials into strata, the cph-S model copes with non-proportional hazards across trials but loses any trial with a single level of the effect of interest.
The cph-F model adjusts for the effect of interest and trial enrollment while assuming patients follow equal hazards through time. Mathematically,
where includes effects for trial and covariates for the patient. The cph-F model infers hazard ratios from all available data, but assumes proportional hazards between trials. Compared to stratified models, it trades non-proportional hazards for less selection bias.
The cph-G and cph-L models suppose differences in hazard rates across trial follow a distribution. Let
where the trial specific effect (randomly drawn from the Gamma or Log-normal distribution) multiplies each patient’s hazards rate. We multiply patient hazards by random draws from to govern patient differences within trial.
Stratifying, adjusting as a fixed effect, and introducing a random effect for trial represent the three most common paradigms to handle pooled trial data.
II.4 Statistical inference
From our 17-trial pooled database, we estimated baseline hazard rate’s posterior probability given follow-up times and events as
considering an exponential model with gamma prior generating the time to event data, and uninformative Gamma prior parameters and .
We related any two variables using linear regression with non-informative priors for the intercept , slope , and variance . Mathematically, we relate two variables and by
and compute posterior probabilities for and assuming a Normally distributed prior probability and assuming a Gamma distributed prior probability for .
We compared statistics between two models by fitting a polynomial and averaging over the number of trials , unevenness , or baseline hazard multiplier as
where represents a linear or quadratic model, and reported the probability any two models differ by more than a relative with respect to , or mathematically,
We also considered absolute differences between two groups ( and ) as
We designated at , at unless stated otherwise, and considered or values significant.
III Results
When studying a trial-specific covariate inspired from real data (Figure 1) with skewed patient assignment across studies and similar baseline hazard rates, random effects models showed less bias, smaller standard error, variable type I error, and increased power over fixed effects models (Figure 2, Figure 3, and Figure 4). Exploring assorted baseline hazard rates across trials, we found both fixed and random effects models suffered (Figure 5). Assigning a single group (all or all ) per trial prevents us from using any model stratified by trial, decreases power and biases fixed models, and random effects models likely traded inflated type I error for stronger hazard ratios and statistical confidence.
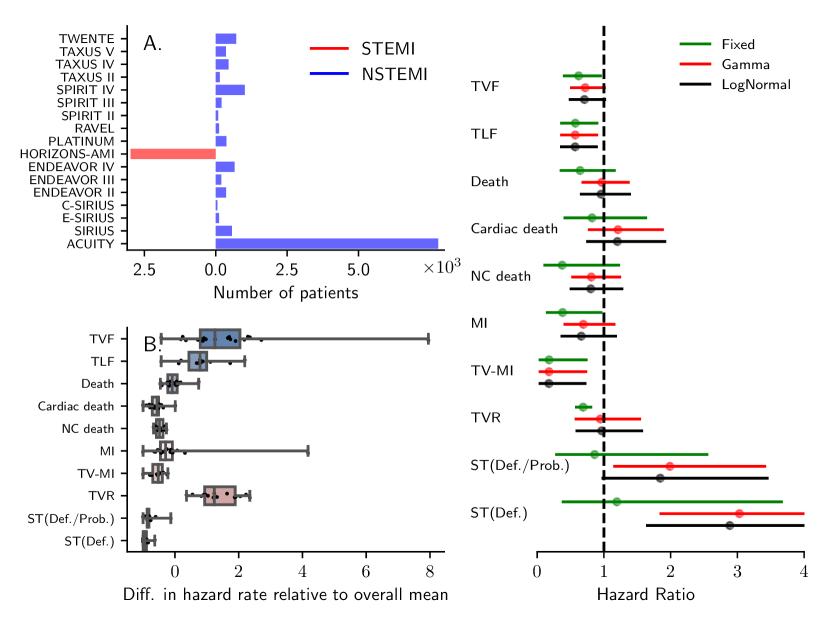
We found a heavy imbalance between STEMI/NSTEMI patients (Figure 1A) and variable baseline hazard rates (Figure 1B) among different clinical endpoints across STEMI/NSTEMI stent trials. This imbalance and variable baseline hazards likely caused disagreement between the fixed and random effects models (Figure 1 Right). Our pooled data set contained one trial studying STEMI patients (HORIZONS-AMI) and trials studying NSTEMI patients. After estimating baseline hazard rates for all endpoints among trials, we found an overall mean equal to and relative trial differences from to times the mean. Studying an imbalanced STEMI/NSTEMI covariate with variable baseline hazards led to large disagreement between fixed and random effect models for: death, cardiac death, non-cardiac death, myocardial infarction, target vessel revascularization, and stent thrombosis. Our simulated data aimed to tease apart why we found these disagreements between models.
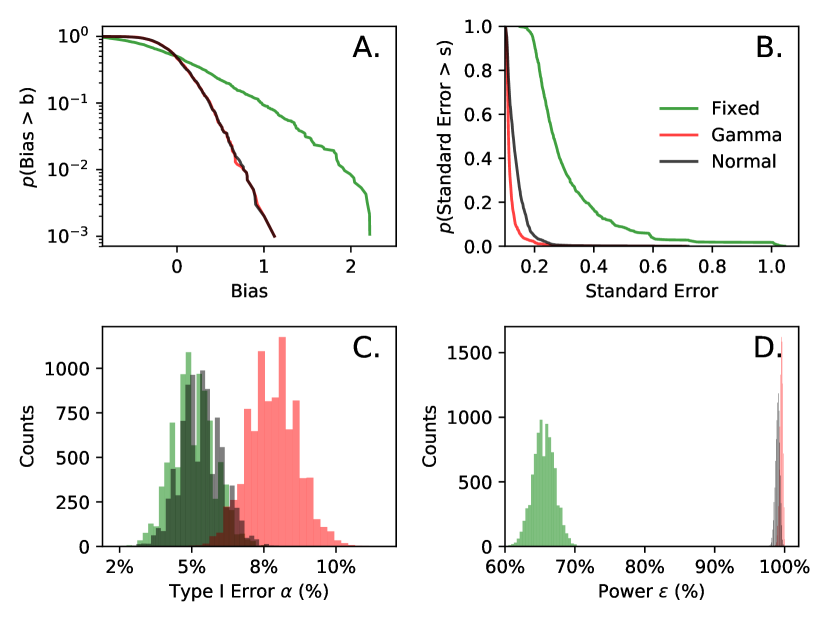
For trials (Figure 2), the fixed effects model biased hazard ratio estimates more (, Figure 2A), had inflated standard errors (, Figure 2B.), comparable type I error (, Figure 2C.), and diminished power (, Figure 1D) compared to random effects models. The gamma versus normal random effects models had comparable bias , smaller standard error (), elevated type I error , and improved power . The bias did not significantly differ between random effects models, but compared to the normal model, the gamma model’s smaller standard error magnified type I error and strengthened power. We uncovered each model’s strengths and weaknesses by studying a static trials. Differing the number of trials and studying the same model properties helped determine how random effects models compare to fixed effects models under more variable baseline hazard rates.
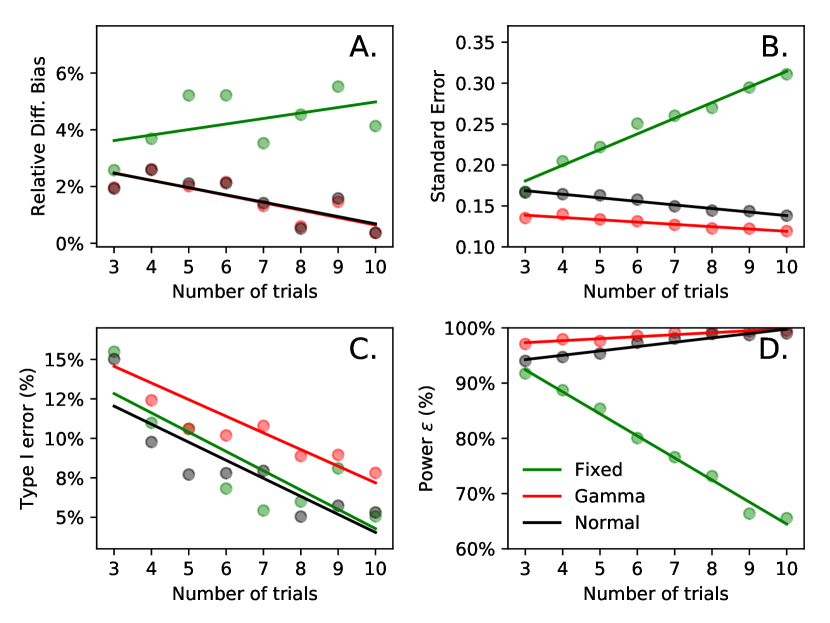
When varying the number of trials (Figure 3) and averaging over simulations, random effects models maintained a lower bias (, Figure 3A.), reduced standard error (, Figure 3B.), variable type I error (, Figure 3C.), and improved power (, Figure 3D.) compared to fixed effect models. The fixed effect model biased hazard ratios more than random effects models and resulted in elevated type I errors, but inflated standard errors robbed the fixed model of power. A similar power/type I error tradeoff persisted between random effects models when varying the number of trials. The gamma model had smaller standard error than the normal model (), more type I error than the normal model (), and similar power to the normal model ().
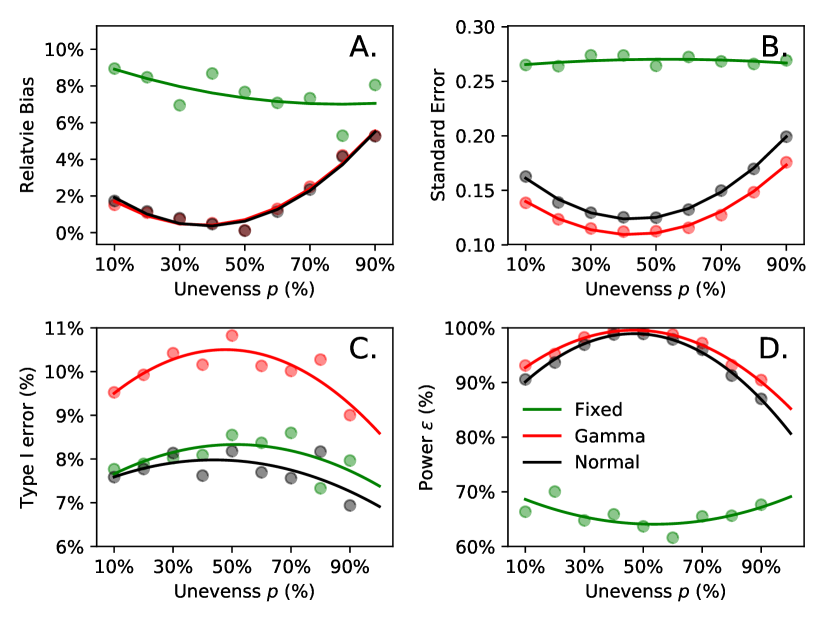
Pooling studies with an unequal ratio of group to (increasing unevenness, Figure 4) heightened bias (, Figure 4A), inflated standard error (, Figure 4B), reduced type I error (, Figure 4C), and reduced power in all models (, Figure 4D) when averaging over simulations. Fixed models biased hazard ratio estimates times more than random effects models (), inflated standard errors times more than random effects models (), and lowered power times more than random effects models (). Compared to fixed models, the normal model shrunk type I error times () but the gamma model raised type I error times (). Random effects models better managed bias, standard error, and power, but inflated type I error compared to fixed models.
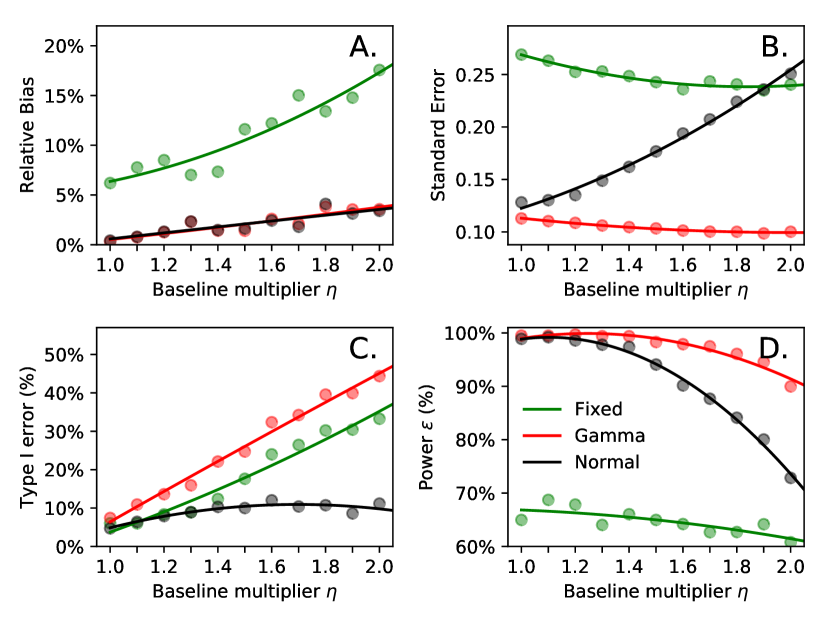
Separating baseline hazards between trials (Figure 5) inflated type I error (, Figure 5C) and weakened power (, Figure 5D) in random effect models after averaging over simulations. Fixed models sustained increasing bias (, Figure 5A) and type I error (, Figure 5C). Fixed models also suffered from large standard error (, Figure 5B) and low power (), but increasing between-trial baseline hazard rates escalated the normal model’s standard error () and decreased power (). Diverse baseline hazards also inflated the gamma model’s type I error (). Contrasting baseline hazard rates between trials damaged random effects models.
Although unevenly distributing patient groups across trials damaged hazard ratio estimates, random effects models stayed unbiased and maintained power compared to stratified and fixed effect models. Disparate baseline hazards damaged random effects models. We saw our simulated results replicated in a -trial dataset; random effects models performed best when confronted with an unevenly distributed covariate.
IV Discussion
Our simulated experiment showed both fixed and random effects models fail when studying a covariate unevenly distribute across trials that have varying baseline hazard rates. We applied fixed and random effect models to a real -trial dataset of STEMI and NSTEMI patients and found worse performance for fixed effect models than random effects models when trials had similar baseline hazard rates. Unlike previous studies that scrutinize cluster variability, this work tests model robustness under a fixed-effect’s imbalance across clusters.
Clinical science strives to better understand scarce disease types, but these scarce disease types and trial diversity will intensify survival rate variability. When we pool clinical data to study rare events, we need to collect comprehensive outcomes data from many trials or resort to more robust models. This increased survival variability may result in contrasting baseline hazard rates.
After comparing fixed effect and random effects models, we found random effects models performed better in bias, standard error, and power, but failed when pooling trials with dissimilar baseline hazards. We speculate the difficulty estimating a single set of parameters for dissimilar baseline hazards causes random effects models to fail. When pooling trials with contrasting baseline hazards, including a covariate that groups trials by baseline hazards may help.
Compared to fixed models, random effects models take better advantage of trial information to reduce hazard ratio estimates’ standard errors. Stratified models estimate treatment effect within each trial, and with only one treatment per trial, have no use. Fixed effect models do take advantage of treatment effect across all trials, but estimating effects for each trial creates a more uncertain treatment-effects hazard ratio. Random effects models isolate treatment assignment (as a fixed effect) from trial effects (as a random effect) and apply additional trial data toward better estimating treatment assignment.
We limited ourselves to studying a binary covariate unevenly distributed across trials, simulating data with constant hazards, and modeling time to event with cph models. A continuous covariate could behave differently than a binary variable under the same conditions. Constant hazards do not occur in typical trials, but cph models ignore baseline hazard rates. Many other models exist to model time to event, such as accelerated failure time models, and may prove more useful than cph. This study’s limitations may inspire more realistic simulated datasets and their effect on the cph model.
We plan to study whether Cox proportional hazards models perform better with a smaller set of trials with covariate balance compared to a larger set of unbalanced trials. We also plan to study continuous variables split across pooled trials and alternative models of time-to-event data within the context of unevenly distributed variables across a pooled database.
In most cases, random effects models stand up to an unevenly distributed binary covariate so long as each trial has similar baseline hazard rates.
Acknowledgments
The authors thank Karl Lherisson and the Cardiovascular Research Foundation’s Information Technology department for computational resources.
Financial disclosure
None reported.
Conflict of interest
The authors declare no potential conflict of interests.
References
- (1) Lo Bernard. Sharing clinical trial data: maximizing benefits, minimizing risk. Jama. 2015;313(8):793–794.
- (2) Mello Michelle M, Francer Jeffrey K, Wilenzick Marc, Teden Patricia, Bierer Barbara E, Barnes Mark. Preparing for responsible sharing of clinical trial data. 2013.
- (3) Ross Joseph S, Krumholz Harlan M. Ushering in a new era of open science through data sharing: the wall must come down. Jama. 2013;309(13):1355–1356.
- (4) Collaboration Prospective Studies, others . Age-specific relevance of usual blood pressure to vascular mortality: a meta-analysis of individual data for one million adults in 61 prospective studies. The Lancet. 2002;360(9349):1903–1913.
- (5) Hart Robert G, Pearce Lesly A, Aguilar Maria I. Meta-analysis: Antithrombotic Therapy to Prevent Stroke in Patients Who Have Nonvalvular Atrial FibrillationAntithrombotic Therapy in Atrial Fibrillation. Annals of internal medicine. 2007;146(12):857–867.
- (6) Cannon Christopher P, Steinberg Benjamin A, Murphy Sabina A, Mega Jessica L, Braunwald Eugene. Meta-analysis of cardiovascular outcomes trials comparing intensive versus moderate statin therapy. Journal of the American College of Cardiology. 2006;48(3):438–445.
- (7) Sjauw Krischan D, Engström Annemarie E, Vis Marije M, et al. A systematic review and meta-analysis of intra-aortic balloon pump therapy in ST-elevation myocardial infarction: should we change the guidelines?. European heart journal. 2009;30(4):459–468.
- (8) Mamas Mamas A, Ratib Karim, Routledge Helen, et al. Influence of access site selection on PCI-related adverse events in patients with STEMI: meta-analysis of randomised controlled trials. Heart. 2012;98(4):303–311.
- (9) Spaulding Christian, Daemen Joost, Boersma Eric, Cutlip Donald E, Serruys Patrick W. A pooled analysis of data comparing sirolimus-eluting stents with bare-metal stents. New England Journal of Medicine. 2007;356(10):989–997.
- (10) Caixeta Adriano, Leon Martin B, Lansky Alexandra J, et al. 5-Year clinical outcomes after sirolimus-eluting stent implantation: insights from a patient-level pooled analysis of 4 randomized trials comparing sirolimus-eluting stents with bare-metal stents. Journal of the American College of Cardiology. 2009;54(10):894–902.
- (11) Steg Philippe Gabriel, Bhatt Deepak L, Hamm Christian W, et al. Effect of cangrelor on periprocedural outcomes in percutaneous coronary interventions: a pooled analysis of patient-level data. The Lancet. 2013;382(9909):1981–1992.
- (12) Chalmers Thomas C. Problems induced by meta-analyses. Statistics in medicine. 1991;10(6):971–980.
- (13) Flather Marcus D, Farkouh Michael E, Pogue Janice M, Yusuf Salim. Strengths and limitations of meta-analysis: larger studies may be more reliable. Controlled clinical trials. 1997;18(6):568–579.
- (14) Berman Nancy G, Parker Robert A. Meta-analysis: neither quick nor easy. BMC medical research methodology. 2002;2(1):10.
- (15) Cox David Roxbee, Oakes David. Analysis of survival data. CRC Press; 1984.
- (16) Andersen Per Kragh, Klein John P, Zhang Mei-Jie. Testing for centre effects in multi-centre survival studies: a Monte Carlo comparison of fixed and random effects tests. Statistics in medicine. 1999;18(12):1489–1500.
- (17) Localio A Russell, Berlin Jesse A, Ten Have Thomas R, Kimmel Stephen E. Adjustments for center in multicenter studies: an overview. Annals of internal medicine. 2001;135(2):112–123.
- (18) Glidden David V, Vittinghoff Eric. Modelling clustered survival data from multicentre clinical trials. Statistics in medicine. 2004;23(3):369–388.