Anisotropy of dark matter velocity distribution
Keiko I. Nagao111nagao@dap.ous.ac.jp 222This report is based on the paper [1].
Okayama University of Science, 1-1 Ridaicho, Kita-ku, Okayama-shi 700-0005 Japan
Abstract
Direct detection of dark matter with directional sensitivity has the potential to discriminate the dark matter velocity distribution. Especially, it will be suitable to discriminate isotropic distribution from anisotropic one. Analyzing data produced with Monte-Carlo simulation, required conditions for the discrimination is estimated. If energy threshold of detector is optimized, event number is required to discriminate the anisotropy.
1 Introduction
The so-called dark matter accounts for about % of the energy density of the Universe. Since it cannot be directly observed, it is supposed to have exceedingly weak interaction with the standard model particles. Weak interacting massive particles (WIMPs) are a promising candidate for dark matter. Several experiments are optimized to direct search for the WIMPs. Directional direct detections of dark matter aims to detect both the recoil energy and direction of the nuclear recoils. The directional detection is expected to improve the background rejection efficiency, and furthermore, to obtain other information of dark matter such as the velocity distribution.
In most of direct searches, the velocity distribution of dark matter is supposed to be isotropic Maxwellian velocity distribution. However, non-Maxwellian distribution had been indicated by some simulations and observations [2-7]. In this study, an anisotropic velocity distribution derived in [4] is adopted;
| (1) |
where is the tangential velocity of dark matter with respect to the galactic rest frame, is a parameter associated with the anisotropy, is normalization factor, and km/s. The radial velocity and velocity across the galactic plane are suggested to be the isotropic Maxwellian distribution.
2 Numerical simulation
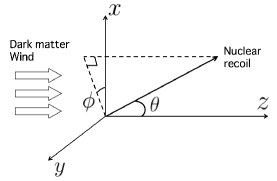
In Figure 1, a nuclear recoil and associated angles in laboratory frame are shown. The Earth receives dark matter wind, and its direction is taken as z-axis. Scattering angle is defined as the angle from z-axis. As a result of Monte-Carlo simulation of dark matter-nucleon scatterings, both the recoil energy and the scattering angle are obtained. Thus, in principle, the energy-angular distribution is available. It is also interesting to take a look at angular histogram, which can be obtained in the case that energy resolution of the detector is not so good.
As a target nucleon, two typical target, fluorine (F) and silver (Ag), are supposed in the simulation. Fluorine is used in gaseous directional detectors, and silver is one of target nucleons in NEWSdm. The strategy is as follows: two kinds of dataset are generated in the Monte-Carlo simulation. One dataset has a large event number, and called as “template data”. Template data is produced depending on the anisotropy parameter , like . , , , . The other dataset, which is called as “pseudo-experimental data”, is supposed to be data obtained in the realistic experiment, and has smaller event number than template data. Questions are which template is most similar to pseudo-experimental data, and how much event number is required to estimate it. Energy-angular distributions for template data and pseudo-experimental data are produced, and their similarity is tested by chi-squared test in Subsection 2.1. In the chi-squared test, - plane is divided into small bins, and event numbers in each bin. Corresponding chi-squared test for angular histograms is shown in Subsection 2.2. For both the energy-angular distribution and angular histogram, mass relation between WIMP mass and target nucleon is supposed to be for similicity. Also energy threshold of the detector is supposed to be keV for target F, and keV for target Ag.
2.1 Energy-angular distribution
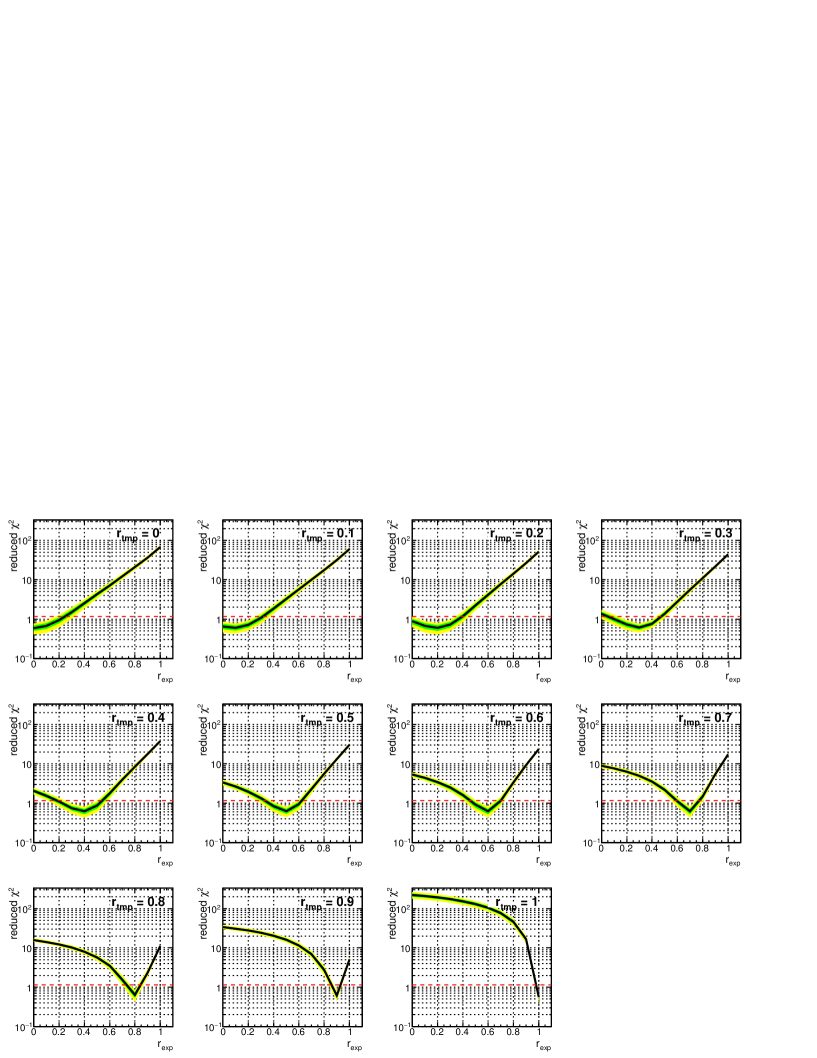
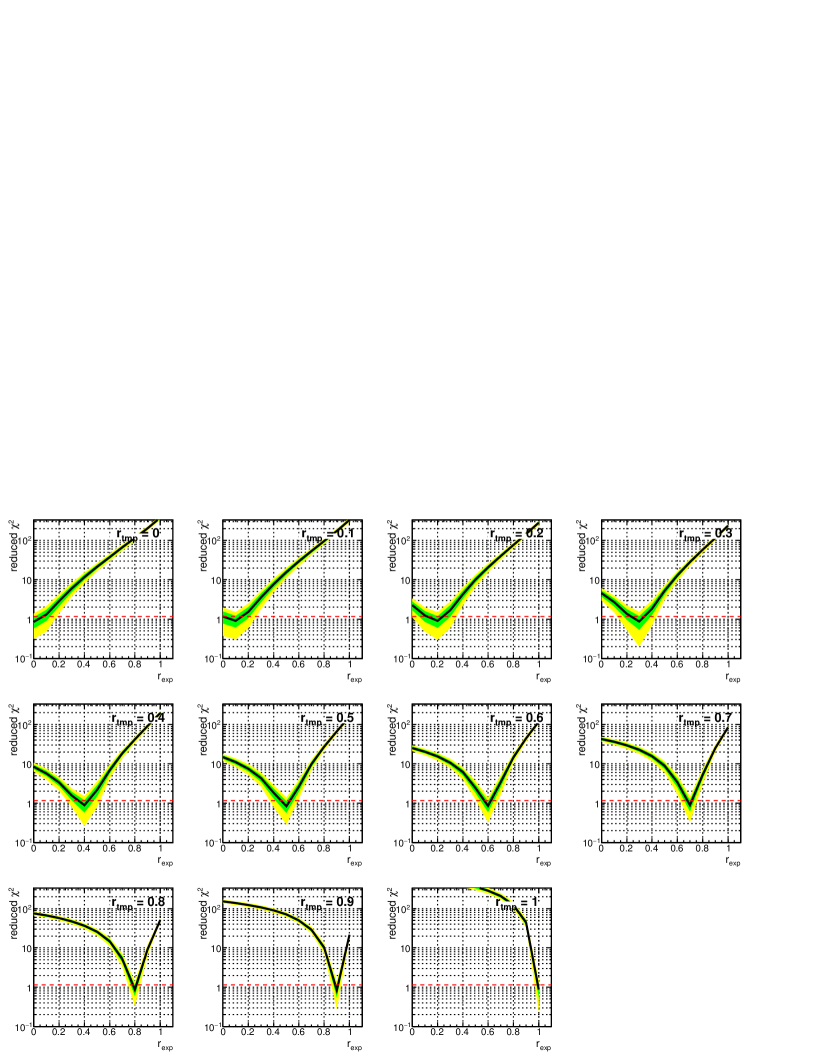
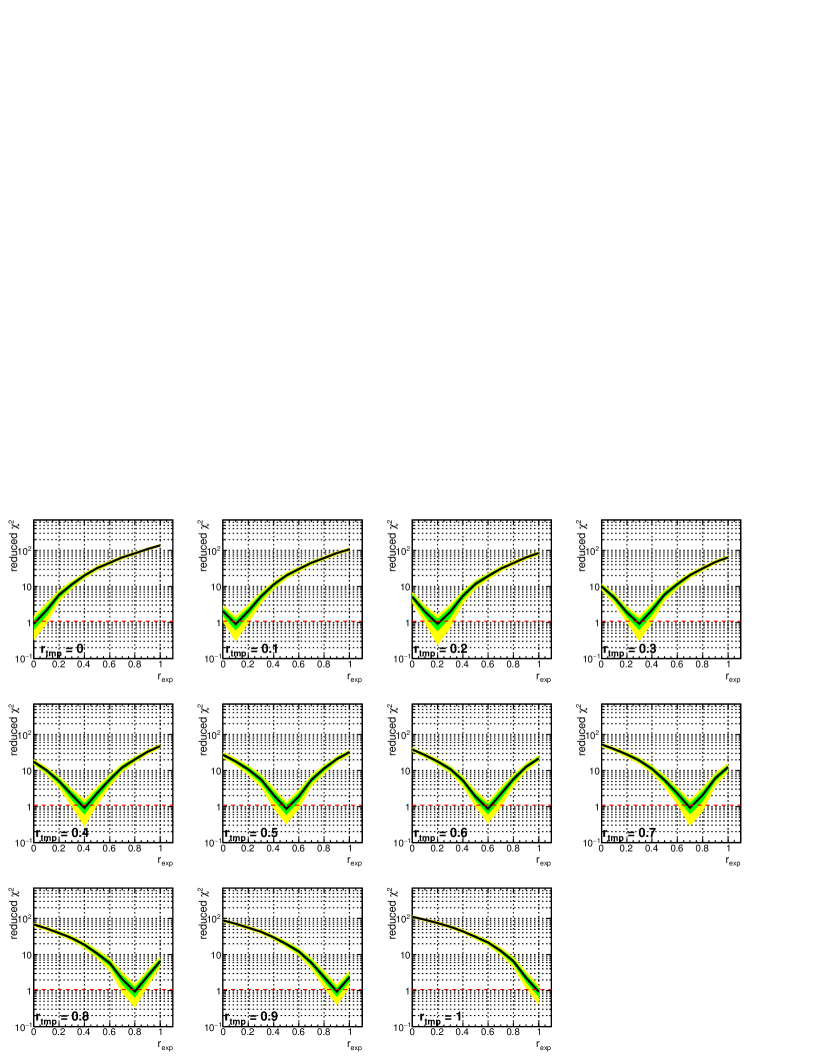
In Figure 2 and 3, results of chi-squared test between template data with particular and pseudo-experimental data for F and Ag are shown, respectively. Red dashed line represents 90 % confidence level (CL). In the figures, if anisotropic case suggested by N-body simulation is realized, completely isotropic case () is rejected with (for F) and (for Ag) event numbers of the pseudo-experiment. The required event number depends on the energy threshold. Supposed energy thresholds are optimized to reduce the required event numbers of pseudo-experimental data.
2.2 Angular histogram
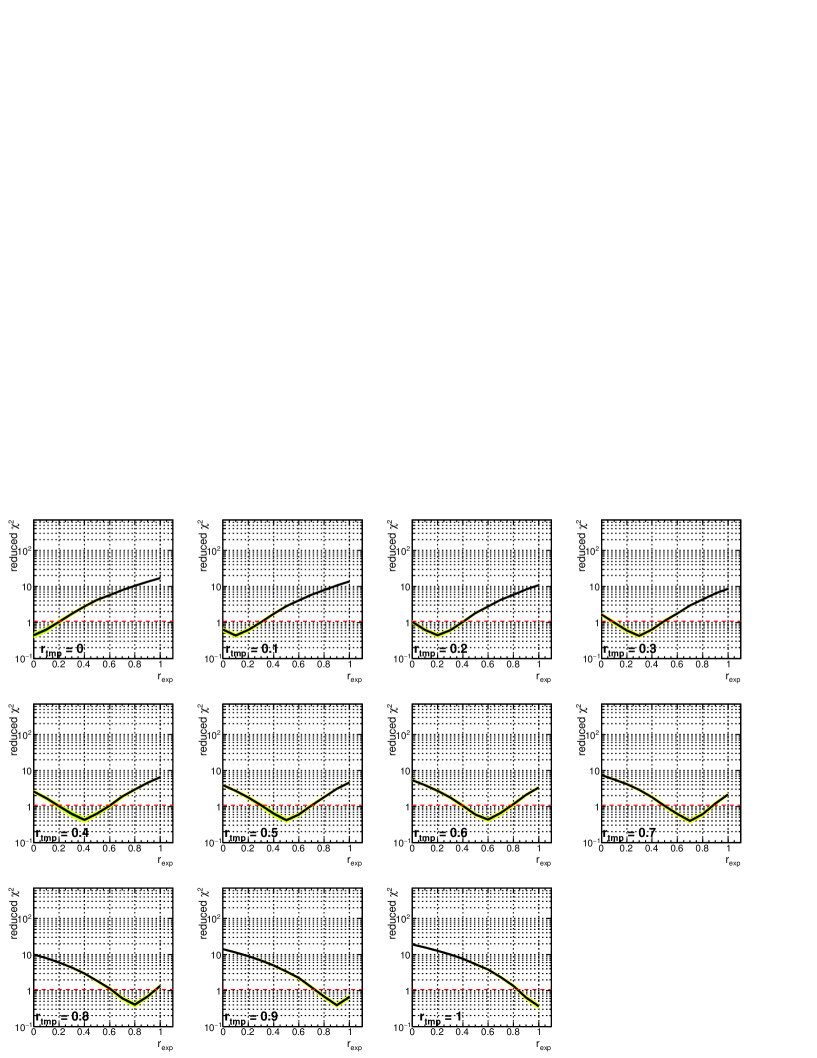
Angular histogram is another candidate to analyze events in the directional detector. In Figure 4 and 5, chi-squared test of angular histogram for target F and Ag are shown, respectively. Red dashed line corresponds to at the 90% CL. If anisotropic case () is realized, completely isotropic case () can be rejected at the 90% CL with (for F) and (for Ag) event number. Since event number per a bin of energy-angular distribution is smaller than that of angular histogram, required event number is reduced compared to the energy-angular distribution.
3 Conclusion
Possibility to discriminate the anisotropy of dark matter velocity distribution using directional detector is investigated. Depending on resolution of the detector, the energy-angular distribution and angular histogram can be analyzed. For energy-angular distribution case, event number is required, while for angular histogram case is required. It depends on the energy threshold of the detector which is determined by dark matter mass.
References
- [1] K. I. Nagao, R. Yakabe, T. Naka and K. Miuchi, arXiv:1707.05523 [hep-ph].
- [2] J. I. Read, G. Lake, O. Agertz and V. P. Debattista, Mon. Not. Roy. Astron. Soc. 389, 1041 (2008) doi:10.1111/j.1365-2966.2008.13643.x.
- [3] J. I. Read, L. Mayer, A. M. Brooks, F. Governato and G. Lake, Mon. Not. Roy. Astron. Soc. 397, 44 (2009) doi:10.1111/j.1365-2966.2009.14757.x.
- [4] F. S. Ling, E. Nezri, E. Athanassoula and R. Teyssier, JCAP 1002, 012 (2010).
- [5] M. Maciejewski, M. Vogelsberger, S. D. M. White and V. Springel, Mon. Not. Roy. Astron. Soc. 415, 2475 (2011) doi:10.1111/j.1365-2966.2011.18871.x.
- [6] M. Lisanti and D. N. Spergel, Phys. Dark Univ. 1, 155 (2012) doi:10.1016/j.dark.2012.10.007.
- [7] M. Kuhlen, M. Lisanti and D. N. Spergel, Phys. Rev. D 86, 063505 (2012) doi:10.1103/PhysRevD.86.063505.