Logic and connectivity jointly determine criticality in biological gene regulatory networks
Abstract
The complex dynamics of gene expression in living cells can be well-approximated using Boolean networks. The average sensitivity is a natural measure of stability in these systems: values below one indicate typically stable dynamics associated with an ordered phase, whereas values above one indicate chaotic dynamics. This yields a theoretically motivated adaptive advantage to being near the critical value of one, at the boundary between order and chaos. Here, we measure average sensitivity for 66 publicly available Boolean network models describing the function of gene regulatory circuits across diverse living processes. We find the average sensitivity values for these networks are clustered around unity, indicating they are near critical. In many types of random networks, mean connectivity and the average activity bias of the logic functions have been found to be the most important network properties in determining average sensitivity, and by extension a network’s criticality. Surprisingly, many of these gene regulatory networks achieve the near-critical state with and far from that predicted for critical systems: randomized networks sharing the local causal structure and local logic of biological networks better reproduce their critical behavior than controlling for macroscale properties such as and alone. This suggests the local properties of genes interacting within regulatory networks are selected to collectively be near-critical, and this non-local property of gene regulatory network dynamics cannot be predicted using the density of interactions alone.
One of the most widely discussed, and oft debated, aspects of the physics of life is the role of criticality adami1995self ; munoz2017colloquium ; krotov2014morphogenesis ; hidalgo2014information ; roli2018dynamical ; bak2013nature . Criticality, or tuning to a point of marginal stability, is hypothesized to drive both the robustness and evolvability of living processes Lan90 ; Kau93 . Systems that are far from criticality are argued to be less adaptive, either being too stable to be responsive in the ordered phase, or being too unstable to maintain memory in the chaotic phase. Many biological systems are now known to be poised in between these regimes, with proximity to criticality reported across a variety of biological systems with very different functions, such as neural firing, animal motion and social behavior, and gene regulation DanKraFla17 ; beggs2008criticality ; HalBeg05 ; mora2011biological ; munoz2017colloquium ; sole1999criticality ; bialek2014social . Despite the apparent ubiquity of criticality across many distinct living processes, precisely how the local properties of biological networks generate macroscale behavior that is collectively critical is not yet explained.
Boolean networks are widely implemented dynamical systems for inferring the existence of critical behavior in biological systems. In particular, the complex regulatory interactions describing the dynamics of genes essential to cellular function are well-approximated by Boolean models karlebach2008modelling ; wang2012boolean ; albert2008boolean ; helikar2012cell ; helikar2013cell ; helikar2009chemchains ; bornholdt2008boolean . Physiological parameters such as reaction rates are coarse-grained in Boolean models, meaning one does not need to know specific values that are in many cases intractable to experimentally measure. By reducing the number of fine-tuned parameters Boolean models are much simpler to build and simulate, yet they nonetheless capture many important dynamical features of real biological systems associated with their function davidich2008transition . Boolean gene regulatory network models have also successfully predicted cellular behavior including the robustness of the cell-cycle, cell differentiation processes, and cellular response to DNA damageli2004yeast ; davidich2008boolean ; huang2005cell ; choi2012attractor .
Evidence biological gene regulatory networks operate near criticality has been so far limited to a handful of experimental examples, but these are increasing in frequency. The effects of experimental perturbations of single genes in S. Cerevisiae SerVilSem04 ; SerVilGra07 , the dynamics of gene expression in the macrophage NykPriAld08 , and a handful of networks with experimentally-derived network topology balleza2008critical ; ChoLloSmo10 have been shown to be consistent with near-criticality. These experimental cases provide isolated examples that do suggest criticality plays an important role in some gene networks. However, it is currently unknown how widespread criticality is across diverse gene regulatory networks with different structure and function. Addressing this question requires a systematic survey of different gene regulatory networks, as we provide here.
Before presenting our results, it is important to emphasize that observations of criticality in real systems have so far been primarily motivated by the theory of random Boolean networks (e.g. MorAma05 ; RamKesYli06 ; GouTeuGul12 ). By constructing ensembles of random networks with fixed average in-degree and average activity bias , one can readily determine thresholds for criticality as a function of and for the ensemble. The results indicate connectivity and the mean bias of Boolean logic functions both play a role in determining critical behavior. However, while the ensemble of random networks in these theoretical studies subsumes those we expect to exhibit biological function, the ensemble is not exclusive to living examples. Whether or not and , as statistical characterizations of connectivity and logic, are specific enough to explain criticality in networks with biological function therefore remains to be tested.
The recent proliferation of Boolean network models for functioning gene circuits now permits the possibility to directly address the drivers of criticality in real biological networks. In the current study, 66 Boolean models were obtained from the Cell Collective database cellcollective . The networks represent biological processes including virus and cell cycles, cell differentiation, cell plasticity, cell apoptosis, cell migration, and signalling pathways, among other gene regulatory functions. These genetic circuits encapsulate a wide range of fundamental biological processes across humans, animals, plants, bacteria and viruses, and range in size from 5 nodes to 321 nodes.
To infer criticality in these networks, we use a measure of average sensitivity ShmKau04 . We define the average sensitivity as in Ref. ShmKau04 , starting with the Boolean derivative that measures the number of inputs for which flipping a bit at timestep changes the value of the output at timestep , then averaging over nodes and over all possible input states . Defining the discrete dynamics as ,
| (1) |
Here represents the sensitivity of node to changing node when starting in state LuqSol00 :
| (2) |
with representing the logical negation of . Defined in this way, the average sensitivity is the expected number of nodes changed at the next timestep given a perturbation that flips the state of one node at the current timestep. It is equivalently equal to the average Hamming distance between the perturbed and unperturbed state at time when a random bit is flipped at time (see Supplemental Material).
The average sensitivity was defined in Ref. ShmKau04 to be an indicator of the critical transition in random Boolean networks from an ordered to a chaotic phase. In an infinite ergodic system, this transition happens at VilCamDam16 111Finite size effects cause to correspond to a slightly sub-critical regime.. In the ordered phase, bit-flip perturbations have effects that become smaller over time, while in the chaotic phase these changes grow in time and spread to affect most of the network LuqSol00 . The original results exploring this damage-spreading transition DerPom86 ; LuqSol00 make this connection analytically under two assumptions: (1) As in other spreading processes DanKraFla17 , this critical transition happens when the local measure of spreading (here, the average sensitivity) is equal to 1 only in the limit of , where finite-size effects of saturation are not important, and with the assumption of ergodicity VilCamDam16 ; (2) the dynamics were assumed to be synchronous, with all nodes updated at each timestep. We note that a large fraction of the models we test were not designed to be used with synchronous updating. Yet even in the asynchronous case, we expect to correspond to the damage spreading critical transition as . In this limit and as , regardless of the specifics of how nodes are updated, we can treat the damage spreading as a simple branching process with branching ratio equal to the average sensitivity . Thus we expect that networks run asynchronously will have similar bulk behavior to those run synchronously, with a critical transition at in the infinite limit.
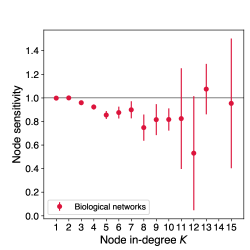
We find biological networks have stricter conditions on their causal structure and logic necessary to explain their criticality than merely constraining average properties such as and . In particular, our results demonstrate biological networks are atypical within the ensemble of random networks with fixed and in three ways: the Boolean functions in each biological network typically (1) display covariance in and , in that functions with larger in-degree tend to have smaller ; (2) depend on all inputs (making connectivity coincide with causal structure); and (3) are mostly canalizing. Each of these constraints significantly affects the sensitivity, yet we nonetheless find that all biological networks we measure have sensitivity near one (Figure 1). Our results indicate living networks are more distinguished by their criticality than other network properties such as the degree distribution, edge density, or fraction of activating conditions.
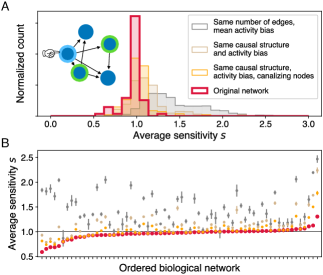
To determine the properties of gene regulatory networks most important for achieving their near-critical state, we compare analysis of the sensitivity of the biological networks to the same analysis performed on three different ensembles of random networks. The random ensembles used in this study were designed to to successively isolate the properties of the real gene regulatory networks that drive their criticality, and are therefore constructed with reference to each of the 66 biological models (such that there are 66 different random ensembles, one for each gene regulatory network model, for each random network variant tested; see Figure 1B). In previous work, most ensembles of random Boolean networks have been defined such that the probability of a given node to be activated by a given condition, the activity bias , is equal for all nodes. The average sensitivity can be calculated for each node separately (such that ), and it is known that, when calculating sensitivity for each Boolean function with inputs and activity bias , , where the average is taken over possible Boolean functions ShmKau04 . When naively assuming , or more generally when is not correlated with , the average sensitivity for the network is simple:
| (3) |
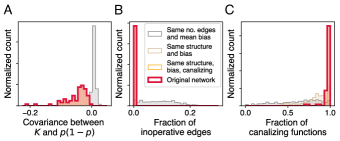
where each average is taken over nodes . But as shown in Figure 2A we find that most networks in our database display anti-correlation between and , meaning that a more accurate estimate of the average sensitivity for real genetic circuits would require knowledge of the magnitude of this covariance:
| (4) |
where is the covariance over nodes between and . Random networks that conserve and but do not conserve the network structure (gray color in Figure 1) corresponding to networks with the same global structure (same number of edges and mean activity bias) should therefore be expected to have very different than the biological networks, as we indeed observe.
We can conclude random networks conserving the global structure and logic of biological networks (e.g. same and ) do not reproduce the critical behavior of real gene regulatory networks. We therefore next constructed random network ensembles that control for the local causal and logical properties of biological networks, not just their global ones. Specifically, we note network structure encapsulates the causal interactions of each node defined by its number of inputs and outputs. To test the role of this structure in driving critical behavior, we constructed a random ensemble of Boolean networks that conserves the local causal structure of each node, changing only the specific Boolean functions implemented by each node. That is, we constructed random networks keeping the same causal inputs and outputs and the same activity bias for each node, but with randomized Boolean logic functions (labeled as “same causal structure and activity bias”). This ensemble explicitly retains the covariance between and . It also retains the fact that all connected inputs in the biological models are “operative” in the sense that there is at least one state for which the output value of the node depends on each input; this is not necessarily true in randomized networks (Figure 2B). We find even this very restricted ensemble (tan color in Figure 1) is often distinctly more chaotic than the original biological networks. This is due to a third way the random ensembles are distinct from biology: Biological regulatory networks are hypothesized to display an overabundance of functions that are canalizing HarSawWue97 ; HarSawWue02 ; KauPetSam04 , meaning that these functions have at least one input that can be fixed to a value that forces the output to a specific value regardless of the other inputs. We find that the biological networks indeed overwhelmingly consist of canalizing functions (Figure 2C). As has been argued before HarSawWue02 ; KauPetSam03 ; KauPetSam04 ; RamKesYli05 ; CorGatWan18 , canalizing functions tend to have smaller sensitivity, meaning that random ensembles that do not take this into account will appear more chaotic than those that sample from canalizing functions. We test the role of canalizing functions in driving criticality by constructing a third ensemble of random networks, which control for causal structure, activity bias, and canalizing nodes (yellow color in Figure 1). This ensemble most closely matches the criticality observed in the biological networks of the ensembles tested.
In sum, we find that knowing only mean properties of biological networks (mean in-degree and activity bias ) is not enough to predict criticality. Nor is knowing the exact network structure. We must additionally include Boolean functions that depend on all their inputs and tend to be canalizing in order to model gene circuits with biological function.
Our results confirm an average sensitivity close to the critical value of one is sufficient to distinguish biological gene regulatory networks from random networks with similar global structure and logic. This suggests the most distinguishing features of biological networks are not their global connectivity patterns, such as degree distribution or edge density, or even the average bias of their logic operations. Instead criticality in gene regulatory networks is explained in terms of their local causal and logical structure, quantified in terms of the covariance of and and a much higher frequency of canalizing functions in their implemented logic than naive models would predict. While critical sensitivity is a collective property of the interactions of many components, we find its explanation in gene regulatory networks relies on constraining the local causal and logical structure of individual nodes. This suggests that evolution is optimizing the macroscale behavior of gene regulatory networks, as quantified by their criticality, by tuning the microscale interactions of individual genes.
Better understanding the relationship between and for critical biological networks should inform evolutionary models and provide testable criteria for assessing criticality of gene regulatory networks in the lab. For example, in order for a genetic circuit to be critical, our results indicate genes that are regulated by many others must remain largely insensitive to many of their inputs. Our results confirm that neither network structure nor logic alone can predict the behavior of biological networks, and that knowing both is necessary to understand their behavior. In this sense, criticality in biological networks, which captures something of their collective properties, can be considered as an emergent property of logic and causal structure taken together. This has implications for our understanding of the physics of living processes where the connection between information processing (aggregate logic) and causation (aggregate connectivity) has yet to be fully explicated.
This project/publication was made possible through support of a grant from Templeton World Charity Foundation. The opinions expressed in this publication are those of the author(s) and do not necessarily reflect the views of Templeton World Charity Foundation.
References
- [1] Christoph Adami. Self-organized criticality in living systems. Physics Letters A, 203(1):29–32, 1995.
- [2] Miguel A Muñoz. Colloquium: Criticality and dynamical scaling in living systems. arXiv preprint arXiv:1712.04499, 2017.
- [3] Dmitry Krotov, Julien O Dubuis, Thomas Gregor, and William Bialek. Morphogenesis at criticality. Proceedings of the National Academy of Sciences, 111(10):3683–3688, 2014.
- [4] Jorge Hidalgo, Jacopo Grilli, Samir Suweis, Miguel A Muñoz, Jayanth R Banavar, and Amos Maritan. Information-based fitness and the emergence of criticality in living systems. Proceedings of the National Academy of Sciences, 111(28):10095–10100, 2014.
- [5] Andrea Roli, Marco Villani, Alessandro Filisetti, and Roberto Serra. Dynamical criticality: overview and open questions. Journal of Systems Science and Complexity, 31(3):647–663, 2018.
- [6] Per Bak. How nature works: the science of self-organized criticality. Springer Science & Business Media, 2013.
- [7] CG Langton. Computation at the edge of chaos: phase transitions and emergent computation. Physica D: Nonlinear Phenomena, 42:12–37, 1990.
- [8] Stuart A. Kauffman. The Origins of Order: Self-organization and Selection in Evolution. Oxford University Press, 1993.
- [9] Bryan C. Daniels, David C. Krakauer, and Jessica C. Flack. Control of finite critical behaviour in a small-scale social system. Nature Communications, 8:14301, 2017.
- [10] John M Beggs. The criticality hypothesis: how local cortical networks might optimize information processing. Philosophical Transactions of the Royal Society of London A: Mathematical, Physical and Engineering Sciences, 366(1864):329–343, 2008.
- [11] Clayton Haldeman and John Beggs. Critical Branching Captures Activity in Living Neural Networks and Maximizes the Number of Metastable States. Physical Review Letters, 94(5):058101, feb 2005.
- [12] Thierry Mora and William Bialek. Are biological systems poised at criticality? Journal of Statistical Physics, 144(2):268–302, 2011.
- [13] Ricard V Solé, Susanna C Manrubia, Michael Benton, Stuart Kauffman, and Per Bak. Criticality and scaling in evolutionary ecology. Trends in Ecology & Evolution, 14(4):156–160, 1999.
- [14] William Bialek, Andrea Cavagna, Irene Giardina, Thierry Mora, Oliver Pohl, Edmondo Silvestri, Massimiliano Viale, and Aleksandra M Walczak. Social interactions dominate speed control in poising natural flocks near criticality. Proceedings of the National Academy of Sciences, 111(20):7212–7217, 2014.
- [15] Guy Karlebach and Ron Shamir. Modelling and analysis of gene regulatory networks. Nature Reviews Molecular Cell Biology, 9(10):770, 2008.
- [16] Rui-Sheng Wang, Assieh Saadatpour, and Reka Albert. Boolean modeling in systems biology: an overview of methodology and applications. Physical biology, 9(5):055001, 2012.
- [17] István Albert, Juilee Thakar, Song Li, Ranran Zhang, and Réka Albert. Boolean network simulations for life scientists. Source code for biology and medicine, 3(1):16, 2008.
- [18] Tomáš Helikar, Bryan Kowal, Sean McClenathan, Mitchell Bruckner, Thaine Rowley, Alex Madrahimov, Ben Wicks, Manish Shrestha, Kahani Limbu, and Jim A Rogers. The cell collective: toward an open and collaborative approach to systems biology. BMC systems biology, 6(1):96, 2012.
- [19] Tomáš Helikar, B Kowal, and JA Rogers. A cell simulator platform: the cell collective. Clinical Pharmacology & Therapeutics, 93(5):393–395, 2013.
- [20] Tomáš Helikar and Jim A Rogers. Chemchains: a platform for simulation and analysis of biochemical networks aimed to laboratory scientists. BMC systems biology, 3(1):58, 2009.
- [21] Stefan Bornholdt. Boolean network models of cellular regulation: prospects and limitations. Journal of the Royal Society Interface, 5(Suppl 1):S85–S94, 2008.
- [22] Maria Davidich and Stefan Bornholdt. The transition from differential equations to boolean networks: a case study in simplifying a regulatory network model. Journal of Theoretical Biology, 255(3):269–277, 2008.
- [23] Fangting Li, Tao Long, Ying Lu, Qi Ouyang, and Chao Tang. The yeast cell-cycle network is robustly designed. Proceedings of the National Academy of Sciences of the United States of America, 101(14):4781–4786, 2004.
- [24] Maria I Davidich and Stefan Bornholdt. Boolean network model predicts cell cycle sequence of fission yeast. PloS one, 3(2):e1672, 2008.
- [25] Sui Huang, Gabriel Eichler, Yaneer Bar-Yam, and Donald E Ingber. Cell fates as high-dimensional attractor states of a complex gene regulatory network. Physical review letters, 94(12):128701, 2005.
- [26] Minsoo Choi, Jue Shi, Sung Hoon Jung, Xi Chen, and Kwang-Hyun Cho. Attractor landscape analysis reveals feedback loops in the p53 network that control the cellular response to dna damage. Sci. Signal., 5(251):ra83–ra83, 2012.
- [27] R. Serra, M. Villani, and A. Semeria. Genetic network models and statistical properties of gene expression data in knock-out experiments. Journal of Theoretical Biology, 227(1):149–157, 2004.
- [28] R. Serra, M. Villani, A. Graudenzi, and S. A. Kauffman. Why a simple model of genetic regulatory networks describes the distribution of avalanches in gene expression data. Journal of Theoretical Biology, 246(3):449–460, 2007.
- [29] Matti Nykter, Nathan D Price, Maximino Aldana, Stephen a Ramsey, Stuart a Kauffman, Leroy E Hood, Olli Yli-Harja, and Ilya Shmulevich. Gene expression dynamics in the macrophage exhibit criticality. Proceedings of the National Academy of Sciences of the United States of America, 105(6):1897–900, feb 2008.
- [30] Enrique Balleza, Elena R Alvarez-Buylla, Alvaro Chaos, Stuart Kauffman, Ilya Shmulevich, and Maximino Aldana. Critical dynamics in genetic regulatory networks: examples from four kingdoms. PLoS One, 3(6):e2456, 2008.
- [31] Sharif Chowdhury, Jason Lloyd-Price, Olli-Pekka Smolander, Wayne C V Baici, Timothy R Hughes, Olli Yli-Harja, Gordon Chua, and Andre S Ribeiro. Information propagation within the Genetic Network of Saccharomyces cerevisiae. BMC systems biology, 4(1):143, 2010.
- [32] André Auto Moreira and Luís A.Nunes Amaral. Canalizing Kauffman networks: Nonergodicity and its effect on their critical behavior. Physical Review Letters, 94(21):3–6, 2005.
- [33] P. Rämö, J. Kesseli, and O. Yli-Harja. Perturbation avalanches and criticality in gene regulatory networks. Journal of Theoretical Biology, 242(1):164–170, 2006.
- [34] Alireza Goudarzi, Christof Teuscher, Natali Gulbahce, and Thimo Rohlf. Emergent Criticality through Adaptive Information Processing in Boolean Networks. Physical Review Letters, 108(12):1–5, mar 2012.
- [35] The cell collective. https://cellcollective.org, 2018. Accessed: 2018-04-09.
- [36] Ilya Shmulevich and Stuart A. Kauffman. Activities and sensitivities in Boolean network models. Physical Review Letters, 93(4):048701–1, 2004.
- [37] Bartolo Luque and Ricard V. Solé. Lyapunov exponents in random Boolean networks. Physica A: Statistical Mechanics and its Applications, 284(1):33–45, 2000.
- [38] Marco Villani, Davide Campioli, Chiara Damiani, Andrea Roli, Alessandro Filisetti, and Roberto Serra. Dynamical regimes in non-ergodic random Boolean networks. Natural Computing, 16(2):353–363, 2016.
- [39] Finite size effects cause to correspond to a slightly sub-critical regime.
- [40] B Derrida and Y Pommeau. Random networks of automata: a simplified annealed approximation. Europhysics Letters, 1:45–49, 1986.
- [41] Stephen E. Harris, Bruce Sawhill, Andrew Wuensche, and Stuart Kauffman. Biased eukaryotic gene regulation rules suggest genome behavior is near edge of chaos. In Phase Transitions in Logic Networks. 06 1997.
- [42] Stephen E. Harris, Bruce K. Sawhill, Andrew Wuensche, and Stuart Kauffman. A model of transcriptional regulatory networks based on biases in the observed regulation rules. Complexity, 7(4):23–40, 2002.
- [43] S. Kauffman, C. Peterson, B. Samuelsson, and C. Troein. Genetic networks with canalyzing Boolean rules are always stable. Proceedings of the National Academy of Sciences, 101(49):17102–17107, 2004.
- [44] Stuart Kauffman, Carsten Peterson, Bjorn Samuelsson, and Carl Troein. Random Boolean network models and the yeast transcriptional network. Proceedings of the National Academy of Sciences, 100(25):14796–14799, 2003.
- [45] Pauli Rämö, Juha Kesseli, and Olli Yli-Harja. Stability of functions in Boolean models of gene regulatory networks. Chaos, 15(3), 2005.
- [46] Rion Brattig Correia, Alexander J Gates, Xuan Wang, and Luis M. Rocha. CANA : A python package for quantifying control and canalization in Boolean Networks. arXiv:1803.04774, pages 1–13, 2018.
- [47] Neet: Analysis of dynamical network models. https://github.com/elife-asu/neet, 2018. Accessed: 2018-04-26, Rev: 5a45a92.
- [48] This is a stronger constraint than simply graph isomorphism.
Supplemental information
Computational methods
All analysis used for this work was carried out using a custom python package, Neet [47], developed at Arizona State University. Neet implements a collection of dynamical network types, a suite of network analyses including average sensitivity, and the randomization techniques described below.
Network Randomization
We generated ensembles of random networks for each biological network by varying the base network subject to specific constraints. Each constraint restricted the space of admissible Boolean networks, and the networks were selected with uniform probability over these subspaces. All of the ensembles were constructed by first constraining some aspect of the biological network’s topology and allowing all others to vary. For this study, we considered two topological constraints: fixed mean degree and fixed causal structure. The fixed mean degree ensemble ensures only that each random network has the same number of total edges as the biological network, but otherwise the properties of individual nodes are not conserved. Random networks maintaining a fixed causal structure are topologically identical 222This is a stronger constraint than simply graph isomorphism. to the reference biological network and therefore share global properties such as mean degree, but also the local connectivity of each node, with the biological network.
One subtlety to our approach is that, regardless of which topological randomization we considered, external nodes were always conserved. In this work, an external node is defined as any node in the original, biological network that has no incoming connections. These nodes typically represent environmental parameters such as temperature, pH or other chemical compounds that are not influenced by the network. As we wish to preserve the special roles of the external nodes, we forbid any incoming edges to these nodes when rewiring the networks during randomization, and do not include them when calculating the average sensitivity or the metrics in Figure 2.
Once the topology of the network was constructed, a Boolean function was randomly, though not uniformly, selected for each node consistent with the topology of the network. For a node with in-degree , we select a function by generating Boolean values, one for each possible input to the function, with a bias toward activating conditions, so that a total of Boolean values activate the node. In cases where is not an integer, its floor and its ceiling are randomly selected according to their closeness to , with probabilities and respectively. We considered two methods of selecting the bias for each node: (1) When fixing the mean activity bias, we use the average bias over nodes in the biological network as the bias for each of the random network’s nodes. (2) When fixing activity bias at the node level, each node in the random network retains the bias of the associated node in the biological network.
It has been noted in previous work [44] that generating Boolean functions that are compatible with a given network topology can result in inoperative edges. An inoperative edge is one in which the source bears no logic influence to the target. These inoperative edges are readily created when selecting truth tables uniformly at random, particularly when the in-degree of the function is small. When attempting to randomly select a truth table for a Boolean function with two inputs, i.e. a node with in-degree two, there is a 37.5% chance that at least one of the inputs will have no effect on the output of the function, e.g. Table 1. When we do not explicitly disallow inoperative edges, we find significant mismatches between the desired topological structure and the structure generated by the constructed Boolean functions (Figure 2B). In our randomization methods that constrain the causal structure, we disallowed inoperative edges.
| X | Y | Z |
|---|---|---|
| 0 | 0 | 1 |
| 1 | 0 | 1 |
| 0 | 1 | 0 |
| 1 | 1 | 0 |
Our final consideration was that of canalizing functions. An input variable into a function with inputs is called canalizing if there exists at least one value of the variable which fixes the output of the function. In other words, the function produces the same value regardless of the value of the other variables. A function is called canalizing if it has at least one canalizing input variable. We observe that the biological networks exhibit significant proportions of canalizing functions, Figure 2(C). In addition to all of the above constraints on our network ensembles, we also construct ensembles which preserve the canalizing nodes of the original biological network. Particularly, if a node in the original biological network has a canalizing function, the associated node in the randomized network is also canalizing though not necessarily with the same canalizing Boolean function.
Cell Collective networks
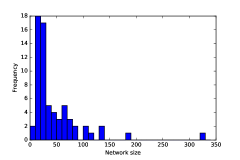
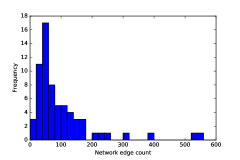
Boolean models were obtained from the Cell Collective database [35] as logical expression and truth tables. The Cell Collective is an online platform to build, analyze, and share biological network models [18]. While the Cell Collective provides tools to visualize and simulate dynamic biological networks, we use it only as a database of Boolean models. The biological processes represented include (but are not limited to) organism immune responses, pharmacodynamics, cancer progression (including breast, prostate, and blood), HIV progression, tumor development, cortical and cardiac development, cholesterol synthesis, viral-host interactions, plant stomatal function, DNA damage and repair, human sex determination, and various growth factors. The database contains a mixture of networks which obey synchronous and asynchronous update rules, which we do not discriminate in our analyses. We analyze 66 networks, all without inoperative edges, ranging in size from 5 nodes to 321 nodes. Nodes typically represent genes and proteins, and occasionally represent higher-level biological states. Over half the networks are smaller than 27 nodes, and over 90% of networks are smaller than 102 nodes (Figure 6). The number of interactions per network scales from 15 to 551. Half of the 66 networks have less than 66 edges, and over 90% of networks have less than 201 edges (Figure 7).
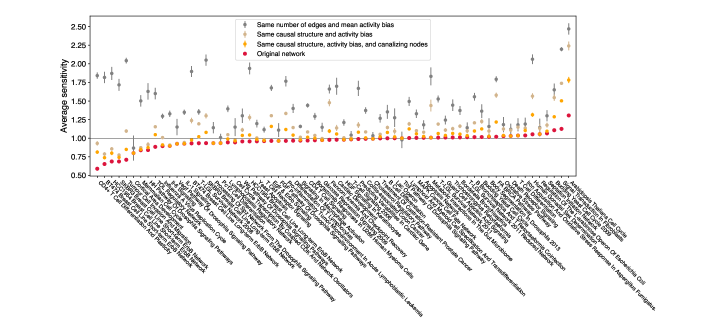
All models available in the Cell Collective database at the time of retrieval are included in this study, except for three models that each include one function that does not depend on any of its inputs. In Figure 3, we replot Figure 1B with the corresponding name of each Cell Collective model used in the study.
Sensitivity as a function of in-degree
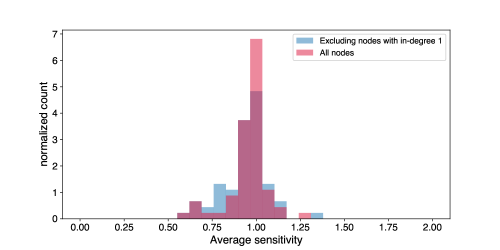
Of the 2,596 total non-external nodes in our dataset, 1,054 (about ) have in-degree . Because we consider only operative edges, nodes with always have sensitivity . To determine whether this biases our result for average sensitivity over all nodes, we also compare a calculation that excludes all nodes with in Figure 4. Even excluding these nodes produces a similar peak at .
We also plot the mean sensitivity of individual nodes as a function of in-degree in Figure 5.
An equivalent definition of sensitivity
For a given state , the number of nodes whose states change when flipping is , which when averaged over and gives an average Hamming distance of
| (5) |
after swapping the order of the sums over and .