11email: mariakout@cp.dias.ie
22institutetext: School of Physics, University College Dublin, Belfield, Dublin 4, Ireland
33institutetext: INAF/Osservatorio Astrofisico di Arcetri, Largo E. Fermi 5, 50125 Firenze, Italy
44institutetext: European Southern Observatory, Alonso de Cordova 3107, Vitacura, Santiago, Chile
The circumstellar environment of HD 50138 revealed by VLTI/AMBER at high angular resolution ††thanks: Based on observations collected at the European Southern Observatory Paranal, Chile (ESO programme 096.C-0293(A)).
Abstract
Context. HD 50138 is a Herbig B[e] star with a circumstellar disc detected at infrared and millimeter wavelength. Its brightness makes it a good candidate for near-infrared interferometry observations.
Aims. We aim to resolve, spatially and spectrally, the continuum and hydrogen emission lines in the 2.12-2.47 micron region, to shed light on the immediate circumstellar environment of the star.
Methods. Very Large Telescope-Interferometer/AMBER (VLTI/AMBER) K-band observations provide spectra, visibilities, differential phases, and closure phases along three long baselines for the continuum, and H i emission in Br and five high-n Pfund lines. By computing the pure-line visibilities, we derive the angular size of the different line-emitting regions. A simple local thermodynamic equilibrium (LTE) model was created to constrain the physical conditions of H i emitting region.
Results. The continuum region cannot be reproduced by a geometrical two-dimensional (2D) elongated Gaussian fitting model. We estimate the size of the region to be 1 au. We find the detected hydrogen lines (Br and Pfund lines) come from a more compact region of size 0.4 au. The Br line exhibits an S-shaped differential phase, indicative of rotation. The continuum and Br line closure phase show offsets of -255 ° and 2010° respectively. This is evidence of an asymmetry in their origin, but with opposing directions. We find that we cannot converge on constraints for the H i physical parameters without a more detailed model.
Conclusions. Our analysis reveals that HD 50138 hosts a complex circumstellar environment. Its continuum emission cannot be reproduced by a simple disc brightness distribution. Similarly, several components must be evoked to reproduce the interferometric observables within the Br line. Combining the spectroscopic and interferometric data of the Br and Pfund lines favours an origin in a wind region with a large opening angle. Finally, although we cannot exclude the possibility that HD 50138 is a young star our results point to an evolved source.
Key Words.:
techniques: interferometric – stars: winds, outflows – stars: emission line, Be – stars: individual: HD50138 – infrared: stars – stars: pre-main sequence1 Introduction
The evolutionary nature of Herbig B[e] stars is as yet unclear. They are intermediate mass stars (2-10 M☉), showing permitted and forbidden emission lines as well as a large infrared excesses, but they may be either pre-main sequence or evolved stars. Although there are many studies addressing the properties of the dusty outer disc, there are only a few on the gas component of the disc, in particular of its inner structure. This requires milli-arcsecond resolution, and so far there have been only a few cases where Herbig Ae/Be and evolved B[e] stars at high spatial and high spectral resolution have been studied (e.g. Kraus et al., 2008; Weigelt et al., 2011; Caratti o Garatti et al., 2015; Garcia Lopez et al., 2015, 2016). These studies have mostly focused on the H i Br line, which is the brightest emission line in the K band in Herbig stars. The emission of this line was initially associated with the accretion process through an empirical relation (Muzerolle et al., 1998; Calvet et al., 2004) but recent near-infrared (NIR) interferometric observations have shown that it can in part be emitted in a wind (Weigelt et al., 2011; Garcia Lopez et al., 2015, 2016; Caratti o Garatti et al., 2015).
The star HD50138 (MWC158, V743 Mon, IRAS 06491-0654) is a Herbig B[e] star and is one of the brightest B[e] stars in the southern sky. Its stellar parameters are shown in Table 1. It is not associated with any star-forming region but it might be part of the Orion Monoceros molecular cloud complex (Maddalena et al., 1986). It is located at a distance of 34047 pc (Lindegren et al., 2016). The evolutionary status of this source is not clear. On the one hand, the star has been considered as a pre-main sequence object (Morrison & Beaver, 1995). On the other hand, it has also been classified as an evolved object close to turn-off from the main sequence (Borges Fernandes et al., 2009). A reason to consider it a young star is because some infall signatures in the spectrum are present, but the fact that it is located far away from a star-forming region makes this criterion alone suspect. Moreover, its observed variability in the UV (ultraviolet) (Hutsemekers, 1985), which is associated with an outburst or a shell phase (Andrillat & Houziaux, 1991), is more often found in post-main sequence evolution.
HD 50138 has a spectral energy distribution (SED) typical of Herbig Be stars (Ellerbroek et al., 2015). Polarimetry studies find evidence of a circumstellar rotating disc (Oudmaijer & Drew, 1999; Harrington & Kuhn, 2007, 2009). The inner disc regions have been imaged using NIR interferometry and found to be highly asymmetric (Lazareff et al., 2016; Kluska et al., 2016), possibly changing with time (Kluska et al., 2016). HD 50138 has a strong Br emission, which has also been spatially resolved with interferometry, and it appears to originate in the inner disc region ( with size of 1.5 mas, Ellerbroek et al., 2015).
In this paper, we present NIR interferometric data of the innermost circumstellar environment of HD 50138. The observations and data reduction are discussed in Section 2 and the results, discussions, and conclusion in Sections 3, 4 and 5 respectively.
2 Observations and data reduction
HD 50138 was observed using the VLT-Interferometer (VLTI) with the beam combiner AMBER (Astronomical Multi-BEam combineR) (Petrov et al., 2007) on the 2015 December 23. The observations were performed using the 8.2 m unit telescopes (UT) with the configuration UT1-UT3-UT4, resulting in projected baselines (PBLs) and position angles (PAs) of 60 m, 100 m, and 130 m, and 216°, 112°, and 63°. Due to non-optimal weather conditions, the observations were performed without the fringe tracker FINITO (Fringe-tracking Instrument of NIce and TOrino) (Gai et al., 2004) and at medium spectral resolution (R1500, kms-1). The spectral coverage in K band is in the range of 2.126 m to 2.474 m. The details of the observation are given in Table 2.
The data were reduced using the software package amdlib v.3.0.8222The AMBER reduction package amdlib is available at: http://www.jmmc.fr/data_processing_amber.htm (Tatulli et al., 2007; Chelli et al., 2009). A standard frame selection was performed of 20% of the frames with the highest fringe signal-to-noise ratio (SNR). In order to calibrate the transfer function, the calibrator star HR 2552 was used. The wavelength calibration was refined using the telluric absorption lines present in the spectra of both the target and the calibrator. In addition, the spectrum of the calibrator was used to correct the target spectrum for telluric features and instrumental response.
| Object | Observation | Time | UTa | Baseline | PA | Spectral | Wavelength | DITc | UD | |
| Name | Date | Start | End | Array | Range | Modeb | Diameterd | |||
| (m) | (o) | (m) | (s) | (mas) | ||||||
| HD 50138 | 2015 Dec. 23 | 05:54 | 06:25 | UT1-UT3-UT4 | 100/60/130 | 216/112/63 | MR-K | 2.12-2.47 | 0.2 | |
| HR 2552 | 2015 Dec. 23 | 06:25 | 06:30 | UT1-UT3-UT4 | 100/60/130 | 216/112/63 | MR-K | 2.12-2.47 | 0.2 | |
3 Results
3.1 Interferometric observables
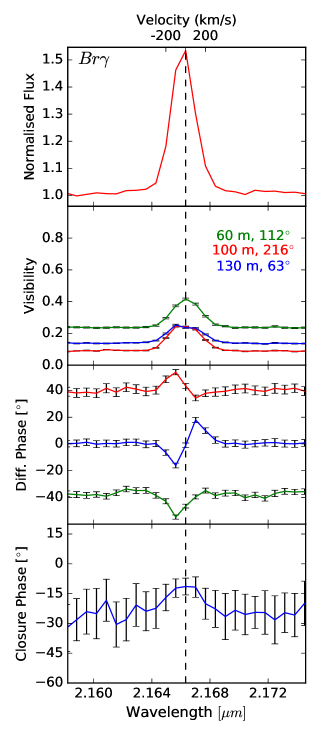
Our HD 50138 observations provide us with a spectrum, three spectrally dispersed visibilities, three differential phases, and one closure phase (Fig. 1).
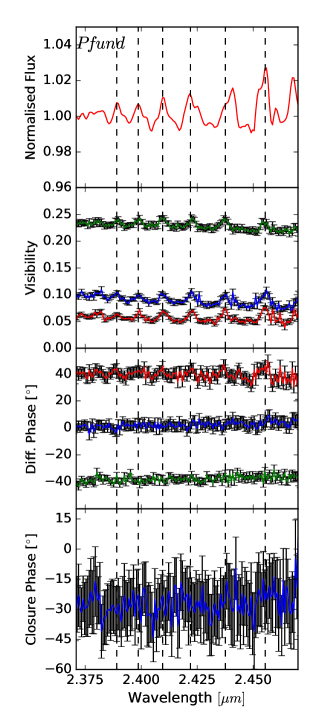
The spectrum shows continuum emission, as well as H i emission lines of bright Br and faint high-n Pfund (from level n=24 to n=19). This is in contrast to previous studies that detected only continuum and Br line emission (Ellerbroek et al., 2015; Borges Fernandes et al., 2009). The Br peak-to-continuum ratio is 1.5, with a full width at half maximum (FWHM) of 250 km s-1; that is, it is marginally spectrally resolved. The profile is symmetric, in agreement with previous observations of this source at higher spectral resolution (v 25 km s-1; Ellerbroek et al., 2015). The Pfund emission lines are weaker and their widths are consistent with that measured in Br, with line-to-continuum flux ratios of 5% to 10%. Fluxes are reported in Table 3.
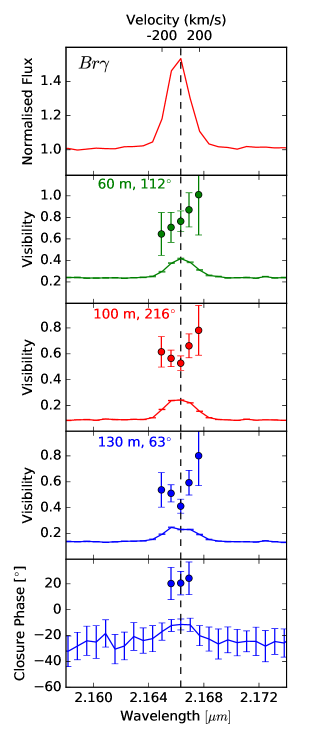
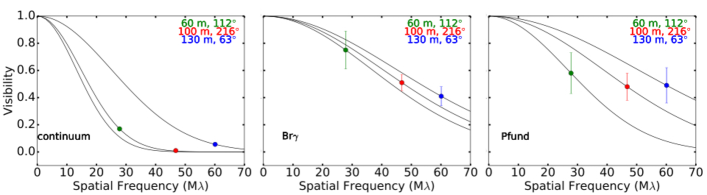
Visibility values of the continuum are close to zero, indicating that it is spatially resolved. Low visibility values of 0.24, 0.09, and 0.13 are measured for the PBLs 60 m, 100 m, and 130 m, respectively. Meanwhile, the visibility values of the H i emission lines are higher than those of the continuum, indicating that the line-emitting region is more compact than the continuum. Correcting for the continuum contribution gives the pure line visibility (Fig. 2), which provides a clearer picture of just how compact the H i emitting region may be.
A strong differential phase signature is detected across the Br line in all three baselines, indicating a significant displacement of its photocentre with respect to the continuum. All three baselines show the familiar S-shaped curve characteristic of rotation. No differential phase signature is detected in the Pfund lines.
Finally, a strong closure phase signature of -25 5° in the continuum emission and -12 3° in Br emission is measured, indicating point-like asymmetry. No closure phase offset is detected in the Pfund lines.
3.2 Geometric fitting
In order to estimate the size of the continuum and line-emitting regions a two-dimensional (2D) elongated Gaussian fitting model was used. Due to our limited uv coverage, we rely on literature values of an inclination angle of i= and a position angle of the major axis of the disc of PA= (e.g. Borges Fernandes et al., 2011; Ellerbroek et al., 2015; Kluska et al., 2016). These values were estimated using different interferometric instruments and better uv coverage. From the fitting we obtain the half width at half maximum (HWHM) of the brightness distribution.
3.3 Continuum emitting region
The three continuum visibilities cannot be fitted by a geometric 2D elongated Gaussian-disc model. The difficulty arises because the position angle dependence of the visibilities cannot be reproduced by a simple elongated brightness distribution. Instead, the continuum visibility measured on the 100 m baseline is lower than that measured for 130 m. Therefore, our continuum visibility measurements along with the large offset in the closure phase signal indicate that the geometry of the system is very complex, and may result from the contribution of several components with spatial extensions highly dependent on the position angle and baseline length of the individual observations.
In the context of such complexity, we estimate the size of the continuum-emitting region by deriving a value for each baseline observation (Fig. 3, left panel). The stellar component contribution was removed from the visibilities assuming a stellar-to-total flux ratio (in the K band at 2.16 m) of (Ellerbroek et al., 2015). The estimated sizes for the continuum-emitting region are given in Table 5. The HWHM values range from 1.8 mas ( 0.61 au) for the longest (130 m) baseline to 3–3.4 mas (1-1.15 au) for the remaining two baselines. It is worth noting that the sizes derived from the fitting (HWHM) of individual visibility points give us the projection of the whole brightness distribution of the object on that specific baseline and position angle, and not the object size at a specific position angle.
3.3.1 Br line-emitting region
The fact that the Br line emission is both broad and bright allowed us to extract pure line visibilities in a total of five spectral channels across the Br line. To estimate the pure line visibilities we followed the method described in Appendix C of Weigelt et al. (2007). We also corrected for intrinsic photospheric absorption lines using a B-type stellar template.
Figure 2 (left panels) shows these values plotted along with the original visibilities of Fig. 1, for comparison. The value of the Br pure line visibility across the line profile remains constant within the error bars. We report average values of 0.750.14, 0.510.06 and 0.410.07 for the 60 m, 100 m, and 130 m baselines respectively (Table 4). We note that values decrease with increasing baseline length. A geometric model-fitting of a Gaussian for each individual baseline visibility value was conducted, for ease of comparison with the continuum (Fig. 3, centre and left panels). HWHM values ranging from 1.0 to 1.3 mas were found, that is 0.34-0.41 au. Notably, if the three Br pure line visibilities are fitted simultaneously with a 2D Gaussian, a size of 1.00 0.13 mas is found, corresponding to 0.36 0.05 au. This result is consistent with the range of values obtained from the individual fittings. Similarly, correcting the closure phase for the continuum contribution reveals an offset of +20°10° (Fig. 2, left panels: the pure line closure phases have been computed by using the method also described in Appendix C of Weigelt et al. (2007)). This offset is opposite in direction to that derived for the continuum.
3.3.2 High-n Pfund line-emitting region
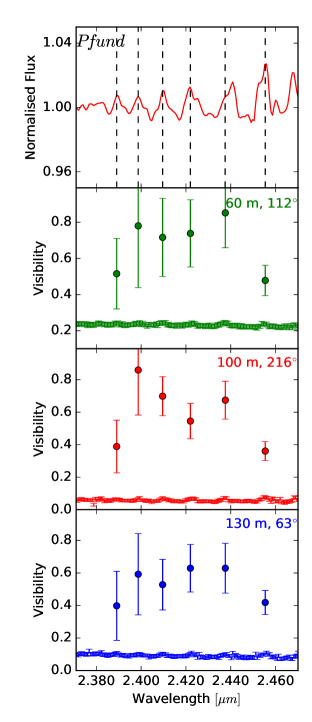
The derived pure line visibilities for the Pfund emission are shown in Fig. 2 (right panel). Values across all lines are consistent within errors. Therefore, in order to achieve a higher accuracy in estimating the size of the Pfund emitting region, we calculate the weighted-mean of the six Pfund visibilities for a given baseline. The resulting three Pfund pure line visibilities (Table 4) then allowed a Gaussian fit to estimate the size of the emitting region. We find a Pfund line-emitting region of size r0.3–0.57 au. This is very close to our value for the size of the Br line-emitting region of r0.34–0.41 au (Sect. 3.3.1).
| Emission line | Flux |
|---|---|
| (10-13 ergs s-1cm-2) | |
| Br | 811.20 |
| Pfund24-5 | 2.60.76 |
| Pfund23-5 | 2.10.63 |
| Pfund22-5 | 2.80.84 |
| Pfund21-5 | 3.20.96 |
| Pfund20-5 | 3.20.96 |
| Pfund19-5 | 6.70.80 |
| Baseline | Continuum | Br | Pfund |
|---|---|---|---|
| (m) | |||
| 60 | 0.239 | 0.75 | 0.58 |
| 101 | 0.092 | 0.51 | 0.48 |
| 130 | 0.135 | 0.41 | 0.49 |
| Baseline | Continuum | Br | Pfund | |||
|---|---|---|---|---|---|---|
| m | mas | au | mas | au | mas | au |
| 60 | 3.00 | 1.03 | 1.22 | 0.41 | 1.7 | 0.57 |
| 101 | 3.40 | 1.15 | 1.11 | 0.38 | 1.16 | 0.37 |
| 130 | 1.80 | 0.61 | 1.00 | 0.34 | 0.89 | 0.30 |
4 Discussion
4.1 Morphology and kinematics
The picture emerging from our observations is of a highly complex and asymmetric circumstellar environment in the immediate vicinity of HD 50138 .
Our continuum visibilities for the longest baseline agree well with reports of an inclined circumstellar disc of radius 2 mas, based on multi-epoch VLTI/PIONIER interferometric observations of this source in the H band (Kluska et al., 2016; Lazareff et al., 2016). However, our shorter baseline visibilities give a continuum size almost twice as large. Interestingly, this larger size is very similar to that derived from K-band AMBER interferometric studies of this source giving a continuum size (after correcting for the stellar component) of 3.4 mas (Ellerbroek et al., 2015). It should be noted, however, that the best-fit models of Lazareff et al. (2016) and Ellerbroek et al. (2015) utilize a greater number of shorter than longer baselines and so are unevenly weighted. Overall, it seems that the different sizes derived for the continuum emission region in the various studies point to a complex and variable geometry of the HD 50138 circumstellar environment.
The differential phase signature across the Br line presents a clear S-shape, which indicates that the gas is rotating. In the case of a rotating disc, which is not fully resolved, the differential phase signature acquires an S-shape profile with maximum amplitude measured when using baselines aligned with the disc major axis. To test if this rotating gas originates close to the disc surface (either from the disc surface itself, or at the base of a rotating disc wind), we examine the Br profile for consistency with a disc in Keplerian rotation. Assuming a distance to HD 50138 of 340 pc, the Br emission originates in a region which extends out to about 0.4 au from the star. At this distance, the Keplerian velocity of the disc is 100 km s-1 (assuming =54°). We find that our measured HWHM of the Br line is roughly this value, and thus supports an origin from rotating gas near or on the disc surface. Indeed, a model of the disc in Keplerian rotation provided a good fit to previously reported high-resolution AMBER data (Ellerbroek et al., 2015). However, such a model alone fails in reproducing some of our interferometric observables, namely, a large offset in the continuum closure phase signal (not detected in Ellerbroek et al., 2015), as well as the offset in the Br closure phase signal detected here for the first time.
The large offset of -25° in the continuum closure phase signal is evidence of a significant asymmetry in the circumstellar structure. Previous reports of this asymmetry interpreted it as an unevenly illuminated asymmetric disc with the eastern side much brighter than the western side, based on multi-epoch VLTI/PIONIER H-band observations (Lazareff et al., 2016). Other studies modelled the asymmetry as a bright spot that moves around the star, based on two-epoch reconstructed images (Kluska et al., 2016). Time-variable asymmetries are indeed common in B[e] stars (Okazaki, 1991; Carciofi et al., 2009; Schaefer et al., 2010). Long term variability (i.e. on decade timescales) is often explained by the development of a one-armed spiral superimposed on a circumstellar disc (Okazaki, 1991; Papaloizou et al., 1992). This spiral density wave precesses with the disc rotation, producing a difference in brightness between the two sides of the disc. Such a scenario could account for the large offset in the continuum closure phase signal, along with the aforementioned S-shape in the Br differential phase signature. Indeed, this explanation has been proposed for other Be stars (Schaefer et al., 2010; Oktariani et al., 2016).
However, there is also an offset of +20° in the Br closure phase signal which, similarly, indicates an asymmetry. Confusingly, this asymmetry is in a direction opposite to that of the continuum asymmetry. A possible scenario could be the presence of an outflow in which one lobe is much brighter than the other. This could be for instance produced by the presence of a hot spot in the stellar surface which leads to a preferred ejection direction (Humphreys et al., 2002). Other possible scenarios include the presence of a binary emitting in Br line, or an axisymmetric wind in which part of the emission is blocked by the (optically thick) disc. None of these scenarios would, however, reproduce the S-shaped Br line differential phase. Asymmetries of the continuum and the Br line-emitting regions have been reported in evolved stars (see, e.g. Meilland et al., 2013; Driebe et al., 2009). The similarity of our results with these previous reports seems to imply that HD 50138 is an evolved star.
Our interferometric observables make a clear case for the complexity of the continuum and Br line circumstellar environment of HD 50138 which is difficult to interpret with our single epoch observations. From our analysis, we see that no single component can simultaneously explain the two closure phases and the S-shape of the Br profile, but instead we find we must evoke multiple components. Providing meaningful constraints on this complex system demands improved coverage, both in the uv-plane and temporally, as well as higher spectral resolution.
4.2 H i physical conditions
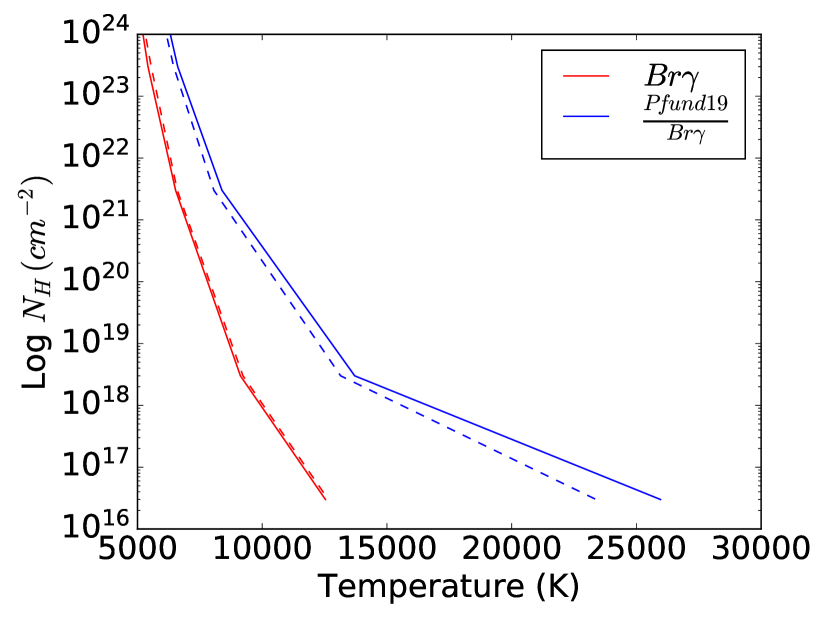
The simultaneous detection of the Br and Pfund lines allows us to provide additional information on some of the physical properties of the emitting region. First of all, the combination of the flux of the Br line and the size of the emitting region derived from our interferometric data shows that the Br line is unlikely to be optically thick. Assuming an area of the emitting region of cm2 and a correlated flux in the line of erg s-1 cm-2, a simple black-body estimate gives a temperature value of about 2200 K. At this temperature, assuming an LTE level population, the Br line will be optically thick only for unrealistically large column densities (i.e. cm-2). At the same time, the ratio of the Pfund line fluxes over Br (%) seem to rule out the lines forming in a recombination cascade. Namely, in Case B recombination (Baker & Menzel, 1938; Storey & Hummer, 1995) this ratio is never larger than 1-2% even for temperatures as high as 30 000 K. We adopt a very simple model for the H i emitting region, namely an isothermal, constant density slab. Assuming that the level populations are in LTE and a line width of 250 km s-1, we compute a grid of solutions on the () plane to be compared with the two constraints provided by our observations: the Br flux and the flux ratios of Pfund lines to Br. These values depend on the temperature , column density , and the size of the emitting region (0.4 au) as derived from our interferometric data. The locus of the points that reproduce the observed Br flux is shown as a red solid line in Fig. 4. The coloured solid curves represent the locus of the () points that reproduce the observed values of the ratio of the Pfund over Br fluxes, assuming that the emitting region is the same for all the lines. From Fig. 4 it is clear that there is no set of (T,NH) values that simultaneously reproduce the Br flux and the Pfund to Br line ratios within the 3 uncertainties of our measurements, with slightly better agreement for low and high . For fixed NH, the region emitting the Pfund lines must be slightly hotter than that emitting the Br line.
A possible explanation of this result is that the Pfund lines form in a region where both and the gas density vary along the line of sight, as expected in an outflow where the density decreases and the temperature increases moving away from the star. The similarity of the projected sizes in a system with the inclination of HD 50138 suggests that the outflow probably has a relatively wide opening angle.
Kraus et al. (2012) present AMBER interferometric observations of the B[e] star Tau (T⋆=19370K, Log L⋆/L⊙=3.9), which include Br and 4 Pfund lines from n=19-5 to n=22-5. In Tau the Pfund lines come from a smaller region than Br by a factor of approximately two and they are brighter relative to Br than in HD 50138. Those authors modelled the Pfund lines using a simple, LTE configuration with power-law radial gradients both in temperature and column density, following Stee & de Araujo (1994) and Carciofi & Bjorkman (2008). If we apply a similar model to HD 50138 at 0.4 au from the star we expect K and N , which cannot explain our observations. Detailed models, which include non-LTE effects (e.g., Carciofi & Bjorkman, 2008), are required before any firm conclusion can be reached.
5 Conclusions
We report observations of the Herbig B[e] star, HD 50138, using VLTI/AMBER interferometric observations in the K band at medium spectral resolution. Our observations allowed us to map the size of the continuum emission and of the Br and high-n Pfund lines. The latter is detected for the first time. Our results reveal that the circumstellar environment is very complex.
Morphologically, the continuum was found to be well resolved, but could not be reproduced using a symmetric Gaussian disc model for the brightness distribution. Nevertheless, a projected size of 0.6-1 au was estimated. The H i lines are more compact than the continuum-emitting region; a projected size of 0.4 au was estimated. Both continuum and Br line were found to trace an asymmetric origin but, confusingly, with opposing directions of asymmetries. Various possible scenarios are discussed, but nothing could be concluded without better uv-plane sampling.
Kinematically, the Br line presented a signature consistent with Keplerian rotation, and supporting the case for an origin close to the disc surface (either in the disc surface itself, or at the base of a rotating disc wind). No such signature was detected for the Pfund lines, possibly due to the lower SNR.
The H i physical conditions were investigated by applying a simple model to the H i line fluxes and their sizes. We conclude that the Br line is optically thin, and traces a wind with a wide opening angle.
Although we cannot exclude the possibility that HD 50138 is a pre-main sequence star, the similarity of our results with studies of evolved stars favours an evolved status also for HD 50138.
Acknowledgements.
M.K. is funded by the Irish Research Council (IRC), grant GOIPG/2016/769 and SFI grant 13/ERC/12907. R.G.L has received funding from the European Union’s Horizon 2020 research and innovation programme under the Marie Skłodowska-Curie Grant (agreement No. 706320). A.C.G. and T.P.R. have received funding from the European Research Council (ERC) under the European Union’s Horizon 2020 research and innovation programme (grant agreement No. 743029). JSB acknowledges the support from the ESO Fellowship programme.References
- Andrillat & Houziaux (1991) Andrillat, Y. & Houziaux, L. 1991, IAU Circ., 5164
- Baker & Menzel (1938) Baker, J. G. & Menzel, D. H. 1938, ApJ, 88, 52
- Borges Fernandes et al. (2009) Borges Fernandes, M., Kraus, M., Chesneau, O., et al. 2009, A&A, 508, 309
- Borges Fernandes et al. (2011) Borges Fernandes, M., Meilland, A., Bendjoya, P., et al. 2011, A&A, 528, A20
- Calvet et al. (2004) Calvet, N., Muzerolle, J., Briceño, C., et al. 2004, AJ, 128, 1294
- Caratti o Garatti et al. (2015) Caratti o Garatti, A., Tambovtseva, L. V., Garcia Lopez, R., et al. 2015, A&A, 582, A44
- Carciofi & Bjorkman (2008) Carciofi, A. C. & Bjorkman, J. E. 2008, ApJ, 684, 1374
- Carciofi et al. (2009) Carciofi, A. C., Okazaki, A. T., Le Bouquin, J.-B., et al. 2009, A&A, 504, 915
- Chelli et al. (2009) Chelli, A., Utrera, O. H., & Duvert, G. 2009, A&A, 502, 705
- Driebe et al. (2009) Driebe, T., Groh, J. H., Hofmann, K.-H., et al. 2009, A&A, 507, 301
- Ellerbroek et al. (2015) Ellerbroek, L. E., Benisty, M., Kraus, S., et al. 2015, A&A, 573, A77
- Gai et al. (2004) Gai, M., Corcione, L., & Massone, G. 2004, in Astrophysics and Space Science Library, Vol. 300, Scientific Detectors for Astronomy, The Beginning of a New Era, ed. P. Amico, J. W. Beletic, & J. E. Belectic, 341–344
- Garcia Lopez et al. (2016) Garcia Lopez, R., Kurosawa, R., Caratti o Garatti, A., et al. 2016, MNRAS, 456, 156
- Garcia Lopez et al. (2015) Garcia Lopez, R., Tambovtseva, L. V., Schertl, D., et al. 2015, A&A, 576, A84
- Gray & Corbally (1998) Gray, R. O. & Corbally, C. J. 1998, AJ, 116, 2530
- Harrington & Kuhn (2007) Harrington, D. M. & Kuhn, J. R. 2007, ApJ, 667, L89
- Harrington & Kuhn (2009) Harrington, D. M. & Kuhn, J. R. 2009, ApJS, 180, 138
- Humphreys et al. (2002) Humphreys, R. M., Davidson, K., & Smith, N. 2002, AJ, 124, 1026
- Hutsemekers (1985) Hutsemekers, D. 1985, A&AS, 60, 373
- Kluska et al. (2016) Kluska, J., Benisty, M., Soulez, F., et al. 2016, A&A, 591, A82
- Kraus et al. (2008) Kraus, S., Hofmann, K.-H., Benisty, M., et al. 2008, A&A, 489, 1157
- Kraus et al. (2012) Kraus, S., Monnier, J. D., Che, X., et al. 2012, ApJ, 744, 19
- Lazareff et al. (2016) Lazareff, Berger, Kluska, et al. 2016, A&A
- Lindegren et al. (2016) Lindegren, L., Lammers, U., Bastian, U., et al. 2016, A&A, 595, A4
- Maddalena et al. (1986) Maddalena, R. J., Morris, M., Moscowitz, J., & Thaddeus, P. 1986, ApJ, 303, 375
- Meilland et al. (2013) Meilland, A., Stee, P., Spang, A., et al. 2013, A&A, 550, L5
- Morrison & Beaver (1995) Morrison, N. D. & Beaver, M. 1995, in Bulletin of the American Astronomical Society, Vol. 27, American Astronomical Society Meeting Abstracts #186, 825
- Muzerolle et al. (1998) Muzerolle, J., Hartmann, L., & Calvet, N. 1998, AJ, 116, 2965
- Okazaki (1991) Okazaki, A. T. 1991, PASJ, 43, 75
- Oktariani et al. (2016) Oktariani, F., Okazaki, A. T., Kunjaya, C., & Aprilia. 2016, MNRAS, 459, 4440
- Oudmaijer & Drew (1999) Oudmaijer, R. D. & Drew, J. E. 1999, MNRAS, 305, 166
- Papaloizou et al. (1992) Papaloizou, J. C., Savonije, G. J., & Henrichs, H. F. 1992, A&A, 265, L45
- Petrov et al. (2007) Petrov, R. G., Malbet, F., Weigelt, G., et al. 2007, A&A, 464, 1
- Schaefer et al. (2010) Schaefer, G. H., Gies, D. R., Monnier, J. D., et al. 2010, AJ, 140, 1838
- Stee & de Araujo (1994) Stee, P. & de Araujo, F. X. 1994, A&A, 292, 221
- Storey & Hummer (1995) Storey, P. J. & Hummer, D. G. 1995, MNRAS, 272, 41
- Tatulli et al. (2007) Tatulli, E., Isella, A., Natta, A., et al. 2007, A&A, 464, 55
- Weigelt et al. (2011) Weigelt, G., Grinin, V. P., Groh, J. H., et al. 2011, A&A, 527, A103
- Weigelt et al. (2007) Weigelt, G., Kraus, S., Driebe, T., et al. 2007, A&A, 464, 87