How optical excitation controls the structure and properties of vanadium dioxide
Abstract
We combine ultrafast electron diffraction and time-resolved terahertz spectroscopy measurements to unravel the connection between structure and electronic transport properties during the photoinduced insulator-metal transitions in vanadium dioxide. We determine the structure of the metastable monoclinic metal phase, which exhibits anti-ferroelectric charge order arising from a thermally activated, orbital-selective phase transition in the electron system. The relative contribution of this photoinduced monoclinic metal (which has no equilibrium analog) and the photoinduced rutile metal (known from the equilibrium phase diagram) to the time and pump-fluence dependent multi-phase character of the film is established, as is the respective impact of these two distinct phase transitions on the observed changes in terahertz conductivity. Our results represent an important new example of how light can control the properties of strongly correlated materials and elucidate that multi-modal experiements are essential when seeking a detailed connection between ultrafast changes in optical-electronic properties and lattice structure in complex materials.
The insulator-metal transition (IMT) in vanadium dioxide (VO2) is a benchmark problem in condensed matter physics Morin (1959); Goodenough (1971); Zylbersztejn and Mott (1975); Eyert (2002); Basov et al. (2011); Budai et al. (2014), as it provides a rich playground on which lattice-structural distortions and strong electron correlations conspire to determine emergent material properties. The equilibrium phase diagram of pure VO2 involves a high-temperature tetragonal (rutile, ) metal that is separated from several structurally distinct low-temperature insulating phases (monoclinic , and triclinic ) depending on pressure or lattice strain. The transition to these lower-symmetry insulating phases occurs in the vicinity of room temperature and is sensitive to doping (Cr and W), making VO2 interesting for a range of technological applications Hendaoui et al. (2013); Ryckman et al. (2012); Miller et al. (2017). Since its discovery there has been a lively discussion in the literature about the driving force responsible for the IMT in VO2 and the nature of the insulating and metallic phases that has revolved around the role and relative importance of electron-lattice and electron-electron interactions. The stark dichotomy between Peierls Goodenough (1971) and Mott Mott and Friedman (1974) pictures characterizing the earliest explanations have recently given way to a nuanced view that the insulating phases of VO2 are non-standard Mott-Hubbard systems where both electron-lattice and electron-electron interactions play important roles in determining the electronic properties of all the equilibrium phases Eyert (2011); Weber et al. (2012); Biermann et al. (2005); Brito et al. (2016); Huffman et al. (2017); Nájera et al. (2018).
Photoexcitation using ultrafast laser pulses has provided another route to initiate the transition between the insulating and metallic phases of VO2 since it was discovered that the IMT occurs very rapidly following femtosecond laser excitation with sufficient fluence Becker et al. (1994). Since this discovery, VO2 has been the focus of many time-resolved experiments including X-ray Cavalleri et al. (2001); Hada et al. (2011) and electron Baum et al. (2007); Morrison et al. (2014); Tao et al. (2016) diffraction, X-ray absorption Cavalleri et al. (2005); Haverkort et al. (2005), photoemission Wegkamp et al. (2014) and optical spectroscopies Cavalleri et al. (2004); Kübler et al. (2007); Pashkin et al. (2011); Wall et al. (2012); Cocker et al. (2012); Wall et al. (2013); Mayer et al. (2015); Jager et al. (2017); Abreu et al. (2017) from terahertz to ultraviolet aimed at uncovering the connection between the photo-induced IMT and changes in lattice structure.
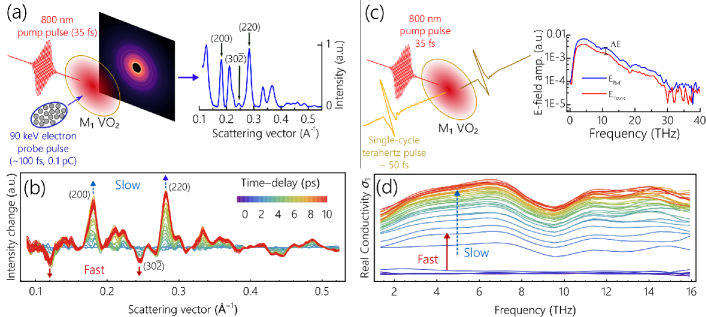
Recently, ultrafast electron diffraction (UED) and mid-infrared spectroscopy were combined to show that there are two distinct photo-induced IMTs in VO2 (Morrison et al., 2014). The first, accessible at relatively high pump fluence, is an analog of the equilibrium IMT and is associated with the lattice-structural transition between and crystallography expected from the equilibrium phase diagram. The second, accessible at lower pump fluence, has no equilibrium analog and yields a metastable, structurally distinct monoclinic metal phase () that retains the crystallographic symmetry of its parent equilibrium monoclinic phase. Here, UED and time-resolved terahertz spectroscopy (TRTS) are combined (Fig. 1) to perform a detailed structure-property correlative study of the photo-induced phase transitions in VO2. UED measurements are used to determine the real-space structure of the transient metastable phase (Sec. I.1). The fluence dependence of the and phase fractions that form the heterogeneous multi-phase specimen following photoexcitation are measured and shown to directly correspond with the TRTS measurements (Sec. I.2). From this correspondence we determine the low-frequency terahertz conductivities of both photo-induced and phases. The kinetics of the phase transition is consistent with thermal activation driven by electron temperature with an activation energy of meV (Sec. I.3). Information on the free energy landscape in VO2 and its dependence on structural distortions and orbital occupancy is also discussed. Our results provide a unified view of the photo-induced structural phase transitions in VO2 and their relationship to changes in the low-frequency terahertz conductivity.
I Experimental results
UED measurements of pulsed laser deposited VO2 films (50 nm) reveal rich pump-fluence dependent dynamics up to the damage threshold of 40 mJ/cm2 (35 fs, 800 nm, Hz). Figure 1 (a) shows a typical one-dimensional powder diffraction pattern for equilibrium VO2 in the phase and identifies the (200), (220) and (30) peaks. The (30) peak acts as an order parameter for the transition, since it is forbidden by the symmetry of the phase, while (200) and (220) peaks are present in all equilibrium phases. Consistent with previous work (Morrison et al., 2014), the pump-induced changes to diffracted intensity (Fig. 1 (b), 23 mJ/cm2) indicate two distinct and independent photo-induced structural transformations. The first is a rapid (fs) non-thermal melting of the periodic lattice distortion (dimerized V–V pairs) present in , evident in Fig. 1 (b) and Fig. 2 (a) as a suppression of the () and related peak intensities. The second is a slower (ps) transformation associated with a significant increase in the intensity of the (200), (220) and other low index peaks whose time-dependence is also shown in Fig. 1 (b) and Fig. 2 (a). As we will show, at low pump fluences (3–8 mJ/cm2) the slow process is exclusively observed, while at high pump fluences (mJ/cm2) the fast process dominates; these are independent structural transitions, the slow process does not follow the fast process.
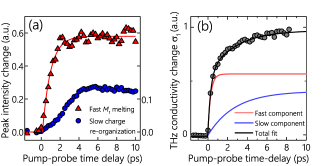
Complementary TRTS measurements were performed on the same samples under identical excitation conditions to determine the associated changes in the time-dependent complex conductivity, (see Fig. 1 (c) and (d)). The pump-induced changes in real conductivity, , over the 2–20 THz frequency range (Fig. 1 (d)) also exhibit fast () and slow () dynamics, consistent in terms of timscales and fluence dependence with those described above for the UED measurements and similar measurements performed on sputtered VO2 films in the 0.5–2 THz window Cocker et al. (2012). Additional structure at higher frequencies is due to optically active phonons associated with O–cage vibrations around V atoms Kübler et al. (2007). We connect the observed THz response to the two structural transformations by focusing on the integrated spectral region from 2–6 THz which includes exclusively electronic contributions to the conductivity (Drude-like) and omits phonon resonances Kübler et al. (2007); Pashkin et al. (2011); Wall et al. (2012). Figure 2 (b) shows an example of the transient real conductivity measured at 22 mJ/cm2 along with the fast and slow exponential components plotted individually. We find that these time constants are in excellent agreement with those of the fast and slow processes determined from the UED measurements (Fig. 2). This correspondence holds over the enitre range of fluences investigated.
I.1 Structure of the monoclinic metallic phase
Since its discovery (Morrison et al., 2014), the structure of the photoinduced phase and its relationship to the parent phase has remained unclear. Here we use measured UED intensities to determine the changes in the electrostatic crystal potential, , associated with the transformation between and phases. The centro-symmetry of the monoclinic and rutile phases provides a solution to the phase problem Elsaesser and Woerner (2010) and allows for the reconstruction of the full three-dimensional real-space electrostatic potential from each one-dimensional diffraction pattern obtained using UED.
Figure 3 shows slices of for VO2 in the (b) and (c) phases obtained using this procedure. The slices shown are aligned vertically along the rutile axis, and horizontally cut the unit cell along as indicated in the 3D structural model of VO2 (Fig. 3 (f)). In this plane, adjacent vanadium chains are rotated by 90∘, with dimers tilting either in or orthogonal to the plane of the page as indicated in Fig. 3 (c) and (f). The lattice parameters obtained from these reconstructions are in excellent agreement with published values for the two equilibrium phases (Fig. 3 (a)). The autocorrelation of is also in quantitative agreement with the Patterson function computed directly from the UED data (See Fig. S6 in SM ).
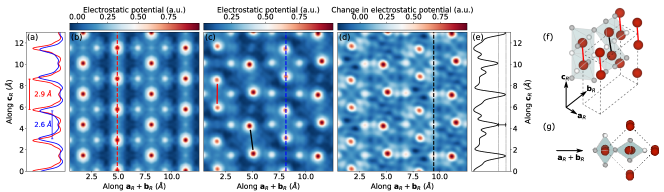
In Fig. 3 (d) the changes in associated with the – transition are revealed. This map is computed from the measured between the and phases 10 ps after photoexcitation at 6 mJ/cm2. The preservation of crystallography is clear; i.e. V–V dimerization and tilting along the axis. Also evident is the transition to a novel 1D anti-ferroelectric charge order along . In the equilibrium phases all oxygen atoms are equivalent, but in the phase there is a periodic modulation in at the oxygen sites along the axis indicated by arrows. This modulation is commensurate with the lattice constant (Fig. 3 (c)-(e)). The oxygen atoms exhibiting the largest changes are those associated with the minimum V–O distance in the octahedra and, therefore, the V–V dimer tilt. This emphasizes the importance of the lattice distortion to the emergence of the phase. The anti-ferroelectric lattice distortion in was already emphasized by Goodenough Goodenough (1971) in his seminal work on VO2. Significant changes in electrostatic potential are also visible between vanadium atoms in the octahedrally-coordinated chains along that is consistent with a delocalization or transfer of charge from the V–V dimers to the region between dimers. All of these observations suggest that the phase emerges from a collective reorganization in the electron system alone.
I.2 Fluence dependence
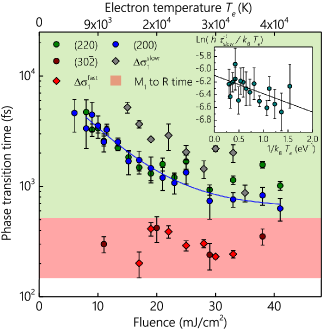
We have established that there are two qualitatively distinct ultrafast photo-induced phase transtions in vanadium dioxide. The pump-fluence dependence of the sample response, specifically the heterogenous character of the film following photoexcitation (due to both and transformations) and the corresponding changes in conductivity, is addressed in this section. UED intensities report on the fluence dependence of both structural phase transitions (Fig. 4 (a)). As described earlier, the change in the () peak intensity provides an order parameter exclusively for the transition, while the (200) and (220) peak intensities report on both and transformations. Measurements of the (30) peak intensity (Fig. 4 (a) red triangles) clearly demonstrate a fluence threshold of mJ/cm2 for the transformation that is consistent with previous work Morrison et al. (2014); Baum et al. (2007); Cavalleri et al. (2001). Above this threshold the suppression of the (30) peak increases approximately linearly with fluence up to a magnitude greater than at mJ/cm2, a result that is inconsistent with a “two-step” model that involves fast V–V dimer dilation followed by slow dimer rotation. Complete V–V dimer dilation yields a maximum (30) peak suppresion of . Instead, this data is consistent with a picture where the PLD of the phase simply melts in fs. The photoinduced fraction of –phase VO2 reaches of the film on this timescale at the highest pump fluences reported. The (200) and (220) peaks (Fig. 4 (a) blue and green circles) show a more complicated fluence dependence, reaching a maximum change in intensity in the 20 mJ/cm2 range. At the highest excitation fluences reported the intensity changes in the (200) and (220) peaks correspond to the relative increase expected for the phase compared to the of VO2. The maximum at mJ/cm2 is entirely due to the presence of the phase as we demonstrate by converting the changes in UED intensities to phase volume fractions SM .
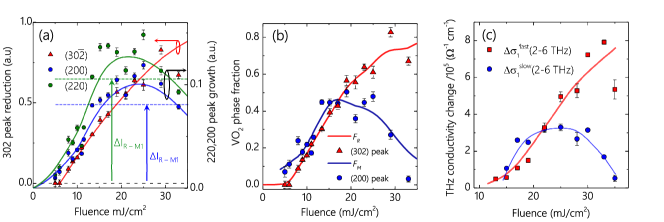
We denote as the phase volume fraction for the phase and for the phase. The results of the model are shown in Fig. 4 (c). For fluences below the structural IMT fluence threshold of mJ/cm2, we observe clearly that only a small percentage () of crystallites have been formed by photoexcitation. As the fluence increases, the photoexcitation of crystallites begins at the threshold and increases roughly linearly afterwards. The phase, achieves a maximum in the vicinity of 20 mJ/cm2 (consistent with Fig. 4 (a)) where we determine that . At greater fluences, decreases as the material becomes increasingly phase due to stronger photoexcitation. The data points shown in Fig. 2 (c) as blue circles are an average of the (200) and (220) data points from (a) with the contribution from the phase transistion subtracted.
We obtain quantitatively consistent results for the fluence dependence of the transient conductivity obtained by TRTS, firmly establishing a link between the differential structure and differential electronic response. Figure 4 (b) shows the fluence dependence of the fast () and slow () conductivity terms. The component corresponds to the conductivity response associated with the transition from as it increases steadily with fluence in accordance with shown in Fig. 4 (c). Furthermore, we clearly observe that achieves a maximum at a fluence of 20 mJ/cm2 beyond which it decreases, consistent with the behaviour of the (200) and (220) diffraction peaks and shown in Fig. 4 (a) and (c). By analyzing the conductivity terms in an effective medium model, we find good agreement for in the metallic limit SM .
I.3 Activation energy and kinetics
The and transitions exhibit qualitatively different kinetic behaviour as evidenced by the fluence dependence of the time constants and obtained from both UED and TRTS (Fig. 5). The time constant for the transition (), captured by the dynamics of the (30) peak in the UED measurements and by in the THz measurements, is fs independent of fluence. This demonstrates that photo-induced transition – the melting of the periodic lattice distortion – is non-thermal and barrier free. The results for the –phase volume fraction (Fig. 4), however, also show that the excitation threshold for this non-thermal phase transition is heterogeneous in PLD grown films, depending on local crystallite size and strain conditions. This last fact was also previously observed by Zewail using UEM Lobastov et al. (2007) and others by nanoscopy O’Callahan et al. (2015); Dönges et al. (2016). The time constant, conversely, decreases significantly with pump fluence as seen in the (200) and (220) peak dynamics from UED and the from TRTS. The exponential increase in the rate with excitation energy deposited in the electron system strongly suggests that the is an activated process. We can extract the activation energy from this data by determining the electronic excitation energy as a function of pump fluence SM and invoking the Eyring-Polanyi equation from transition state theory Evans and Polanyi (1935)
| (1) |
where is the entropy of activation. We take the values of for the (200) peak shown in Fig. 5 and plot vs. which is shown in the inset of Fig. 5. By fitting to Eqn. (1), we determine meV. This describes a fundamental property of the photo-induced transition. Furthermore, the fluence required to deposit per unit cell is mJ/cm2, which is the value previously attributed to the IMT threshold Becker et al. (1994); Cavalleri et al. (2001); Kübler et al. (2007). This is also in agreement with the fluence threshold extracted from the low fluence data points in Fig. 4 (a).
II Discussion and conclusion
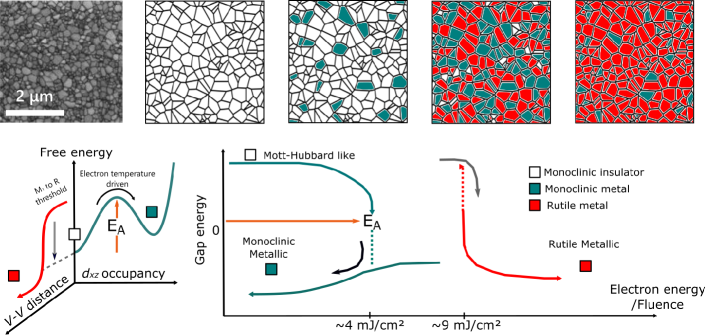
We have demonstrated that photoexcitation of VO2 yields a complex, heterogenous, multiphase film whose structure and properties are both time and fluence dependent. The character of the fluence depedent transformation is summarized in Fig. 6. At pump fluences below mJ/cm2 there is no long-lived (ps) transformation of the structure, and VO2 behaves like other Mott insulators insofar as optical excitation induces a relatively small, impulsive increase in conductivity followed by a complete recovery of the insulating state Pashkin et al. (2011); Cocker et al. (2012); Morrison et al. (2014); Wegkamp et al. (2014). Above mJ/cm2, however, photoexcitation stimulates a phase transition in the electron system that stabilizes metallic properties through an orbitally selective charge re-organization: the phase. Between 3-8 mJ/cm2 photoexcitation exclusively yields the phase, which populates 15–20 of the film by 8 mJ/cm2. In this fluence range, time-resolved photoemission experiments show a complete collapse of the bandgap Wegkamp et al. (2014), TRTS experiments show a dramatic increase in conductivity Pashkin et al. (2011); Cocker et al. (2012) and optical studies show large changes in the dielectric function Cavalleri et al. (2001); Wall et al. (2012); Jager et al. (2017), all of which are persistent, long-lived and characteristic of a phase-transition. Given the nature of the equilibrium phase diagram, these observations were previously interpreted as evidence of the transition. The transition, however, exhibits a minimum fluence threshold of 8–9 mJ/cm2 consistent with surface sensitive experiments Baum et al. (2007); Lobastov et al. (2007) and coherent phonon investigations Wall et al. (2012). Above 8 mJ/cm2 photoexcitation yields a heterogenous response with both and phase fractions increasing with fluence to approximately 20 mJ/cm2 where each phase occupies of the film. At higher fluences dominates and the phase occupies a decreasing proportion of the film.
Non-thermal melting as a route to the control of material structure and properties with femtosecond laser excitation has been known for some time and there are examples in several material classes. Much more novel is the () which has no equilibrium analog and represents a new direction for using optical excitation to control the properties of strongly correlated materials. The is thermally activated and does not involve a significant lattice structural component, representing a phase transition in the electron system alone. Our results are consistent with the recent computations of He and Millis He and Millis (2016) which indicate that an orbital selective transition can be driven in VO2 through the increase in electron temperature following femtosecond laser excitation. This transition depletes the occupancy of the V– band that is split by the V–V dimerization in favour of the V– band that mixes strongly with the O– orbitals due to the anti-ferroelectric tilting of the V–V dimers (Fig. 3 (f)). The bandgap collapses along with this transition yielding a metallic phase. The three salient features of this picture are in agreement with our observatons; thermal activation on the order of meV, orbital selection and bandgap collapse to a metallic phase. Of interest is the fact that depletion of the V– band where states are expected to be localized on the V–V dimers does not seem to significantly lengthen the V–V dimer bond. The question arises whether this phenomena can be entirely understood inside a picture that treats VO2 as a system, or whether more than a single V- electron is involved as DMFT calculations suggest Weber et al. (2012). Such DMFT results from Weber Weber et al. (2012) suggest that VO2 is a paramagnetic metal with antiferroelectric character, like that shown in Fig. 3 (d), when intra-dimer correlations are not included.
The combination of UED and TRTS measurements also makes it possible to address the question of a structural bottleneck associated with the photoinduced IMT in VO2. Here we definitively show that the timescale associated with the IMT, i.e. the timescale associated with the emergence of metallic conductivity similar to that of the equilibrium metallic phase, is determined by that of the structural phase transitions (Fig. 2 and 5. Following photoexcitation at sufficient fluence, there is overwhelming evidence that there is an impulsive collapse of the bandgap in VO2 with equally rapid changes in optical properties. However, the emergence of metallic transport properties occurs on the same timescale as the structural phase transitions. Clearly the localization-delocalization transition that leads to a 5 order of magnitude increase in conductivty is inseparable from the structural phase transitions.
In conclusion, we have combined UED and TRTS measurements of VO2 and decoupled the concurrent structural phase transitions along with their contribution to the multiphase heterogeneity of the sample following photoexcitation. We have shown that the monoclinc metal phase is the product of a thermally activated transition in the electron system, which provides a new avenue for the optical control of strongly correlated material properties.
References
- Morin (1959) F. J. Morin, Phys. Rev. Lett. 3, 34 (1959), URL https://link.aps.org/doi/10.1103/PhysRevLett.3.34.
- Goodenough (1971) J. B. Goodenough, Journal of Solid State Chemistry 3, 490 (1971), ISSN 0022-4596, URL http://www.sciencedirect.com/science/article/pii/0022459671900910.
- Zylbersztejn and Mott (1975) A. Zylbersztejn and N. F. Mott, Phys. Rev. B 11, 4383 (1975), URL https://link.aps.org/doi/10.1103/PhysRevB.11.4383.
- Eyert (2002) V. Eyert, Annalen der Physik 11, 650 (2002), ISSN 1521-3889, URL http://dx.doi.org/10.1002/1521-3889(200210)11:9<650::AID-ANDP650>3.0.CO;2-K.
- Basov et al. (2011) D. N. Basov, R. D. Averitt, D. van der Marel, M. Dressel, and K. Haule, Rev. Mod. Phys. 83, 471 (2011), URL https://link.aps.org/doi/10.1103/RevModPhys.83.471.
- Budai et al. (2014) J. D. Budai, J. Hong, M. E. Manley, E. D. Specht, C. W. Li, J. Z. Tischler, D. L. Abernathy, A. H. Said, B. M. Leu, L. A. Boatner, et al., Nature 515, 535 (2014).
- Hendaoui et al. (2013) A. Hendaoui, N. Émond, M. Chaker, and Émile Haddad, Applied Physics Letters 102, 061107 (2013), URL https://doi.org/10.1063/1.4792277.
- Ryckman et al. (2012) J. D. Ryckman, V. Diez-Blanco, J. Nag, R. E. Marvel, B. K. Choi, R. F. Haglund, and S. M. Weiss, Opt. Express 20, 13215 (2012), URL http://www.opticsexpress.org/abstract.cfm?URI=oe-20-12-13215.
- Miller et al. (2017) K. J. Miller, K. A. Hallman, R. F. Haglund, and S. M. Weiss, Opt. Express 25, 26527 (2017), URL http://www.opticsexpress.org/abstract.cfm?URI=oe-25-22-26527.
- Mott and Friedman (1974) N. F. Mott and L. Friedman, The Philosophical Magazine: A Journal of Theoretical Experimental and Applied Physics 30, 389 (1974).
- Eyert (2011) V. Eyert, Phys. Rev. Lett. 107, 016401 (2011), URL https://link.aps.org/doi/10.1103/PhysRevLett.107.016401.
- Weber et al. (2012) C. Weber, D. D. O’Regan, N. D. M. Hine, M. C. Payne, G. Kotliar, and P. B. Littlewood, Phys. Rev. Lett. 108, 256402 (2012), URL https://link.aps.org/doi/10.1103/PhysRevLett.108.256402.
- Biermann et al. (2005) S. Biermann, A. Poteryaev, A. I. Lichtenstein, and A. Georges, Phys. Rev. Lett. 94, 026404 (2005), URL https://link.aps.org/doi/10.1103/PhysRevLett.94.026404.
- Brito et al. (2016) W. H. Brito, M. C. O. Aguiar, K. Haule, and G. Kotliar, Phys. Rev. Lett. 117, 056402 (2016), URL https://link.aps.org/doi/10.1103/PhysRevLett.117.056402.
- Huffman et al. (2017) T. J. Huffman, C. Hendriks, E. J. Walter, J. Yoon, H. Ju, R. Smith, G. L. Carr, H. Krakauer, and M. M. Qazilbash, Phys. Rev. B 95, 075125 (2017), URL https://link.aps.org/doi/10.1103/PhysRevB.95.075125.
- Nájera et al. (2018) O. Nájera, M. Civelli, V. Dobrosavljević, and M. J. Rozenberg, Phys. Rev. B 97, 045108 (2018), URL https://link.aps.org/doi/10.1103/PhysRevB.97.045108.
- Becker et al. (1994) M. F. Becker, A. B. Buckman, R. M. Walser, T. Lépine, P. Georges, and A. Brun, Applied Physics Letters 65, 1507 (1994), URL https://doi.org/10.1063/1.112974.
- Cavalleri et al. (2001) A. Cavalleri, C. Tóth, C. W. Siders, J. A. Squier, F. Ráksi, P. Forget, and J. C. Kieffer, Phys. Rev. Lett. 87, 237401 (2001), URL https://link.aps.org/doi/10.1103/PhysRevLett.87.237401.
- Hada et al. (2011) M. Hada, K. Okimura, and J. Matsuo, Applied Physics Letters 99, 051903 (2011), URL https://doi.org/10.1063/1.3621900.
- Baum et al. (2007) P. Baum, D.-S. Yang, and A. H. Zewail, Science 318, 788 (2007), ISSN 0036-8075, URL http://science.sciencemag.org/content/318/5851/788.
- Morrison et al. (2014) V. R. Morrison, R. P. Chatelain, K. L. Tiwari, A. Hendaoui, A. Bruhacs, M. Chaker, and B. J. Siwick, Science 346, 445 (2014), ISSN 0036-8075.
- Tao et al. (2016) Z. Tao, F. Zhou, T.-R. T. Han, D. Torres, T. Wang, N. Sepulveda, K. Chang, M. Young, R. R. Lunt, and C.-Y. Ruan, Scientific reports 6, 38514 (2016).
- Cavalleri et al. (2005) A. Cavalleri, M. Rini, H. H. W. Chong, S. Fourmaux, T. E. Glover, P. A. Heimann, J. C. Kieffer, and R. W. Schoenlein, Phys. Rev. Lett. 95, 067405 (2005), URL https://link.aps.org/doi/10.1103/PhysRevLett.95.067405.
- Haverkort et al. (2005) M. W. Haverkort, Z. Hu, A. Tanaka, W. Reichelt, S. V. Streltsov, M. A. Korotin, V. I. Anisimov, H. H. Hsieh, H.-J. Lin, C. T. Chen, et al., Phys. Rev. Lett. 95, 196404 (2005), URL https://link.aps.org/doi/10.1103/PhysRevLett.95.196404.
- Wegkamp et al. (2014) D. Wegkamp, M. Herzog, L. Xian, M. Gatti, P. Cudazzo, C. L. McGahan, R. E. Marvel, R. F. Haglund, A. Rubio, M. Wolf, et al., Phys. Rev. Lett. 113, 216401 (2014), URL https://link.aps.org/doi/10.1103/PhysRevLett.113.216401.
- Cavalleri et al. (2004) A. Cavalleri, T. Dekorsy, H. H. W. Chong, J. C. Kieffer, and R. W. Schoenlein, Phys. Rev. B 70, 161102 (2004), URL https://link.aps.org/doi/10.1103/PhysRevB.70.161102.
- Kübler et al. (2007) C. Kübler, H. Ehrke, R. Huber, R. Lopez, A. Halabica, R. F. Haglund, and A. Leitenstorfer, Phys. Rev. Lett. 99, 116401 (2007), URL https://link.aps.org/doi/10.1103/PhysRevLett.99.116401.
- Pashkin et al. (2011) A. Pashkin, C. Kübler, H. Ehrke, R. Lopez, A. Halabica, R. F. Haglund, R. Huber, and A. Leitenstorfer, Phys. Rev. B 83, 195120 (2011), URL https://link.aps.org/doi/10.1103/PhysRevB.83.195120.
- Wall et al. (2012) S. Wall, D. Wegkamp, L. Foglia, K. Appavoo, J. Nag, R. Haglund Jr, J. Stähler, and M. Wolf, Nature Communications 3, 721 (2012).
- Cocker et al. (2012) T. L. Cocker, L. V. Titova, S. Fourmaux, G. Holloway, H.-C. Bandulet, D. Brassard, J.-C. Kieffer, M. A. El Khakani, and F. A. Hegmann, Phys. Rev. B 85, 155120 (2012), URL https://link.aps.org/doi/10.1103/PhysRevB.85.155120.
- Wall et al. (2013) S. Wall, L. Foglia, D. Wegkamp, K. Appavoo, J. Nag, R. F. Haglund, J. Stähler, and M. Wolf, Phys. Rev. B 87, 115126 (2013), URL https://link.aps.org/doi/10.1103/PhysRevB.87.115126.
- Mayer et al. (2015) B. Mayer, C. Schmidt, A. Grupp, J. Bühler, J. Oelmann, R. E. Marvel, R. F. Haglund, T. Oka, D. Brida, A. Leitenstorfer, et al., Phys. Rev. B 91, 235113 (2015), URL https://link.aps.org/doi/10.1103/PhysRevB.91.235113.
- Jager et al. (2017) M. F. Jager, C. Ott, P. M. Kraus, C. J. Kaplan, W. Pouse, R. E. Marvel, R. F. Haglund, D. M. Neumark, and S. R. Leone, Proceedings of the National Academy of Sciences 114, 9558 (2017), ISSN 0027-8424, URL http://www.pnas.org/content/114/36/9558.
- Abreu et al. (2017) E. Abreu, S. N. Gilbert Corder, S. J. Yun, S. Wang, J. G. Ramírez, K. West, J. Zhang, S. Kittiwatanakul, I. K. Schuller, J. Lu, et al., Phys. Rev. B 96, 094309 (2017), URL https://link.aps.org/doi/10.1103/PhysRevB.96.094309.
- Elsaesser and Woerner (2010) T. Elsaesser and M. Woerner, Acta Crystallogr. Sect. A Found. Crystallogr. 66, 168 (2010), ISSN 01087673.
- (36) See Supplemental Material at [URL] for more information.
- Lobastov et al. (2007) V. A. Lobastov, J. Weissenrieder, J. Tang, and A. H. Zewail, Nano Letters 7, 2552 (2007), URL https://doi.org/10.1021/nl071341e.
- O’Callahan et al. (2015) B. T. O’Callahan, A. C. Jones, J. H. Park, D. H. Cobden, J. M. Atkin, and M. B. Raschke, Nature communications 6, 6849 (2015).
- Dönges et al. (2016) S. A. Dönges, O. Khatib, B. T. O’Callahan, J. M. Atkin, J. H. Park, D. Cobden, and M. B. Raschke, Nano Letters 16, 3029 (2016), URL https://doi.org/10.1021/acs.nanolett.5b05313.
- Evans and Polanyi (1935) M. G. Evans and M. Polanyi, Trans. Faraday Soc. 31, 875 (1935), URL http://dx.doi.org/10.1039/TF9353100875.
- He and Millis (2016) Z. He and A. J. Millis, Phys. Rev. B 93, 115126 (2016), URL https://link.aps.org/doi/10.1103/PhysRevB.93.115126.
- Otto et al. (2017) M. R. Otto, L. P. René de Cotret, M. J. Stern, and B. J. Siwick, Structural Dynamics 4, 051101 (2017), URL https://doi.org/10.1063/1.4989960.
- Chatelain et al. (2012) R. P. Chatelain, V. R. Morrison, C. Godbout, and B. J. Siwick, Applied Physics Letters 101, 081901 (2012), ISSN 00036951, URL http://link.aip.org/link/APPLAB/v101/i8/p081901/s1&Agg=doi.
- Liu et al. (2012) M. Liu, H. Y. Hwang, H. Tao, A. C. Strikwerda, K. Fan, G. R. Keiser, A. J. Sternbach, K. G. West, S. Kittiwatanakul, J. Lu, et al., Nature 487, 345 (2012), URL https://www.nature.com/articles/nature11231?page=3.
- Valverde-Chavez et al. (2015) D. A. Valverde-Chavez, C. S. Ponseca, C. C. Stoumpos, A. Yartsev, M. G. Kanatzidis, V. Sundstrom, and D. G. Cooke, Energy Environ. Sci. 8, 3700 (2015), URL http://dx.doi.org/10.1039/C5EE02503F.
III Methods
III.1 Growth of vanadium dioxide films
The VO2 samples were deposited by pulsed laser deposition and grown to a thickness of 50 nm on top of a 40 nm SiNx substrate. The sample area is 250 m by 250 m and is formed by silicon aperture over the substrate. Details of the deposition process can be found in Hendaoui et al. (2013).
III.2 RF-compressed ultrafast electron diffraction
The ultrafast electron diffraction measurements are carried at K in transmission mode with 90 keV RF-compressed electron pulses which have a bunch charge of pC. The sample and the beamline are under high-vacuum (mBar). The compression cavity is driven by a GHz () phase-locked harmonic tone of the oscillator pulse train and is detuning-compensated by active phase correction at 1 kHz Otto et al. (2017). The laser setup is based on a commercial Ti:Sapphire amplified system (Spectra-Physics Spitfire XP-Pro) operated at a repetition rate of 50–200 Hz (depending on excitation fluence) to allow for sufficient recovery of the VO2 sample between laser pulses. The duration of the optical pump pulse is 35 fs (fwhm) with a spot size of 350 m (fwhm). The details and performance of the ultrafast electron diffraction instrument used in the work is described in detail elsewhere (Otto et al., 2017; Chatelain et al., 2012).
III.3 Time-resolved terahertz spectroscopy
Time-resolved multi-terahertz spectroscopy experiments are based on two-color laser plasma generation of single cycle, broadband THz pulses and air-biased coherent detection providing a spectral range from 0.5–30 THz and temporal resolution of fs. The THz spectrometer is driven by 35 fs duration, 795 nm pulses from an amplified Ti:sapphire femtosecond laser operating at 250 Hz repetition rate to allow for sample recovery between shots. The pump spot size was m which was at least 4 times the size of the THz pulse for the lowest frequencies analyzed here (2 THz). Experiments were performed in transmission at the focus of the THz pulse. The peak THz field strengths estimated to be kV/cm, and under dry air purge gas conditions. At these field strengths no non-linear response of VO2 is expected Liu et al. (2012). Details of the experimental setup can be found in Valverde-Chavez et al. (2015).
IV Author Contributions
B.J.S., D.G.C. and M.C. designed the experiments. M.R.O. and L.P.R. de C. performed the ultrafast electron diffraction experiments. D.V.-C. and K.L.T. performed the THz spectroscopy measurements. N.É. and M.C. fabricated the samples and performed the DC resistivity and XRD measurements. M.R.O. and L.P.R. de C. analyzed the ultrafast electron diffraction data. M.R.O., D.V.-C. and D.G.C. analyzed the THz data. M.R.O., L.P.R. de C., and B.J.S wrote the manuscript. M.R.O and L.P.R. de C. wrote the supplementary material. All authors contributed to revising and editing the manuscript.
V Competing interests
The authors declare no competing financial interests.