On the Transition of the Galaxy Quenching Mode at in CANDELS
Abstract
We investigate the galaxy quenching process at intermediate redshift using a sample of galaxies with between redshift 0.5 and 1.0 in all five CANDELS fields. We divide this sample, using the integrated specific star formation rate (sSFR), into four sub-groups: star-forming galaxies (SFGs) above and below the ridge of the star-forming main sequence (SFMS), transition galaxies and quiescent galaxies. We study their ( versus ) color gradients to infer their sSFR gradients out to twice effective radii. We show that on average both star-forming and transition galaxies at all masses are not fully quenched at any radii, whereas quiescent galaxies are fully quenched at all radii. We find that at low masses () SFGs both above and below the SFMS ridge generally have flat sSFR profiles, whereas the transition galaxies at the same masses generally have sSFRs that are more suppressed in their outskirts. In contrast, at high masses (), SFGs above and below the SFMS ridge and transition galaxies generally have varying degrees of more centrally-suppressed sSFRs relative to their outskirts. These findings indicate that at the main galaxy quenching mode depends on its already formed stellar mass, exhibiting a transition from “the outside-in” at to “the inside-out” at . In other words, our findings support that internal processes dominate the quenching of massive galaxies, whereas external processes dominate the quenching of low-mass galaxies.
1 Introduction
Studying the spatial distribution of specific star formation rate () is helpful to understand how stellar mass () is built up in galaxies as they evolve along the star formation main sequence (SFMS, Brinchmann et al., 2004; Noeske et al., 2007; Elbaz et al., 2007; Whitaker et al., 2014), and how and where the star formation shuts down as galaxies move off the SFMS to become fully quiescent. Broadly speaking, there are two types of processes responsible for cessation of star formation in galaxies: the internal and the external processes. The internal processes quench star formation due to the intrinsic properties of galaxies, such as central compaction (Fang et al., 2013; Liu et al., 2016; Barro et al., 2017; Whitaker et al., 2017), AGN feedback (Croton et al., 2006) and supernova feedback (Geach et al., 2014), which scale with the stellar mass of galaxies (“mass-quenching”; e.g., Peng et al., 2010). The internal processes first deplete the gas in the centers of galaxies or blow it out of the centers, causing “the inside-out” quenching. The external processes, like the environmental effects (e.g., Peng et al., 2012; Geha et al., 2012; Guo et al., 2017), strip the gas content of galaxies first from their outskirts, causing “the outside-in” quenching. The two types of processes are expected to change the radial sSFR profile of a galaxy in a different way during its quenching process.
Encouraging progress has recently been made in understanding the radial gradients of sSFR, traced by and rest-frame UV-optical colors, in distant star-forming galaxies (SFGs) (e.g., Wuyts et al., 2012; Nelson et al., 2012, 2016a, 2016b; Liu et al., 2016, 2017; Wang et al., 2017; Tacchella et al., 2017)). These studies typically find either flat sSFR gradients (in galaxies with at and galaxies with at ) or somewhat centrally-suppressed sSFRs (in galaxies with at and galaxies with at ). A correction for dust gradient was shown to be one of the main sources of uncertainty that makes studying the sSFR gradients in distant SFGs challenging (Wuyts et al., 2013; Liu et al., 2016, 2017; Wang et al., 2017; Tacchella et al., 2017; Nelson et al., 2018).
Rest-frame ( versus ) diagram has been widely used to separate quenched from dusty/star-forming galaxies (e.g., Wuyts et al., 2007; Williams et al., 2009; Patel et al., 2011; Brammer et al., 2011). More recently, it has also been successfully utilized to determine sSFR and values, which are broadly consistent with the values derived from fitting reddened stellar population models to broad-band spectral energy distributions (SEDs) of galaxies covering UV to mid-infrared (Fang et al., 2017). Furthermore, Wang et al. (2017) demonstrated that rest-frame ( versus ) diagram is as useful as the diagram for distinguishing sSFR from dust extinction.
In cosmological simulations, Tacchella et al. (2016a, b) predict that, at high redshifts (), the galaxy evolution across the SFMS is associated with events of wet compaction into compact star-forming systems, which trigger central gas depletion and the formation of an extended gas ring around it. The Tacchella et al. simulations reveal that the high-sSFR galaxies at the upper envelope of the SFMS and the lower-sSFR galaxies at the lower envelope of the SFMS have different properties, which is closely related to the quenching process of galaxies.
With the aim to understand the star formation quenching process in distant galaxies, in this work we select a sample of 4377 galaxies with between redshift 0.5 and 1.0 from all five CANDELS fields. With this sample, we investigate the color gradients and inferred sSFR gradients in various galaxy populations (i.e., star-forming galaxies, transition galaxies and quiescent galaxies). We specifically follow Tacchella et al. (2016a, b) to divide our SFGs at intermediate redshifts into above and below the ridge of the SFMS, since this further classification is likely helpful to shed light on whether the shape of sSFR profiles start to vary during the evolution across the SFMS. We show that these different populations of galaxies have varying degrees of color and sSFR gradients. We find that the main quenching mode of a galaxy at depends on its already formed stellar mass, and it is outside-in for galaxies with , and inside-out for galaxies with . Throughout the paper, we adopt a cosmology with a matter density parameter , a cosmological constant and a Hubble constant of . All magnitudes are in the AB system.
2 DATA
CANDELS (Grogin et al., 2011; Koekemoer et al., 2011) is an HST Multi-Cycle Treasury Program to image portions of five commonly studied legacy fields (COSMOS, EGS, GOODS-N, GOODS-S and UDS). The CANDELS group has made a multi-wavelength photometry catalog for each field. Photometry in HST/WFC3 and ACS was measured by running SExtractor in dual model on the point spread function (PSF)-matched images, with the F160W image as the detection image. Photometry in the lower-resolution images (e.g., ground-based and IRAC) was measured using TFIT (Laidler et al., 2007). We refer readers to Guo et al. (2013), Galametz et al. (2013), Nayyeri et al. (2017), Stefanon et al. (2017), and Barro et al. (in preparation) for details.
Redshifts used in this work are in the priority order of secure spectroscopic (flagged as “very secure” or “reliable”), good grism (at least two users agree that it is good) and photometric redshifts if available. Spectroscopic redshifts were recently re-compiled by N. P. Hathi (private communication) for all five CANDELS fields, which include publicly available (e.g., Santini et al., 2015, and reference therein) and unpublic (e.g., UCR DEIMOS Survey) redshifts. Grism redshifts came from the 3D-HST/CANDELS Survey (e.g., Morris et al., 2015; Momcheva et al., 2016). Photometric redshifts were estimated using the multi-wavelength photometry catalogs and adopting a hierarchical Bayesian approach (Dahlen et al., 2013). The typical scatter of photometric redshifts spans from 0.03 to 0.06 in . Rest-frame integrated magnitudes from to were computed using EAZY (Brammer et al., 2008), which fits a set of galaxy SED templates to the multi-wavelength photometry, with the redshifts as inputs.
Stellar masses were computed using FAST (Kriek et al., 2009) and based on a grid of Bruzual & Charlot (2003) models that assume a Chabrier (2003) IMF, declining -models, solar metallicity and a Calzetti et al. (2000) dust law. The typical formal uncertainty in stellar mass is dex. SFRs were computed from rest-frame luminosities at that are corrected for extinction by applying a foreground-screen Calzetti reddening law (): (Kennicutt & Evans, 2012). Fang et al. (2017) showed that the sSFRs by this method are consistent with those derived from UV and far-IR luminosities in a broad range, with typical scatter of dex. We adopted the median that was calculated by combining results from four methods (see labeled , , and in Santini et al., 2015) if available. These methods were chosen based on the same assumptions (Chabrier IMF and the Calzetti dust law). The typical formal uncertainty in is mag. Effective radius along the semi-major axis () and minor-to-major axis ratio () were measured from the F125W images using GALFIT (Peng et al., 2002) by van der Wel et al. (2012).
Spatially-resolved data is taken from the HST-based multi-band and multi-aperture photometry catalogs of CANDELS still under construction by Liu et al. (in preparation). These datasets include the radial profiles of isophotal ellipticity () and disky/boxy parameter in both F125W and F160W, and the observed surface brightness profiles in all HST/ACS (F435W, F606W, F775W, F814W and F850LP) bands and WFC3 (F105W, F125W, F140W and F160W) bands if available. Preliminary imaging reduction prior to multi-aperture photometry can be found in Jiang et al. (2018). The photometry was done by using the IRAF routine ellipse within STSDAS, which is based on a technique described by Jedrzejewski (1987). For galaxies used in this work, we fixed the galaxy geometric centers, ellipticities and position angles obtained from the GALFIT measurements along the semi-major axes for all available bands. Rest-frame , and band surface brightness profiles were then computed using EAZY (Brammer et al., 2008) by fitting the best-fit SEDs in each photometry annulus (refer to Figure 2 in Liu et al., 2016).
3 Sample Selection
| Criterion | GOODS-S | UDS | GOODS-N | EGS | COSMOS | Combined |
|---|---|---|---|---|---|---|
| Full catalog | 34930(100%) | 35932(100%) | 35445 (100%) | 41457(100%) | 38671(100%) | 186435(100%) |
| Hmag 24.5 | 8293(23.74%) | 9671(26.91%) | 9460(26.69%) | 11292(27.24%) | 11811(30.54%) | 50527(27.10%) |
| PhotFlag=0 | 8104(23.20%) | 9151(25.47%) | 9011(25.42%) | 7521(18.14%) | 7603(19.66%) | 41084(22.04%) |
| CLASSSTAR0.9 | 7901(22.62%) | 8952(24.91%) | 8815(24.87%) | 7252(17.49%) | 7297(18.86%) | 40217(21.57%) |
| 2460(7.04%) | 2331(6.49%) | 2746(7.75%) | 1950(4.70%) | 2457(6.35%) | 11944(6.41%) | |
| 1291(3.70%) | 1293(3.60%) | 1632(4.60%) | 952(2.30%) | 1428(3.69%) | 6596(3.54%) | |
| GALFIT flag(J) = 0 or 1 | 1232(3.53%) | 1246(3.47%) | 1572(4.44%) | 933(2.25%) | 1373(3.55%) | 6356(3.41%) |
| 1092(3.13%) | 1089(3.03%) | 1369(3.86%) | 814(1.96%) | 1181(3.05%) | 5545(2.97%) | |
| Accurate multi-band SBPs | 963(2.76%) | 828(2.30%) | 1210(3.41%) | 681(1.64%) | 695(1.80%) | 4377(2.38%) |
In order to maximize the sample size, we select galaxies from all five CANDELS fields
by applying the following criteria to the above catalogs:
-
1.
Observed F160W() magnitude brighter than 24.5 to ensure high signal-to-noise ratios (S/Ns).
-
2.
SExtractor and to exclude spurious sources and stars.
-
3.
Redshifts within and stellar masses to maintain high mass completeness and to guarantee the accuracy of rest-frame , and band spatially-revolved data. Note that the HST imaging in CANDELS ends at observed band, which roughly corresponds to the rest-frame band for galaxies at .
-
4.
GALFIT quality (good fit) or (suspicious fit) in F125W (van der Wel et al., 2012) to ensure well-constrained measurements of structural parameters (i.e., effective radius and minor-to-major axis ratio) and eliminate mergers and disturbed objects.
-
5.
to minimize the PSF effects on color gradient measurement. This lack of sample completeness cannot be avoided for this study given the limited resolution of HST imaging (see Appendix).
-
6.
Accurate measurements of the surface brightness profiles (SBPs) from center to in at least two ACS bands and two WFC3 bands simultaneously to guarantee the accuracy of SED modelling in each photometry annulus. Almost all () of galaxies after this cut have accurate multi-aperture photometry in , , and , which cover all three rest-frame U, V and I bands at .

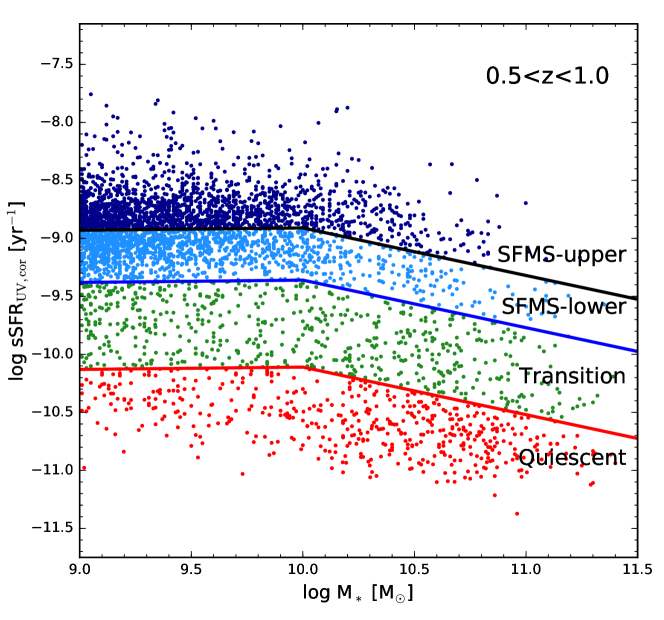
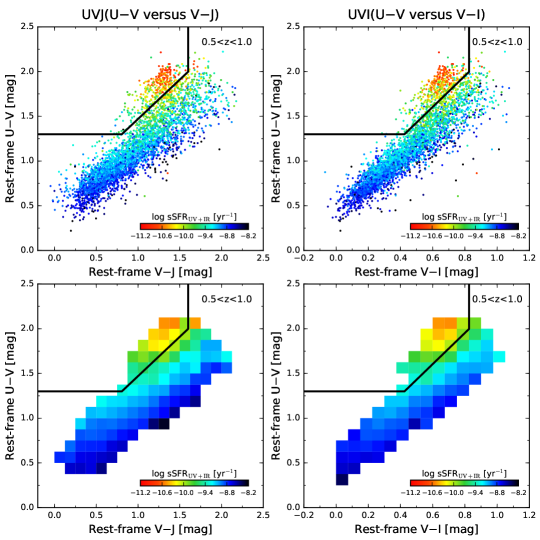
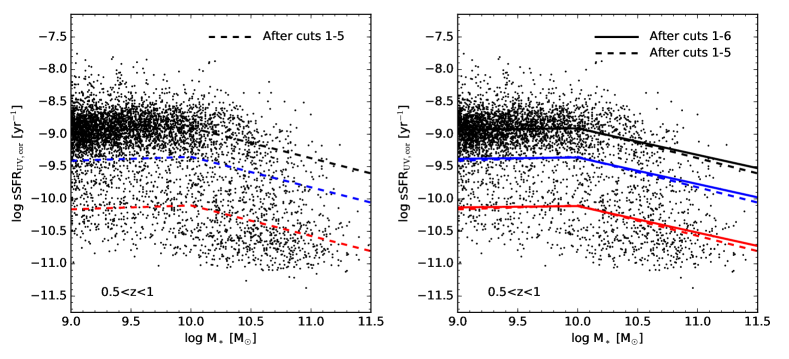
Table 1 details our selection criteria and the resulting sample sizes after each cut for each field. A detailed discussion on sample completeness by these criteria is given in Appendix. After the cuts 1-5, we select 5545 galaxies in total from all five CANDELS fields. Furthermore, 4377 galaxies remain after the sixth cut, of which we utilized their spectroscopic redshifts for 1132 () galaxies, grism redshifts for 2152 () galaxies and photometric redshifts for 1093 () galaxies. Figure 1 shows the distributions of galaxies on the and planes for total sample and a nearly face-on () subsample after the cuts 1-5, respectively. It can be seen that reproduces all the main features of , including the quenched region and the distinctive stripe patterns of sSFR, which is in agreement with the results initially presented by Wang et al. (2017). In Appendix, we show that these main features on and diagrams are still strong for UV+IR rates, which strengths our analysis in this work. However, given that SFRs involving IR data are subject to their own set of systematic biases (see Appendix), it is reasonable to adopt the UV-based rates.
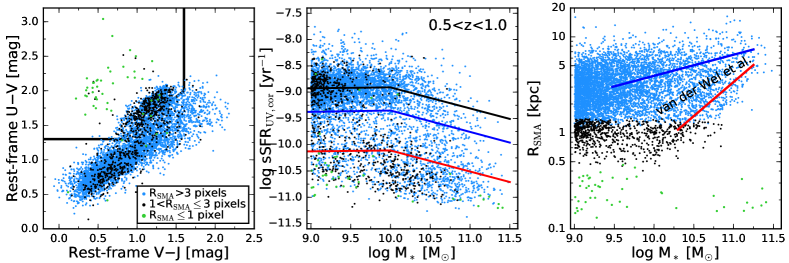
In Figure 2, we show the sSFR-mass relation for our final sample of galaxies. Recent works (e.g., Whitaker et al., 2014; Lee et al., 2015) showed that the SFMS is not consistent with a single power-law at . Instead, it is better fitted by a broken power-law, such that below a characteristic mass () of , the SFMS has a redshift-independent slope of . Above , the SFMS has a shallow slope. At , the characteristic mass is (Whitaker et al., 2014; Tomczak et al., 2016). Such the feature is obvious in our data. To derive the SFMS relation of our galaxies, an initial fit to all -defined SFGs is made; objects more than 2 away from the fit are then excluded for the next fit. This fitting process is repeated until no new objects are excluded. The best broken power-law fits to the SFMS of our galaxies are shown as black lines in Figure 2, and are described by the following equations: for and for
To quantify the relative star formation activity in galaxies in a given
mass bin, we compute the vertical offsets in
from the best-fit SFMS. The offset for a given galaxy
is denoted by .
Galaxies lying above (below) the best-fit SFMS are defined to
have positive (negative) residuals. We then adopt
to divide our galaxies into the following four sub-groups:
a. – SFGs above the SFMS ridge,
b. – SFGs below the SFMS ridge,
c. – transition galaxies,
d. – quiescent galaxies.
The use of this relative quantity () for
classification means that our results are insensitive to the exact zero points and slopes of the fits.
The SFMS has a dispersion of in the logarithmic scale. The two thresholds of (blue lines) and (red lines) correspond to and below the ridge of the SFMS, respectively. We have checked that a change of for our thresholds does not affect our conclusions.
4 Results and Analysis
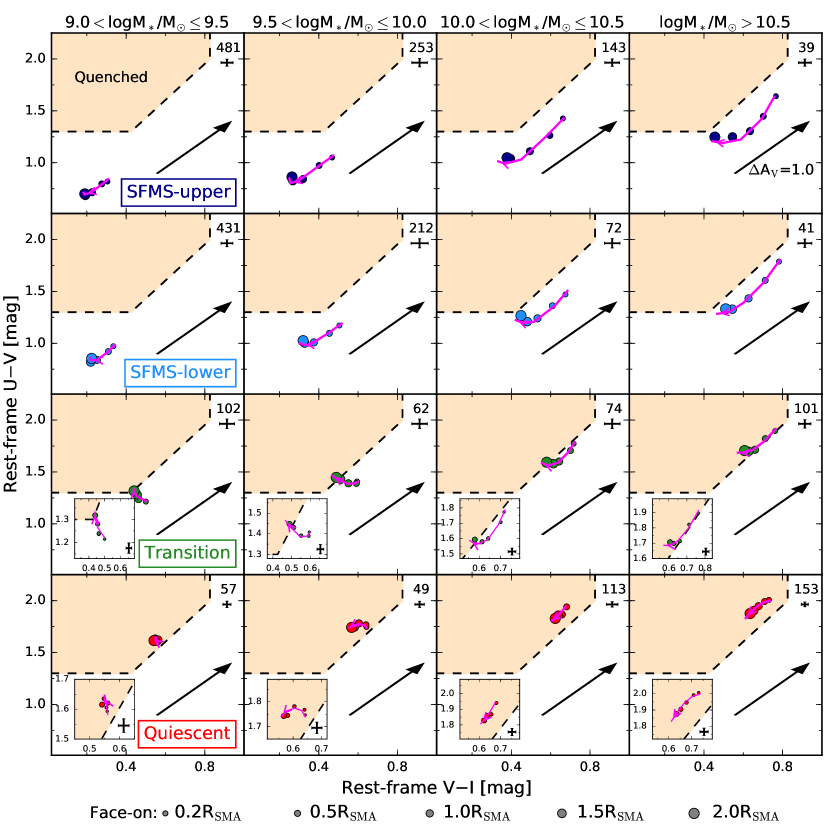
Following the work of Wang et al. (2017), in Figure 3 we show raw stacked color trajectories in -space for four sub-groups of total sample galaxies in four stellar mass bins, , , and , respectively. Color profiles in the same mass bins are stacked by first normalizing the radial positions of each galaxy by its and then computing the median colors at the selected normalized positions. In each panel, five radial locations are indicated by solid circles with increasing size, ranging from 0.2 at the innermost to 2.0 at the outermost. The arrows indicate the Calzetti reddening vector. The typical errors of the stacked colors are given for each panel, which are the average of the standard errors of median colors at all radii. An example is given in Appendix to illustrate our estimate on the standard errors of median colors at a given radius. In addition, we correct the PSF effects by adopting the method of Szomoru et al. (2011). The corrected light profiles are first generated by adding the residuals from fitting the raw light profiles with the PSF-convolved single Sérsic model (Sérsic, 1968) onto the Sérsic profiles. The resultant color trajectories are overplotted as magenta solid curves with increasing radii indicated by an arrow in Figure 3. As can be seen, the PSF-correction stretches the length of color gradients on the diagram by making galaxy colors slightly redder in the centers and bluer in the outskirts. However, the overall effect on color gradients is not large, which is consistent with our evaluation in Appendix and that by Wang et al. (2017). To minimize the interplay between stellar population and dust reddening changes, in Figure 4 we additionally show the color trajectories for a subsample of nearly face-on () galaxies. These two figures for the two samples are similar. Main features in common are listed as follows:
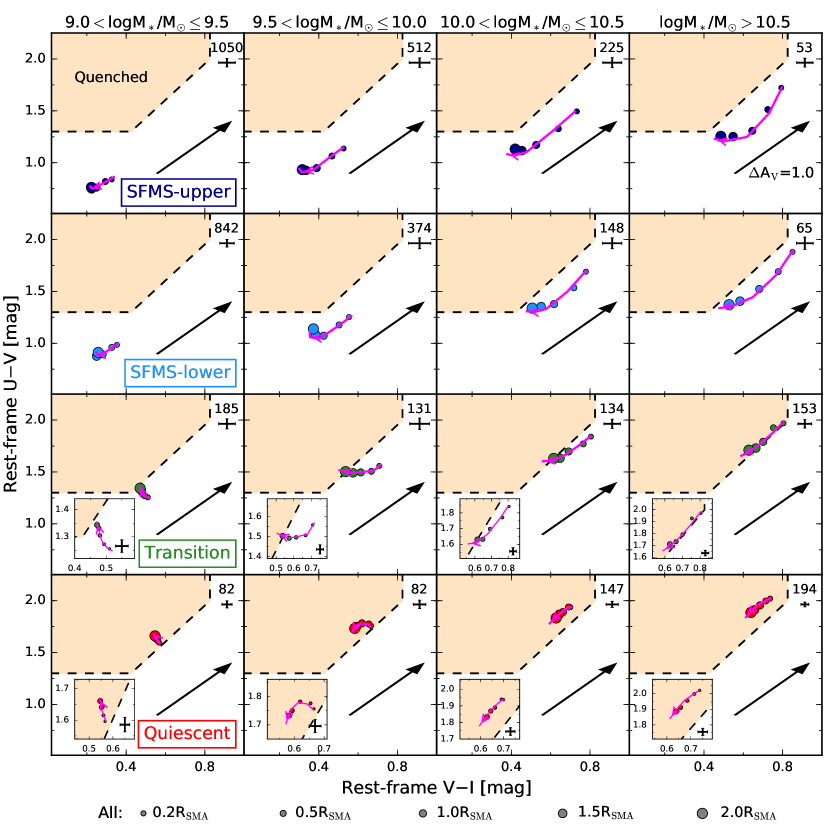
-
1.
For all mass ranges, all median color data points of SFGs both above and below the SFMS ridge lie well within the star-forming region. For high-mass transition galaxies with , all their median colors lie close to the boundary that separates quenched from non-quenched galaxies. On the other hand, all median colors except for the ones in inner regions () of low-mass () transition galaxies lie still in the star-forming region of the diagram. The median colors of quiescent galaxies at all radii lie well within the quenched region for all mass ranges.
-
2.
The magnitudes of trajectories of SFGs are much larger than those of transition and quiescent galaxies. This is likely due to significant amounts of dust reddening in SFGs, because the magnitudes of their trajectories are elongated along the direction of reddening vector.
-
3.
The trajectories of SFGs both above and below the SFMS are roughly parallel to the reddening vector, except that the centers in most massive bins obviously deviate toward the quenched region and the slight upturns appear in the outermost parts near . These features have been captured for the entire population of SFGs and well studied by Wang et al. (2017).
-
4.
The color trajectories of transition galaxies with and those with have different shapes, which indicates that the low-mass galaxies and high-mass galaxies have different sSFR gradients.
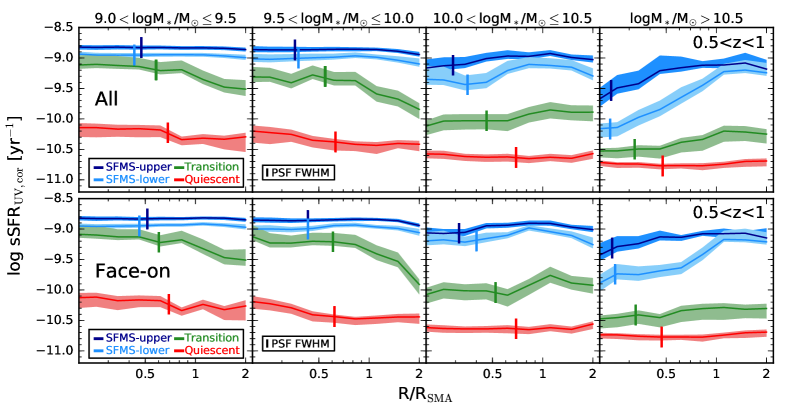
We now turn to the task of converting color trajectories into the sSFR profiles following the method of Wang et al. (2017). To create the maps of sSFR on the planes of Figure 1b and Figure 1d, we first divide each distribution into multiple mag rectangles. In each rectangle we compute the median CANDELS values of integrated sSFR and assign them to the center of the rectangle. Then, given any position on each plane, the corresponding sSFR values can be obtained by linearly interpolating among the nearby rectangle centers. This method makes it possible to deduce sSFR values from with an accuracy of 0.15 dex (see §3 in Wang et al., 2017). Adopting this calibration, the PSF-corrected color trajectories are converted to radial sSFR profiles, as shown in Figure 5. It can be seen that, for lower mass bins (), SFGs both above and below the SFMS ridge generally have flat sSFR profiles, whereas the transition galaxies in the same mass ranges generally have negative sSFR gradients (sSFRs in the outskirts are more suppressed). In contrast, for the most massive bins (), SFGs above and below the SFMS ridge and transition galaxies generally have varying degrees of positive sSFR gradients (more centrally-suppressed sSFRs relative to their outskirts). As expected, nearly flat or relatively weak sSFR gradients are observed in quiescent galaxies at all masses. The outside-in quenching for lower mass bins is indicated by the drop in sSFR of the transition galaxies, whereas the inside-out quenching for the most massive bins is best indicated by the rising sSFR of the lower SFMS galaxies. The results from inferred sSFR are in good agreement with those from the directly observed data of color gradients.
5 Discussion and Conclusion
We select a sample of 4377 large () galaxies with between redshift 0.5 and 1.0 in all five CANDELS fields. These galaxies have well-measured, HST multi-band multi-aperture photometry data within in CANDELS. We investigate the stacked color gradients and inferred sSFR gradients in various galaxy populations (quiescent galaxies, transition galaxies, and star-forming galaxies divided into above and below the ridge of the SFMS) in different mass bins.
We show that, for all mass ranges, star-forming galaxies, on average, are not fully quenched at any radii, above the resolution limit of (1.3kpc), whereas quiescent galaxies are fully quenched at all radii above this limit for all mass ranges. At all radii, the median UVI colors of high-mass transition galaxies with lie close to the boundary that separates quenched from non-quenched galaxies in the UVI diagram. In contrast, all median colors except for the ones in their inner regions () of low-mass () transition galaxies lie still in the star-forming region of the diagram.
At low masses (), SFGs both above and below the SFMS ridge generally have flat sSFR profiles, whereas the transition galaxies at the same masses have sSFRs that are more suppressed in the outskirts. In contrast, at high masses (), SFGs above and below the SFMS ridge and transition galaxies have varying degrees of more centrally-suppressed sSFRs relative to their outskirts. These findings indicate that at the main galaxy quenching mode depends on its already formed stellar mass, exhibiting a transition from “the outside-in” at to “the inside-out” at . The sSFR profiles in massive galaxies start to vary when they are on the SFMS, whereas the sSFR profiles in the lower-mass galaxies start to vary when they move off the SFMS. Similar trend is also observed in local galaxies (Pérez et al., 2013; Pan et al., 2015; Belfiore et al., 2017). This pattern is broadly consistent with the prediction of Tacchella et al. (2016a, b) in cosmological simulations that a transition from outside-in to inside-out quenching occurs near a critical mass, . Our results support that the internal processes (i.e., central compaction, AGN feedback and supernova feedback) dominate the quenching of massive galaxies, whereas the external processes (i.e., environmental effects) dominate the quenching of low-mass galaxies.
We have checked that our main results are unchanged under the stacking by physical radius rather than scaled radius. We stress that the inferred sSFR gradients are in good agreement with our raw data of color gradients. The former, however, depends on the conventional SED modeling assumptions (i.e., -models, solar metallicity and a foreground-screen Calzetti reddening law). We refer the reader to Wang et al. (2017) for discussions about the effects of these assumptions on sSFR gradients in SFGs (see §8.2 and Appendix in their paper). The Wang et al.’s critique shows that, as long as stellar populations are reasonably uniform throughout a galaxy, these assumptions do not significantly affect the gradients in SFGs. It is still unclear what biases these assumptions can bring to the inferred sSFR gradients in transition and quiescent galaxies. The star formation histories of these populations are different from that of star-forming galaxies. Nevertheless, the resulting sSFR gradients in these populations based on the standard assumptions are consistent with the observed UVI color gradients, which are independent of any assumptions.
We caution that there are important ambiguities for highly-quenched populations, due to the degeneracies among the effects of dust, stellar age and metallicity on color gradients. Therefore, our conclusions for these objects are tentative. When we convert their color trajectories to sSFR gradients, we find no significant trend for the most massive bins. If these objects contain little or no dust (see Figure 11 in Fang et al., 2017) and their age (sSFR) gradients are flat, as shown in Figure 5, metallicity effects would play an important role. This is quite similar to the origin of optical color gradients in nearby early-type galaxies (e.g., Wu et al., 2005). In contrast, for lower mass bins we indeed see a trend that the centers are slightly younger than the outer parts. This trend is indicated by a clear transverse motion of the gradients across loci of constant sSFR. Overall, the resulting quiescent trend agrees with a similar trend in transition galaxies at the same masses, suggesting that the two classes of galaxies are evolutionarily linked, as we would expect, since the mass difference between transition and quiescent galaxies should be small. We also caution that perhaps gradients in lower-mass quiescent galaxies cannot be resolved simply because they are too small. Future works should investigate the consequences of more realistic stellar population models, metallicity, and dust extinction law.
References
- Barro et al. (2017) Barro, G., Faber, S. M., Koo, D. C., et al. 2017, ApJ, 840, 47
- Belfiore et al. (2017) Belfiore, F., Maiolino, R., Bundy, K., et al. 2017, ArXiv e-prints, arXiv:1710.05034
- Brammer et al. (2008) Brammer, G. B., van Dokkum, P. G., & Coppi, P. 2008, ApJ, 686, 1503
- Brammer et al. (2011) Brammer, G. B., Whitaker, K. E., van Dokkum, P. G., et al. 2011, ApJ, 739, 24
- Brinchmann et al. (2004) Brinchmann, J., Charlot, S., White, S. D. M., et al. 2004, MNRAS, 351, 1151
- Bruzual & Charlot (2003) Bruzual, G., & Charlot, S. 2003, MNRAS, 344, 1000
- Calzetti et al. (2000) Calzetti, D., Armus, L., Bohlin, R. C., et al. 2000, ApJ, 533, 682
- Chabrier (2003) Chabrier, G. 2003, PASP, 115, 763
- Croton et al. (2006) Croton, D. J., Springel, V., White, S. D. M., et al. 2006, MNRAS, 365, 11
- Dahlen et al. (2013) Dahlen, T., Mobasher, B., Faber, S. M., et al. 2013, ApJ, 775, 93
- Elbaz et al. (2007) Elbaz, D., Daddi, E., Le Borgne, D., et al. 2007, A&A, 468, 33
- Fang et al. (2013) Fang, J. J., Faber, S. M., Koo, D. C., & Dekel, A. 2013, ApJ, 776, 63
- Fang et al. (2017) Fang, J. J., Faber, S. M., Koo, D. C., et al. 2017, ArXiv e-prints, arXiv:1710.05489
- Galametz et al. (2013) Galametz, A., Grazian, A., Fontana, A., et al. 2013, ApJS, 206, 10
- Geach et al. (2014) Geach, J. E., Hickox, R. C., Diamond-Stanic, A. M., et al. 2014, Nature, 516, 68
- Geha et al. (2012) Geha, M., Blanton, M. R., Yan, R., & Tinker, J. L. 2012, ApJ, 757, 85
- Grogin et al. (2011) Grogin, N. A., Kocevski, D. D., Faber, S. M., et al. 2011, ApJS, 197, 35
- Guo et al. (2013) Guo, Y., Ferguson, H. C., Giavalisco, M., et al. 2013, ApJS, 207, 24
- Guo et al. (2017) Guo, Y., Bell, E. F., Lu, Y., et al. 2017, ApJL, 841, L22
- Jedrzejewski (1987) Jedrzejewski, R. I. 1987, MNRAS, 226, 747
- Jiang et al. (2018) Jiang, D., Liu, F. S., Zheng, X., et al. 2018, ApJ, 854, 70
- Kennicutt & Evans (2012) Kennicutt, R. C., & Evans, N. J. 2012, ARA&A, 50, 531
- Koekemoer et al. (2011) Koekemoer, A. M., Faber, S. M., Ferguson, H. C., et al. 2011, ApJS, 197, 36
- Kriek et al. (2009) Kriek, M., van Dokkum, P. G., Labbé, I., et al. 2009, ApJ, 700, 221
- Laidler et al. (2007) Laidler, V. G., Papovich, C., Grogin, N. A., et al. 2007, PASP, 119, 1325
- Lee et al. (2015) Lee, N., Sanders, D. B., Casey, C. M., et al. 2015, ApJ, 801, 80
- Liu et al. (2016) Liu, F. S., Jiang, D., Guo, Y., et al. 2016, ApJL, 822, L25
- Liu et al. (2017) Liu, F. S., Jiang, D., Faber, S. M., et al. 2017, ApJL, 844, L2
- Momcheva et al. (2016) Momcheva, I. G., Brammer, G. B., van Dokkum, P. G., et al. 2016, ApJS, 225, 27
- Morris et al. (2015) Morris, A. M., Kocevski, D. D., Trump, J. R., et al. 2015, AJ, 149, 178
- Nayyeri et al. (2017) Nayyeri, H., Hemmati, S., Mobasher, B., et al. 2017, ApJS, 228, 7
- Nelson et al. (2012) Nelson, E. J., van Dokkum, P. G., Brammer, G., et al. 2012, ApJL, 747, L28
- Nelson et al. (2016a) Nelson, E. J., van Dokkum, P. G., Förster Schreiber, N. M., et al. 2016a, ApJ, 828, 27
- Nelson et al. (2016b) Nelson, E. J., van Dokkum, P. G., Momcheva, I. G., et al. 2016b, ApJL, 817, L9
- Nelson et al. (2018) Nelson, E. J., Tadaki, K.-i., Tacconi, L. J., et al. 2018, ArXiv e-prints, arXiv:1801.02647
- Noeske et al. (2007) Noeske, K. G., Weiner, B. J., Faber, S. M., et al. 2007, ApJL, 660, L43
- Pan et al. (2015) Pan, Z., Li, J., Lin, W., et al. 2015, ApJL, 804, L42
- Patel et al. (2011) Patel, S. G., Kelson, D. D., Holden, B. P., Franx, M., & Illingworth, G. D. 2011, ApJ, 735, 53
- Peng et al. (2002) Peng, C. Y., Ho, L. C., Impey, C. D., & Rix, H.-W. 2002, AJ, 124, 266
- Peng et al. (2012) Peng, Y.-j., Lilly, S. J., Renzini, A., & Carollo, M. 2012, ApJ, 757, 4
- Peng et al. (2010) Peng, Y.-j., Lilly, S. J., Kovač, K., et al. 2010, ApJ, 721, 193
- Pérez et al. (2013) Pérez, E., Cid Fernandes, R., González Delgado, R. M., et al. 2013, ApJL, 764, L1
- Rujopakarn et al. (2013) Rujopakarn, W., Rieke, G. H., Weiner, B. J., et al. 2013, ApJ, 767, 73
- Santini et al. (2015) Santini, P., Ferguson, H. C., Fontana, A., et al. 2015, ApJ, 801, 97
- Sérsic (1968) Sérsic, J. L. 1968, Atlas de Galaxias Australes
- Stefanon et al. (2017) Stefanon, M., Yan, H., Mobasher, B., et al. 2017, ApJS, 229, 32
- Straatman et al. (2016) Straatman, C. M. S., Spitler, L. R., Quadri, R. F., et al. 2016, ApJ, 830, 51
- Szomoru et al. (2011) Szomoru, D., Franx, M., Bouwens, R. J., et al. 2011, ApJL, 735, L22
- Tacchella et al. (2016a) Tacchella, S., Dekel, A., Carollo, C. M., et al. 2016a, MNRAS, 458, 242
- Tacchella et al. (2016b) —. 2016b, MNRAS, 457, 2790
- Tacchella et al. (2017) Tacchella, S., Carollo, C. M., Forster Schreiber, N. M., et al. 2017, ArXiv e-prints, arXiv:1704.00733
- Tomczak et al. (2016) Tomczak, A. R., Quadri, R. F., Tran, K.-V. H., et al. 2016, ApJ, 817, 118
- van der Wel et al. (2012) van der Wel, A., Bell, E. F., Häussler, B., et al. 2012, ApJS, 203, 24
- van der Wel et al. (2014) van der Wel, A., Franx, M., van Dokkum, P. G., et al. 2014, ApJ, 788, 28
- Wang et al. (2017) Wang, W., Faber, S. M., Liu, F. S., et al. 2017, MNRAS, 469, 4063
- Whitaker et al. (2014) Whitaker, K. E., Franx, M., Leja, J., et al. 2014, ApJ, 795, 104
- Whitaker et al. (2017) Whitaker, K. E., Bezanson, R., van Dokkum, P. G., et al. 2017, ApJ, 838, 19
- Williams et al. (2009) Williams, R. J., Quadri, R. F., Franx, M., van Dokkum, P., & Labbé, I. 2009, ApJ, 691, 1879
- Wu et al. (2005) Wu, H., Shao, Z., Mo, H. J., Xia, X., & Deng, Z. 2005, ApJ, 622, 244
- Wuyts et al. (2007) Wuyts, S., Labbé, I., Franx, M., et al. 2007, ApJ, 655, 51
- Wuyts et al. (2011) Wuyts, S., Förster Schreiber, N. M., Lutz, D., et al. 2011, ApJ, 738, 106
- Wuyts et al. (2012) Wuyts, S., Förster Schreiber, N. M., Genzel, R., et al. 2012, ApJ, 753, 114
- Wuyts et al. (2013) Wuyts, S., Förster Schreiber, N. M., Nelson, E. J., et al. 2013, ApJ, 779, 135
Appendix A patterns on and Planes
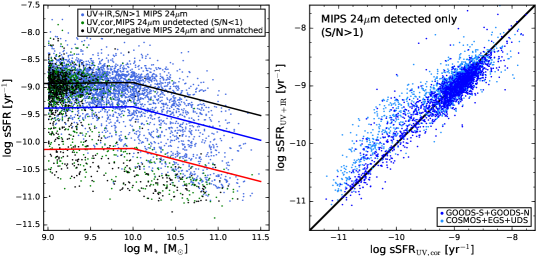
We follow the Rujopakarn et al. (2013) method to derive of our sample galaxies. Only F160W objects that are identified as the nearest neighbor to a MIPS source are retained. As a result, of 5545 galaxies satisfying our selection criteria 1-5, 3790 () have MIPS detections, 957 are undetected in MIPS photometry (), 782 have negative MIPS fluxes, and 16 are unmatched. We then use the formula presented in Wuyts et al. (2011) to calculate the UV+IR SFRs for MIPS-detected subsample:
| (A1) |
where is the integrated 81000 m luminosity inferred from MIPS , and L is the rest-frame near-UV luminosity, measured at 2800Å. In Figure 6, we re-plot the sSFR-mass relation of all galaxies (left) and make a direct comparison between and for -detected objects only (right). As can be seen, in our redshift range, the UV+IR rates are biased at lower masses and for lower-sSFR objects. The based method tends to slightly overestimate the SFRs for high-sSFR galaxies, which is in agreement with the assessment of Fang et al. (2017). For lower-sSFR objects (i.e., transition and quiescent galaxies), are systematically higher than . This inconsistency likely originates from the uncertainty of MIPS photometry (i.e., the deepest IR data available in GOODS-S and GOODS-N gives better consistency than the other three fields) or it is because the flux in these objects comes, at least in part, from sources other than dust heated by conventional star formation (i.e., from old stars, see Fang et al., 2017, and reference therein for discussions). For these reasons, it is reasonable to adopt the UV-based rates especially when sSFR is low, as we do in this paper. In Figure 7, we re-plot the and planes for the MIPS detected subsample only, this time galaxies are color-coded by their . Each individual is color-coded in the top two panels, whereas the median value in each bin is color-coded in the bottom two panels, which contains at least 5 objects. It can be seen that statistically the main features, including the quenched region and the distinctive stripe patterns of sSFR, are still strong when using independent UV+IR SFRs. This is in agreement with the result of Straatman et al. (2016, Figure 25), which strengthens our analysis in this work.
Appendix B Sample Completeness
We discuss the resulting sample completeness by our selection criteria. First, the criterion (criterion 1) can select relatively complete mass-limited samples of both blue and red galaxies above in the redshift range (criterion 3) (see Figure 2 in van der Wel et al., 2014). Second, SExtractor parameter cut (criterion 2) is as powerful as colors to separate galaxies from stars (see Figure 18 in Guo et al., 2013). Of particular notes are the criteria 4-6. The GALFIT cut (criterion 4) excludes of sample galaxies after the cuts 1-3. Visual inspection shows that these galaxies discarded by this cut are either mergers or strongly contaminated by neighbor objects. The multi-aperture photometry on these objects by using the IRAF routine ellipse usually fails. Furthermore, to minimize the PSF effects on color measurement (see below), we applied the angular size cut, (criterion 5). In Figure 8, we show the diagram, sSFR-mass relation and size-mass relation for both large and small galaxies after the cuts 1-4. As seen from the plots, the angular size cut preferentially removes more low-mass galaxies below . This lack of sample completeness in this work cannot be avoided given the limited available resolution of images (Wang et al., 2017), otherwise the resulting color gradients of very small galaxies are likely artificial. In Figure 9, we show that, in the sSFR-mass space, the distribution of galaxies satisfying the criteria 1-6 is quite similar to that satisfying the criteria 1-5, which indicates that the criterion 6 does not create significant bias for this analysis. Finally, to enable the reader to know which bin is impacted the most, in Table 2 we specifically provide the resulting sample sizes by each cut after the third criterion for each sub-group in different mass bins.
Appendix C PSF Effects on the measurement of Color Gradients
In the documentation of the CANDELS HST multi-band and multi-aperture photometry catalogs still under construction by Liu et al. (in preparation), we will make a detailed assessment on the PSF effects. So far the effects of PSF mis-matching and PSF smearing on derived color gradients have been evaluated as below.
C.1 Effect of the PSF mis-matching
Stars should have no observed color gradients, so the color difference between any two observed bands should be zero at all radii. To check this, we have carefully selected some unsaturated stars brighter than 24 magnitude with in the GOODS-S field. Figure 10 shows their integrated color differences between and bluer bands (, and ). The result indicates that and are under-smoothed so the centers of the stars are bluer than the total colors (i.e., artificially bluer than what they should be). is over-smoothed so the centers are redder there. These trends are similar to those in the GOODS-S photometry paper (Guo et al., 2013). This is probably the best we can do with IRAF/PSFMATCH program. At pixels (), the median deviations (red circles) in and are almost zero. The deviation in is larger, but still less than 0.025 mag.
C.2 Effect of the PSF smearing
Besides the mis-matching issue among different bands addressed above, the effect of PSF smearing can also make the observed color gradients different from the intrinsic ones, especially for galaxies with small angular sizes and the galaxy central regions. We systematically evaluate this effect by modeling mock galaxies with various shapes and color gradients, and then convolve them with the F160W PSF to obtain smeared images, as we did for realistic galaxies. The color gradients of these output images are then compared with the intrinsic values. We assume that mock galaxies in one red band have ideal single-component Sérsic profiles, with =0.2, 0.35, 0.5, 0.65 arcsec (note that the drizzled imaging pixel scale is 0.06 arcsec/pixel), Sérsic index =0.5, 1.0, 1.5, 2.0 and ellipticity =0.0, 0.3, 0.5, 0.7 well represent the majority of realistic galaxies. Then one of logarithmic color gradients G = d color/d log r = -0.1, -0.3, -0.5 is superimposed onto the Sérsic profile, except that a linear component is adopted for central pixel instead to avoid logarithmic divergence, as the image of the other bluer band. The observed normalized color gradients are then compared to the unsmeared unit color gradient.
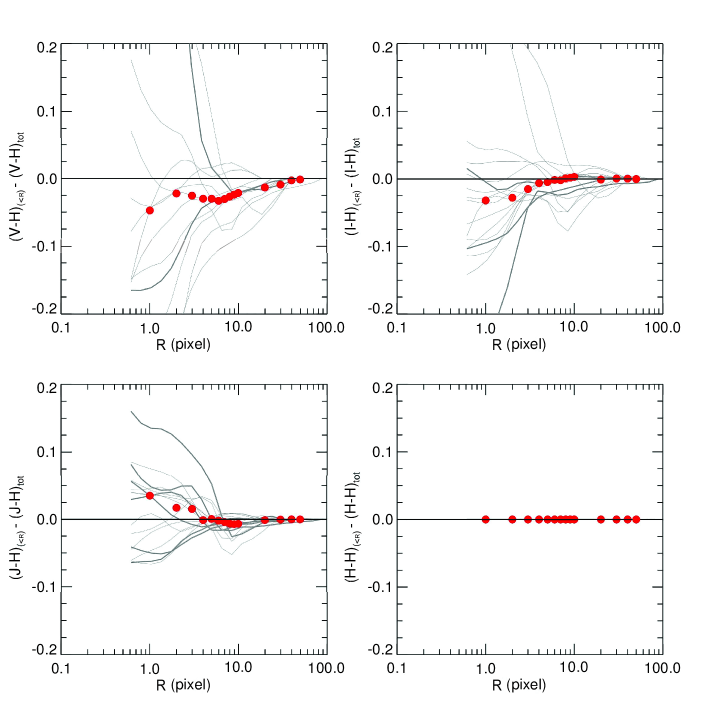
In Figure 11, we show the results for these mock galaxies with typical shapes and gradient (median values). Zero points are all fixed at . It can be seen that the deviation is fast enlarged after the radial distance decreases to 3 pixel sizes (), suggesting that PSF smearing effect roughly diminishes at 0.18 arcsec away from galaxy centers. Therefore, it is reasonable to exclude small galaxies with effective radius less than and take the color of as a safe indicator of the intrinsic color. In conclusion, the overall PSF effects are not large for real data at . The PSF-correction can result in an error of 0.05 in our color gradients at most (also see Figure 5 in Wang et al., 2017).
Appendix D Error estimate on the stacked color trajectories
In Figure 3 and Figure 4, we provide the typical errors of the stacked colors in each panel, which are the average of the standard errors of median colors at all radii. Figure 12 presents an example to illustrate our estimate on the standard errors of the median colors at a given radius. For the colors at of face-on SFMS-upper galaxies in the mass bin , the photometric errors (i.e., readout noise, sky subtraction, and PSF matching, etc.) of individual data points are typically magnitudes (left). The standard error of the median or colors at this radius is computed using a Monte Carlo simulation to re-generate 1000 realizations of median colors after resampling at each iteration of the errors of each data point from Gaussian distribution, with zero means and standard deviations given by the observed photometric errors. The resulting 1000 median colors are assumed to follow a Gaussian distribution. The standard error of the median colors at this radius is roughly the same as the standard deviation of the assumed Gaussian distribution (right).


| Criteria | ||||
| SFGs above the SFMS ridge (SFMS-upper) | ||||
| 1-3 | 1524(100%) | 662(100%) | 282(100%) | 64(100%) |
| 1-4 | 1497(98.23%) | 651(98.34%) | 274(97.16%) | 63(98.44%) |
| 1-5 | 1319(86.55%) | 629(95.02%) | 269(95.39%) | 62(96.88%) |
| 1-6 | 1050(68.90%) | 512(77.34%) | 225(79.79%) | 53(82.81%) |
| SFGs below the SFMS ridge (SFMS-below) | ||||
| 1-3 | 1174(100%) | 486(100%) | 210(100%) | 85(100%) |
| 1-4 | 1156(98.47%) | 478(98.35%) | 199(94.76%) | 82(96.47%) |
| 1-5 | 1036(88.25%) | 459(94.44%) | 194(92.38%) | 82(96.47%) |
| 1-6 | 842(71.72%) | 374(76.95%) | 148(70.48%) | 65(76.47%) |
| Transition galaxies | ||||
| 1-3 | 344(100%) | 220(100%) | 212(100%) | 196(100%) |
| 1-4 | 326(94.77%) | 217(98.64%) | 199(93.87%) | 188(95.92%) |
| 1-5 | 258(75.00%) | 168(76.36%) | 174(82.08%) | 185(94.39%) |
| 1-6 | 185(53.78%) | 131(59.55%) | 134(63.21%) | 153(78.06%) |
| Quiescent galaxies | ||||
| 1-3 | 240(100%) | 230(100%) | 345(100%) | 322(100%) |
| 1-4 | 204(85.00%) | 201(87.39%) | 325(94.20%) | 296(91.93%) |
| 1-5 | 117(48.75%) | 117(50.87%) | 212(61.45%) | 264(81.99%) |
| 1-6 | 82(34.17%) | 82(35.65%) | 147(42.61%) | 194(60.25%) |