Quantifying the AGN-driven outflows in ULIRGs (QUADROS) II: evidence for compact outflow regions from HST [OIII] imaging observations
Abstract
The true importance of the warm, AGN-driven outflows for the evolution of galaxies remains uncertain. Measurements of the radial extents of the outflows are key for quantifying their masses and kinetic powers, and also establishing whether the AGN outflows are galaxy-wide. Therefore, as part of a larger project to investigate the significance of warm, AGN-driven outflows in the most rapidly evolving galaxies in the local universe, here we present deep Hubble Space Telescope (HST) narrow-band [OIII]5007 observations of a complete sample of 8 nearby ULIRGs with optical AGN nuclei. Combined with the complementary information provided by our ground-based spectroscopy, the HST images show that the warm gas outflows are relatively compact for most of the objects in the sample: in three objects the outflow regions are barely resolved at the resolution of HST ( kpc); in a further four cases the outflows are spatially resolved but with flux weighted mean radii in the range kpc; and in only one object (Mrk273) is there clear evidence for a more extended outflow, with a maximum extent of kpc. Overall, our observations show little evidence for the galaxy-wide outflows predicted by some models of AGN feedback.
keywords:
Galaxies: evolution – galaxies: starburst – galaxies:active1 Introduction
Ultra Luminous Infrared Galaxies (ULIRGs: L; Sanders & Mirabel 1996) represent the peaks of star formation activity in major, gas-rich mergers, in which both the galaxy bulges and supermassive black holes are growing rapidly. As such, they are among the most actively evolving systems in the local universe. Indeed, they represent just the situation modelled in hydrodynamic simulations of the co-evolution of black holes and their host galaxies that incorporate the feedback effect associated with AGN-driven outflows (di Matteo et al. 2005; Springel et al. 2005; Johansson et al. 2009). Therefore, the nearby ULIRGs are ideal objects to test whether AGN outflows have a major impact on the evolution of galaxies.
Observations of high-ionization [OIII], [NeV] and [NeIII] emission lines at optical (Holt et al. 2003; Holt et al. 2011; Rodríguez Zaurín et al. 2013, hereafter RZ13) and mid-IR (Spoon et al. 2009; Spoon & Holt 2009) wavelengths have revealed the presence of warm outflows in the nuclei of a large proportion (94%: RZ13) of nearby ULIRGs in which Seyfert-like AGN have been detected at optical wavelengths; such outflows are rare in ULIRGs that lack optically-detected AGN (RZ13; see also Arribas et al. 2014). Moreover, the measured emission line ratios of the detected outflows are consistent with AGN photoionization rather than shock ionization or photoionization by stars, and the outflows are concentrated in the nuclear regions of the galaxies. Therefore it is highly likely that these outflows are driven by the AGN rather than starbursts. However, despite the common presence of the warm nuclear outflows in ULIRGs with optical AGN nuclei, their true significance for the evolution of the host galaxies has yet to be determined. In particular, it has so far proved challenging to quantify the masses, kinetic powers and momenta of the near-nuclear outflows, because their radial scales, densities, reddenings and emission line luminosities have been difficult to measure accurately using the existing observations (see discussion in Rodríguez Zaurín et al., 2013; Harrison et al., 2018).
Determining the radial scales of the outflows is particularly important, because not only is the radius a key parameter in the equations used to calculate the outflow properties (e.g. RZ13), but measurements of the radius also provide a direct indication of the “sphere of influence” – the proportion of the host galaxy currently affected by the outflow. In this context, we note that analytic models of energy-driven AGN outflows indicate that they can reach galaxy-wide scales of (10 kpc) on timescales comparable with the typical yr lifetimes of luminous AGN activity (King, Zubovas & Power, 2011), resulting in the removal of the ambient gas from the galaxies’ bulges. However, the true radial extends of warm outflows driven by AGN are a subject of considerable debate in the literature (e.g. compare the results of Harrison et al. 2012, Liu et al. 2013 and Harrison et al. 2014 with those of Husemann et al. 2016, Karouzos, Woo & Bae 2016,Villar-Martín et al. 2016 and Fischer et al. 2018). Unfortunately, for most of the low-redshift ULIRGs with optical AGN nuclei the outflows are unresolved in existing ground-based optical and Spitzer mid-IR spectra (0.7-2.0 arcsec resolution for the ground-based spectra of RZ13, and 6 arcsec resolution for the Spitzer spectroscopy of Spoon & Holt 2009).
Therefore, in order to properly quantify the warm, AGN-driven outflows in ULIRGs, we are undertaking a programme that combines high resolution Hubble Space Telescope (HST) observations – to measure the radii and geometries of the outflows – and wide-spectral-coverage spectroscopic observations – to measure their densities, reddenings and emission line luminosities: the Quantifying Ulirg Agn-DRiven OutflowS (QUADROS) project. Our full sample for this project comprises 15 objects and is described in detail in Rose et al. (2017), where we also present the results of deep VLT/Xshooter spectroscopic observations for 7 of the sample. In this second paper in the series, we present HST Advanced Camera for Surveys (ACS) imaging observations for a complete sample of 8 nearby ULIRGs with optical AGN nuclei, concentrating on the radial scales of the emission line regions, while in Spence et al. (2018; Paper III) we will present the spectroscopic results for a further 8 objects, and investigate possible links between the warm outflows and the properties of the AGN and host galaxies.
As discussed in sections 3.1 and 3.2, our method involves measuring the radial extents of the near-nuclear emission-line gas directly from our high-resolution HST images, then using the complementary information provided by our ground-based spectra to estimate the extents of the warm outflows. We emphasise that our results refer to the radial scales of emission line outflows that often dominate the nuclear spectra of ULIRGs in ground-based observations, rather than to the more extended and quiescent emission line gas that is sometimes present in the extended narrow-line regions (ENLR) of such objects (e.g. Spence et al., 2016). Moreover, although there is no generally agreed kinematic criterion in the literature for what constitutes an outflow, here we take any [OIII] emission line component with line-width km s-1 to represent an outflow. Throughout the paper we adopt a cosmology with H0 = 73 km s-1, = 0.27 and = 0.73.
2 Sample, observations and data reduction
2.1 The sample
| Name | ||||||||||
|---|---|---|---|---|---|---|---|---|---|---|
| IRAS | z | Scale | log(LIR) | Filter | [OIII]/ | FWHM | Exp | F[OIII]/10-14 | FWHT/ | |
| FSC | kpc/” | (log(L⊙)) | Cont | (Å) | (Å) | sec | (erg s-1 cm-2) | FHST | ||
| (1) | (2) | (3) | (4) | (5) | (6) | (7) | (8) | (9) | (10) | (11) |
| F13428+5608 | 0.037 | 0.727 | 12.18 | F550M | Cont | 5581 | 384 | 716 | 12 | 0.24 |
| FR505N | [OIII] | 5176 | 92 | 1356 | ||||||
| F13443+0802 | 0.135 | 2.320 | 12.23 | FR647M | Cont | 6133 | 379 | 678 | 0.89 | 0.88∗ |
| FR551N | [OIII] | 5664 | 90 | 1290 | ||||||
| F13451+1232 | 0.122 | 2.120 | 12.36 | FR459M | Cont | 5093 | 345 | 2560 | 7.4 | 0.44 |
| F550M | [OIII] | 5580 | 389 | 2480 | ||||||
| F14394+5332 | 0.104 | 1.849 | 12.12 | FR647M | Cont | 5967 | 367 | 680 | 1.8 | 0.87 |
| FR551N | [OIII] | 5510 | 82 | 1356 | ||||||
| F15130–1958 | 0.109 | 1.917 | 12.17 | FR647M | Cont | 5590 | 367 | 680 | 2.0 | 0.64 |
| FR551N | [OIII] | 5531 | 83 | 1335 | ||||||
| F16156+0146 | 0.132 | 2.262 | 12.12 | FR647M | Cont | 6116 | 378 | 680 | 2.7 | 0.68 |
| FR551N | [OIII] | 5647 | 89 | 1290 | ||||||
| F17044+6720 | 0.135 | 2.300 | 12.21 | FR647M | Cont | 6131 | 379 | 720 | 0.55 | 0.75 |
| FR551N | [OIII] | 5662 | 90 | 1440 | ||||||
| F17179+5444 | 0.147 | 2.471 | 12.28 | FR647M | Cont | 6196 | 383 | 678 | 1.1 | 0.80 |
| FR551N | [OIII] | 5721 | 95 | 1356 |
The full QUADROS sample consists of 15 nearby ULIRGs with (see Rose et al., 2017, for description). In this paper we describe HST observations of a complete subset of the QUADROS sample which comprises all 8 objects from the 1Jy Sample of ULIRGs (Kim & Sanders, 1998) classified as Sy2 on the basis of their optical spectra (Yuan, Kewley & Sanders, 2010), with redshifts z 0.15, right ascensions 13:40 RA 23:20 hr and declinations -25 degrees. The upper redshift limit is chosen to ensure that there is a reasonable chance of spatially resolving the outflow regions (0.1 arcseconds corresponds to 0.25 kpc at z = 0.15), while the RA limits were set by scheduling constraints imposed in HST cycle during which the observations were taken (Cycle 20). Note that objects with broad-line AGN are excluded from our HST sample because the [OIII] emission lines are potentially contaminated by FeII emission from the BLR, making it difficult to map the warm outflows in the near-nuclear regions. Table 1 presents some basic information for the 8 ULIRGs in our HST sample.
2.2 HST observations and data reduction
 |
 |
 |
 |
 |
 |
 |
 |
 |
New HST ACS images for 7 ULIRGs in our sample were taken during Cycle 20 (GO:12934, PI:C.N. Tadhunter). The Wide Field Channel (WFC, 0.050 arcsec pixel-1) was used in combination with narrow (90) and medium-band (375) filters. The narrow-band images were positioned slightly blueward (20) of the narrow [OIII]5007 (hereafter [OIII]) emission line in order to ensure that the blue wing of the [OIII](representing the outflow), was in a wavelength region of good sensitivity and also to include the [OIII]4959 emission. On the other hand, the medium-band filters were centered on the nearby line-free continuum towards redder wavelengths. The sample was completed with IRAS F13451+1232 (PKS1345+12), which was observed during Cycle 13 using the High Resolution Channel (HRC, 0.025 arcsec pixel-1; Batcheldor et al. 2007). In this case, two medium-band filters were used, centered on the [OIII] emission and the nearby continuum towards bluer wavelengths.
The data were reduced using the standard data reduction pipeline procedures. These employ two packages: the CALACS package, which includes dark subtraction, bias subtraction and flat-field correction and produces calibrated images, and the MULTIDRIZZLE package, which corrects for distortion and performs cosmic ray rejection. The remaining cosmic rays were removed manually using the routines IMEDIT in IRAF and/or CLEAN within the STARLINK package FIGARO.
To convert into physical units we used the PHOTFLAM header keyword. PHOTFLAM is the sensitivity conversion factor and is defined as the mean flux density Fλ (in units of erg cm-2 Å-1 counts-1) that produces 1 count per second for a given HST observing mode. Since drizzled ACS images are in units of counts s-1, these were simply multiplied by the PHOTFLAM value to obtain the flux in units of erg cm-2 sec-1 Å-1. The error associated with the flux calibration is 5% for both the continuum and the [OIII] images.
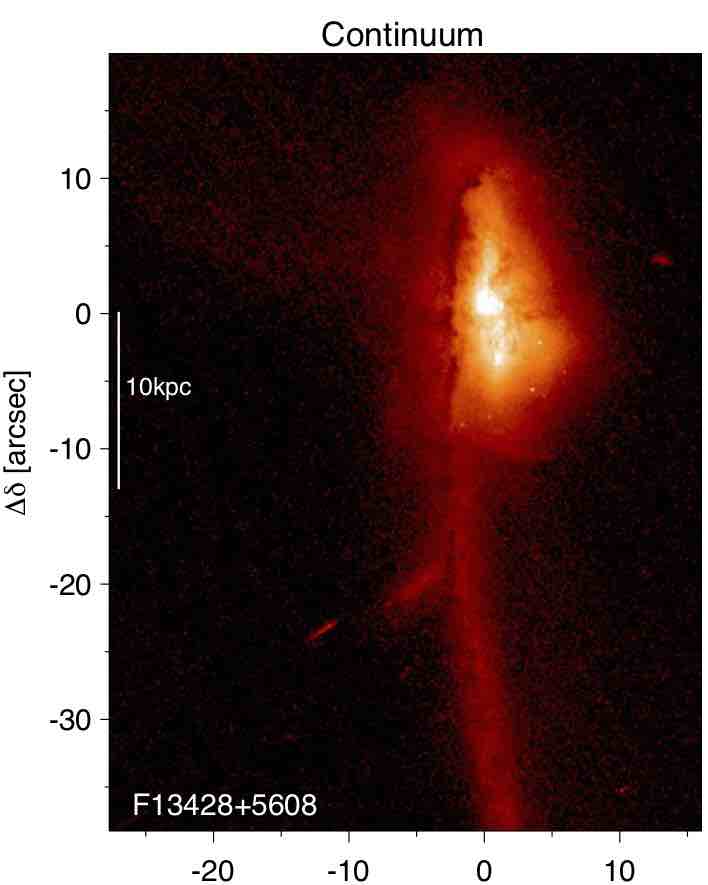
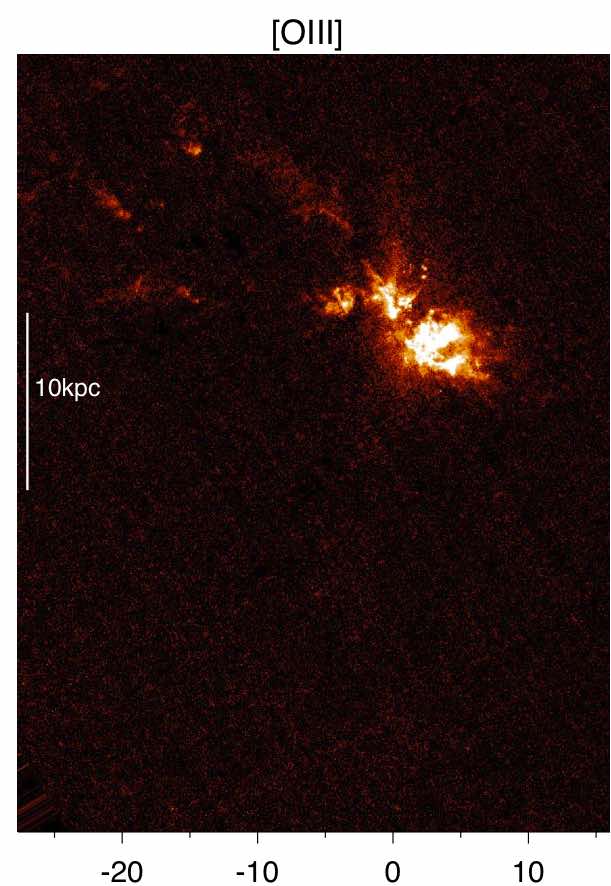
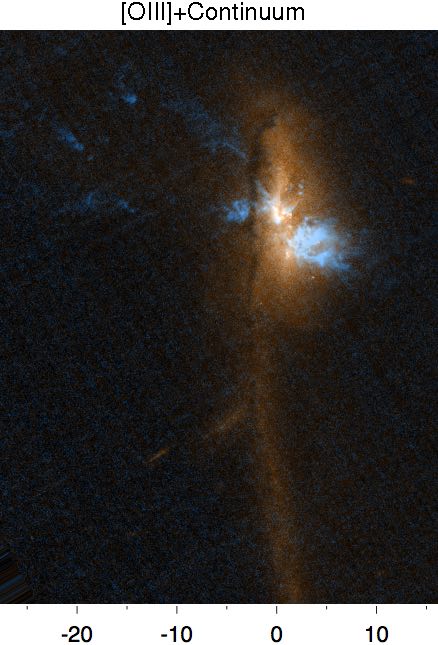
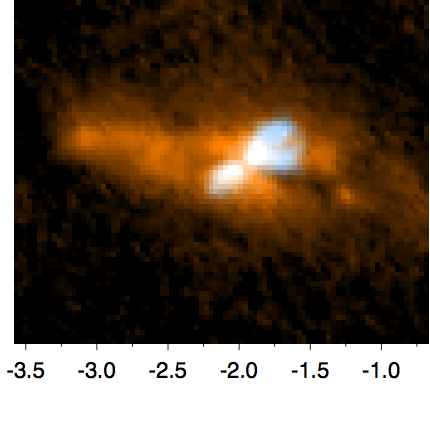
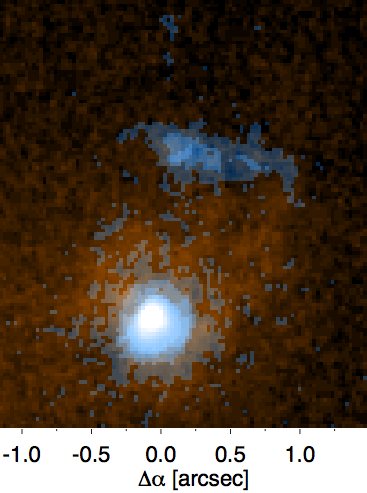
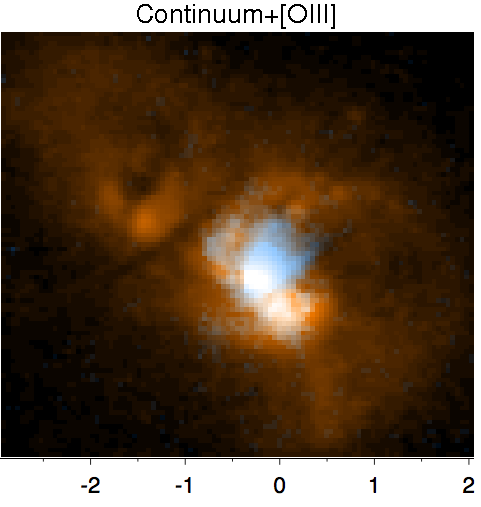
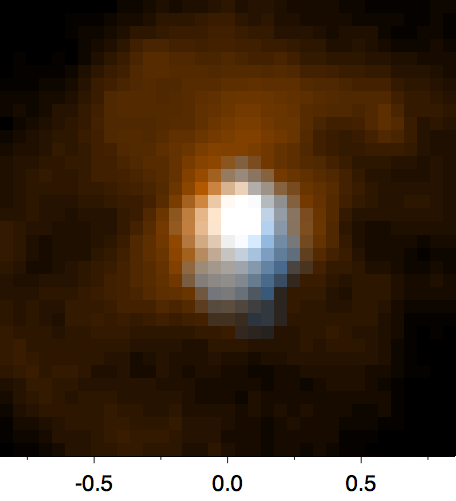
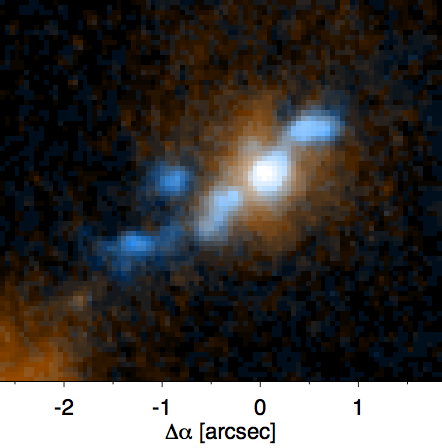
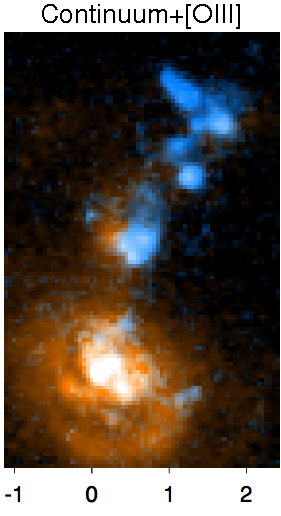
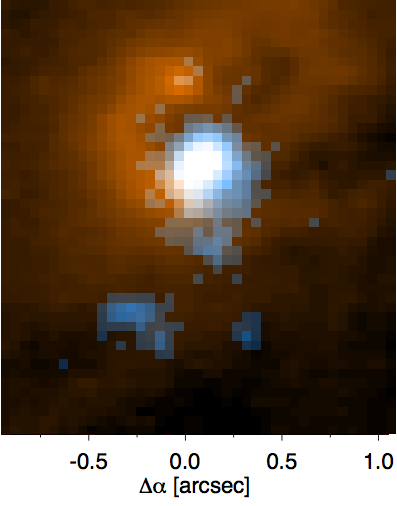
Once the images had been calibrated in flux, we subtracted the continuum from the [OIII] images to end up with images that trace “pure” [OIII] emission. Prior to that task, we used a series of IRAF routines to align the images. First, we used the task SREGISTER which registers an image to a reference image using celestial coordinate information in the headers. Since three or more foreground stars are always present in the ACS/WFC field of view, it was then possible to use the tasks GEOMAP and GEOTRAN to geometrically align the images and refine the final results. The accuracy of the alignment was measured using the routine CENTER that calculates the centroid of the stars in the aligned images. We found that the images are aligned with an accuracy better than 0.2 pixels. The continuum, continuum subtracted [OIII], and [OIII]/continuum overlay images are shown in Figure 1.
In order to calibrate the [OIII] images in terms of wavelength-integrated [OIII] emission-line flux (units: erg cm-2 s-1), an additional step was required. This involved multiplying the pixel values of the continuum-subtracted [OIII] images by the effective bandwidths of the ramp filters, as tabulated in Table 1. Note that the bandwidths of the filters contain both the [OIII]5007 and the [OIII]4959 lines, so the derived fluxes correspond to the sums of the fluxes of the two lines. The total [OIII]5007 emission line fluxes measured using an aperture of 5 kpc metrical diameter from the continuum-subtracted images are shown in the penultimate column of Table 1. The latter have been corrected for the 25% contribution of the [OIII]4959 line within the filter bandpasses (assumed doublet ratio: [OIII]5007/49593.0), and also for Galactic extinction using the V-band extinction estimates of Schlafly & Finkelbeiner (2011) available from the NASA/IPAC Extragalactic Database (NED).
The final column of Table 1 shows a comparison between the HST-derived [OIII]5007 fluxes, and those measured by RZ13 from spectra extracted from WHT/ISIS long-slit data using extraction apertures with the same 5 kpc length in the along-the-slit direction111Note that in the case of F13443+0832 the comparison is made with the flux derived from the VLT/Xshooter data presented by Rose et al. (2017).. Given that the shapes of the extraction apertures are different (circular for the HST images, rectangular for the WHT/ISIS spectra), and that the ground-based data suffer from seeing-related slit losses, it is not surprising that the fluxes derived from the ground-based spectra are generally lower than those derived from the HST images. The discrepancy is largest in the case of the closest ULIRG in our sample (F13428+5608), as expected given that much of the emission in the 5 kpc circular aperture used to measure the HST flux this object falls outside the rectangular extraction aperture used by RZ13; the seeing measured at the time of the RZ13 observations of F13428+5608 was also worse that for most of the other objects in the sample. However, in most cases the fluxes agree within 40%.
 |
 |
 |
 |
 |
 |
 |
 |
 |
3 Results
It is clear from the images presented in Figure 1 that the ULIRGs in our sample show considerable diversity in their [OIII] emission-line morphologies, ranging from the spectacular arc structures observed on scales of 10s of kpc in F13428+5608 (see also Rodríguez Zaurín et al. 2014 and Spence et al. 2016), through the complex near-nuclear structures that are resolved on scales of a few kpc in F13443+0802, F14394+5332, F16156+0146 and F17044+6720, to compact structures that dominate the nuclear emission in F1345+1232, F15130+1958, and F17179+544. Note that, although many of the objects show spectacular extended emission-line structures, these extended structures are not necessarily associated with AGN-driven outflows (see discussion in section 3.2 below). Before considering each object in detail, in the next section we describe the measurement of the radii of the warm outflow regions in the target objects.
3.1 Measuring the radii of the outflow regions
Although the morphologies of the [OIII]-emitting regions are diverse in our ULIRG sample, five of the sources contain compact [OIII]-emitting regions centred on the continuum nuclei; in three of these five cases, these compact nuclear regions contribute the bulk of the [OIII] emission on the scales of the 5 kpc diameter apertures used for the ground-based spectroscopic observations of RZ13 (see below). Therefore, it is important to determine whether these compact nuclear emission-line regions are spatially resolved and, if so, to determine their radii.
We have estimated the radii of the compact, near-nuclear [OIII] structures (R[OIII]) by fitting 2D Gaussians to the central cores seen in the [OIII] continuum-subtracted HST/ACS images. The FWHM of the 2D Gaussians were measured using the IRAF routine imexamine. We measured the FWHM for both the compact nuclear [OIII] components and stars in the field. Note that for the stars the FWHM were measured in the continuum images, which have a higher S/N for faint stellar images.
Given that the compact nuclei and stars are all detected at high signal-to-noise, much of the uncertainty in the FWHM measurements is likely to be related to the fact that the ACS detector pixels under-sample the point spread function (psf) at these wavelengths, particularly in the case of the WFC observations used for most of the objects. Therefore, we estimated the uncertainly in the FWHM measurements by resampling the images multiple times and re-fitting the compact [OIII] emission and stars in each resampled image. The resampling was affected by shifting the images by non-integer pixel amounts in 8 different directions. A total of 24 re-samplings were carried out for each object frame, and the uncertainty on the FWHM for the compact [OIII] sources and the stars was taken as the standard error in the mean of the fitted FWHM measurements for all the resampled images. The results are shown in Table 2, where the mean FWHM measurements for the compact nuclear [OIII] sources are listed along with those for stars measured in the continuum images.
 |
 |
 |
 |
 |
 |
Comparing the [OIII] FWHM with those measured for the stars, it is clear that the compact [OIII] emission line regions are spatially resolved in all five of the objects listed in Table 2, in the sense that the [OIII] FWHM are significantly larger than those of the stars (the differences between the compact [OIII] and stellar measurement are in all cases, where is the estimated uncertainty in the difference). The penultimate column of Table 2 gives the instrumentally corrected radii of the compact nuclear [OIII] regions. These were estimated under the assumption that the 2D light distributions of both the compact [OIII] components and the stars are Gaussians, with the instrumentally-corrected [OIII] FWHM obtained by subtracting the stellar FWHM from the measured [OIII] FWHM in quadrature. The radii of the compact [OIII] regions were then taken as equivalent to half the instrumentally-corrected FWHM (i.e. the HWHM).
It is important to note that the uncertainties listed for the [OIII] outflow radii in Table 2 – based on the results of the multiple re-samplings of the images described above – are likely to underestimate the true uncertainties. This is because we have assumed that spatial profiles of both the star and the [OIII] flux distributions are perfectly represented by 2D Gaussians, whereas in reality this is only an approximation.
In the cases for which there was no compact nuclear source (F13443+0802, F14394+5332, F17044+6720), or for which the extended [OIII] emission makes a substantial contribution within the RZ13 spectroscopic aperture (F13428+5608, F16156+0146), we have estimated a flux-weighted mean radius for the emission inside a 5 kpc diameter aperture centred on the nucleus. The results are shown in Table 3. Note that in the case of F14394+5332 there is some ambiguity about the true position of the nucleus, so we give two values that correspond to two different assumptions about the nuclear position.
Finally, we also give estimates of the maximum radii of the outflows in the final columns of Tables 2 & 3. In cases where we have spectroscopic information about the kinematics of any extended emission beyond the 5 kpc nuclear aperture of RZ13, we use this information to determine the maximum outflow radius. For all other objects, the maximum radius is set to the maximum extent of the [OIII] emission visible in the HST images. In such cases, the maximum radius may over-estimate the true outflow radius, because the gas emitting the [OIII] emission outside the 5 kpc spectroscopic aperture may not be taking part in the outflow, even if it is photoionized by the AGN.
| IRAS FSC | FWHM | FWHMstars | HWHM | R[OIII] | Rmax |
|---|---|---|---|---|---|
| (pixels) | (pixels) | (arcsec) | (pc) | (kpc) | |
| F13428+5608 | 3.170.01 | 2.440.05 | 0.0510.002 | 372 | 5 |
| F13451+1232 | 3.750.01 | 2.700.01 | 0.03510.00025 | 691 | 3.3 |
| F15130+1958 | 2.710.04 | 2.340.005 | 0.034 | 66 | 0.77 |
| F16156+0146 | 2.880.04 | 2.430.03 | 0.0380.03 | 877 | 4.3 |
| F17179+5444 | 2.560.04 | 1.810.03 | 0.0460.003 | 1127 | 2.6 |
Given the wide range of emission line morphologies, we now discuss the spatial extent of the warm outflow region for each object in turn. For most cases, the main challenge we face is that the ground-based spectra that were used to detect the outflows by examining the emission line profiles have a much lower spatial resolution than the HST imaging observations. However, the fact that the outflow components dominate the nuclear [OIII] emission line profiles in many cases allows us to draw strong conclusions about the radii of the warm outflows.
3.2 Descriptions of individual objects
In this section we describe the continuum and [OIII] morphologies for the 8 ULIRGs in our sample shown in Figure 1, and use the imaging data, combined with the existing ground-based spectroscopy results, to estimate the radial extents of the outflow regions.
3.2.1 F13428+5608 (Mrk273)
At a redshift of only , the Mrk273 system is one of the closest, and best resolved, of all ULIRGs. Recently, imaging and spectroscopic observations of Mrk273 have been presented by Rodríguez Zaurín et al. (2014) and Spence et al. (2016). The deep HST [OIII] images presented in Rodríguez Zaurín et al. (2014) and Figure 1 reveal a spectacular structure of ionised gas in the form of arc-like filaments and clumps that extend 25 arcseconds (19 kpc) to the east of the nuclear region, in a direction that is close to perpendicular to prominent tidal tail to the south. The full radial extent of the warm ionized gas, as revealed by deep H imaging observations with the Gran Telescopio Canarias (GTC), is 45 kpc (Spence et al., 2016). Based on the overall morphology of the extended continuum structures, as well as the likely presence of three nuclei in the central regions, Rodríguez Zaurín et al. (2014) have suggested that this is object represents a triple merger.
Despite its large radial extent, the existing long-slit spectra of the very extended ionized nebula reveal that it is kinematically quiescent, with relatively small line widths ( km s-1) and velocity shifts ( km s-1) at radial distances greater than 6 kpc from the nucleus (Rupke & Veilleux, 2013; Rodríguez Zaurín et al., 2014; Spence et al., 2016). In contrast, various long-slit and integral field observations of the ionized gas on smaller scales find evidence for a high degree of kinematic disturbance with linewdiths km s-1 in some near-nuclear regions (Colina et al., 1998; Rupke & Veilleux, 2013; Rodríguez Zaurín et al., 2014). Indeed, this is the only ULIRG object in the current sample in which the near-nuclear outflow is well resolved in ground-based spectroscopy observations. The maximum radial extent measured for the outflow in the ground-based spectra depends on how we define an outflow: if we use the criterion of this paper (i.e. an outflow is any component with km s-1), the maximum (spectroscopic) radial extent of the outflow is 5 kpc; however, even if we use the more conservative criterion that an outflow is associated with larger line widths km s-1, the maximum radial extent is only marginally smaller (4 kpc). Therefore we take 5 kpc as the maximum extent of the near-nuclear outflow in this case. Aside from questions about how we define an outflow, it is important to add the caveat that the outflows are not necessarily AGN-driven out to the full radial extent of 5 kpc: given the general weakness of the detected AGN activity in this case (RZ13), starburst-driven outflows may also make a significant contribution.
Although the outflow in Mrk273 is clearly resolved in ground-based spectra, for completeness and comparison with the other objects in our sample, in Table 2 we present estimates of radial extent of the compact [OIII] emission associated with the SE nucleus (see Rodríguez Zaurín et al., 2014). This compact nucleus contributes only 7% of the total [OIII] flux on the scale of the spectroscopic aperture used by RZ13 to study the near-nuclear outflow. For comparison, the broader of the two components detected in this nuclear aperture ( km s-1) contributes 40% of the total [OIII] flux (RZ13). Therefore, the compact emission-line region associated with the SE nucleus is unlikely to dominate the outflow in this case.
| IRAS FSC | Flux-weighted | Rmax |
|---|---|---|
| radius (pc) | (kpc) | |
| F13428+5608 | 5 | |
| F13443+0802 | 1.9 | |
| F14394+5332P | 1.9 | |
| F14394+5332D | 2.2 | |
| F16156+0146 | 4.3 | |
| F17044+6720 | 3.2 |
3.2.2 IRAS F13443+0802
IRAS F13443+0802 is a spectacular triple system comprising a close pair with a nuclear separation of 5 arcsec (12 kpc) in the N-S direction, along with a third galaxy located 15 arcsec (35 kpc) to the SW of that pair. We will refer to the individual galaxies as the NE, SE, and SW components respectively (following the notation of Veilleux et al. 2002). The HST continuum image shows a highly disturbed morphology in the case of the NE component. Several clumps and condensations, along with dust features, are observed through the entire body of the galaxy, but are more prominent in the nuclear region and towards the south of this source. Overall, the NE component has the appearance of a distorted spiral galaxy observed close to face-on.
In contrast, the SE component presents an elongated continuum morphology, extended from E to W along PA 81∘. In addition, a prominent dust lane crosses the western part of the galaxy with the same PA as the overall elongation of the continuum emission, which suggests that we are observing an edge-on or highly inclined disk. A bridge of faint, diffuse continuum emission is visible between the SE and the SW component, with the latter showing a regular spiral morphology in continuum emission.
We note that there is some ambiguity surrounding the identity of the AGN nucleus in this system. Veilleux et al. (1999) found no evidence for significant [OIII] emission from the NE nucleus —- consistent with our HST imaging results – but found that the SW component has emission line ratios consistent with a Sy2 classification; the SE component is not discussed in the latter paper. However, our HST [OIII] images show strong, extended [OIII] emission from the SE component. This ambiguity is resolved by our VLT/Xshooter observations (Rose et al., 2017) which detect strong, high-ionisation emission lines (e.g. HeII4686, [NeV]3426 in the nucleus of the SE galaxy which are not present in the spectrum of the nucleus of the SW galaxy, thus demonstrating that the dominant AGN component is associated with the SE galaxy.
However, our most interesting finding for IRAS F13443+0802 is related to the morphology of the SE galaxy. The [OIII] emission from this galaxy has a peculiar “Y” morphology, centred on the region of brightest continuum emission along the disk, and bisected by the prominent dust lane. The overall morphologies of the continuum and [OIII] emission of the SE component suggest that the Y structure corresponds to the two sides of an emerging outflow in an edge-on or highly inclined system.
The extraction aperture used for our VLT/Xshooter spectrum of F13443+0802SE (Rose et al., 2017) encompasses all the [OIII] emission from the high-surface-brightness Y structure. In order to adequately fit the [OIII] emission line, three Gaussian components are required: two narrow ( and km s-1 ) components and one intermediate ( km s-1 ) component, shifted by , and km s-1 respectively relative to the rest frame defined by the stellar absorption features. The presence of the intermediate component – which contributes 53% of the total [OIII] flux – provides evidence for kinematic disturbance in the emission line gas. Note that, in this case, the relatively small velocity shifts and widths of the kinematic components relative to the host galaxy rest frame could be explained by the fact that the system is observed close to edge-on.
If we assume that the AGN nucleus of IRAS F13443+0802 SE lies behind the dust lane that crosses the Y structure, the maximum radial extent of the near-nuclear outflow measured from our [OIII] image is 0.8 arseconds (1.9 kpc), and the flux-weighted mean radial extent of the outflowing gas in the Y structure is 0.34 arcsec (0.78 kpc).
3.2.3 IRAS F13451+1232 (PKS1345+12)
IRAS F13451+1232 (PKS1345+12) is a well studied object that shows evidence for outflows in warm, neutral and molecular gas (Holt et al., 2003; Morganti et al., 2005; Holt et al., 2011; Dasyra & Combes, 2012; Morganti et al., 2013). Deep HST imaging and ground-based spectra for PKS1345+12 are discussed in Holt et al. (2003), Batcheldor et al. (2007) and Holt et al. (2011). We note that the AGN in this object is radio-loud ( W Hz-1 m-2) with a compact, high-surface-brightness inner radio structure that includes a jet that has a maximum radial extent of 130pc to the S along PA180 (Morganti et al., 2013), as well as a more diffuse extended radio structure with a total extent of 150 kpc in a roughly N-S direction (Stanghellini et al., 2009). Given the similarity between the spatial extent of the inner radio structures and those of the warm, neutral and molecular outflows in this source, there is a strong possibility that the outflows are driven by the relativistic jets (see the discussion in Batcheldor et al. 2007 and Morganti et al. 2013).
The HST continuum image shown in Figure 1 is dominated by a double nucleus of separation 2.1 arcsec (4.5 kpc) which represents the cores of the two merging galaxies in the system. The western nucleus contains the powerful, radio-loud AGN, whereas the eastern nucleus is quiescent.
The deep HST [OIII] image of F13451+1232 has a better resolution and spatial sampling than those of the other objets in the sample, because it was taken with the high resolution camera (HRC) rather than the WFC of the ACS instrument. Even with this better spatial resolution, the nuclear [OIII] emission of F13451+1232 is barely resolved: although the emission is slightly elongated roughly in the direction of the radio jets, the first Airy ring is visible in the image. In addition to the compact core, an arc feature is detected 1.2 arsec (2.5 kpc) to the NW of the nucleus in the [OIII] image. The instrumentally-corrected HWHM of the compact core source is kpc.
The spectroscopic observations of Holt et al. (2003: 1.32.1 arcsec aperture along PA160) encompass the entire compact [OIII] structure, but miss much of the emission of the prominent extended arc 1.2 arcseconds to the north of the nucleus. Within this spectroscopic aperture the [OIII] emission lines show complex profiles which can be modelled as a narrow component ( km s-1), an intermediate component ( km s-1) and a broad component ( km s-1), with the intermediate and broad components shifted by and km s-1 respectively relative to the narrow component; this is one of the most kinematically disturbed objects in our sample. The broad and intermediate components — which we take to represent the outflow — contribute 95% of the total [OIII] flux in the spectroscopic aperture (Holt et al., 2003).
Because of uncertainties about the seeing FWHM for the spectroscopic observations we do not directly compare the absolute fluxes of the [OIII]5007 emission between the spectroscopic and imaging observations. Rather, we base our analysis of the spatial extent of the outflow on a comparison between the proportion of the total [OIII] emission that is emitted by the compact nuclear source, as derived from the imaging observations, and the proportion of total [OIII] flux emitted by the broad and intermediate outflow components derived from the spectroscopic observations.
First, we estimate the total [OIII] flux emitted by the compact nuclear source by performing photometry on our HST/ACS image: within a circular aperture of radius 0.314 arcsec (12.5 pixels) that is dominated by the compact source, and measure an [OIII] flux of erg s-1 cm-2. We then apply an aperture correction of factor 1.112 under the assumption that the compact source has a spatial profile similar to that of the psf of the HST ACS/HRC at the wavelength of the filter222Given the compact nature of the high-surface-brightness structure and detection of the first Airy ring, this is a reasonable approximation. However, it might lead to a slight underestimation of the aperture correction because the compact nuclear source appears slightly elongated. (Sirianni et al., 2005). In this way, we estimate that the compact source has a total [OIII] flux of erg s-1 cm-2. In comparison, the total [OIII] flux within a circular aperture of radius 1.05 arcsec — corresponding to the radial extent of the nuclear spectroscopic extraction aperture — is erg s-1 cm-2. Therefore, the compact nucleus contributes 81% of the total [OIII] flux in the spectroscopic aperture – similar to the proportion of the total [OIII] emission contributed by the broad and intermediate outflow components in the same aperture.
To investigate the total extent of the near-nuclear outflow, and whether any of the outflow is emitted by extended regions outside the compact nuclear source, we make two extreme assumptions. First, we assume that all the narrow [OIII] emission in the spectroscopic aperture is emitted by the compact nuclear source. In this case, based on a comparison between our imaging and spectroscopic results within the spectroscopic aperture, we deduce that 80% of the outflowing [OIII] (broad and intermediate components) must be emitted by the compact structure. Second, we assume that all the narrow [OIII] is emitted outside the compact nucleus. In this case, 85% of the outflowing [OIII] must be emitted by the compact structure. The second assumption is more plausible given the likelihood that the degree of kinematic disturbance will increase towards the nucleus. Therefore we deduce that the the overwhelming majority, of the nuclear outflow is emitted by the compact source, and adopt the instrumentally corrected HWHM of the compact source (691 pc; see Table 2) as the radius of the outflow.
Note that, by adopting the HWHM as the radius of the [OIII] outflow, we are assuming that it is symmetric about the AGN nucleus. However, this is not necessarily the case: there is evidence in F13451+1232 that the cooler phases of the outflow are more extended on the south side of the nucleus, since Morganti et al. (2013) show that the neutral HI and molecular CO outflows are concentrated at the extreme of the southern radio jet (130 pc to the south of the nucleus), but find no evidence for a molecular or HI outflow along the shorter radio jet to the north. If the molecular, neutral and ionized outflows are co-spatial in F13451+1232 – as they appear to be in at least one AGN with multi-phase outflows that have been mapped in detail (IC5063: Morganti et al., 2007; Tadhunter et al., 2014; Morganti et al., 2015) – then the ionized gas outflow might also be be asymmetric. Indeed, such asymmetry would be consistent with the fact that the FWHM of the compact [OIII] structure visible in our HST images (138 pc) is similar to the radial extent of the molecular outflow to the south of the nucleus. Therefore, the [OIII] outflow could be more extended than the 69 pc indicated by the HWHM.
3.2.4 IRAS F14394+5332
Figure 2 shows a wide field-of-view image of the continuum emission from the two interacting galaxies that form this system. The nuclear separation between the two galaxies is 28 arcsec (56 kpc), and they are connected by a bridge of faint, diffuse emission. The western component shows a spiral morphology, and no [OIII] emission is detected from this source. Therefore, it is not shown in Figure 1.
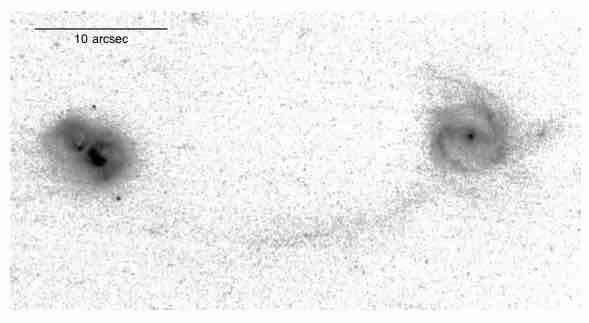
A priori, the morphology of the continuum emission from the eastern component in our HST images is consistent with that described in Kim, Veilleux & Sanders (2002) in which the eastern component is a double nucleus galaxy in itself, with the brighter nucleus (labelled E) separated from a fainter nucleus (labelled EE) 2.0 arcsec (3.7 kpc) to the NE along PA67. The Kim, Veilleux & Sanders (2002) results were based in near-IR K-band images. However, the double nucleus nature of the eastern component is not so clear in our higher resolution HST optical images, which present a complex morphology that includes condensations, tails and dust lanes; it is likely that the two brightest condensations in this image — which appear to be divided by a dust lane aligned along PA142 — form the E nucleus described in the Kim, Veilleux & Sanders (2002) paper.
Spectroscopically, the E nucleus is classified as a Seyfert 2 galaxy at optical wavelengths (Veilleux et al., 1999; Yuan, Kewley & Sanders, 2010). RZ13 carried out a spectroscopic study of the nuclear outflows in this nucleus and found that it shows the most spectacular [OIII] emission line kinematics of all the objects considered in their study (see their Figure 1). In order to fit the [OIII] emission line profile, three narrow (FWHM 450 km/s) and two broad (FWHM 1300 km/s) components with extreme velocity shifts of up to 1500 km/s were required. If we assume that the reddest of the three narrow components represents the rest frame of the host galaxy – this is supported by observations of the extended emission lines on either side of the nucleus – and that all the other (blueshifted) components represent the outflow, then the outflow contributes 87% of the total [OIII] flux.
Our HST [OIII] image of the system shows an irregular structure without a clear compact nucleus. The highest surface brightness part of this structure is centred on the more northerly of the two continuum condensations associated with the E nucleus, and to the south the structure is cut through by the dust lane that divides the two main continuum condensations. No [OIII] emission is detected in the vicinity of the EE nucleus of Kim, Veilleux & Sanders (2002).
At the resolution of our HST images, the true position of the AGN nucleus is uncertain. If the AGN is associated with the peak of the [OIII] emission on the NE side of the dust lane, the [OIII] emission extends to a maximum radius of 1.0 arcsec (1.9 kpc) and the flux weighted mean radius of the outflow is 0.36 arcsec (0.65 kpc). On the other hand, if the AGN is located in the dust lane, between the two continuum condensations, the [OIII] emission has a maximum radius of 1.2 arcsec (2.2 kpc) and a flux weighted mean radius of 0.45 arcsec (0.84 kpc).
3.2.5 IRAS F15130-1958
The HST continuum image of IRAS F15130-1958 shows a complex nuclear morphology, with various dust features, as well as a tidal tail that extends 8 arcsec (16 kpc) to the SE of the galaxy. Only one prominent, nuclear condensation of continuum emission is observed in the image.
Our [OIII] image of this source is dominated by a compact structure of ionized gas emission centred on the main nuclear continuum concentration. There is also some faint, diffuse emission to the south of the nucleus that extends to a maximum radius of 0.40 arsec (0.77 kpc).
The spectroscopic aperture of RZ13 (1.52.4 arcsec aperture along PA358) encompass the entire compact [OIII] structure and the diffuse emission. RZ13 modelled the [OIII] emission line profiles using a combination of two intermediate ( and km s-1) components, and one broad (FWHM: km s-1) component. Taking the narrowest, most redward intermediate component to represent the galaxy rest frame, the bluer intermediate and broad components are shifted by -350280 and -725131 km s-1. However, using higher resolution Xshooter data we have recently measured the rest frame of the host galaxy more accurately using the high order Balmer and near-IR CaII triplet stellar absorption lines (Rose et al., 2017), and obtain an adequate fit to the [OIII] emission lines using a combination of two Gaussians of width km s-1 and km s-1 (FWHM) shifted by and km s-1 respectively relative to the rest frame defined by the stellar absorption lines. Therefore, in this case the entire [OIII] emission feature is blueshifted and associated with the warm outflow; there is no evidence for a narrow component at rest-frame wavelength defined by the stellar absorption features.
Based on analysis of the narrow-band [OIII] image using circular aperture photometry, we find that the total flux in the compact nuclear source within an aperture of 3.5 pixel (0.175 arcsec) radius is erg s-1 cm-2. Following aperture correction by a factor of 1.22 (Sirianni et al., 2005), the total [OIII] flux associated with the compact nuclear source is erg s-1 cm-2. This is similar to the total [OIII] flux measured within a circular aperture that has the same radius (1.3 arcsec, 26 pixels) as that of the spectroscopic extraction aperture: erg s-1 cm-2. Therefore, the compact nuclear [OIII] source contributes 90% of the total flux in the nuclear aperture. Clearly the flux contribution of the diffuse structures to the south of the compact nucleus is relatively minor.
Given that our spectra show that the entire [OIII] emission line profile is associated with the outflow, and our HST images demonstrate that the overwhelming majority of the [OIII] flux is emitted by the compact structure, we again adopt the instrumentally corrected HWHM of the compact structure (66 pc; see Table 2) as the radius of the outflow.
3.2.6 IRAS F16156+0146
The system is a merger between two galaxies with a nuclear separation of 3.5 arcsec (7.9 kpc) in the N-S direction. The HST continuum image of the source shows that the morphology of each of the two merging galaxies consist of a central condensation plus an irregular halo of diffuse emission. No prominent dust lanes and/or additional tidal features are visible in our continuum image of the source. However, the [OIII] image of the galaxy shows a series of clumps or condensations embedded in more diffuse emission. Relative to the NW nucleus, these clumps extend 0.8 arcsec (1.8 kpc) in the NW direction, and 1.9 arcsec (4.3 kpc) in the SE direction along PA130. This [OIII] structure extends almost the entire distance between the two merging galaxies, and its close alignment with the axis joining the nuclei suggests that it is a tidal feature.
The brightest [OIII] clump coincides with the continuum nucleus of the NW source, which is classified as Sy2 at optical wavelengths (Veilleux et al., 1999; Yuan, Kewley & Sanders, 2010). RZ13 found evidence for an AGN-induced outflow in their 1.52.2 nuclear aperture centred on the NW nucleus. Since the longest axis of this aperture is aligned along PA133, it contains much of the [OIII] emission visible in the HST image. The nuclear [OIII] profile is well-fitted with three Gaussian components: one narrow ( km s-1), one intermediate ( km s-1) and one broad ( km s-1), with the intermediate and broad components shifted from the narrow component by km s-1 and km s-1 respectively. Taking the intermediate and broad components to represent the outflow, these components together contribute 69% of the total [OIII] flux in the spectroscopic aperture.
The [OIII] flux measured within a 3.5 pixel (0.175 arcsec) radius aperture centred on the NW compact nucleus in our HST image is erg s-1 cm-2. Assuming an aperture correction factor of 1.22 (Sirianni et al., 2005), this component has a total [OIII] flux of erg s-1 cm-2. In comparison, the total [OIII] flux measured within a 22 pixel (1.1 arcsec) radius aperture, corresponding to the extent of the spectroscopic aperture is erg s-1 cm-2. Therefore the compact [OIII] nucleus in this source contributes 54% of the [OIII] flux within the spectroscopic aperture. Following the method used for PKS1345+12, based on the comparison between the spectroscopic and the imaging data, we deduce that 33 – 78% of the flux in the outflow is emitted by the compact nucleus. However, although a large fraction of the [OIII] flux could be emitted by the compact nucleus, this is obviously not such a clear-cut case as those of F13451+1232 and F15130-1950 described above. The maximum possible radius of the [OIII] outflow in this case corresponds to the maximum extent of the [OIII] structures visible in the HST image (4.3 kpc); however, we have no spectroscopic evidence that [OIII]-emitting regions outside our spectroscopic aperture (radius 2.5 kpc) are outflowing. The flux weighted mean radius measured in a 5 kpc diameter aperture centred on the compact nucleus is 0.8490.004 kpc.
3.2.7 IRAS F17044+6720
The HST continuum image of this source shows a highly disturbed morphology. Two condensations of enhanced continuum emission, separated by 0.39 arcsec (0.90 kpc), are visible in the central region of the source, which might correspond to the two nuclei of the merging galaxies, or a single nucleus bisected by a dust lane. A series of dust features is also observed through almost the entire extent of the system, although they are more prominent as they cross the “circular” halo of diffuse continuum emission in the nuclear region. In addition, a tidal tail of length 6 arcsec (14 kpc) emerges from the nuclear region to the north, and then bends to the west. Several clumps are visible within this tail structure.
In the case of IRAS F17044+6720, the HST [OIII] image is truly spectacular. Regions of enhanced ionized gas emission are observed in the nuclear region, and then extended 4.0arcsec (9.2 kpc) in the direction of the tidal tail, along PA155; this association with the continuum tidal tail suggests that the general morphology of emission line gas is tidal in origin, and is not shaped by other mechanisms such as outflows origination from the nucleus, or the anisotropy of the AGN radiation field. Three bright,[OIII]-emitting clumps are visible in the tail structure (see Figure 1) that we label clumps A, B, C at distances 1.8, 2.8, 3.7 arcseconds (4.2, 6.4, 8.5 kpc) from the nucleus respectively. Note that the brightest [OIII] clump in the nuclear regions is centred on the more northerly of the two continuum condensations visible in the continuum image. We take the latter to represent the AGN nucleus.
The long-slit WHT/ISIS observations discussed in RZ13 were taken with the slit aligned along PA160 — covering the nucleus as well as the emission line clumps to the north of the nucleus. RZ13 extracted 1.52.2 arcsec nuclear aperture centred on the double continuum nucleus to the south. This aperture includes the brightest condensations in the nucleus, as well as the more diffuse structure to the N and W, but avoids the bright clumps (A, B and C) to the N of the nucleus. RZ13 found that the [OIII] emission-line profile from this nuclear aperture could be modelled using a combination of narrow ( km s-1) and broad ( km s-1) Gaussian components, with the latter shifted by km s-1 relative to the narrow component and contributing 36% of the total [OIII] flux in nuclear aperture. We identify the broad, blue-shifted component as the outflow in this object.
We have extracted further apertures from our PA160 long-slit spectrum in order to examine whether they show any evidence for outflows. The apertures were centred on clumps A, B and C. Following subtraction of the stellar continuum using the STARLIGHT code (Mateus et al., 2006), the Gaussian profiles were fitted to the emission lines and emission line blends using the STARLINK dipso package. We found that a single, narrow Gaussian was sufficient to provide a good fit to the profiles of all the emission lines with the exception of the [OIII] emission in clump B. In the latter case, the [OIII] emission lines required a second broader, blue-shifted component in order to fit the profiles. The broader component has a velocity shift of -14427 relative to the narrow component and a width km s-1. However, the velocity shift and line width measured for the broader component detected in clump B are much smaller than those measured for the [OIII] emission in the nucleus (v=-55363 km/s and 103 km s-1; RZ13). Therefore, they do not provide clear evidence for an extended outflow.
Both the starburst and the AGN activity could potentially ionize the extended clumps in the ENLR of this object. Therefore, to investigate the ionisation mechanism we have plotted the emission line ratios on Baldwin, Phillips and Terlevich (BPT) diagnostic diagrams (Baldwin et al., 1981). Figure 3 shows the results for the Log10([OIII]/H) vs Log10([NII]/H) diagram. The line ratios measured for all the apertures fall in the AGN part of the diagram, suggesting that AGN photoionisation dominates. However, the points for the extended apertures fall in part of the diagnostic diagram that is relatively unpopulated for AGN nuclei. As shown by the photoionisation modelling of Groves, Heckman & Kauffmann (2006), this is consistent with relatively low abundances in the ENLR – perhaps as low as 0.5Z⊙. Given the well-known mass-metallicity relationship for galaxies (Tremonti et al., 2004) and the presence of substantial radial metallicity gradients in spiral galaxies such as the Milky Way, this could imply that the ENLR material has been accreted from the central regions of low mass precursor galaxy, or from the outer disk of a more massive precursor.
We have used the HST [OIII] image to investigate how much of the outflow in the nuclear regions is emitted by the brightest clump centred on the nucleus. Within a 3.5 pixel (0.175 arcsec) radius aperture centred on this clump we measure an [OIII] flux of erg s-1 cm-2, corresponding to a total flux emitted by this component of erg s-1 cm-2 assuming an aperture correction of 1.22 (Sirianni et al., 2005). For comparison, the total [OIII] flux in a 22 pixel (1.1 arcsec) aperture centred on the nucleus is erg s-1 cm-2. Therefore the compact nucleus contributes 25% of the [OIII] flux in the nuclear aperture. Using the same arguments as used above for F1345+12 and F15130-1958 we deduce that 0 – 69% of the outflow could be emitted by the compact nucleus. Note, however, that, due to the complexity of the near-nuclear structures in this case, it was not possible to fit a 2D Gaussian in order to determine the radius of the compact nucleus. The flux-weighted mean radius of the [OIII] emission within a circular aperture of diameter 5 kpc centred on the nucleus is 1.20.01 kpc.

3.2.8 IRAS F17179+5444
The HST continuum image of F17179+5444 shows a complex morphology. Two condensations, separated by 0.47 arcsec (1.16 kpc) and connected by a bridge of enhanced continuum emission, are observed in the nuclear region of the galaxy. These condensations are surrounded by a semi-circular halo of diffuse emission, where a series of dust features is clearly visible. In addition, there is a faint tail of continuum emission emerging from the south of the nuclear region and extended 6 arcsec (15 kpc) towards the SE of the galaxy.
In contrast to the continuum structure, the [OIII] emission from the galaxy shows four clumps of ionized gas emission. The compact northern clump is substantially brighter than the other three, and coincides with the location of the brighter, southern condensation in the nuclear continuum emission. We assume that the latter corresponds to the AGN nucleus. A second region of enhanced [OIII] emission emerges 0.4 arcsec to the south of the northern clump, and two additional condensations 0.8 arcsec (2.0 kpc) to the SE and SW of the northern clump; the maximum extent of the emission line structures is 1.1 arcsec (2.6 kpc).
The nuclear spectroscopic aperture of RZ13 (1.52.0 arcsec along PA122) encompasses the compact [OIII] structure and the extended clumps to the south, south east. Within this spectroscopic aperture, the [OIII] emission line profile can be modelled using a combination of a narrow component ( km s-1), an intermediate component ( km s-1) and broad component( km s-1), with the intermediate and broad components shifted by and km s-1 respectively relative to the rest frame defined by the narrow component. If the broad and intermediate components are together taken to represent the outflow, the outflow contributes 88% of the total [OIII] flux in the nuclear aperture (RZ13).
Performing aperture photometry on our HST [OIII] image, we find that the flux of compact nuclear source within an aperture of 3.5 pixel (0.175 arcsec) radius is erg s-1 cm-2. Assuming an aperture correction factor of 1.22 (Sirianni et al., 2005), the total [OIII] flux associated with the compact nuclear source is estimated to be erg s-1 cm-2. This comprises of 85% of the total [OIII] flux measured in a circular aperture with a 1.0 arcsec radius equivalent to that of the spectroscopic aperture.
Adopting a similar approach to that used for PKS1345+12 and F16156-0146 above, from the comparison between the results from the HST imaging and ground-based spectroscopy we deduce that between 83 and 97% of the flux of the nuclear outflow components in F17179+5444 must be emitted by the compact nuclear structure. Therefore we adopt the instrumentally corrected HWHM of this structure (1127 pc; see Table 2) as an estimate of the radius of the outflow region.
4 Discussion and conclusions
Based on the results of our HST imaging programme, the warm gas outflows associated with the AGN in our complete sample of ULIRGs are mostly compact: in three objects (PKS1345+12, F15130–1958 and F17179+5444) they are barely resolved with HST and have radii in the range 0.065 – 0.12 kpc; and in a further five objects (F13428+5608, F13443+0802, F14394+533, F16156+0146 and F17044+6720) the outflows are spatially resolved but with maximum radii in the range 1.9 – 5 kpc, and flux-weighted mean radii in the range 0.65 – 1.8 kpc. These results are consistent with the measurements of, or upper limits on, the outflow radii derived from our long-slit spectra in papers I & III for the wider QUADROS sample (Rose et al., 2017; Spence et al., 2018). Therefore we do not find evidence in our data for the galaxy-wide outflows predicted by some models of AGN outflows. This point is dramatically illustrated by the right-hand panels in Figure 1. These show that the [OIII] structures – not all of which are necessarily outflowing (Rodríguez Zaurín et al., 2014; Spence et al., 2018) – cover only a small fraction of the extended starlight structures of the host galaxies in most cases.
It is also interesting that the radial extents that we measure for the warm ionized outflows in our sample objects are similar to those typically estimated for the cool molecular outflows in nearby ULIRGs using CO emission lines and OH absorption lines: 0.05 – 1.23 kpc (Cicone et al., 2014; Gonzalez-Alfonso et al., 2017, but see Veilleux et al. 2017). Thus it is possible that warm ionized and cool molecular outflow regions are co-spatial, although high resolution molecular line observations will be required to confirm this, by investigating the spatial relationship between the different phases of the outflows for the individual objects in our sample.
These results also inform the ongoing debate about the true extent of the warm outflows associated with AGN. A number of integral field studies of AGN at both high and low redshifts have found evidence for outflows that extend on scales of 2 – 15 kpc (Harrison et al., 2012; Liu et al., 2013; Harrison et al., 2014). The integral field study of Harrison et al. (2012), which finds typical outflow radii for a sample of high-redshift () ULIRGs in the range 2 – 10 kpc, is particularly relevant to the current study. In contrast, other studies that are based both on integral field and long-slit data do not find evidence for AGN-driven outflows extended on scales 5 kpc in most cases. For example, in their re-analysis of the integral field data presented in Liu et al. (2013), Husemann et al. (2016) stress the importance of correcting for the beam smearing effects caused by atmospheric seeing when measuring the radii of the outflow regions, and find that the outflow regions could be more compact than has previously been claimed. Moreover, some of the integral field studies have deliberately targetted samples of AGN that were already known to have extreme nuclear outflows based on previous spectra, perhaps biasing the studies towards larger outflow radii.
We emphasise that the sample used for the current study, while relatively small, is complete and representative of local ULIRGs with optical AGN nuclei. The hydrodynamic simulations of galaxy mergers predict that AGN-driven outflows should be particularly important in just such objects. The fact that we find that the outflows are relatively compact in these extreme objects further supports the idea that the effects of the warm, AGN-driven outflows associated with powerful AGN are localised to the near-nuclear regions.
Finally, we note that our results on the radial extents of the warm outflows in ULIRGs relate to the high-surface-brightness [OIII] structures that dominate the emission-line fluxes in both our HST images and ground-based spectra. However, we cannot rule out the idea that there exists a more diffuse, low-surface brightness, and low density component that represents a significant proportion of the total outflow mass but contributes relatively little to total emission-line flux (see discussion in Spence et al., 2018). Indeed, even in the three cases in which a compact nuclear source dominates the HST [OIII] images, comparison with our optical spectra demonstrates that up to 10 – 20% of the [OIII] flux of the outflow could be emitted by a spatially diffuse component.
Acknowledgements
MR & CT acknowledge support from STFC, and CRA acknowledges the Ramón y Cajal Program of the Spanish Ministry of Economy and Competitiveness through project RYC-2014-15779 and the Spanish Plan Nacional de Astronomía y Astrofisíca under grant AYA2016-76682-C3-2-P. Based on observations taken with the NASA/ESA Hubble Space Telescope, obtained at the Space Telescope Science Institute (STScI), which is operated by AURA, Inc. for NASA under contract NAS5-26555. The STARLIGHT project is supported by the Brazilian agencies CNPq, CAPES and FAPESP and by the France-Brazil CAPES/Cofecub program. The authors acknowledge the data analysis facilities provided by the Starlink Project, which was run by CCLRC on behalf of PPARC. This research has made use of the NASA/IPAC Extragalactic Database (NED) which is operated by the Jet Propulsion Laboratory, California Institute of Technology, under contract with the National Aeronautics and Space Administration.
References
- Arribas et al. (1981) Arribas, S., Colina, L., Bellochi, E., Maiolino, R, Villar-Martín, M., 2014, A&A, 568, 14
- Baldwin et al. (1981) Baldwin, J.A., Phillips, M.M., Terlevich, R., 1981, PASP, 93, 5
- Batcheldor et al. (2007) Batcheldor, D., Tadhunter, C., Holt, J., Morganti, R.,
- Cicone et al. (2014) Cicone, C., et al., 2014, A&A, 562, 21
- Colina et al. (1998) Colina, L., Arribas, S., Born, K.D., ApJ, 527, L13
- Dasyra & Combes (2012) Dasyra, K.M., Combes, F., 2012, A&A, 541, L7
- di Matteo et al. (2005) di Matteo, T., Springel, V., Hernquist, L., 2005, Nature, 433, 604
- Fischer et al. (2018) Fischer, T.C. et al., 2018, ApJ, in press
- Gonzalez-Alfonso et al. (2017) Gonzalez-Alfonso, E., et al., 2017, ApJ, 836, 11
- Groves, Heckman & Kauffmann (2006) Groves, B.A., Heckman, T., Kauffmann, G., 2006, MNRAS, 371, 1559
- Harrison et al. (2012) Harrison, C. M. et al., 2012, MNRAS, 426, 1073
- Harrison et al. (2014) Harrison, C. M., Alexander, D. M., Mullaney, J. R., Swinbank, A. M., 2014, MNRAS, 441, 3306
- Harrison et al. (2018) Harrison, C. M., Costa, T., Tadhunter, C.N., Flutsch, A., Kakkad, D., Perna, M., Vietri, G., 2018, Nature Astr
- Holt et al. (2003) Holt, J., Tadhunter C. N., Morganti R., 2003, MNRAS, 342, 227
- Holt et al. (2011) Holt, J., Tadhunter, C. N., Morganti, R., Emonts, B. H. C., 2011, MNRAS, 410, 1527
- Husemann et al. (2016) Husemann, B., Scharwachter, J., Bennert, V.N., Mainieri, V., Woo, J.-H., Kakkad, D., 2016, A&A, 594, 44
- Johansson et al. (2009) Johansson, P.H., Naab, T., Burkert, A., 2009, ApJ, 690, 802
- Karouzos, Woo & Bae (2016) Karouzos, M., Woo, J., Bae, H., 2016, ApJ, 819, 148
- Kewley et al. (2006) Kewley, L. J., Groves, B., Kauffmann, G., Heckman, T., 2006, MNRAS, 372, 961
- Kim & Sanders (1998) Kim D. C., Sanders D. B., 1998, ApJS, 119, 41
- Kim, Veilleux & Sanders (2002) Kim D. C., Veilleux, S., Sanders D. B., 2002, ApJSS,143, 277
- King, Zubovas & Power (2011) King, A.R., Zubovas, K., Power, C., 2011, MNRAS, 415, L6
- Liu et al. (2013) Liu, G., Zakamska, N. L., Greene, J. E., Nesvadba, N. P. H., Liu, X., 2013, MNRAS, 436, 2576
- Mateus et al. (2006) Mateus, A., Sodré, L., Cid Fernandes, R., Stasińska, G., Schoenell, W., Gomes, J. M., 2006, MNRAS, 370, 721
- Morganti et al. (2005) Morganti, R., Tadhunter, C.N., Osterloo, T.A., 2005, A&A, 444, L9
- Morganti et al. (2007) Morganti, R., Holt, J., Saripalli, L., Oosterloo, T.A., Tadhunter, C.N., 2007, A&A, 476, 735
- Morganti et al. (2013) Morganti, R., Fogasy, J., Paragi, Z., Osterloo, T., Orienti, M., 2013, Sci, 341, 1082
- Morganti et al. (2015) Morganti, R., Oosterloo, T., Oonk, J.B.R., FRieswijk, W., Tadhunter, C., 2015, A&A, 580, 1
- Rodríguez Zaurín et al. (2013) Rodríguez Zaurín, J., Tadhunter, C. N., Rose, M., Holt, J., 2013, MNRAS, 432, 138
- Rodríguez Zaurín et al. (2014) Rodríguez Zaurín, J., Tadhunter, C.N., Rupke, D.S.N., Veilleux, S., Spoon, H.W.W., Chiaberge, M., Ramos Almeida, C., batcheldor, D., Sparks, W.B., 2014, A&A, 571, 57
- Rose et al. (2017) Rose, M., Tadhunter, C., Ramos Almeida, C., Rodríguez Zaurín, J., Santoro, F., Spence, R., 2016, MNRAS, in press (Paper II)
- Rupke & Veilleux (2013) Rupke, D. S. N., Veilleux, S., 2013, ApJ, 768, 75
- Sanders & Mirabel (1996) Sanders, D. B., Mirabel, I. F., 1996, ARA&A, 34, 749
- Schlafly & Finkelbeiner (2011) Schlafly, E.F., FinkBeiner, D.P., 2011, ApJ, 737, 103
- Sirianni et al. (2005) Sirianni, M., et al., 2005, PASP, 117, 1049
- Spence et al. (2016) Spence, R., Rodríguez Zaurín, J., Tadhunter, C.N., Rose, M., Cabrera-Lavers, A., Spoon, H., Muñoz-Tunon, C., 2016, MNRAS, 459, L16
- Spence et al. (2018) Spence, R., Tadhunter, C.N., Rose, M., Rodríguez Zaurín, J., 2018, MNRAS, submitted (Paper III)
- Springel et al. (2005) Springel, V., Di Mateo, T., Hernquist, L., 2005, MNRAS, 361, 776
- Spoon et al. (2009) Spoon H. W. W., Armus L., Marshall J. A., BernardSalas J., Farrah D., Charmandaris V., Kent B. R., 2009, ApJ, 693, 1223
- Spoon & Holt (2009) Spoon H.W.W., Holt J., 2009, ApJL, 702, L42
- Stanghellini et al. (2009) Stanghellini, C., O’Dea, C., Dallacasa, D., Cassaro, P., Baum, S., Fanti, R., Fanti, C., 2005, A%A, 443, 891
- Tadhunter et al. (2014) Tadhunter, C.N., Morganti, R., Rose, M., Oonk, J.B.R., Oosterloo, T., 2014, Nature, 511, 440
- Tremonti et al. (2004) Tremonti, C.A., et al., 2004, ApJ, 613, 898
- Veilleux et al. (1999) Veilleux, S., Sanders, D.B., Kim, D.-C., 1999, ApJ, 522, 113
- Veilleux et al. (2002) Veilleux, S., Kim, D. C., Sanders, D. B. 2002, ApJ, 143, 315
- Veilleux et al. (2017) Veilleux, S., Bolatto, A., Tombesi, F., Meléndez, M., Sturn, E., Gonzáles-Alfonso, E., Fischer, J., Rupie, D.S.N., 2017, ApJ, 843, 18
- Villar-Martín et al. (2016) Villar-Martín, M., Arribas, S., Emonts, B., Humphrey, A., Tadhunter, C., Bessiere, P., Cabrera Lavers, A., Ramos Almeida, C., 2016, MNRAS, 460, 130
- Yuan, Kewley & Sanders (2010) Yuan T.T., Kewley L. J., Sanders D. B., 2010, ApJ, 709, 884