Off the beaten path:
Gaia reveals GD-1 stars outside of the main stream
Abstract
Tidally-disrupted globular clusters are transformed into thin, dynamically-cold streams of stars that are extremely valuable tracers of the large- and small-scale distribution of mass in the Galaxy. Using data from the Gaia second data release combined with Pan-STARRS photometry, we present a sample of highly-probable members of the longest cold stream in the Milky Way, GD-1. The resulting map of GD-1: (1) extends the apparent length of the stream by , (2) reveals plausible locations for the progenitor, (3) detects high-contrast gaps along the stream, and (4) indicates the existence of stream members perturbed off the main stream track. These discoveries are only possible because of the exquisite astrometry from Gaia, which permits a clean separation of the stream from Milky Way stars. The additional length and a proper treatment of the progenitor will aid in dynamical modeling of GD-1 for mapping the large-scale dark matter distribution. The complex morphology of the stream points to a turbulent history; detailed phase-space properties of the perturbed stream members could potentially constrain dark matter substructure in the Milky Way.
Section 1 Introduction
Stellar streams are formed during the tidal disruption of stellar systems by the gravitational field of their host galaxy. The phase-space density and mean track of stars in streams therefore encode information about the underlying distribution mass on galactic scales (e.g., Johnston et al. 1999; Bonaca & Hogg 2018). Dynamically-cold stellar streams formed from disrupted globular clusters can also retain imprints on their phase-space density from encounters with a massive perturber for long times (e.g., Yoon et al., 2011). In this sense, streams represent one of the most promising directions for testing the existence of small-scale dark matter sub-halos, predicted by standard Cold Dark Matter (CDM) theory (Erkal & Belokurov 2015; Sanders et al. 2016; Bovy et al. 2017).
Over 30 candidate stellar streams have been discovered in the Milky Way (Grillmair & Carlin, 2016; Newberg & Carlin, 2016; Malhan et al., 2018). The GD-1 stream is the most prominent among the thin streams, discovered as an overdensity of faint blue stars in the SDSS photometry (Grillmair & Dionatos, 2006). Initially detected to span on the sky, the physical length of GD-1 at a distance of – is at least . No remnant progenitor for the stream has been found, but its width (), metallicity (), and estimated stellar mass () imply that GD-1 is a disrupted globular cluster (Koposov et al., 2010).
Its length and location in the Galactic halo (pericentric distance ) make GD-1 an ideal object for constraining dark matter properties in the inner Milky Way. Both from fitting orbits to binned phase-space measurements along the GD-1 stream (Koposov et al. 2010) and from modeling the stream track in phase-space coordinates (Bowden et al., 2015; Bovy et al., 2016), it appears that the dark matter distribution within is close to spherical, consistent with findings from simulated Milky Way-like galaxies (Zhu et al., 2016).
Its implied old dynamical age, combined with its orbital properties, makes GD-1 a prime stream to also study the small scale structure of dark matter. While density variations in streams can be induced from interactions with giant molecular clouds (Amorisco et al., 2016) or resonant encounters with the bar (Pearson et al., 2017), these baryonic effects are unlikely to affect GD-1 because of its large pericentric distance and retrograde orbit with respect to the Galactic bar. Therefore, observed density variations in the GD-1 stream could instead be an indication of past interactions with dark matter subhalos (e.g., Ngan & Carlberg, 2014). Erkal et al. (2016) predict that a 4 Gyr old GD-1-like stream in a Milky Way-like galaxy could have up to one significant, wide (–) gap caused by an interaction with a – subhalo. A definitive ruling on the presence of dark matter subhalos in this mass regime would directly inform the nature of dark matter (e.g., Bullock & Boylan-Kolchin, 2017).
Photometric studies of GD-1 revealed the presence of density variations and gaps along the stream, as well as wiggles in the main stream track (Carlberg & Grillmair, 2013; de Boer et al., 2018). However, purely photometric studies of streams suffer from contamination of the Milky Way foreground, which, on small scales, could partially account for density inhomogeneities reported along cold streams (e.g., Ibata et al., 2016). In this Letter, we improve upon the selection of likely GD-1 members by using astrometric data from the Gaia mission, combined with precise photometry from the Pan-STARRS survey (§ 2). These data enable us to measure density variations along GD-1 to an unprecedented precision (§ 3.1), and detect clear signatures of stream stars beyond the main track (§ 3.2). Implications of this revolutionary remapping of GD-1 are discussed in § 4.
Section 2 Data
We use astrometric data from the Gaia mission (Gaia Collaboration et al. 2016), data release 2 (Gaia Collaboration et al. 2018; Lindegren et al. 2018), and photometry from the Pan-STARRS survey, data release 1 (Chambers et al. 2016) to select high-confidence members of the GD-1 stream.
We retrieve data along the previously-identified track of the GD-1 stream from the Gaia science archive111https://gea.esac.esa.int/ by selecting sources with small parallax, in fields along the GD-1 stream. We convert the equatorial sky coordinates and proper motions to the GD-1 coordinate system (, Koposov et al., 2010), and correct the proper motions for solar reflex motion by assuming that stars at a given stream longitude, , have a distance given by ; we assume a solar velocity (Schönrich et al. 2010; Bovy 2015). In detail, we project the solar velocity vector onto the tangent space at each star’s sky position, convert to angular motion using the assumed distance, and subtract the solar component from each star’s proper motion (this is done using the astropy (Astropy Collaboration et al., 2013) and gala (Price-Whelan, 2017) packages). Figure 1 (top right) shows stars with in solar-reflex-corrected proper motion components in the GD-1 system, and . GD-1 members are visible as the overdensity around .
As a first selection of GD-1 member stars, we choose stars that lie in a polygon in proper motions (orange shaded polygon in top right panel of Figure 1; approximately bounded by the rectangle and ). Figure 1 (top left) shows all stars that pass the selection, plotted in the GD-1 coordinate system. The stream is already identifiable as the overdensity of stars around between longitudes .
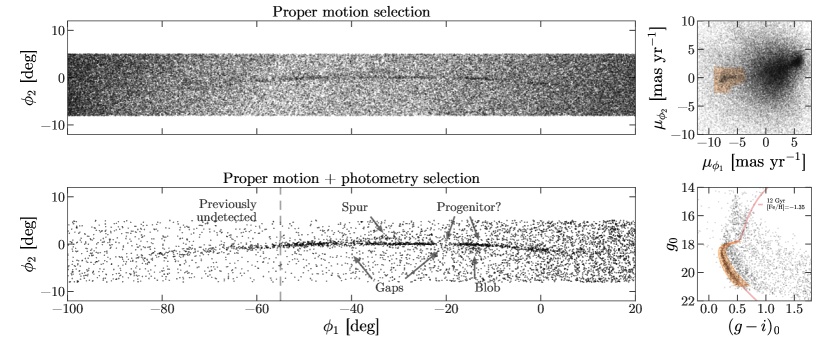
To improve the contrast of the stream over the background, we cross-match the sample to the Pan-STARRS photometric catalog. Figure 1 (bottom right) shows the proper-motion-selected candidate stream stars within in a Pan-STARRS color-magnitude diagram (CMD) de-reddened following Schlafly & Finkbeiner (2011). The GD-1 stellar population stands out from the Milky Way foreground, and is well matched by a 12 Gyr, MIST isochrone at a distance of (red line in Figure 1, Dotter, 2016; Choi et al., 2016; Paxton et al., 2011). We use this isochrone to generate a polygonal selection in de-reddened color and apparent -band magnitude (shaded region in the bottom right panel of Figure 1).
Figure 1 (bottom left) shows the final sample of candidate stream members after selecting on both proper motion and photometry. The GD-1 stream is clearly visible as an overdensity of individual stars (the positions are not binned); this is the most pure view of the stream to date. This increased contrast shows that the stream extends at least another to negative longitudes. Furthermore, the stream reaches its highest surface density where it is the narrowest (), which may be the location of its elusive and fully-disrupted progenitor. At this location, between , we find that the mean equatorial sky position of the stream stars is and the mean proper motion is , taking into account the covariance matrix for proper motions provided with the Gaia data. The full data for the GD-1 region along with selection masks are available through Zenodo (https://doi.org/10.5281/zenodo.1295543 (catalog 10.5281/zenodo.1295543))222See also https://github.com/adrn/gd1-dr2.
Several of the under-densities and gaps hinted at from photometric selection (Carlberg & Grillmair 2013; de Boer et al. 2018) appear as striking features in this significantly cleaner map of the GD-1 stream. Finally, at least two new features are visible near the stream: (1) “the spur,” stars above the main stream track (in ), and (2) “the blob,” stars below the main stream track, both highlighted in Figure 1.
Section 3 Results
3.1 Properties of the main GD-1 track
To study the global properties of the stream as a function of stream longitude, we extract stream stars around a fourth-order polynomial model for the stream latitude, , as a function of stream longitude, . We find the stream midpoints by computing the median in windows shifted by along , then fit a parabola to the median positions to find . We define the stream region as . Figure 2, panel (a), shows the high-confidence stream stars (same as Figure 1), and the two curved lines (blue) show the upper and lower boundary of the stream region.
We extract properties of the stream from the region defined above as a function of by computing median stream properties in (overlapping) windows. Panels (c)–(e) in Figure 2 show the background-subtracted stream surface density and median proper motion components extracted in this way (dark lines), with the associated empirical scatters (shaded regions). We estimate the local background surface density as an average of areas north and south of the bounded stream region. The median proper motion profiles along the stream (panels (d)–(e)) are consistent with previous mean proper motion measurements (Koposov et al. 2010), but here the proper motion gradient is resolved for individual stars (see, e.g., elongated overdensity in upper right panel of Figure 1).
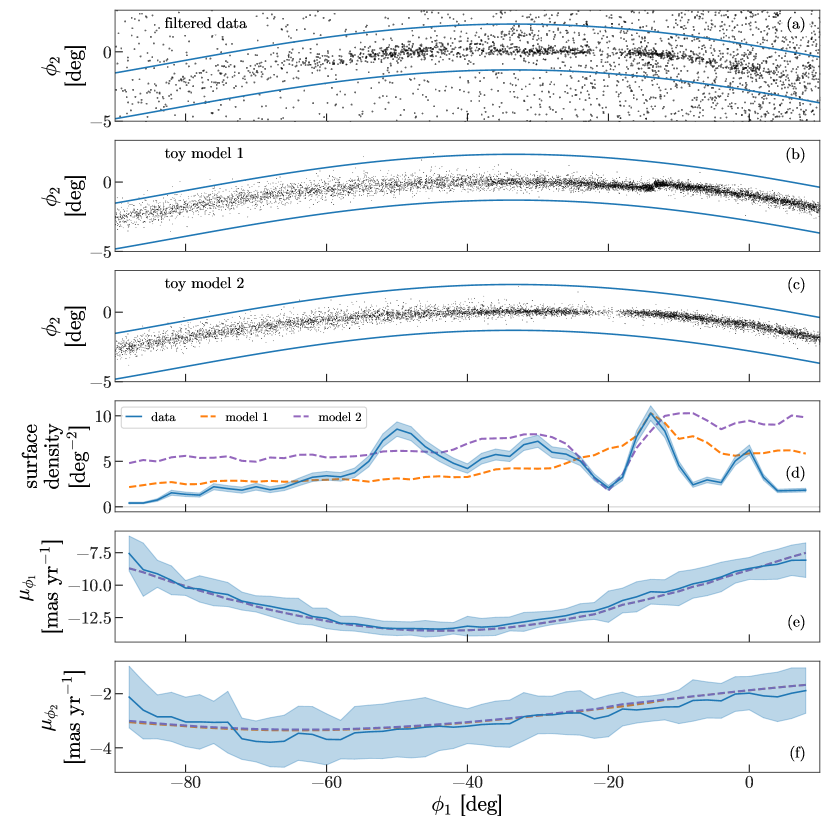
Clear density variations, also apparent in the 2D positions of the sources, manifest as sharp features in the surface density estimates along the stream. We have verified that these do not correspond to features in dust extinction nor are they caused by completeness variations in the Gaia scanning pattern: the visible portions of the GD-1 stream are located at high Galactic latitudes (), and 99% of our sample has at least 8 Gaia visibility periods and satisfy a selection on the unit weight error (see Equation C.1 in Lindegren et al. 2018), promising a robust astrometric solution. In detail, we have compared the fraction of good solutions in the region near the spur, in the region between the stream and the spur, and in the stream at the same range of longitudes. We consider the longitude range , and 3 ranges in : , , for the stream, region between stream and spur, and spur, respectively. In these 3 regions, we find 84%, 88%, 89% of the stars with 5-parameter solutions pass the unit weight error criteria. Small-scale density variations, however, especially apparent between , are a consequence of the Gaia scanning pattern.
The observed density variations are therefore likely real morphological changes along the GD-1 stream. The deep under-densities we see from the kinematically-cleaned sample correspond to previously reported gaps in the stream (Carlberg & Grillmair 2013; de Boer et al. 2018). There is also a well-defined, sharp overdensity in the surface density profile close to with roughly symmetric under-densities on either side: this is suggestive of a progenitor system in the final stages of dissolution (Balbinot & Gieles 2018). This region is also the thinnest part of the stream, as would be expected for recently stripped material; we defer a robust analysis of variations in the stream width to future work. With present data, however, we cannot rule out a scenario in which the progenitor system disrupted longer ago and resulted in a gap at (see Figure 2 and, e.g., de Boer et al. 2018).
We compare the measured stream properties to a simple model for the phase-space density of the stream, generated by simulating the orbital evolution of globular cluster stars once they are tidally stripped from the progenitor. We use the “particle-spray” stream generation method (Fardal et al. 2015) and assume a uniform mass-loss history to generate the model stream (e.g., Küpper et al., 2012).
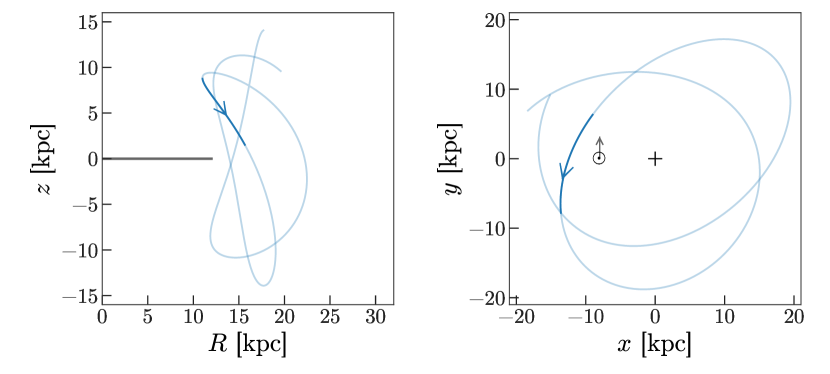
To compute initial conditions for the stream model, we fit an orbit to the observed properties of the stream in a fixed Milky Way model similar to Bovy (2015). We maximize the likelihood of the orbit given sky track and proper motions from this work, with mean distance and radial velocities from Koposov et al. (2010).
Figure 3 shows a segment of the best-fitting orbit from the procedure outlined above. The GD-1 stream crosses the midplane at large radius, far from the bulk of the stellar density: the grey line in the left panel shows the radius that contains of the mass, assuming a Bovy et al. (2012) model of the stellar disk.
We present two progenitor configurations which reproduce certain aspects of the observed GD-1 density variations: the progenitor system is either at , the peak of the observed surface density profile (toy model 1), or was fully-disrupted 500 Myr in the past and the under-density at represents the fully-disrupted progenitor (toy model 2). We numerically integrate backwards from these locations for , then forward-generate the model streams, releasing stream particles at each timestep. We assume an initial progenitor mass of , and linearly decrease the mass of the progenitor until its full disruption at the present (toy model 1), or at (toy model 2). Stream properties computed from the resulting model streams are plotted in Figure 2 as dashed (orange and purple) lines. The model streams qualitatively match the stream track in all phase-space dimensions, but have much smoother surface density profiles along the extent of the stream. The broadening in the observed stream at negative longitudes is also seen in the model stream and is expected for older parts of the stream that have phase-mixed for longer times. We therefore don’t expect that the observed surface density variations can be fully explained by, e.g., epicyclic overdensities (Küpper et al. 2012).
3.2 Off-track features
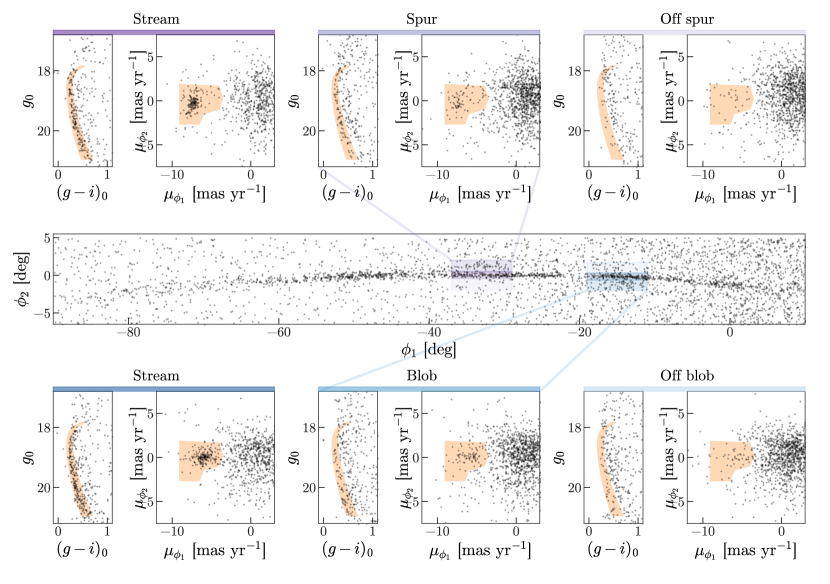
Here we test whether the overdensities apparent beyond the main stream track (Figure 1) are truly associated with the GD-1 stream by comparing color-magnitude diagrams and proper motions of the spur and blob fields to the stream and background fields.
The central panel of Figure 4 shows the map of GD-1, with fields of interest marked in shades of purple for spur-related fields, and shades of blue for blob-related fields. In both cases, we analyze the stream region (darkest shade), overdensity off from the stream (medium shade) and use a field on the opposite side of the stream from the overdensity as a control (lightest shade). The range is the same for all three fields for a given feature, and the control and feature fields have the same area (the stream field is smaller to avoid cross-contamination).
For each of the examined fields, we present the color-magnitude diagram of stars selected on proper motions (left subpanels) and proper motions of photometrically selected stars (right subpanels), with spur fields on the top and blob fields on the bottom of Figure 4. Stars selected from the stream fields show a clear overdensity in the CMD selection box and are clustered in proper motions. The two stream fields have a clear relative offset in proper motions, as expected from the velocity gradients shown in Figure 2. Furthermore, the main-sequence turn-off of the field appears to be fainter than the , consistent with the distance gradient across the stream measured by Koposov et al. (2010).
The control fields have some stars in both the CMD and proper-motion selection boxes, but without any significant overdensities in either. CMDs of the spur and blob fields have more stars in the selection box than their respective control fields, and the distribution within the box is qualitatively similar to that of the corresponding stream field, suggesting a similar distance. In proper motions, the spur and blob fields also display properties similar to the adjacent stream fields, with clear overdensities of stars in the selection box.
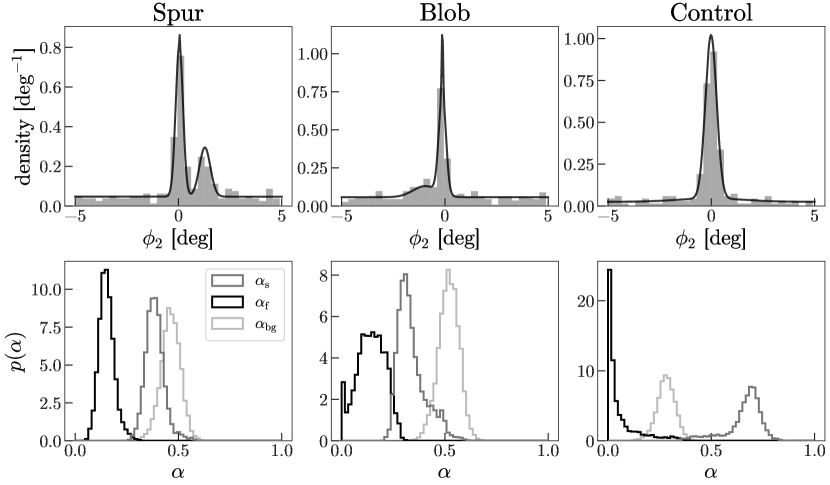
To quantify the significance of these features, we construct a statistical model of the linear density of the filtered sky positions as a function of around each of the features and at a control region. We select three equal ranges of centered on the spur, , the blob, , and in between (as a control field), , and model the one-dimensional density in in each of these regions. We use a four-component mixture model to represent the density consisting of a uniform background over the range , a two-component Gaussian mixture to represent the main stream with mean and variances and , and a single Gaussian for each feature with mean and variance . The full density model given all parameters is
| (1) |
where is the fraction of background stars in the field, is the fraction of stars associated with the mean stream track, and is the fraction of stars associated with either the spur, the blob, or at the location of the spur/blob in the control field. We generate posterior samples in the parameters of this model in each range by specifying uniform priors over all parameters except the variances, for which we use priors that are uniform in the logarithm of the variance. We use an ensemble Markov Chain Monte Carlo (MCMC) sampler (Foreman-Mackey et al. 2013) to generate posterior samples and run the sampler with 64 walkers for a total of 4096 steps, discarding the first 2048 samples as “burn-in.” Figure 5 summarizes the results of this inference: top row shows histograms of the positions of stars in each range (left to right) with maximum a posteriori inferred density over-plotted (black curve) and bottom row shows marginal posterior probability distributions for , , and estimated from the posterior samples for each range. The 15th and 85th percentile values of the feature amplitude in different fields are (spur), (blob), and (control). The posterior samples for the amplitude of each feature mixture component are consistent with zero in the control field, marginally significant in the blob field, and significantly inconsistent with the background in the spur field.
Stars from the spur and the blob are similar to those along the main stream track in the color-magnitude diagram and in proper motions, which confirms their likely association to GD-1. Both the spur and the blob are close to large gaps in the stream, so a mechanism that displaces stars from their original orbits along the stream to orbits beyond the stream would explain both sets of features. Future observations of the full 3-D kinematics combined with detailed dynamical modeling of the GD-1 system will be able to test this scenario.
Section 4 Discussion
In this work, we map a cold stellar stream in individual stars by combining precise Pan-STARRS photometry with the revolutionary Gaia astrometry. The Gaia proper motions were critical for selecting members of the retrograde GD-1 stream, and this success signals a novel way to find members of other structures in the Galactic halo. In what follows, we discuss how this first view of GD-1 in the Gaia era is already transforming what we expect to learn about the Galaxy from streams in general, and GD-1 in particular.
First, the absence of a clear progenitor has been a long-standing hurdle in dynamical modeling of GD-1, mostly due to the unknown true extent of the stream. Confirming the progenitor location suggested here, , would motivate further searches for stream members along the trailing arm (positive ) to symmetrically match the extent of the leading arm. The stream length is directly proportional to the information it provides on the underlying gravitational potential (Bonaca & Hogg, 2018), making GD-1 a top modeling priority to map the inner 30 kpc of the Galaxy, even at the length of inferred in this work. Properly accounting for the progenitor would also allow for studying detailed density structure within the tails, as advocated by Küpper et al. (2015).
Next, GD-1 is no longer a simple, one-dimensional structure (see also de Boer et al. 2018). Not only are the density variations (gaps) confirmed as highly significant, but for the first time we have mapped tidal debris from a globular cluster beyond the thin stellar track: stars from the GD-1 stream have been found up to away from the main stream track. One explanation for this separated debris could be from velocity substructure within the cluster, but would likely require a fine-tuned orientation to simultaneously explain the sharpness of the neighboring gaps. These features are also likely too localized to be explained by chaotic dispersal from either triaxialilty (Price-Whelan et al. 2016) or the time-dependent influence of the rotating bar (Pearson et al. 2017).
Encounters between a massive perturber and a thin stream are expected to open gaps in the observed density, and can expel debris into unusual locations and morphologies (e.g., Yoon et al. 2011, see especially Figure 9). The encounter origin would be especially exciting: since GD-1 resides in the halo, the only objects massive enough to cross its path are the long-sought-after dark-matter subhalos.
Confirming the origin of gaps and the off-track features in GD-1 will require both detailed modeling of the stream formation in the presence of massive perturbers and follow-up radial velocity measurements of candidate GD-1 members. Radial velocities will help remove the remaining contamination, further improving the contrast of the stream, and will enable measurements of differential energy and angular momentum along the stream and off-track features. While constraints on subhalo interactions from individual gaps leave serious degeneracies between, e.g., the time of the encounter and the mass of the perturber, energy offsets are time-independent and are a promising avenue towards placing stronger constraints on the nature of the stream and, if confirmed, the particular pertuber.
References
- Amorisco et al. (2016) Amorisco, N. C., Gómez, F. A., Vegetti, S., & White, S. D. M. 2016, MNRAS, 463, L17, doi: 10.1093/mnrasl/slw148
- Astropy Collaboration et al. (2013) Astropy Collaboration, Robitaille, T. P., Tollerud, E. J., et al. 2013, A&A, 558, A33, doi: 10.1051/0004-6361/201322068
- Balbinot & Gieles (2018) Balbinot, E., & Gieles, M. 2018, MNRAS, 474, 2479, doi: 10.1093/mnras/stx2708
- Bonaca & Hogg (2018) Bonaca, A., & Hogg, D. W. 2018, ArXiv e-prints. https://arxiv.org/abs/1804.06854
- Bovy (2015) Bovy, J. 2015, The Astrophysical Journal Supplement Series, 216, doi: 10.1088/0067-0049/216/2/29
- Bovy et al. (2016) Bovy, J., Bahmanyar, A., Fritz, T. K., & Kallivayalil, N. 2016, ApJ, 833, doi: 10.3847/1538-4357/833/1/31
- Bovy et al. (2017) Bovy, J., Erkal, D., & Sanders, J. L. 2017, MNRAS, 466, 628, doi: 10.1093/mnras/stw3067
- Bovy et al. (2012) Bovy, J., Rix, H.-W., Liu, C., et al. 2012, ApJ, 753, doi: 10.1088/0004-637X/753/2/148
- Bowden et al. (2015) Bowden, A., Belokurov, V., & Evans, N. W. 2015, MNRAS, 449, 1391, doi: 10.1093/mnras/stv285
- Bullock & Boylan-Kolchin (2017) Bullock, J. S., & Boylan-Kolchin, M. 2017, ARA&A, 55, 343, doi: 10.1146/annurev-astro-091916-055313
- Carlberg & Grillmair (2013) Carlberg, R. G., & Grillmair, C. J. 2013, ApJ, 768, doi: 10.1088/0004-637X/768/2/171
- Chambers et al. (2016) Chambers, K. C., Magnier, E. A., Metcalfe, N., et al. 2016, ArXiv e-prints. https://arxiv.org/abs/1612.05560
- Choi et al. (2016) Choi, J., Dotter, A., Conroy, C., et al. 2016, ApJ, 823, 102, doi: 10.3847/0004-637X/823/2/102
- de Boer et al. (2018) de Boer, T. J. L., Belokurov, V., Koposov, S. E., et al. 2018, MNRAS, doi: 10.1093/mnras/sty677
- Dotter (2016) Dotter, A. 2016, ApJS, 222, 8, doi: 10.3847/0067-0049/222/1/8
- Erkal & Belokurov (2015) Erkal, D., & Belokurov, V. 2015, MNRAS, 454, 3542, doi: 10.1093/mnras/stv2122
- Erkal et al. (2016) Erkal, D., Belokurov, V., Bovy, J., & Sanders, J. L. 2016, MNRAS, 463, 102, doi: 10.1093/mnras/stw1957
- Fardal et al. (2015) Fardal, M. A., Huang, S., & Weinberg, M. D. 2015, MNRAS, 452, 301, doi: 10.1093/mnras/stv1198
- Foreman-Mackey et al. (2013) Foreman-Mackey, D., Hogg, D. W., Lang, D., & Goodman, J. 2013, PASP, 125, 306, doi: 10.1086/670067
- Gaia Collaboration et al. (2018) Gaia Collaboration, Brown, A. G. A., Vallenari, A., et al. 2018, ArXiv e-prints. https://arxiv.org/abs/1804.09365
- Gaia Collaboration et al. (2016) Gaia Collaboration, Prusti, T., de Bruijne, J. H. J., et al. 2016, A&A, 595, doi: 10.1051/0004-6361/201629272
- Grillmair & Carlin (2016) Grillmair, C. J., & Carlin, J. L. 2016, in Tidal Streams in the Local Group and Beyond, Astrophysics and Space Science Library, Volume 420. ISBN 978-3-319-19335-9. Springer International Publishing Switzerland, 2016, p. 87, Vol. 420, 87
- Grillmair & Dionatos (2006) Grillmair, C. J., & Dionatos, O. 2006, ApJ, 643, L17, doi: 10.1086/505111
- Hunter (2007) Hunter, J. D. 2007, Computing in Science and Engineering, 9, 90, doi: 10.1109/MCSE.2007.55
- Ibata et al. (2016) Ibata, R. A., Lewis, G. F., & Martin, N. F. 2016, ApJ, 819, 1, doi: 10.3847/0004-637X/819/1/1
- Johnston et al. (1999) Johnston, K. V., Zhao, H., Spergel, D. N., & Hernquist, L. 1999, ApJ, 512, L109, doi: 10.1086/311876
- Jones et al. (2001–) Jones, E., Oliphant, T., Peterson, P., et al. 2001–, SciPy: Open source scientific tools for Python. http://www.scipy.org/
- Koposov et al. (2010) Koposov, S. E., Rix, H.-W., & Hogg, D. W. 2010, ApJ, 712, 260, doi: 10.1088/0004-637X/712/1/260
- Küpper et al. (2015) Küpper, A. H. W., Balbinot, E., Bonaca, A., et al. 2015, ApJ, 803, 80, doi: 10.1088/0004-637X/803/2/80
- Küpper et al. (2012) Küpper, A. H. W., Lane, R. R., & Heggie, D. C. 2012, MNRAS, 420, 2700, doi: 10.1111/j.1365-2966.2011.20242.x
- Lindegren et al. (2018) Lindegren, L., Hernandez, J., Bombrun, A., et al. 2018, ArXiv e-prints. https://arxiv.org/abs/1804.09366
- Malhan et al. (2018) Malhan, K., Ibata, R. A., & Martin, N. F. 2018, ArXiv e-prints. https://arxiv.org/abs/1804.11339
- Newberg & Carlin (2016) Newberg, H. J., & Carlin, J. L., eds. 2016, Astrophysics and Space Science Library, Vol. 420, Tidal Streams in the Local Group and Beyond
- Ngan & Carlberg (2014) Ngan, W. H. W., & Carlberg, R. G. 2014, ApJ, 788, 181, doi: 10.1088/0004-637X/788/2/181
- Paxton et al. (2011) Paxton, B., Bildsten, L., Dotter, A., et al. 2011, ApJS, 192, 3, doi: 10.1088/0067-0049/192/1/3
- Pearson et al. (2017) Pearson, S., Price-Whelan, A. M., & Johnston, K. V. 2017, Nature Astronomy, 1, 633, doi: 10.1038/s41550-017-0220-3
- Pérez & Granger (2007) Pérez, F., & Granger, B. E. 2007, Computing in Science and Engineering, 9, 21, doi: 10.1109/MCSE.2007.53
- Price-Whelan (2017) Price-Whelan, A. M. 2017, The Journal of Open Source Software, 2, 388, doi: 10.21105/joss.00388
- Price-Whelan et al. (2016) Price-Whelan, A. M., Johnston, K. V., Valluri, M., et al. 2016, MNRAS, 455, 1079, doi: 10.1093/mnras/stv2383
- Price-Whelan et al. (2018) Price-Whelan, A. M., Sipócz, B. M., Günther, H. M., et al. 2018, AJ, 156, 123, doi: 10.3847/1538-3881/aabc4f
- Sanders et al. (2016) Sanders, J. L., Bovy, J., & Erkal, D. 2016, MNRAS, 457, 3817, doi: 10.1093/mnras/stw232
- Schlafly & Finkbeiner (2011) Schlafly, E. F., & Finkbeiner, D. P. 2011, ApJ, 737, 103, doi: 10.1088/0004-637X/737/2/103
- Schönrich et al. (2010) Schönrich, R., Binney, J., & Dehnen, W. 2010, MNRAS, 403, 1829, doi: 10.1111/j.1365-2966.2010.16253.x
- Walt et al. (2011) Walt, S. v. d., Colbert, S. C., & Varoquaux, G. 2011, Computing in Science and Engg., 13, 22, doi: 10.1109/MCSE.2011.37
- Yoon et al. (2011) Yoon, J. H., Johnston, K. V., & Hogg, D. W. 2011, ApJ, 731, doi: 10.1088/0004-637X/731/1/58
- Zhu et al. (2016) Zhu, Q., Marinacci, F., Maji, M., et al. 2016, MNRAS, 458, 1559, doi: 10.1093/mnras/stw374