Star-formation complexes in the ‘galaxy-sized’ supergiant shell of the galaxy Holmberg I
Abstract
We present the results of observations of the galaxy Holmberg I carried out at the Russian 6-m telescope in the narrow-band imaging, long-slit spectroscopy, and scanning Fabry-Perot interferometer modes. A detailed analysis of gas kinematics, ionization conditions, and metallicity of star-forming regions in the galaxy is presented. The aim of the paper is to analyse the propagation of star formation in the galaxy and to understand the role of the ongoing star formation in the evolution of the central ‘galaxy-sized’ supergiant H i shell (SGS), where all regions of star formation are observed. We show that star formation in the galaxy occurs in large unified complexes rather than in individual giant H ii regions. Evidence of the triggered star formation is observed both on scales of individual complexes and of the whole galaxy. We identified two supernova-remnant candidates and one late-type WN star and analysed their spectrum and surrounding-gas kinematics. We provide arguments indicating that the SGS in Holmberg I is destructing by the influence of star formation occurring on its rims.
keywords:
galaxies: individual: Holmberg I – galaxies: star formation – galaxies: irregular – ISM: bubbles – ISM: kinematics and dynamics – ISM: supernova remnants1 Introduction
The origin of multiple kpc-scale supergiant shells (SGSs) and holes in the H i discs of galaxies is a topic of lively discussions, yet it is now not an intriguing issue. Dwarf irregular (dIrr) galaxies served as the main testing ground to study SGSs with sizes up to 2–3 kpc and a lifetime of hundreds Myr. Today it is clear that dwarf galaxies sustain a high SF efficiency over several hundred Myr and even up to 1000 Myr in some cases (McQuinn et al., 2009; McQuinn et al., 2010a, b) with local short starbursts occurring during this period. Such a long period of intense star formation provides sufficient energy from stellar winds and supernovae from multiple generations of stars to drive formation of the observed holes and SGSs (see, e.g., Weisz et al., 2009b, a; Cannon et al., 2011a, b).
Today the study of short local current starburst events usually occurring on the rims of SGSs seems to be most interesting. Such regions of star formation are observed as the extended complexes of ionized gas embedded in the walls of H i SGSs. It is important to understand what triggers these local starburst events and how the ongoing star formation affects the evolution of an H i SGS. A new burst of star formation can either help an SGS grow to larger sizes or push the neutral gas back into the central hole and/or outside the SGS destroying the giant structure. According to Warren et al. (2011), the interplay between these effects will ultimately define whether a galaxy will or will not form a large H i hole.
In order to shed light on the highlighted topic, we previously studied two well-known SGSs in the irregular galaxies IC 2574 (Egorov et al., 2014) and Holmberg II (Egorov et al., 2017). Both galaxies contain a large number of H i SGSs, while bright regions of the ongoing star formation are observed only in the walls of few of them. Such a picture of the H i distribution and star formation is typical of many irregular and spiral galaxies (see, e.g., Bagetakos et al., 2011). In Egorov et al. (2017), we showed that star formation on the rims of an SGS can often be a result of its collision with other neighbouring H i SGSs. The existing models of collided superbubbles also support this possibility (e.g., Chernin et al., 1995; Ntormousi et al., 2011; Kawata et al., 2014; Vasiliev & Shchekinov, 2017).
In this work we focus on another type of galaxy with SGSs. Some dIrr galaxies contain a galaxy-sized central H i supershell that becomes the main feature of the ISM encompassing the whole optical disc. The most striking examples of such galaxy-sized SGSs might be observed in DDO 88 (Simpson et al., 2005), Sextans A (Skillman et al., 1988; van Dyk et al., 1998), M81 dwA (Sargent et al., 1983; Westpfahl & Puche, 1994), SagDIG (Young & Lo, 1997), Holmberg I (Tully et al., 1978; Ott et al., 2001). The latter galaxy is the object of our study in this paper.
| Parameter | Value | Reference |
|---|---|---|
| DDO 63 | ||
| Alternative names | UGC 5139 | |
| KDG 57 | ||
| RA (2000) | ||
| Dec (2000) | ||
| (Mpc) | 3.9 | Dalcanton et al. (2009) |
| (mag) | -14.8 | Walter et al. (2008) |
| (kpc) | 1.9 | Walter et al. (2008) |
| (kpc) | 4.5 | Bagetakos et al. (2011) |
| () | 1.4 | Bagetakos et al. (2011) |
| () | 140 | Oh et al. (2011) |
| () | -2.21 | Karachentsev et al. (2013) |
| 7.9 | Moustakas et al. (2010) |
Holmberg I is a low-mass dIrr galaxy (IAB(s)m according to the de Vaucouleurs et al. 1991 classification) belonging to the M81 group. Its main parameters are listed in Table 1.
The first H i radio observations of Holmberg I performed at the Westerbork radio telescope were presented by Tully et al. (1978). Puche & Westpfahl (1994) and Walter et al. (2008) published the data obtained at the VLA. According to these observations, the H i disc in Holmberg I shows the low-velocity dispersion and a slow rotation (Oh et al., 2011; Stilp et al., 2013). Due to the low inclination (), the estimates of the vertical H i scaleheight by different authors are very uncertain: pc according to Ott et al. (2001), 640 pc according to Bagetakos et al. (2011), and pc in Stilp et al. (2013).
The most detailed analysis of H i in Holmberg I was performed by Ott et al. (2001). The authors showed that the H i distribution in Holmberg I is dominated by the central supergiant shell; its morphological center is offset by 0.75 kpc with respect to the dynamical center of the galaxy. From a comparison with isochrones, as well as from dynamical modelling based on the H i data, the authors derived that the age of the central supergiant H i shell is equal to Myr. Later Bagetakos et al. (2011) have detected five other H i holes of a smaller size in the galaxy.
Vorobyov & Basu (2005) carried out numerical simulations of the ISM structure in Holmberg I. They investigated three scenarios of the central H i hole formation: multiple supernova (SN) explosions, a single gamma-ray burst, and a vertical impact of a high-velocity cloud. Multiple SN explosions were shown to reproduce the H i morphology of Holmberg I more accurately.
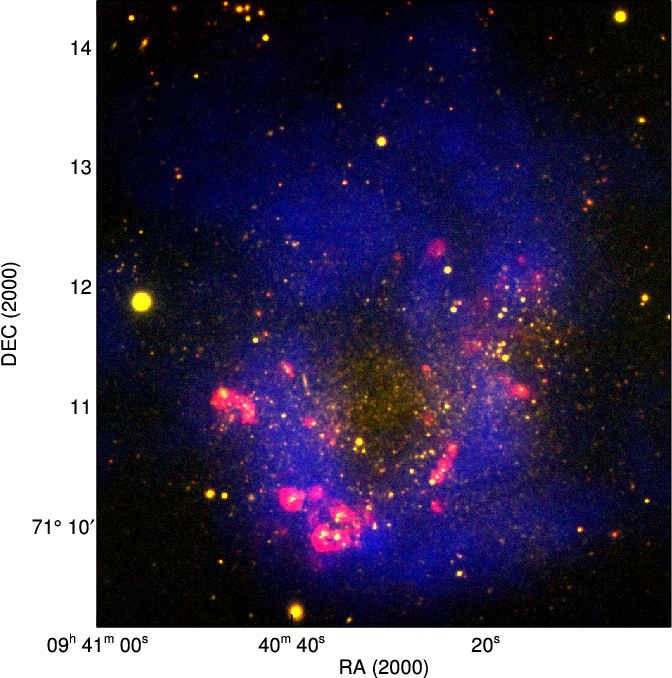
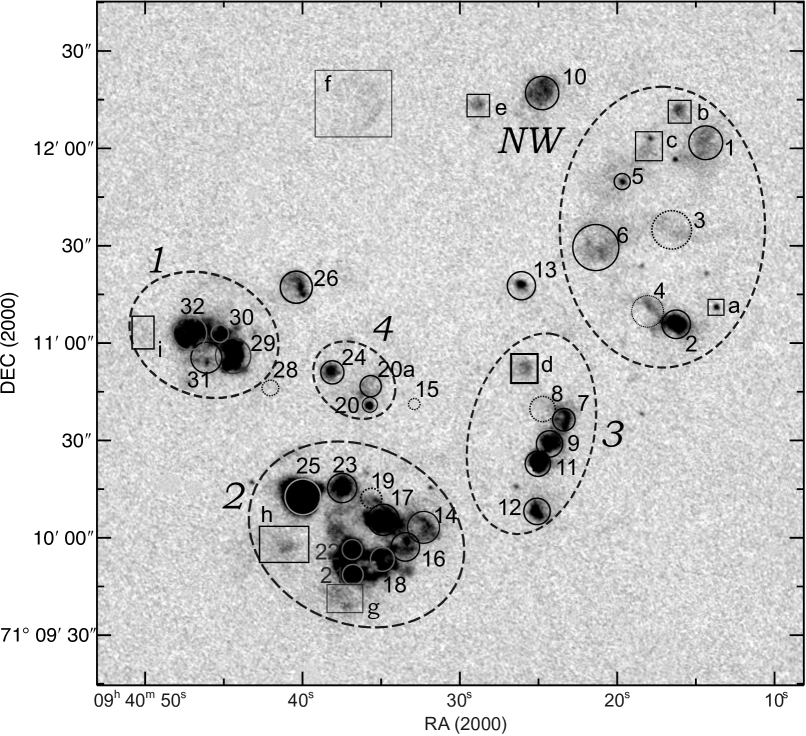
A comparison of optical images and the H i distribution shows that the regions of ionized gas are observed on the rims of the central H i supergiant shell in Holmberg I (see Fig. 1). The H ii regions in the galaxy were catalogued by Miller & Hodge (1994). The authors identified 32 H ii regions and measured their sizes and luminosities. Only a few of them were previously spectroscopically observed. The metallicity of a few bright H ii regions in Holmberg I has been studied earlier by Miller & Hodge (1996); Croxall et al. (2009); Moustakas et al. (2010). Berg et al. (2012) performed a deep spectroscopy of one H ii region in the galaxy and estimated the oxygen abundance using the direct method. These studies have showed that the galaxy has a low oxygen abundance that is typical of its luminosity.
In the present paper, we analyse the gas kinematics and the emission spectrum of star-forming regions in the galaxy Holmberg I and discuss the origin of these regions. Our aim is to recognize how star formation affects the evolution of H i SGSs using Holmberg I as an example. The paper is organized as follows. Section 2 presents the details of performed observations and data reduction. Section 3 describes the young stellar population in the galaxy. In Section 4 we analyse the general H i kinematics of the galaxy and perform a search for expanding shells and supershells in H i and H. Section 5 is dedicated to the analysis of the ionized gas morphology in Holmberg I, while in Section 6 we describe the spectroscopic properties of the individual H ii regions. In Section 7 we discuss the inferred results and in Section 8 summarize the main conclusions.
2 Observations and data reduction
2.1 Optical FPI-observations
| Data set | Date of obs | , s | , ′′ | sp. range | , Å | or , Å | ||
|---|---|---|---|---|---|---|---|---|
| FPI #1 | 2014 Dec 19/20 | 0.71 | 2.1 | 8.8 Å around H | 0.48 () | |||
| FPI #2 | 2015 Nov 04/05 | 1.5 | ||||||
| LS PA=142 | 2016 Mar 02/03 | 6600 | 0.36 | 3.5 | 3600–7070 | 5.2 | ||
| LS PA=150 | 2017 Dec 09/10 | 3600 | 1.5 | 4.7 | ||||
| LS PA=212 | 2017 Dec 08/09 | 8100 | 2.2 | 4.7 | ||||
| LS PA=259 | 2016 Feb 10/11 | 4500 | 2.2 | 4.5 | ||||
| LS PA=259 | 2015 Nov 05/06 | 2700 | 1.0 | 4.5 | ||||
| Image FN655 | 2015 Apr 25/26 | 3600 | 0.36 | 1.2 | H +[N ii] | 6559 | 97 | |
| Image FN674 | 2017 May 28/29 | 2700 | 1.3 | [S ii] 6717+6731 | 6733 | 60 | ||
| Image FN501 | 2017 May 28/29 | 1800 | 1.4 | [O iii] 5007 | 5012 | 119 | ||
| Image FN608 | 2015 Apr 25/26 | 1200 | 1.2 | continuum | 6099 | 166 | ||
| Image FN712 | 2015 Apr 25/26 | 1200 | 1.2 | continuum | 7137 | 209 | ||
| Image SED525 | 2017 May 28/29 | 900 | 1.6 | continuum | 5271 | 251 |
The observations were carried out at the prime focus of the 6-m telescope of the Special Astrophysical Observatory of the Russian Academy of Sciences (SAO RAS) using the scanning Fabry–Perot interferometer (FPI) – IFP751 – mounted inside the SCORPIO-2 multimode focal reducer (Afanasiev & Moiseev, 2011). The operating spectral range around the H emission line was cut by a bandpass filter with the Å bandwidth. During the scanning process, we have consecutively obtained 40 interferograms at different distances between the FPI plates. The log of these observations and the parameters of other data sets are given in Table 2, where is the exposure time, – the field of view, – the pixel size on the final images, – the final angular resolution, – the central wavelength of the filters used, – the final spectral resolution, and is a bandwidth of the filters used.
The data reduction was performed using a software package running in the idl environment. For a detailed description of the data reduction algorithms and software, see Moiseev (2002); Moiseev & Egorov (2008) and Moiseev (2015). After the initial reduction, sky line subtraction, photometric and seeing corrections made using the reference stars, and wavelength calibration, the observed data were combined into data cubes, where each pixel in the field of view contains a 40-channel spectrum. We observed the galaxy at two position angles in order to remove the parasitic ghost reflection. These data were reduced separately to get the wavelength cubes of the object. The analysis of H line profiles was carried out using the multicomponent Voigt fitting (Moiseev & Egorov, 2008) that yields flux, line-of-sight velocity, and velocity dispersion corrected for instrumental broadening for each component as an output.
2.2 Long-slit spectroscopic observations
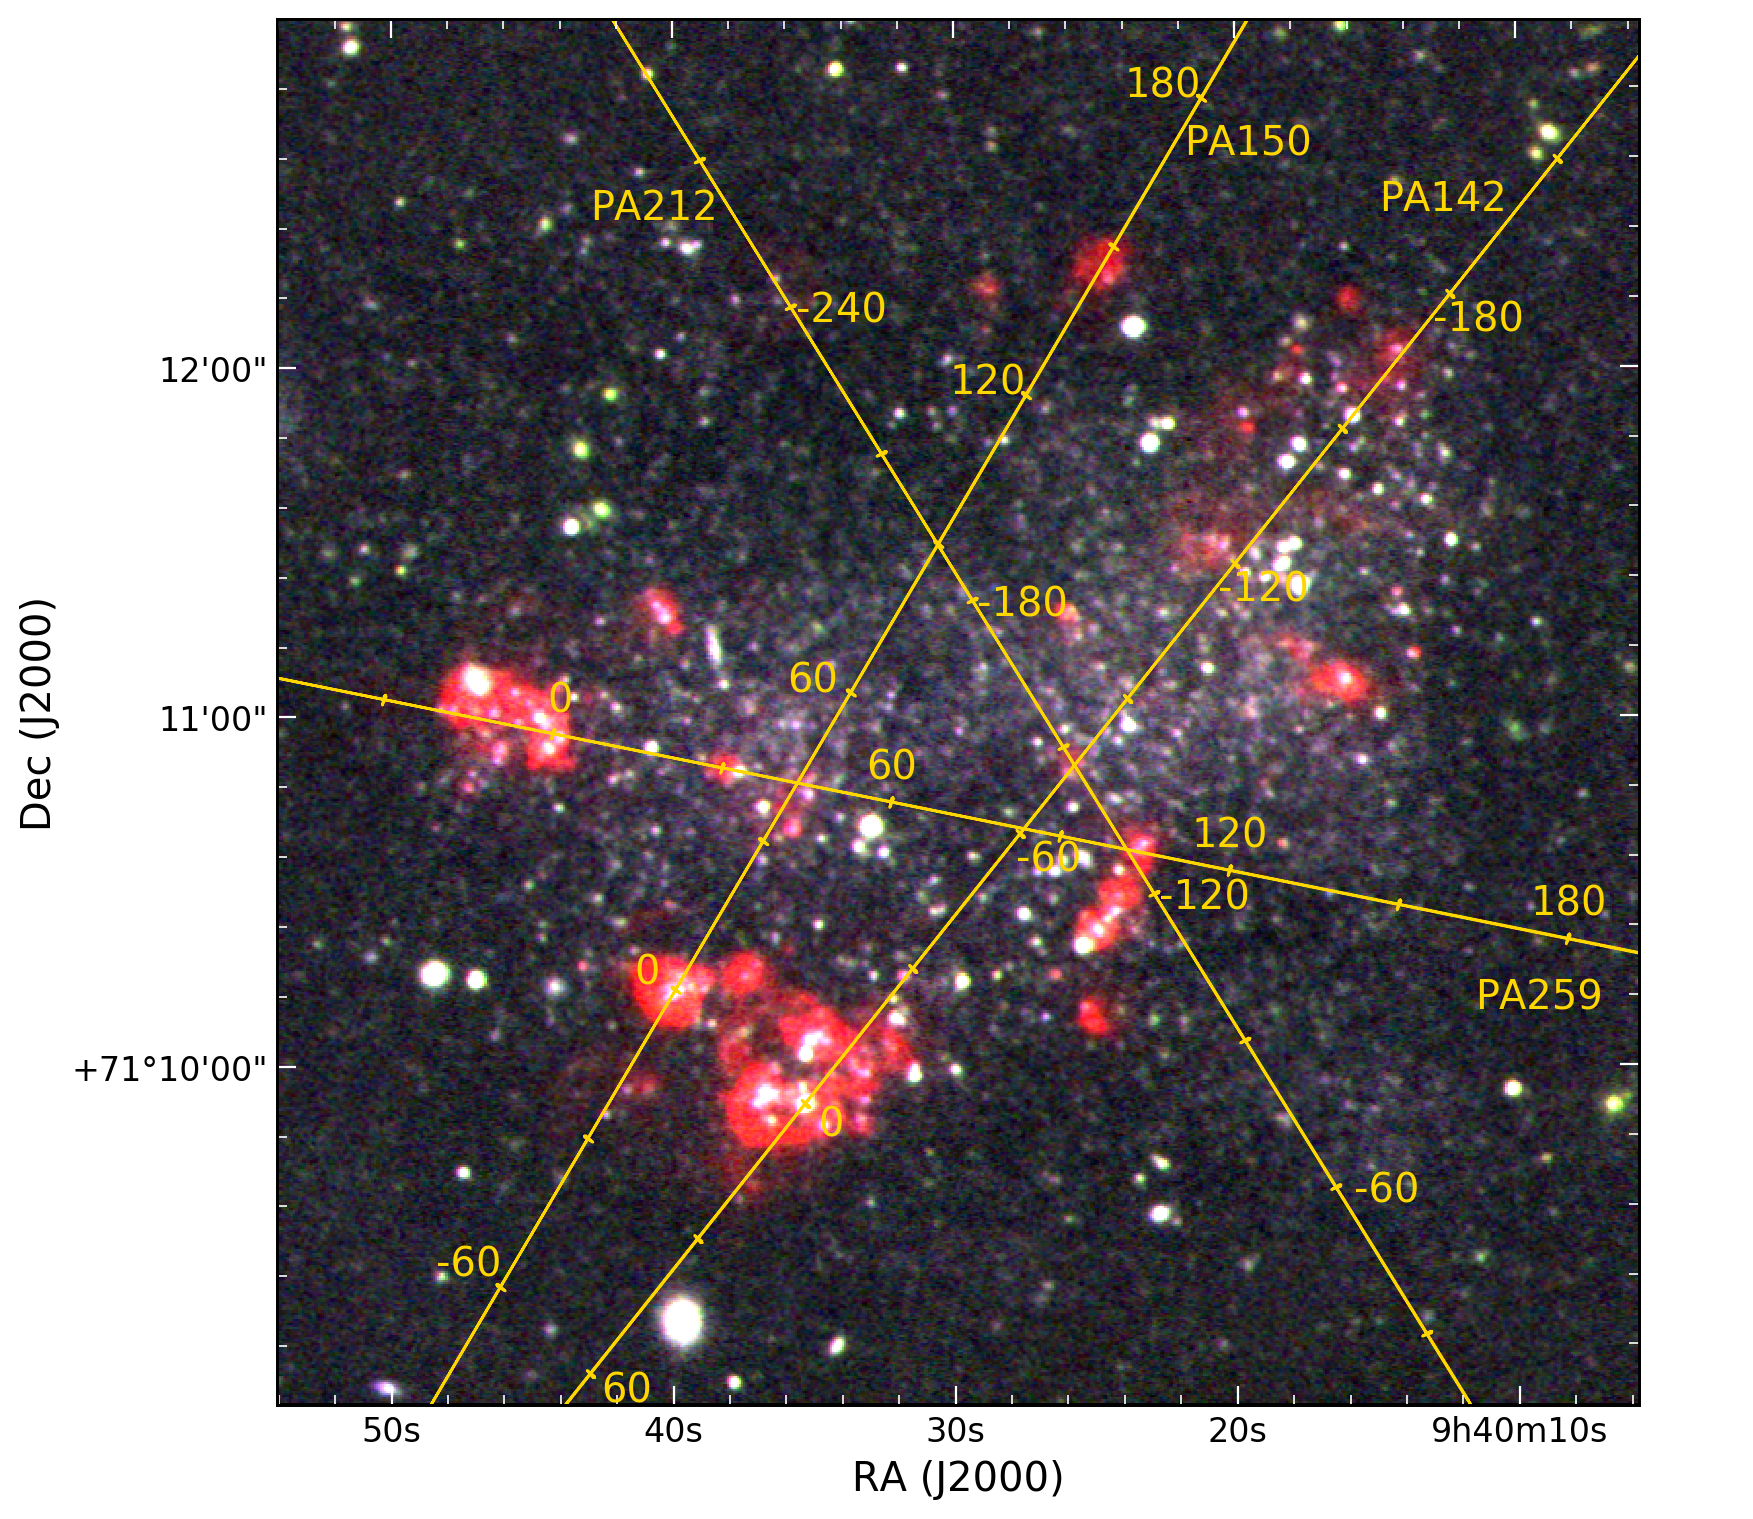
We observed the galaxy Holmberg I in the long-slit mode of the SCORPIO-2 focal reducer at 6-m SAO RAS telescope. Using the VPHG1200@540 grism as a disperser, we have obtained spectra with four slit positions (PA=142, PA=150, PA=212, and PA=259, see Fig. 2). The length of the used slit was 6 arcmin, while its width was 1 arcsec. The spectral resolution estimated as the FWHM of air-glow emission lines varied from 4.5 to 5.2 Å.
The data reduction was performed in a standard way using the idl-based pipeline for reducing long-slit spectroscopic data obtained with SCORPIO-2. The data reduction includes the bias subtraction, line curvature and flat field corrections, linearisation and air-glow lines subtraction. We linearised the spectra using the reference spectrum of the He–Ne–Ar lamp obtained during observations. In order to calibrate the spectra to the absolute intensity scale, we observed one of spectrophotometric standards (AGK 81d266 and G191B2B) at a close zenith distance immediately after or before the object.
The spectrum corresponding to the slit position PA=259 was observed twice with different exposures and at different seeings. In order to increase the signal-to-noise ratio, we have combined the two observations into a single spectrum for a further analysis. Before that, the spectrum with a better seeing was convolved with the Gaussian kernel to achieve the same spatial resolution as for the second one.
It is worth noting that the spectrum with PA=150 was observed in bad weather conditions. The unstable transparency due to clouds has made the flux calibration unreliable for that spectrum, yet the relative flux ratios of nearby emission lines analysed in this paper are correct.
The main purpose of the long-slit observations was to analyse the age, ionization conditions, and gas metallicity of H ii regions in the galaxy. Hence, we were interested in the emission-line fluxes and equivalent width. To measure the fluxes of emission lines we used our own software working in the idl and based on the mpfit (Markwardt, 2009) routine. The Gaussian fitting was applied to measure the integrated line fluxes of each studied region. To subtract a spectrum underlying stellar population, we performed its modelling using the ULySS111http://ulyss.univ-lyon1.fr package (Koleva et al., 2009). However, its influence on the measured emission-line fluxes of H ii regions appears to be almost negligible in our case, so we decided to skip this procedure in order to not add systematic errors, which can be produced in case of an unreliable model. For estimating the final uncertainties of the measured line fluxes, we quadratically added the errors propagated through all data-reduction steps to the uncertainties returned by the mpfit.
A reddening correction was applied to each spectrum before estimating the line-flux ratios listed in the paper. For that we derived the colour excess from the observed Balmer decrement and then used the Cardelli et al. (1989) curve parametrized by Fitzpatrick (1999) to perform a reddening correction. In this paper, we use the following abbreviations of the emission-line flux ratios: [S ii]/H is F([S ii] 6717,6731Å)/F(H); [N ii]/H is F([N ii] 6584Å)/F(H); [O iii]/H is F([O iii] 5007Å)/F(H).
2.3 Narrow-band imaging
Deep optical images of Holmberg I in the H, [S ii], and [O iii] emission lines were taken at the prime focus of the 6-m SAO RAS telescope with the SCORPIO (Afanasiev & Moiseev, 2005) and SCORPIO-2 multimode focal reducers using the narrow-band filters FN655, FN674, and FN501, respectively. The transmission curves of each used filter can be found on the SCORPIO-2 website222https://www.sao.ru/hq/lsfvo/devices/scorpio-2/filters_eng.html.
We used the broader-band FN608, FN712, and SED525 filters centred on the continuum to subtract stellar contamination from the images obtained in the same night.
In order to calibrate the images to the absolute intensity scale, we observed the spectrophotometric standard AGK 81d266 with each line-centred filter immediately after the object at a close zenith distance. The obtained images were additionally corrected for the interstellar reddening using the Cardelli et al. (1989) curve parametrized by Fitzpatrick (1999) and the colour excess derived from our spectra.
Because the FWHM of the FN655 filter is broader than the distance between the H and [N ii] emission lines, the image in this filter is contaminated by the [N ii] 6548, 6584 Å emission. According to our spectroscopic observations, the [N ii]/H flux ratio is for Holmberg I (see Section 6). Since the transmission of the FN655 filter is lower in the region of [N ii] emission lines than that of H, we conclude that the [N ii] contamination of H images does not exceed 5 per cent.
A similar situation also takes place for the FN501 filter – the [O iii] 5007 Å image is contaminated by the [O iii] 4959 Å line that is 3 times fainter. Taking it into account, as well as the differences of the FN501 filter transmission at 5007 Å and 4959 Å, we multiplied the fluxes of the final [O iii] image to 0.8 to reveal only [O iii] 5007 Å emission-line contribution.
Our final narrow-band images show surface-brightness value at the level corresponding to in the H, [S ii], and [O iii] emission lines, respectively.
In order to get the [O iii]/H flux ratio from our images, we took into account a theoretical ratio of for K and used the reddening corrected H image divided to this value to estimate the H flux. All the [O iii]/H maps and values derived from the images and used further in the paper were obtained in that way. Because of the low metallicity and hence the low dust content in Holmberg I, as well as of the small variations of (according to our spectra, see Section 6), this procedure yields realistic values of the [O iii]/H flux ratio in our case. The performed Monte Carlo simulations showed that typical relative uncertainties of that ratio for our data are 10 per cent for the signal-to-noise ratio S/N=30 and 30 per cent for S/N=5. At the same time these uncertainties should be 5 and 27 per cent, respectively, if direct measurements of the H flux were available.
2.4 Multiwavelength archival data used
We used the archival VLA data in the H i 21-cm line from the LITTLE THINGS survey (Hunter et al., 2012) for studying the H i gas distribution and kinematics. In this work we used the natural-weighted data cube with the angular resolution arcsec and velocity scale per channel.
In order to analyse the stellar population, we used the images of Holmberg I obtained with the ACS/WFC camera at the Hubble Space Telescope (HST) with the F555W and F814W wide-band filters. These images were obtained as part of a larger HST program aimed at studying M81 Group dwarf galaxies (GO-10605; PI: Skillman; Weisz et al. 2008) and were reprocessed within the ACS Nearby Galaxy Survey Treasury (ANGST) project in Dalcanton et al. (2009). In this paper we used their published results of stellar photometry.
The archival far-ultraviolet (FUV) images from the GALEX observatory were used for analysing the recent star-formation activity in Holmberg I. The calibrated data published by Hunter et al. (2010) were downloaded from the LITTLE THINGS archive.
3 Young stellar population
The first studies of the young stellar population in Holmberg I were performed by Hoessel & Danielson (1984) with an early CCD imaging. They found that the galaxy has a small number of stars with the masses , and that even the majority of the stars appear to have evolved significantly to the red.
The abilities of HST images allowed one to study the resolved stellar population and star-formation history in the galaxy. Weisz et al. (2008) presented the spatial density distribution of blue and red stars in Holmberg I (see their fig. 9). They found that older red stars are highly concentrated in the interior of the central H i SGS, while the blue stars location correlates with the H ii regions. The authors showed that Holmberg I had two episodes of the intense star formation – the ancient one that occurred several Gyr ago and the current one that started in the last 100 Myr.
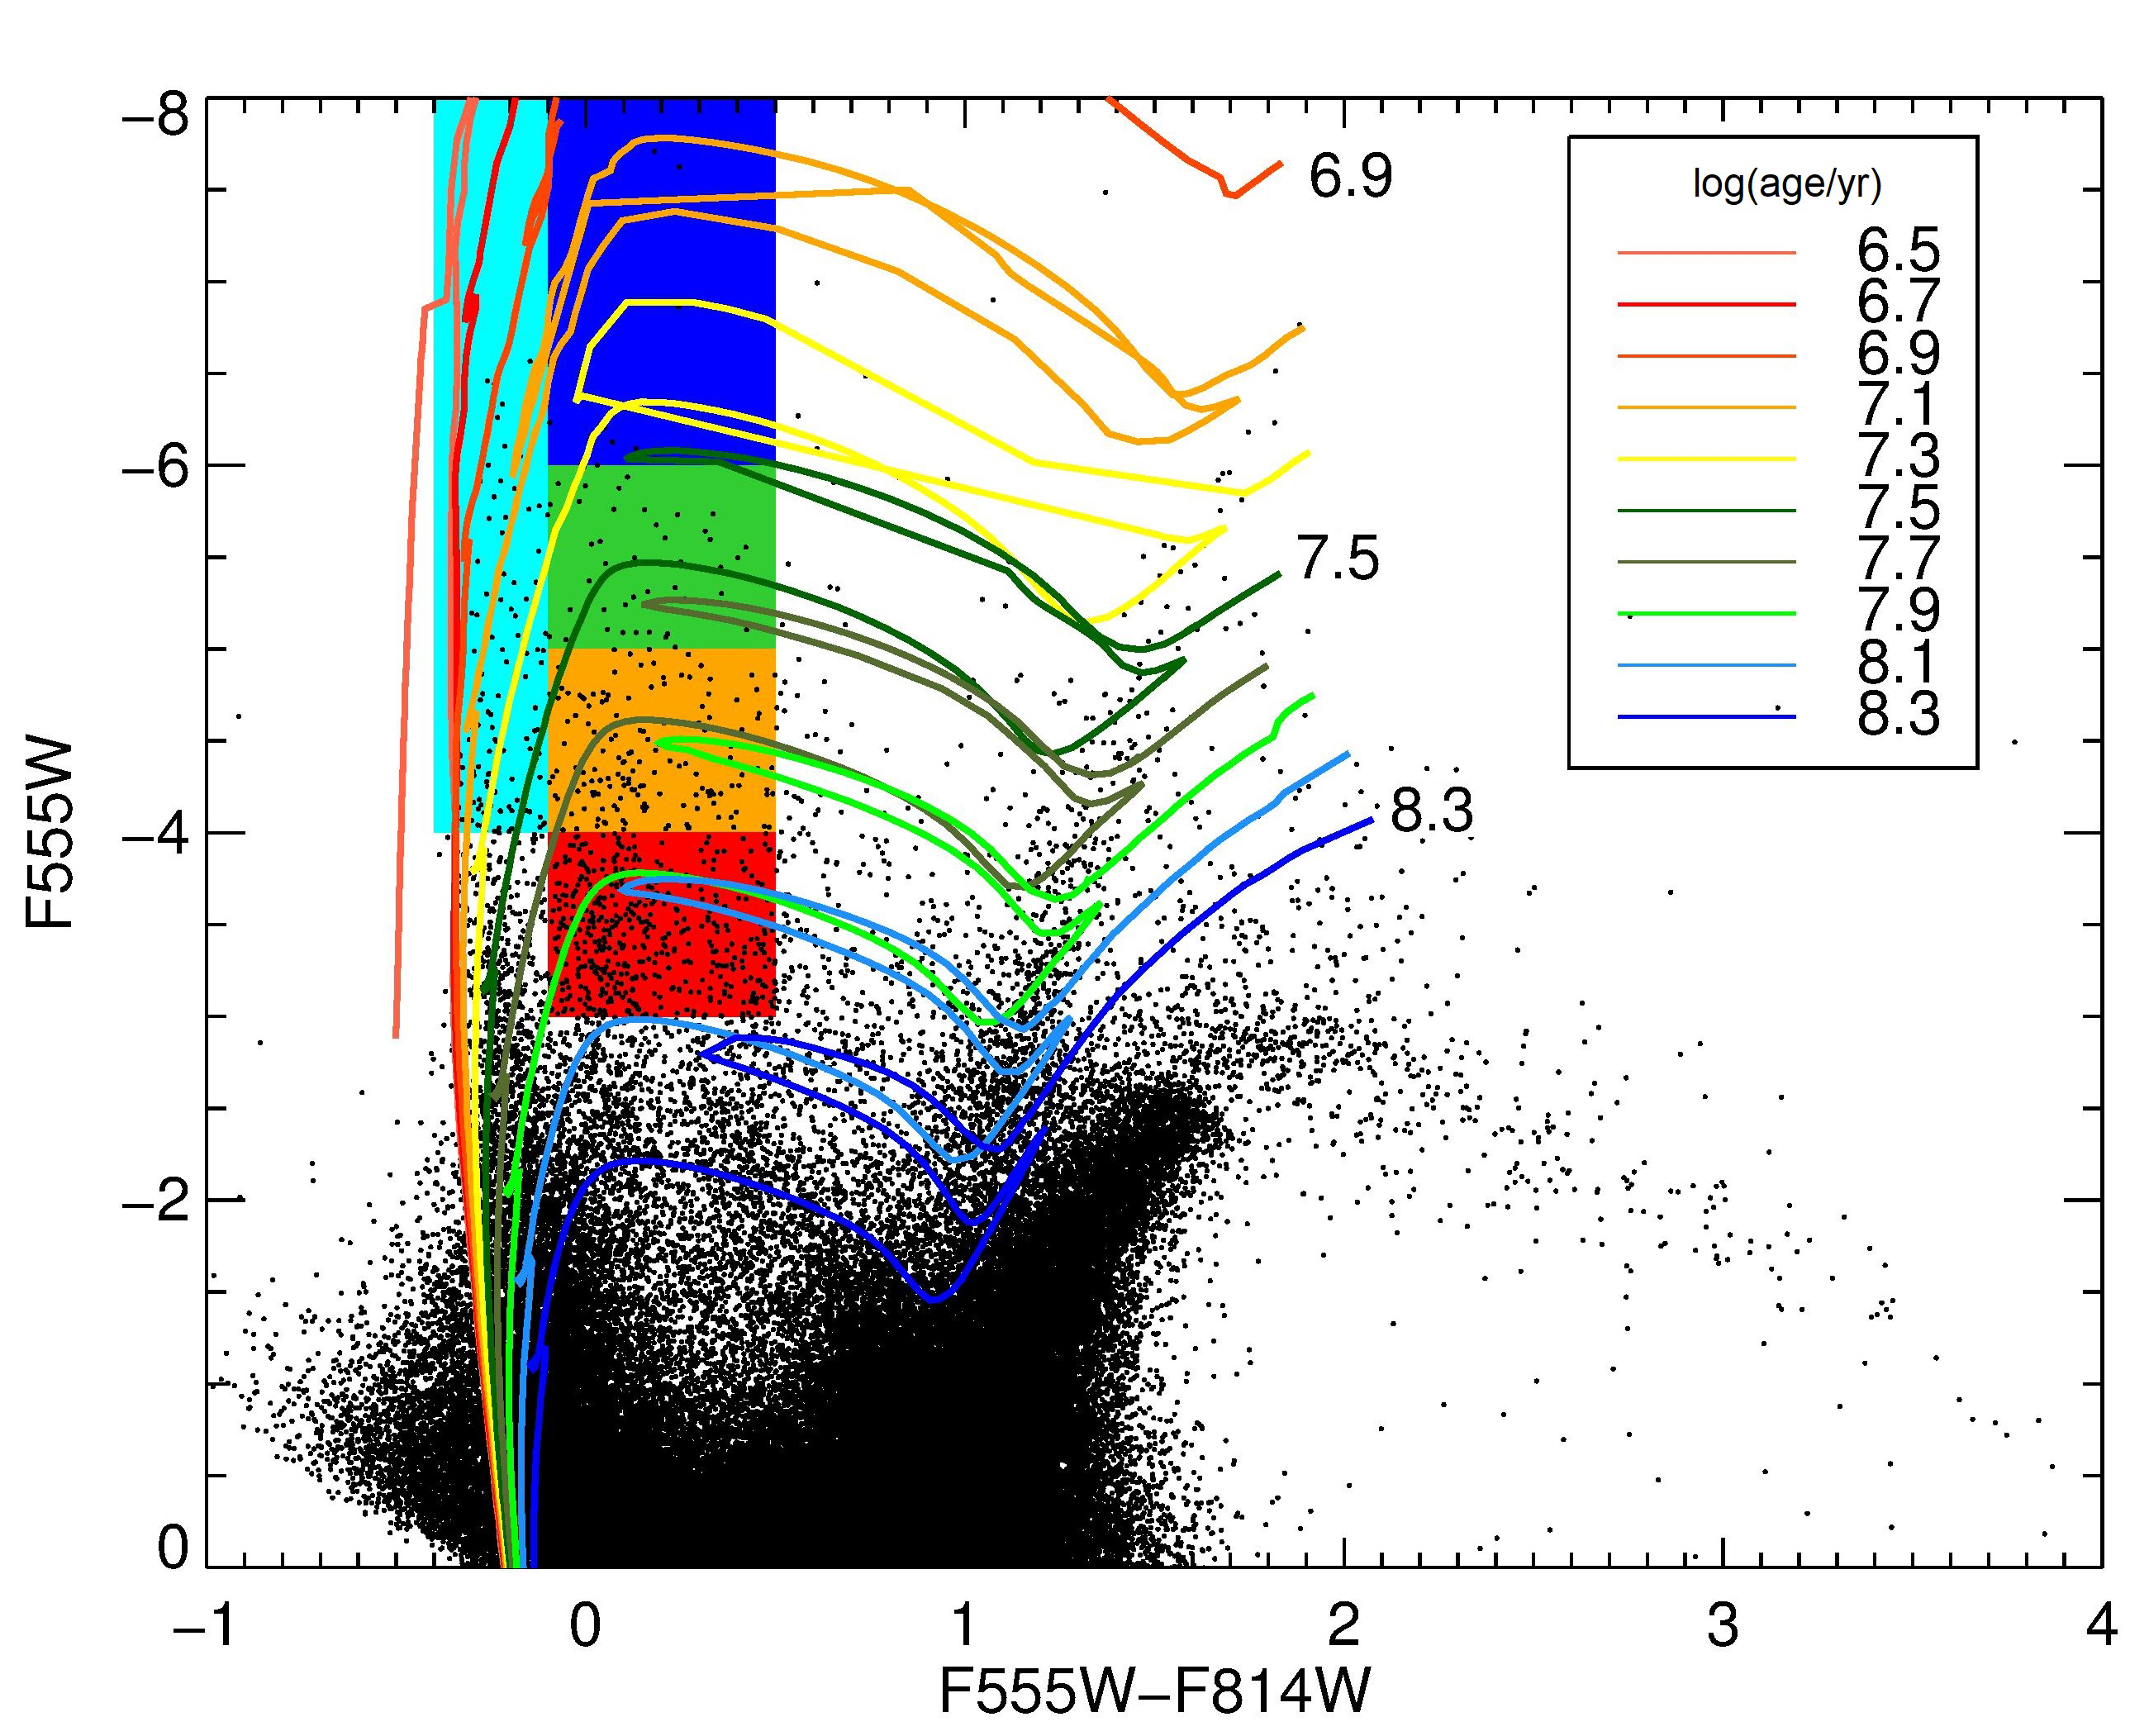
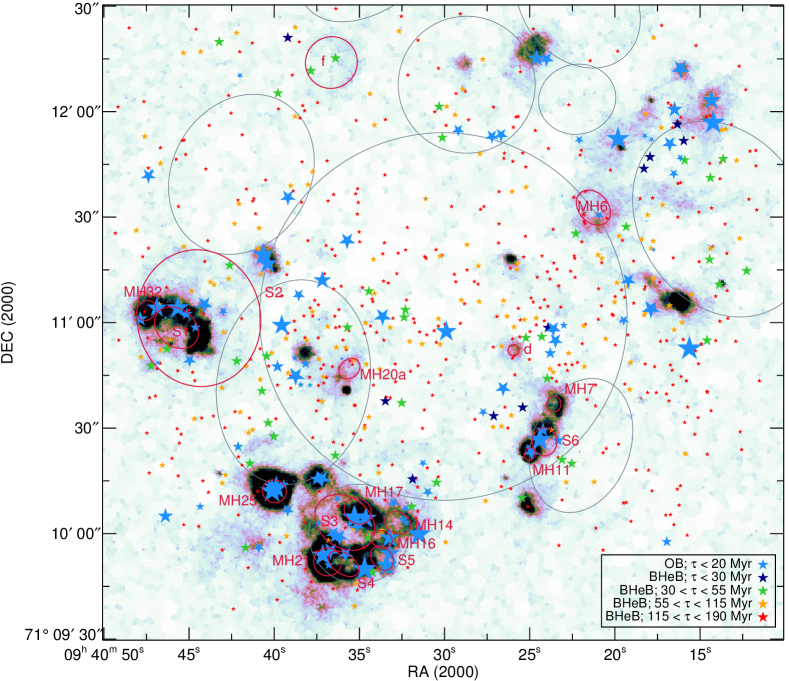
We used the available results of the HST photometry of individual stars in Holmberg I to identify main-sequence OB stars which could be responsible for ionization of the observed H ii complexes. The selection of these stars was performed following the procedure described in Bastian et al. (2011). Analysing the colour–magnitude diagram (CMD), shown in the top panel of Fig. 3, we identified 121 objects that should be young OB stars, 40 stars among them have and give the major contribution to ionization. Their location is shown in Fig. 4 in light blue; the size of star symbols correlates with their number of ionizing quanta on the logarithmic scale. It is worth noting, however, that since the main-sequence branch is not very clearly resolved in the CMD, some of the detected OB stars might not be OB stars actually.
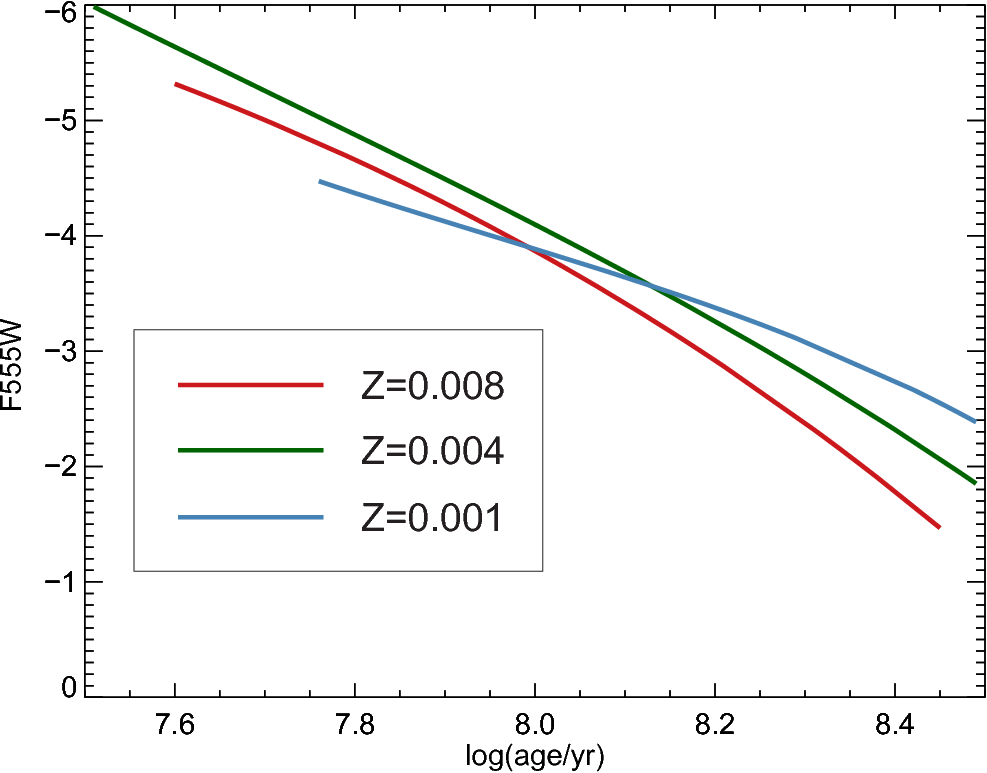
Many previous studies (see, e.g., Dohm-Palmer et al., 1997; Weisz et al., 2008; Bastian et al., 2011) used the position of Blue Helium Burner stars (BHeB) in the CMD as a good indicator of their age. To select BHeB stars of different ages in Holmberg I, we used the PARSEC isochrones (Bressan et al., 2012; Chen et al., 2014, 2015; Tang et al., 2014) computed with the CMD 2.9 code333http://stev.oapd.inaf.it/cmd. As is shown in the bottom panel of Fig. 3, the F555W luminosity of such stars almost linearly correlates with their age. We plotted the isochrones for the metallicity and age over the CMD shown in the top panel of Fig. 3. The coloured regions in the CMD represent different stages of stellar evolution. The cyan region is for young main-sequence OB stars (mostly O stars) with absolute F555W magnitude less than ; their age is smaller than 20 Myr. The colours from blue to red show the location of BHeBs of different ages. The blue colour corresponds to the stars younger than 30 Myr, green – to those between 30 and 55 Myr, orange – to the stars with ages between 55 and 115 Myr, and the red area contains the stars with ages from 115 to 190 Myr. Note that stars at other evolution stages should also appear in the mentioned areas, but the BHeB stage is noticeably longer, and we can expect most of the detected stars to be at that stage. The locations of the detected OB and BHeB stars are shown in Fig. 4.
As follows from Fig. 4, the main-sequence O stars that trace the areas of the ongoing star formation are indeed located mainly in the H ii regions. The distribution of BHeBs traces the location of regions of the recent star formation and as one can see from Fig. 4, most BHeBs aged between 30 and 55 Myr are located inside the central SGS and northwestern supershell. The older BHeBs are distributed more or less uniformly which agrees with the results of Bastian et al. (2011) for other galaxies.
4 Ionized- and neutral-gas kinematics
4.1 General neutral-gas kinematics
The previous studies (Ott et al., 2001; Oh et al., 2011) of the neutral-gas kinematics of Holmberg I have shown that this galaxy rotates slowly and demonstrates significant radial motions. The shapes of rotation curves reported by different authors look similar, yet the maximum velocity and the corresponding radius differ (see fig. 9 in Ott et al. 2001 and fig. A.10 in Oh et al. 2011). These discrepancies might be explained by a low inclination of Holmberg I and significant radial motions. All these factors make the analysis difficult and a bit controversial.
For analysing the gas kinematics, we would like to subtract the component corresponding to the regular galaxy rotation from any data cube we obtained. Such a procedure allows us to highlight the local gas motions caused by a stellar feedback or gas inflow/outflow processes. This ‘derotation’ method and its advantages are described in Egorov et al. (2014).
We tried to model the observed H i velocity field by tilted rings. Significant discrepancies were found towards the northwestern and southern outer parts of the galaxy, where the influence of the ram pressure or tidal interaction are probable. Because of that, we found that a simple tilted-ring model is not applicable in the case of Holmberg I, and the inclusion of warp and radial flows is necessary. However, since we are interested mostly in the inner part of the galaxy, the construction of such a detailed model is out of the scope of our paper.
In this paper for reconstruction of the velocity map corresponding to the galaxy rotation, we used the results of a more detailed modelling performed by Oh et al. (2011). The inclination and the position angle were adopted. Using this model, we have found that the residual motions in the H i do not exceed 8 in the area surrounded by the SGS. We subtracted the obtained model of the Holmberg I circular rotation from all H i and H data cubes used further.
4.2 Searching for H i and H superbubbles
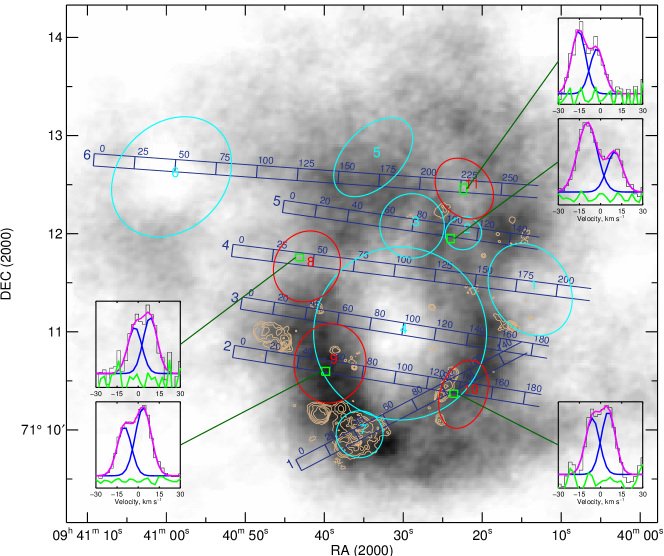
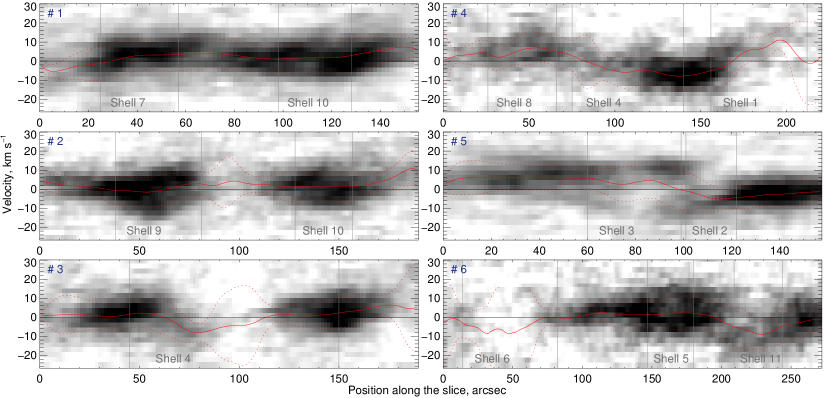
Up to now, seven H i supershells in Holmberg I were known. The central galaxy-sized SGS was studied in detail by Ott et al. (2001); these authors also mentioned the existence of a smaller H i supershell (#7 in Fig. 5) in the southeastern part of the SGS which is clearly seen on the H i map. Bagetakos et al. (2011) found six H i holes and expanding supershells (including the central SGS) by a visual inspection of channel maps and further confirmation by analysing the position-velocity (PV) diagrams. Warren et al. (2011) derived a slightly larger size of the SGS than other authors using the reprocessed H i data. The location of all the mentioned H i shells is shown in Figs. 4, 5, and their properties are listed in Table 3. We adopt a diameter of shell #7 given by Ott et al. (2001) (recalculated for a distance of 3.9 Mpc) and that for shell #4 (SGS) given by Warren et al. (2011). For all the other H i shells, we used the parameters listed in table 7 of Bagetakos et al. (2011)444We corrected a misprint in their table – radii are listed instead of diameters for Holmberg I which follows from a comparison with other works and the available H i data..
In this paper we are interested in the distribution and kinematics of the H i supershells in the context of their relation to the young stellar population and to the regions of the current star formation. We analysed the H i line profile in the vicinity of the star-forming regions in the SGS and constructed a large number of PV diagrams crossing different parts of the SGS. Fig. 5 shows several examples of them. One can see that almost all the H i supershells mentioned above exhibit approaching and/or receding sides in these PV diagrams (so-called ‘velocity ellipse’). Based on the analysis of the PV diagrams and two-component H i line fitting, we confirm previously published values of the expansion velocities for all of these supershells except for #2. For the latter, we found to be significantly lower than that published by Bagetakos et al. (2011). Moreover, since the largest separation between two components of the H i line profile inside shell #2 is observed at the border with shell #3, we propose that shell #2 might be just a part of larger shell #3.
| Name | (pc) | Age (Myr) | |
|---|---|---|---|
| H i shells | |||
| 1 | 1008 | 6 | 50 |
| 2 | 400 | 10 | 12 |
| 3 | 745 | 12 | 19 |
| 4 | 2000 | 6 | 50 |
| 5 | 858 | 12 | 21 |
| 6 | 1371 | 6 | 69 |
| 7 | 528 | 7 | 23 |
| 8 | 796 | 5 | 48 |
| 9 | 874 | 7 | 37 |
| 10 | 660 | 6 | 33 |
| 11 | 679 | 6 | 34 |
| H ii shells | |||
| S1 | 229 | 38 | 1.8 |
| S2 | 708 | <22 | >9.7 |
| S3 | 310 | (34) | (2.7) |
| S4 | 144 | (32) | (1.3) |
| S5 | 126 | (35) | (1.1) |
| S6 | 143 | 27 | 1.6 |
| MH6 | 184 | 20 | 2.8 |
| MH7 | 82 | 85 | 0.3 |
| MH11 | 63 | (20) | (1.0) |
| MH14 | 132 | (29) | (1.3) |
| MH16 | 106 | (39) | (0.8) |
| MH17 | 145 | (24) | (1.8) |
| MH20a | 111 | 25(17) | 1.3 (2.0) |
| MH21 | 152 | (29) | (1.6) |
| MH25 | 127 | (20) | (2.0) |
| MH32 | 106 | 31 (27) | 1.0 (1.2) |
| d | 60 | 74 | 0.2 |
| f | 282 | <22 | >3.8 |
As follows from the demonstrated PV diagrams, clear signs of ‘velocity ellipses’ are also seen outside the previously known H i supershells. Based on that, we detect four new expanding H i supershells denoted as #8 – #11. Their borders were derived from a visual inspection of the PV diagrams crossing the shell in different directions. Borders of shells #8 and #11 are seen on the H i integral map, while shells #9 and #10 do not appear on it. The last two are implicitly seen on the channel maps. The expansion velocities of these new detected H i shells were derived with the H i line fitting (see examples in Fig. 5); they correspond to .
We estimated the kinematic ages of all the H i supershells in terms of the Weaver et al. (1977) model by the relation where is the diameter in pc, – the expansion velocity in , and – the age in Myr. All the values are listed in Table 3.
Thus, the central SGS exhibits a number of local expanding H i supershells of a smaller size on its rim; all H i supershells are plotted in Fig. 4.
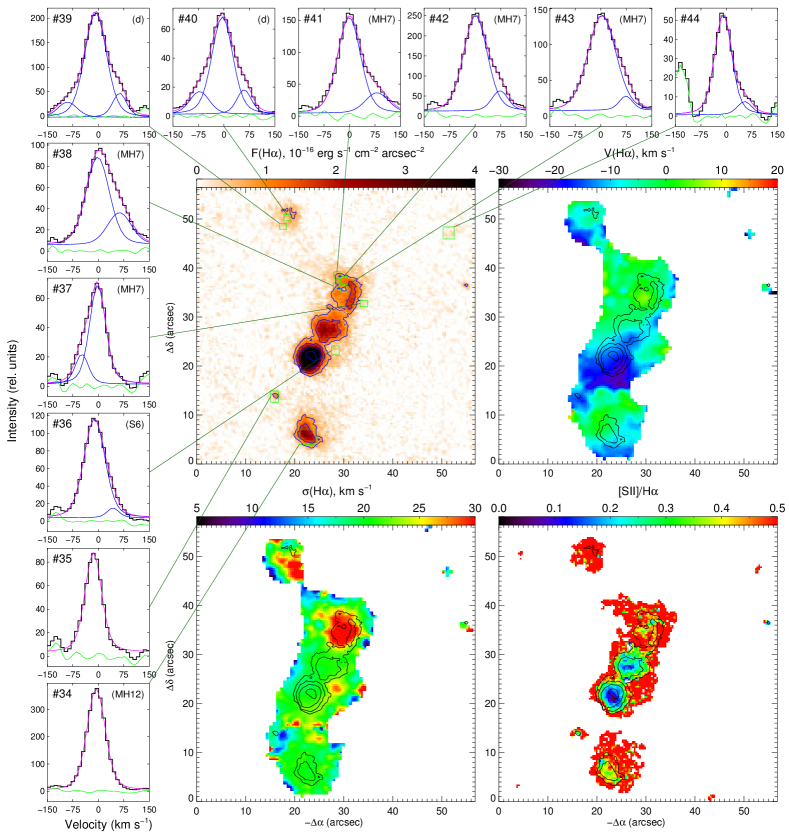
By analysing the H image we identified 18 shell-like emission structures. They mostly correspond to H ii regions, while 6 of them are faint shells between several H ii regions named S1 – S6. We show all the identified ionized shells in Fig. 4 by the red ellipses.
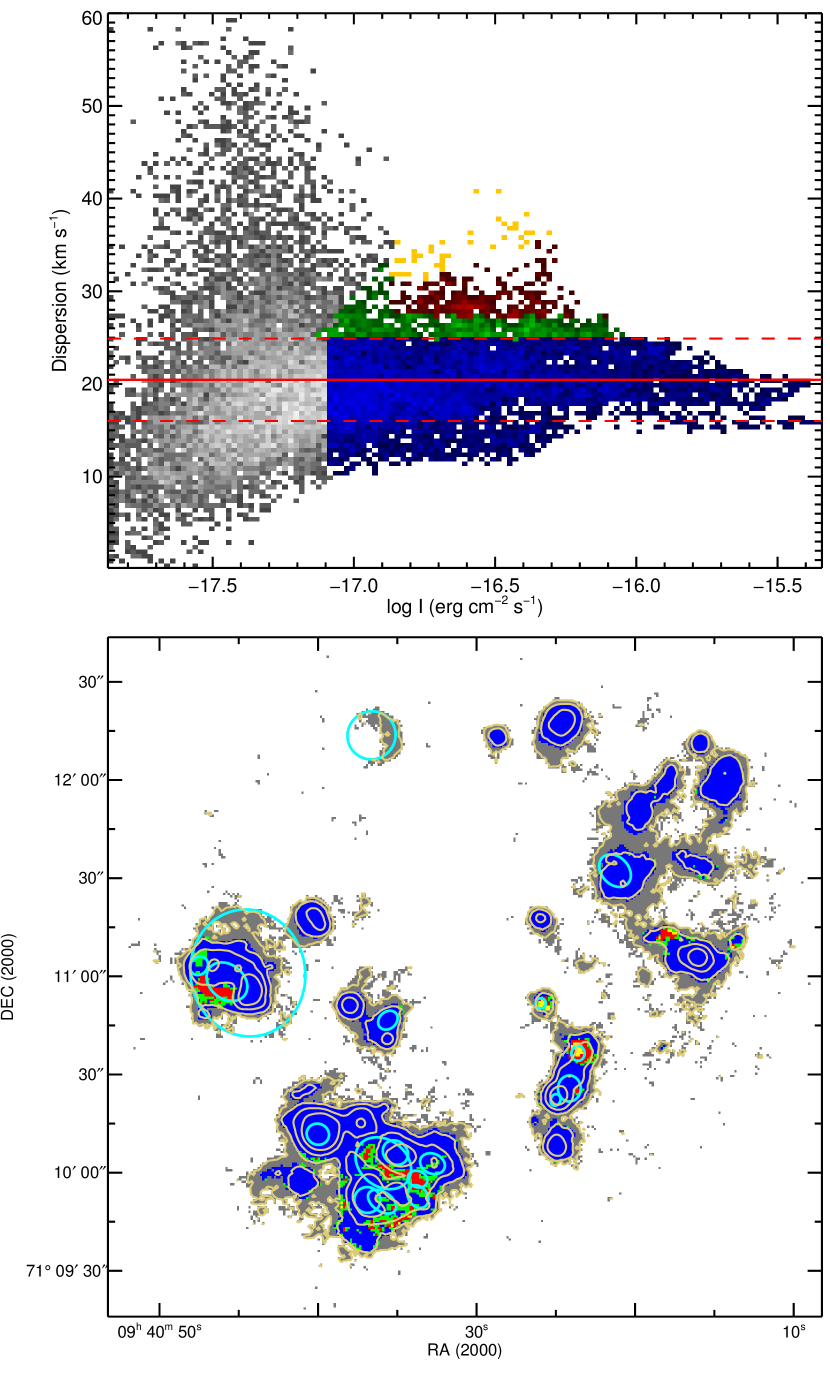
It has been shown in many studies (Muñoz-Tuñon et al., 1996; Moiseev & Lozinskaya, 2012; Vasiliev et al., 2015a, see also references therein) that the intensity – velocity dispersion diagrams for ionized gas can be successfully used to identify areas where the increased velocity dispersion is caused by expanding shells. We fitted a single-component Voigt profile to the H line profile in each pixel obtained from the FPI data cube and constructed the diagram shown in Fig. 6. The red line in the diagram marks the intensity-weighted average velocity dispersion of ionized gas in the galaxy – . The identical colours in the diagram (top panel) and map (bottom panel) are used to highlight the characteristic areas. Thus, the horizontal strip with a relatively low velocity dispersion and high surface brightness marked in blue corresponds to bright H ii regions and includes 50 per cent of galaxy’s H flux. The areas of the increased dispersion, which are most likely associated with spectroscopically unresolved expanding shells, are shown in green, whereas the red colour corresponds to shell-like structures with the expected clear separation of the line profile components. As was shown in Moiseev & Lozinskaya (2012), the diagonal yellow lane could correspond to the presence of compact objects, which highly influence the ISM (like WR, LBV stars, supernova remnants). The remaining areas of low surface brightness corresponding to the diffuse gas and to the edges of H ii regions are shown in grey.
As it follows from a comparison of with the location of the identified ionized shells, a half of them are clearly expanding. Additionally, two areas not showing the corresponding shell-like nebula appear in the diagram as expanding superbubbles. One of them is located at the southern edge of the complex of ionized shells and might represent faint expanding superbubbles without resolved morphology, while another (in the western complex of ionized nebulae in the galaxy) coincides with the relatively bright H ii region – MH4.
We tried to estimate the expansion velocities of the identified ionized superbubbles applying a multicomponent Voigt fitting to the observed H line profile towards the inner part of each of them (see the examples of the line profiles in Figs. 8 – 12). Unfortunately, with the current spectral and spatial resolution only two regions – MH7 and d – show clear separated components in the line profiles. These objects are marked by the yellow colour in the diagram and identified as probably unique energy sources. In Section 6 we will show that they are good supernova remnant candidates.
Most of the remaining shells reveal the enhanced velocity dispersion inside them, and the blue- or redshifted faint components are observed in the wings of the H line profile in some of them. For those objects, we used a separation between the components to estimate their expansion velocity.
A small angular size of some of the observed ionized shells results in smoothing the line profiles (even for relatively fast-expanding regions) and makes impossible the direct detection of signs of their expansion from the line profile asymmetry at the given spatial resolution. At the same time, for several H ii regions we observe the maximum line-of-sight velocity dispersion in its centre, while it slowly decreases towards the edge. As was shown in Guerrero et al. (1998), in such a case, the expansion velocity correlates well with the gradient of the line-of-sight velocity dispersion, and as we will show in Smirnov-Pinchukov & Egorov (in prep.), it can be estimated as
| (1) |
where is the velocity dispersion inside the nebula, – in its unperturbed vicinity. The coefficient depends on the spectral resolution and on ; in the case of our data . The results are listed in Table 3.
Using the estimated expansion velocities, we measured a kinematic age of each ionized superbubble using the same approach as for H i supershells. The obtained values do not exceed 3 Myr for all the regions except S2 and f. These older faint supershells will be discussed in Sections 5 and 6, respectively.
It is worth noting that the estimated values of the kinematic age correspond to the expansion velocities measured by faint details in the wings of the H line profiles for almost all regions. Since these faint components can be of origin not related to an expanding superbubble (e.g., a local gas inflow/outflow), the calculated values of can be significantly overestimated which leads to possible underestimation of the age.
5 Complexes of ionized gas and ionization balance
| Complex | LyC | LyC H ii | H ii reg. | Size | Age | morphology | ||||
| (pc) | erg s-1 cm-2 | Å | (Myr) | |||||||
| total | 16.0 | 4.5 | ||||||||
| 29 | 25.7 | 4.6 | multiple | |||||||
| 30 | 90 | 4.2 | 5.0 | compact | ||||||
| 1 | 1.52 | 0.86 | 31 | 90 | 1.2 | 7.2 | diffuse | |||
| 32 | 220 | 16.7 | shell | |||||||
| i | 0.6 | diffuse | ||||||||
| 14 | 10.0 | 5.5 | shell | |||||||
| 16 | 6.7 | 5.5 | multiple | |||||||
| 17 | 14.7 | 5.4 | comp.+shell | |||||||
| 18 | 6.8 | 6.0 | compact | |||||||
| 19 | 1.3 | 648 | 4.6 | diffuse | ||||||
| 2 | 7.06 | 2.49 | 21 | 20.8 | 4.4 | shell | ||||
| 22 | 8.6 | 5.3 | compact | |||||||
| 23 | 5.6 | 4.3 | compact | |||||||
| 25 | 50.0 | 4.1 | shell | |||||||
| g | 2.2 | 4.3 | diffuse | |||||||
| h | 1.3 | 5.5 | diffuse | |||||||
| 7 | 4.7 | 5.5 | shell | |||||||
| 8 | 130 | 0.8 | 7.8 | diffuse | ||||||
| 3 | 1.2 | 0.46 | 9 | 6.0 | 5.3 | compact | ||||
| 11 | 10.2 | 5.0 | shell | |||||||
| 12 | 4.2 | 3.8 | compact | |||||||
| d | 1.4 | 7.5 | shell | |||||||
| 20 | 1.3 | 5.9 | compact | |||||||
| 4 | 0.33 | 0.12 | 20a | 2.6 | 8.1 | shell | ||||
| 24 | 130 | 2.8 | 7.1 | compact | ||||||
| 1 | 4.6 | 237 | 6.0 | diffuse | ||||||
| 2 | 9.6 | 4.6 | compact | |||||||
| 3 | 0.6 | 86 | 7.6 | diffuse | ||||||
| 4 | 110 | 1.2 | 7.6 | diffuse | ||||||
| NW | 1.86 | 0.6 | 5 | 60 | 0.6 | 4.8 | compact | |||
| 6 | 290 | 5.7 | 7.6 | shell | ||||||
| a | 40 | 0.4 | 6.4 | compact | ||||||
| b | 115 | 1.5 | 2.9 | compact | ||||||
| c | 205 | 2.0 | 7.4 | multiple | ||||||
| 0.30 | 0.11 | 10 | 235 | 7.4 | 2.9 | diffuse | ||||
| 0 | 0.03 | 13 | 75 | 1.2 | 6.6 | compact | ||||
| separate | 0.83 | 0.06 | 26 | 200 | 4.6 | 6.1 | multiple | |||
| 0.036 | 0.016 | e | 125 | 1.1 | 263 | 5.7 | compact | |||
| 0 | 0.03 | f | 310 | 1.7 | 225 | 6.1 | shell | |||
| ∗ EW(H ) the value is highly contaminated by the presence of a background galaxy. Hence, the age can be overestimated. | ||||||||||
The ionized gas in Holmberg I is distributed along the walls of the central H i SGS revealing the brightest H ii regions in its southeastern part and relatively faint regions in the area between this SGS and another one in the west. Our estimate of the galaxy’s H flux corrected for reddening erg s-1 cm-2 is in good agreement with the previous measurements made by Karachentsev & Kaisin (2007).
Our deep H images, as well as FPI data, allowed us to identify several new faint H ii regions and diffuse structures that were never observed before in Holmberg I. It is clearly seen from our data that the individual H ii regions in the galaxy are bound together by faint filament-like structures with a surface brightness of in the H line.
Based on these newly discovered faint structures joining bright nebulae, we select five unified extended complexes in Holmberg I. Further, we will show that they indeed represent physically connected complexes of the ongoing star formation. The location of these H ii complexes (#1, 2, 3, 4, and NW), as well as the names of bright nebulae (according to the list of Miller & Hodge 1994) inside them, are shown in Fig. 7. The faint newly identified H ii regions are named by letters.
Almost all the H ii regions, except for MH10, 13, 26, e, and f are part of these selected complexes. Note, however, that a diffuse emission is observed between complex #1 and the H ii region MH26. Similarly, a faint bridge in H is also seen between the complex NW and the H ii regions MH10, 13, and e. Despite that, we do not include them in the mentioned complexes because of a large relative distance and different environment in H i (e.g., the region MH10 is located in the place where 3 H i supershells collide, and is separated from the complex NW by H i shell #2).
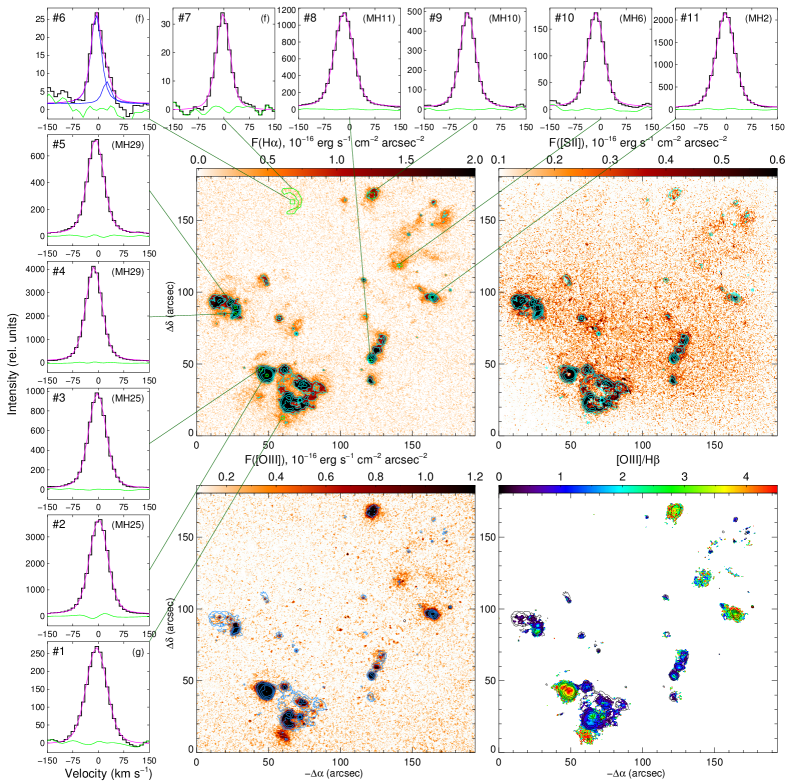
In general, the morphology of ionized gas in Holmberg I in the [S ii] and [O iii] lines (see Fig. 8) is consistent with the H distribution, yet the images in [S ii] and [O iii] are much more noisy. Note that several H ii regions appear to be brighter in [O iii] than in H, that is especially clear in the bottom right-hand panel of Fig. 8. We will discuss these regions in Section 6. The maps of the [S ii]/H ratio shown in the bottom right-hand panels of Figs. 8–12 for each complex reveal a picture typical of other Irr galaxies: most H ii regions have a low value of [S ii]/H in their centres, while it grows towards their edges. In the majority of regions, the ratio [S ii]/H is observed only in the areas of faint filaments and diffuse emission outside the bright H ii regions. Most probably, we observe an emission of the diffuse ionized gas (DIG) there which is detected in many other galaxies. Its emission and enhanced line ratios in star-forming galaxies are usually explained by the leakage of hard ionizing quanta from H ii regions with an additional influence of shock waves propagating through the low-density medium and turbulent mixing layers (see, e.g., Hoopes & Walterbos, 2003; Seon, 2009; Zhang et al., 2017, and references therein).
If the H ii complexes we selected are indeed unified structures, their H emission should be consistent with the location of the young stars inside a complex, and the age of H ii regions in a complex should be more or less identical. We estimated the age of each H ii region from the equivalent width () of its H emission line derived from the images in this line and in the nearby continuum ( derived from the spectra is also used in Section 6).
The possibility of using the of Balmer lines as an age indicator was illustrated by a number of authors (e.g., Copetti et al. 1986; Schaerer & Vacca 1998; Leitherer et al. 1999). We use the model published by Levesque & Leitherer (2013) for the sub-solar metallicity (). The results are listed in Table 4. Taking into account that becomes much less sensitive to ages older than Myr, we may state that the ages of H ii regions are almost identical in each H ii complex, yet a few younger or older regions than median value are observed.
As follows from a comparison between Table 4 and Table 3, the age of the H ii regions derived from is systematically higher than kinematic-age estimates for the same regions. Such a problem of inconsistency between these two methods of age estimation was discussed previously in Wiebe et al. (2014). As we mentioned in Section 4, because of the assumption used for estimating the expansion velocity, the obtained values of kinematic ages can be underestimated. On the other hand, the relation between and the age of H ii region was obtained assuming a single stellar population and is highly dependent on the used models and initial mass function. The presence of an additional older stellar population in the region (that is very probable in Holmberg I since stars with ages of about 100 Myr are observed in the same place as OB stars, see Fig. 4) will increase the observed continuum level and decrease the age derived with this method.
We analysed the ionization balance for each complex based on the selection of O stars made in Section 3. Using the models from Martins et al. (2006), we evaluated the bolometric luminosity and the number of ionizing photons LyC from each O star. Similar values can be inferred from the observed H flux. We estimated the number of ionizing photons needed for gas ionization in each H ii complex with the procedure described in Osterbrock & Ferland (2006). For the case of optically thick nebulae, its H luminosity depends on as
| (2) |
where the H effective recombination coefficient and the total recombination coefficient of hydrogen for K. Hereafter we refer to the estimated amount of needed ionizing photons from (2) as LyCHII to note that it has been converted from the H luminosity.
The estimated values of LyCHII and LyC for each H ii complex are shown in Table 4. As follows from this table, the identified young massive stars provide even more than enough ionizing quanta to produce the observed H luminosity of each complex.
The excess of ionizing quanta points to their possible leakage from the H ii complexes because of the porosity of the ISM. About 60 per cent of the available ionizing radiation should escape from each H ii complex to provide the observed H flux. A recent modelling of the feedback of a star cluster onto the ISM performed by Rahner et al. (2017) has shown that the escape fraction of ionizing radiation from low-metallicity (the same as for Holmberg I) massive molecular clouds might indeed be large – up to 60 per cent and even higher in some short periods of its evolution.
The large escape fraction of ionizing radiation from the H ii complex should provide a large amount of the diffuse H emission in the galaxy. Thus, Oey et al. (2007) showed that about 60 per cent of the total H emission of a galaxy (independently on its type) is represented by its diffuse component. Our values of the escape fraction are in agreement with these estimates. Our images actually reveal a number of elongated diffuse structures towards the inner part of the SGS and on the rims of smaller H i supershells. Earlier in Egorov et al. (2014) and Egorov et al. (2017), we have identified faint ionized giant (1.5–2 kpc sized) supershells on the inner rims of H i SGS of the galaxies IC 2574 and Holmberg II. Probably, such a large structure could also exist in Holmberg I, but its brightness is below the detection limit of our observations. Indeed, the ionized supershell in Holmberg II was observed at a surface brightness level of that is nearly the detection limit during our observations of Holmberg II but below that for Holmberg I.
Note also that some stars identified as being of the OB type could be not OB actually (see Section 3). Some young stars classified as OB in Fig. 4 lie significantly outside the H ii regions and probably are misclassified. This fact will reduce the estimated fraction of ionizing quanta especially calculated for the whole galaxy ( per cent).
Below we describe each of the identified H ii complexes and analyse their ionized gas kinematics (see Figs. 8–12).
H ii complex #1
This complex contains an arc of several bright H ii regions and the faint diffuse shell S1, and is limited by a faint ring with a diameter of about 700 pc (the shell S2). The brightest H ii regions in the complex are located at the outer edge of the SGS.
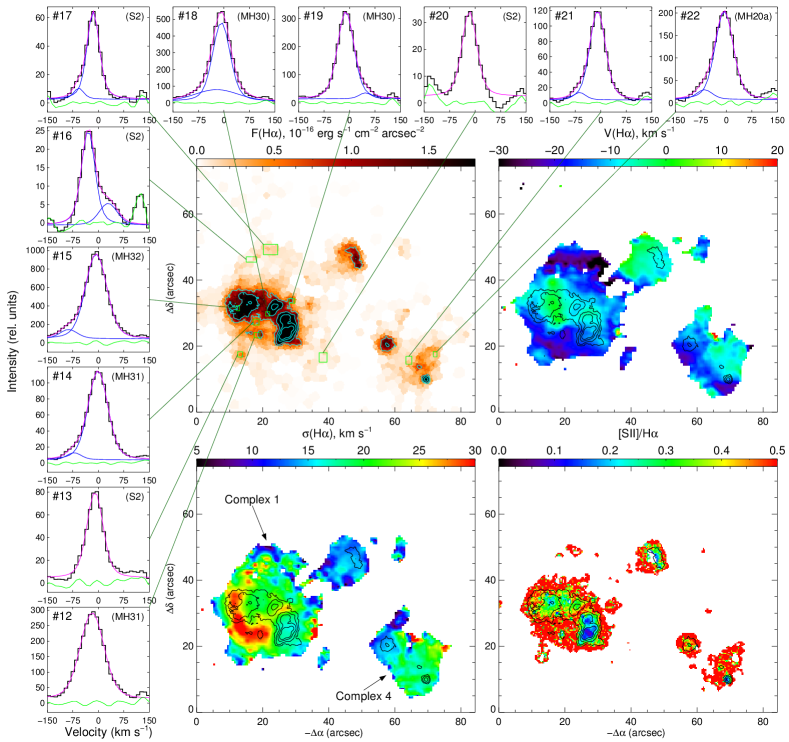
Faint blueshifted (and even broad underlying) components in the H line profiles are observed in the central part of the complex near the bright nebulae (see profiles #14, 18 in Fig. 9), while the faint redshifted emission is detected in the line profiles outside the bright nebulae towards the outer part of the complex (profile #19).
The most intriguing structure observed in this complex is a surrounding ring – shell S2. While it is only noticeable in other H images as a faint filament (see, e.g., Fig. 4), it is much better seen in the top left-hand panel of Fig. 9, where adaptive binning was used to reach a signal-to-noise ratio better than 10 in each pixel. An analysis of the FPI data cube shows that this structure is clearly seen at blueshifted velocities and almost disappear at red channels. The top right-hand panel of Fig. 9 also shows that the shell S2 is blueshifted relative to other part of the complex and of the whole galaxy as well.
Several faint clumps in the southern part of the ring S2 demonstrate the unperturbed single component H line profiles (see profiles #13 and #20 in Fig. 9), while its northern part reveals the slightly asymmetrical H line profiles (#16 and #17) with blue- or redshifted components in their wings. Note, however, that the signal-to-noise ratio for these components is low.
Only with this information at hand, we can speculate on a possible nature of the shell S2. It might be created by the ionizing radiation of a few O stars outside bright H ii regions as well as the UV photons leakage from those regions influencing surrounding neutral gas. As follows from Figs. 1, 5, complex #1 is located in the low-density medium (in comparison with the other part of the SGS) but at the edge of the relatively bright H i cloud. We propose that the complex is located at the front edge of this dense H i cloud. In that case we should observe the faint ionizing front moving towards us through the low-density H i medium even at a great distance from the complex, while its bright receding side should be much slower and will be interpreted as a non-shifted component of the line profile. Such a picture is able to explain the observed blue shift of the ring on the line-of-sight velocity map and is consistent with the observed H line profiles (the presence of a faint blueshifted component) from different regions of complex #1.
H ii complex #2
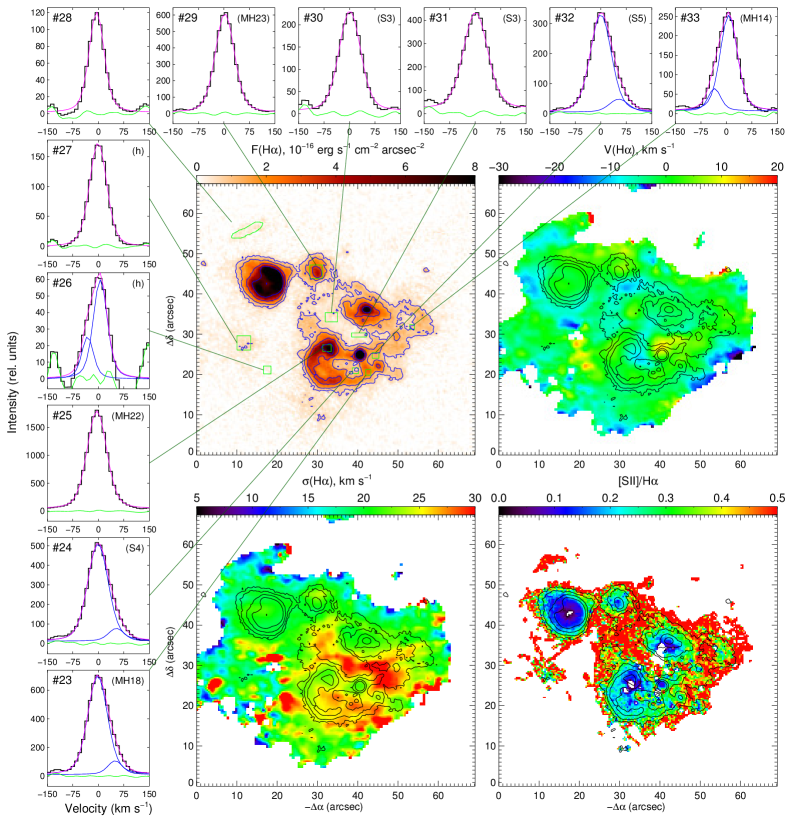
The brightest complex of star formation is located in the southeastern part of the SGS in the area of its maximum H i density that explains a large number of O stars and H ii regions there. Most H ii regions are encircled by H i supershell #7, and the northeastern H ii regions are located at the edge of H i supershell #9 (see Figs. 4, 5). Many H ii regions there have the shell-like morphology, and their H line profiles (e.g., #24, 32, 33 in Fig. 10) show signs of expansion with velocities corresponding to kinematic ages of Myr. The second largest ionized superbubble in the galaxy – S3 – is observed in the central part of the complex and joins several bright H ii regions. Its kinematic age ( Myr) is slightly greater than that of other shells in the complex, that can point to its relation to the previous generation of stars formed there. Most O stars found in the complex are located inside the H ii regions, and none of them was found towards the centre of the S3 shell.
An extended area of the diffuse ionized gas (including two faint H ii regions g and h) is observed at the southeastern edge of the complex in the low-density environment showing the multicomponent H line profile at some places (e.g., profile #26 in Fig. 10). The faint filaments extending towards the centre of the SGS and of H i supershell #9 are also observed. All these features are probably the result of the ionizing quanta leakage from H ii regions due to inhomogeneities of the ISM.
In general, all the H ii regions and ionized shells are of more or less the same age (see Tables 3 and 4), that together with the detection of a large amount of diffuse filaments and the presence of surrounding H i supershell #7 indicates that complex #2 is indeed a unified structure. Probably, at a higher spatial and spectral resolution it would be worth exploring this complex as a separate H i supershell with star formation in its walls.
Note that one of the brightest H ii regions in the galaxy – MH25 – may not be related to H ii complex #2. We consider it as a part of complex #2 because of a very close location to it, but neither obvious emission filaments nor diffuse gas connecting them are observed. In addition, it is located at the edge of H i supershell #9 and far away from supershell #7, while the latter joins all other H ii regions in complex #2.
H ii complex #3
We joined a chain of the H ii regions in the southwestern part of the SGS to complex #3. As follows from Figs. 4, 5, most part of this complex is located at the edge of H i supershell #10.
In contrast with the previous two, this complex does not show any extended diffuse emission around the H ii regions, yet a filament connecting all of them can be clearly seen. The velocity field (the top right-hand panel in Fig. 11) shows a significant difference of the line-of-sight velocity in this complex. The area surrounding the H ii region MH11 is blueshifted at in comparison with the other part of the complex. Taking it into account, the physical relation of the H ii regions in this complex with each other is less evident than that in other complexes.
H ii complex #4
This small complex consists of two bright nebulae MH20 and MH24, the shell MH20a, and the extended diffuse emission filling the area. The enhanced [S ii]/H ratio in our long-slit spectra between these nebulae (see also Fig. 9) together with the presence of a blueshifted component in the wing of the H line profile (e.g., #21 in Fig. 9) indicates a major role of shocks in excitation of the diffuse emission. The complex is located towards the inner wall of the SGS and the centre of H i supershell #9. Hence, it resides in the environment of a lower density in comparison with complexes #1 and 2 which can explain a small number of H ii regions and low star-formation rate there.
In contrast with all other H ii complexes in the galaxy, this complex is seen close to the centre of a large H i supershell. We suppose that it is actually located at the approaching side of H i supershell #9. This assumption is consistent with the H i and H kinematics in the region. Indeed, as follows from the PV diagrams and H i line profiles shown in Fig. 5, H i supershell #9 is clearly expanding and its approaching side has the velocity at the position of complex #4. This estimate agrees well with the line-of-sight velocity of ionized gas there: the whole complex #4 is blueshifted at (see the top right-hand panel in Fig. 9).
As follows from fig. 9 in Weisz et al. (2008), the spatial density distribution of both red and blue stars shows a peak there. Note, however, that most of the O stars detected there lie close to, although, outside the mentioned H ii regions and the whole complex as well. At the same time many of BHeB stars of ages of Myr are observed towards this complex. Together with the age estimates of the H ii regions (see Table 4), it allows one to propose that this complex is older than those previously discussed.
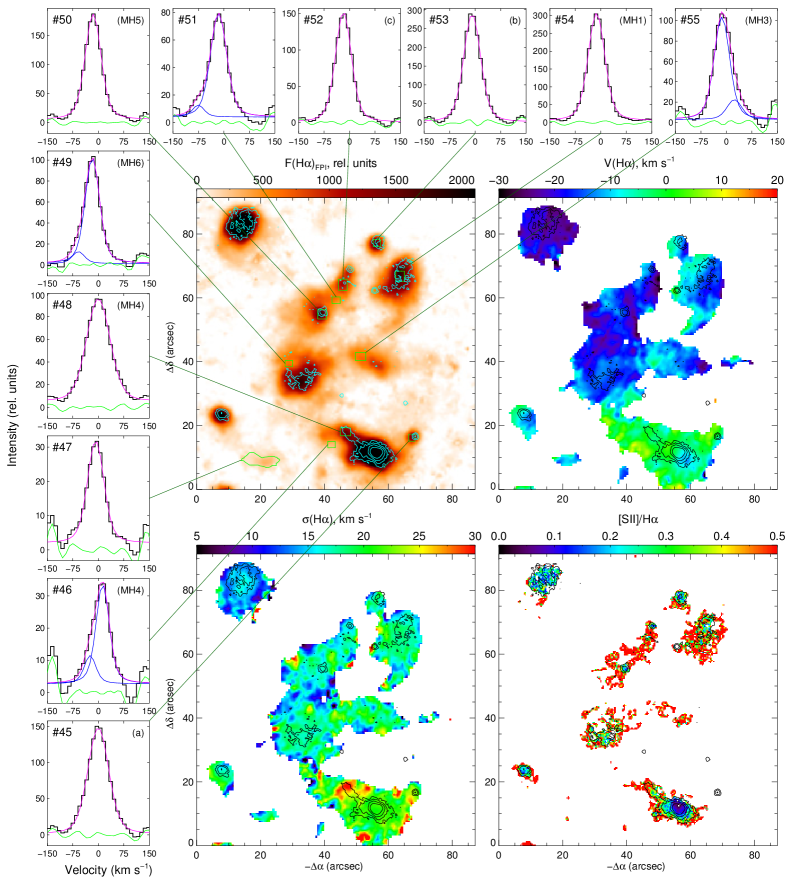
H ii complex NW
Especially interesting is a group of nebulae located at the northwestern side of the galaxy in the dense layer of H i between the SGS and supershell #1.
We classified this ‘arc’ of faint H ii regions as a unified complex based on the presence of the diffuse emission connecting them with each other that coincides with the distribution of H i. The additional evidence is that almost all the H ii regions show more or less similar ages (see Table 4). Taking into account the localisation of neutral and ionized gas, we conclude that the ongoing star formation in this complex was triggered by the collision of supershell #1 with the SGS (see the discussion in Section 7).
The ionized gas in the complex NW almost does not reveal any high velocity motions except for few diffuse areas, where the blue- or redshifted components in the wings of the H line profiles are observed (profiles #46, 49, 51, 55 in Fig. 12), and the region MH4 revealing a broad H line profile (#48 in Fig. 12). Note, however, that the northeastern part of the complex shows a significant blue shift of the line-of-sight velocity (up to ). Moreover, the kinematics of ionized and neutral gas are different there: H i is observed even at the redshifted velocities at some places (see, e.g., the PV diagram #4 in Fig. 5). The collision of two H i supershells and inhomogeneities in the H i density distribution can be a reason of such a complex gas kinematics.
6 Individual H ii regions and analysis of their spectra
In this Section we analyse the emission spectra and chemical abundance of the H ii regions in the galaxy Holmberg I. Several most interesting H ii regions are discussed in details.
The most complete catalogue of the H ii regions in Holmberg I by Miller & Hodge (1994) contains 32 H ii regions. In the current paper, we reveal several new H ii regions (shown with squares and denoted by letters in Fig. 7) together with the faint extended structures of ionized gas mentioned in the previous Section. On the other hand, some areas of ionized gas identified by Miller & Hodge (1994) as H ii regions seem to be extended filaments of ionized gas created by the stellar wind or supernovae from a nearby OB association: MH3, 4, 8, 19, and 28. The region MH15 does not reveal any emission in the H line and seems to be a bright star. These non-H ii regions from Miller & Hodge (1994) are shown in Fig. 7 by the dotted circles.
Table 4 lists the properties of each H ii region in the galaxy: its size, median line-of-sight velocity and velocity dispersion , integrated H flux F(H), equivalent width of the H line EW(H), age derived from EW(H), and the type of its morphology according to our classification made by eye. Note that several H ii regions are classified as multiple – they represent several compact (or compact and diffuse) nebulae instead of single as was defined earlier.
Only four brightest H ii regions have been previously spectroscopically studied: MH18, 22, and 29 (Croxall et al., 2009), and MH25 (Miller & Hodge, 1996). We obtained the spectra for the galaxy with slits crossing a large part of its H ii regions (see Fig. 2). For every observed region, we obtained the integrated emission spectrum for a further analysis. The reddening-corrected values of most measured emission-line fluxes (normalized to the fluxes of the H or H lines) are listed in Table 5. The adopted values of the interstellar extinction coefficient c(H) calculated from the observed Balmer decrement are also shown in the Table. The values of [S ii]/H and [O iii]/H obtained from direct images agrees well with those measured from the long-slit spectra.
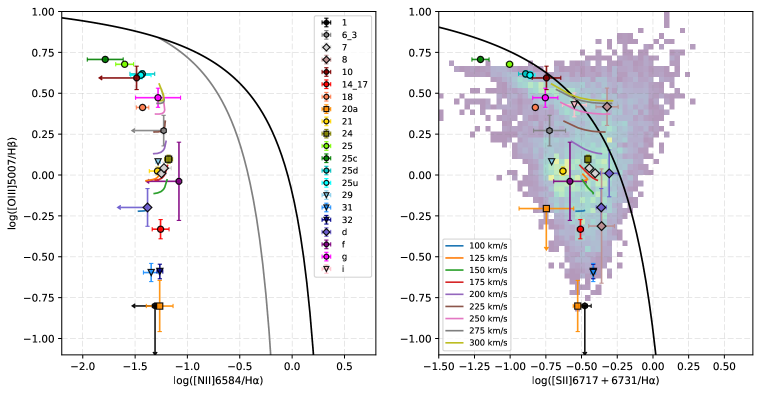
In Fig. 13 we plot the H ii regions, for which we obtained spectroscopic data in the diagnostic BPT (Baldwin, Phillips & Terlevich, 1981) diagrams. The right-hand panel shows also a 2D histogram corresponding to the distribution of line ratios for each pixel of our images. The emission from the regions lying above the black ‘maximum starburst line’ (Kewley et al., 2001) cannot be explained by photoionization from massive OB stars. Composite mechanism of excitation should work for regions lying between this line and the grey curve from Kauffmann et al. (2003) (for the solar abundance) in the left-hand panel. As follows from the right-hand diagram, some pixels in our narrow-band images fall into the area above the maximum starburst line. These pixels correspond to a faint emission outside H ii regions only, and as we noted in the previous Section, they most probably represent the DIG.
All the H ii regions observed with the long-slit spectrograph (except for the faint diffuse region MH8) show the emission line ratios corresponding to their positions in the BPT diagrams below the separation lines. Despite that, the shock waves should produce lower line ratios due to the low metallicity of Holmberg I. In fact, the separation lines should be shifted towards the lower [N ii]/H and [S ii]/H line ratios. We add a grid of shock waves ionization models in the BPT diagrams from Allen et al. (2008) which correspond to the shock velocity from 100 and to the metallicity (SMC-like). As follows from the comparison of the [S ii]/H ratios with these models, a shock excitation can play a significant role in ionization of the regions MH7, 8, 24, d, and i. Two of them – MH7 and d – show a high value of [S ii]/H> 0.4 estimated from direct images and the multicomponent H line profile with high-velocity components (see Fig. 11). Because of this, we consider these regions as probable supernova remnants. The region MH24 lies close to MH7 in the BPT diagram but does not show any peculiarities of the ionized gas kinematics – that is why, we do not consider it as an SNR candidate. The two regions – MH8 and i – are faint diffuse areas of ionized gas.
Table 5 provides the estimates of EWHβ and corresponding age for all the observed H ii regions obtained in the way we described in the previous Section. The ages of H ii regions are consistent with those obtained using EWHα derived from direct images (see Table 4).
| Region | |||||||
|---|---|---|---|---|---|---|---|
| Slit | PA142 | PA142 | PA259 | PA212 | PA259 | PA212 | PA150 |
| Pos.(arcsec) | -167 – -158 | -138 – -116 | 101 – 107 | -132 – -122 | 95 – 99 | -138 – -133 | 141 – 151 |
| c(H) | |||||||
| [O ii] 3727,3729/H | |||||||
| He ii 4686/H | |||||||
| [O iii] 5007/H | |||||||
| [N ii] 6583/H | |||||||
| [S ii] 6717,6731/H | |||||||
| [Ar iii] 7136/H | |||||||
| EW(H) | |||||||
| Age (Myr) | |||||||
| Region | |||||||
| Slit | PA142 | PA142 | PA259 | PA150 | PA142 | PA259 | PA150 |
| Pos.(arcsec) | -20 – -8 | -3 – 2 | 41 – 47 | 34 – 44 | 4 – 10 | 28 – 33 | -6 – 4 |
| c(H) | |||||||
| [O ii] 3727,3729/H | |||||||
| He ii 4686/H | |||||||
| [O iii] 5007/H | |||||||
| [N ii] 6583/H | |||||||
| [S ii] 6717,6731/H | |||||||
| [Ar iii] 7136/H | |||||||
| EW(H) | |||||||
| Age (Myr) | |||||||
| Region | |||||||
| Slit | PA150 | PA150 | PA150 | PA259 | PA259 | PA259 | PA142 |
| Pos.(arcsec) | -2 – 0 | -6 – -4 | 2 – 5 | -3 – 2 | -11 – -6 | -19 – -14 | -78 – -72 |
| c(H) | |||||||
| [O ii] 3727,3729/H | |||||||
| He ii 4686/H | |||||||
| [O iii] 5007/H | |||||||
| [N ii] 6583/H | |||||||
| [S ii] 6717,6731/H | |||||||
| [Ar iii] 7136/H | |||||||
| EW(H) | |||||||
| Age (Myr) | |||||||
| Region | |||||||
| Slit | PA212 | PA212 | PA142 | PA259 | |||
| Pos.(arcsec) | -150 – -145 | -252 – -237 | 13 – 19 | -37 – -26 | |||
| c(H) | |||||||
| [O ii] 3727,3729/H | |||||||
| He ii 4686/H | |||||||
| [O iii] 5007/H | |||||||
| [N ii] 6583/H | |||||||
| [S ii] 6717,6731/H | |||||||
| [Ar iii] 7136/H | |||||||
| EW(H) | |||||||
| Age (Myr) | |||||||
| ∗The slit crossed only the edge of the region. EW, age, and oxygen abundance estimates can be unreliable. | |||||||
We estimated the oxygen abundance , which is the indicator of gas metallicity for the most observed H ii regions, yet for several of them we provide only the upper-limit value. The results are reported in Table 5. Since the weak [O iii] 4363 Å emission line, which is sensitive to electron temperature, does not appear in our spectra, we were unable to use the ‘direct’ method for this. We applied the empirical S-method by Pilyugin & Grebel (2016) which is based on the flux ratios of the strong emission lines [S ii], [N ii], and [O iii] to H. This method was selected among many other developing strong-line empirical calibrations, because it is applicable for low-metallicity galaxies, is consistent with the results of the method and does not demand measurements of [O ii] 3727, 3729 Å which are very noisy in our data due to the poor sensitivity of the spectrograph in the blue region of the spectrum.
The oxygen abundance of only four brightest regions was measured before. We have obtained spectroscopic data for three of them – MH18, 29, and 25. Croxall et al. (2009) estimated for the first two of these regions using the ‘direct’ method, while their measurements with the empirical method (McGaugh, 1991) gave lower values (7.71 and 7.82, respectively). Moustakas et al. (2010) used another empirical method by Pilyugin & Thuan (2005) and obtained the values and 7.71, and for the region MH25. Because of the well-known problem of discrepancy between different methods of oxygen abundance estimation (see, e.g., Kewley & Ellison, 2008; López-Sánchez et al., 2012), we recalculated the metallicity of these regions with the S method (Pilyugin & Thuan, 2005) using the line ratios reported by Croxall et al. (2009) to directly compare with our results. Thus, we obtained and for MH18 and MH29, respectively. While our metallicity estimate for MH18 is in a very good agreement with the previous data, its value for MH29 is lower and is in a better agreement with a value reported by Moustakas et al. (2010). In fact, the latter region consists of four compact and one diffuse H ii regions. Our oxygen-abundance estimate for this region corresponds to its northern part, while Croxall et al. (2009) performed the observations of its brightest central part which can be a reason for the discrepancy. In addition, Croxall et al. (2009) used a much larger value of the extinction coefficient, that can also influence the reported oxygen abundance. Due to the absence of reported fluxes of the [S ii] lines in Miller & Hodge (1996) and Moustakas et al. (2010), we were unable to make a similar comparison for the MH25 region, yet our results do not conflict with the published estimates taking into account their large reported uncertainty. In general, our oxygen abundance estimates for Holmberg I are consistent with the previously published values, yet we observe a significant spread of metallicity between different regions.
It is worth noting that for some H ii regions (denoted by an asterisk in Table 5) the obtained spectra cross only their outer part. The reported line fluxes for two such regions ( and ) correspond to the area of diffuse emission between the nearby H ii regions mentioned in their names. In all these cases, the observed emission lines come from the outer parts of H ii regions and, hence, could be highly contaminated by the DIG and biased towards a lower ionization state. Hence, these regions can show higher values of [S ii]/H and [N ii]/H as well as an incorrect value of . The measured metallicity of them can be unreliable. Additionally, shock waves might have high contribution into the excitation of the MH7 and d regions and, hence, the empirical metallicity calibration used in our analysis is not applicable to them.
Below we consider some interesting H ii regions in more details.
MH25 (Complex 2)
The brightest and among the largest H ii regions in Holmberg I appears as a shell-like structure around six identified O stars. Our data show a single slightly broaden H line profile, but the observed gradient of velocity dispersion towards the centre of the region points to the presence of an unresolved expanding superbubble there.
While we consider this region as a part of H ii complex #2, it could not be related to it. It is located relatively far away from the majority of the nebulae in the complex and is clearly tied with H i supershell #9 instead of #7 (see Figs. 4 and 5). Probably, star formation in MH25 was triggered by the influence of expanding H i supershell #9 with the ISM in the SGS.
This region was divided into MH25 and MH27 in Miller & Hodge (1994), while recent images demonstrate that it is a single object. Differences in ionization conditions of the inner and outer parts of the region are clearly seen in our observed data. The gradient of [O iii]/H ratio (Fig. 8, bottom right-hand panel) and the invert gradient of [S ii]/H (Fig. 9, bottom right-hand panel) are typical of H ii regions with a central source of ionization. The central part of MH25 show the highest [O iii]/H in the galaxy. Because of that, in addition to the integrated spectrum of MH25, we also analysed separately its central (MH25c in Table 5 and Fig. 13), northwestern (MH25nw), and southeastern (MH25se) parts.
The central part of MH25 is the only place in Holmberg I, where we have detected the He ii 4686Å line. It also appears in the integrated spectrum, yet it is not observed in the outer bright areas MH25nw and MH25se, and the He ii/H ratio is two times higher in the central part MH25c. Hence, we expect to find a source of ionization in the centre of MH25 having a sufficiently hard spectrum and high temperature to explain high ratios of [O iii]/H and He ii/H.
Given the emissivities and recombination coefficients for hydrogen and helium (Osterbrock & Ferland, 2006), we obtain that , where and are the amount of the emitted helium and hydrogen ionizing quanta per second. Hence, in order to explain the observed line ratio of He ii/H = 0.16 in the central part of MH25, the ionizing source should produce no less than 7 per cent of . According to the models by Smith et al. (2002), all types of O stars provide less amount of and are not available to produce the observed intensity of the He ii 4686Å line. The presence of the Wolf-Rayet (WR) star WN10-WN11 is necessary to get the observed flux ratio. Comparing the measured EW of the He ii 4686Å line ( Å) and its ( Å corrected for instrumental broadening) with the empirical diagnostic diagram of Crowther & Smith (1997) made for different types of WR stars (see their fig. 1b), we obtain that the MH25 central source falls into the region occupied by WN9-10 stars.
Summing up, we conclude that despite the fact that there are no observed peculiarities in the ionized gas kinematics in the MH25 region, it represents a slowly expanding superbubble around a young star cluster with at least 6 O stars and one WN9-11 star.
MH20 and MH20a (complex 4)
We consider the region MH20 from the list of Miller & Hodge (1994) as two separate nebulae – the compact H ii region MH20 and the connected faint shell MH20a because of quite a large separation between them (see Fig. 7).
A shell-like structure of MH20a is clearly seen in our H images, while no O stars were found inside it. We obtained two spectra of different parts of this shell – they point to photoionization as a mechanism of emission-line excitation according to the BPT diagrams (Fig. 13). A single slightly asymmetric H line profile is observed towards the central and northern part of MH20a; its blue wing reveals a faint component at the level of about 10 per cent of the maximum and shifted by (profile #22, Fig. 9).
The most interesting fact is that the only bright (1.4 mJy) radio continuum point-like source in the galaxy according to the VLA observations presented in Hindson et al. (2018) (see fig. 20 there) clearly coincides with the MH20a region. The author has shown that this non-thermal radio emission dominates there, and proposed that its origin can be a SNR, yet it can also come from some background source. Our spectral analysis does not reveal any signs of shock waves there. Moreover, the broad lines corresponding to a distant quasar are clearly seen in our spectrum PA=259. Hence, MH20a is not an SNR, and a background source is responsible for the emission in the radio continuum there.
MH 10
This bright isolated H ii region is located in the area of interaction of three H i supershells – #2, 3, and 11. Probably, star formation there has been triggered by their collision.
Two O stars detected there provide a sufficient amount of ionizing quanta to create the H ii regions, while the analysis of [S ii]/H and [O iii]/H line ratios point to the absence of the outer area of low-excitation ionized gas. Hence, this region seems to be density bound and should demonstrate an efficient leakage of ionizing quanta. Indeed, a faint diffuse tail of ionized gas is observed elongated towards the centre of H i supershell #3 (see Fig. 4).
Region f
This nebula at the north of the SGS was detected for the first time in our H images. It represents a faint bubble-like nebula with irregular density around the star identified as BHeB of an age from 30 to 55 Myr (see Fig. 4).
The H line profiles on the rim of the nebula represent a single narrow component, while some asymmetry is observed towards the centre of the nebula (see profiles #6 and 7 in Fig. 8). Note, however, that the redshifted component detected there shows a low signal-to-noise ratio and, hence, could not be considered as a confident proof of the nebula expansion.
We observed this region with the long slit in order to reveal its nature. The obtained spectrum showed that the main source of emission-line excitation should be photoionization. The estimated age of the region is about 7 Myr. Taking into account its large size (about 300 pc), the region f seems to be an ionized bubble around a poor OB association at the late stage of its evolution, yet we have no sufficient data to definitely state this.
Regions MH7 and d (Complex 3): SNR candidates
The compact faint shell-like region d with a size of about 60 pc observed on the inner rim of the SGS in complex #3 draws our particular attention. Its H line profile is significantly broad and clearly multicomponent (see profiles #39, 40 in Fig. 11). The estimated expansion velocity of the region is that corresponds to a kinematic age of 0.2 Myr. An analysis of the spectra crossing the region d show the enhanced flux ratio of [S ii]/H= 0.43–0.49 indicating high contribution of shock excitation. As we noted above, despite the region falls into the area of pure photoionization in the BPT diagrams (Fig. 13), its position agrees well with the models of the shocks in the low-metallicity environment.
Another region showing similar properties – MH7 – is located close to the region d in the same complex #3. It also has a broad multicomponent H line profile (#38, 41–43 in Fig. 11) corresponding to a high expansion velocity () and a low kinematic age (0.3 Myr). The flux ratio of [S ii]/H= 0.36–0.39 there is a bit lower than for the region d, yet the MH7 location in the BPT diagrams still agrees with the models of ionization by shocks.
Both regions MH7 and d stand out among all other H ii regions in the galaxy. They were classified according to the diagram (Fig. 6) as the unique energetic objects. They appear to be the only regions in the galaxy with the clearly resolved multicomponent H line profile corresponding to a high expansion velocity; they show the highest [S ii]/H ratio in the galaxy. Because of that, we consider these regions as good SNR candidates.
The emission in the region d might be wholly created by an old SNR, because there are no ionizing sources revealed inside the region (see Fig. 4). A more complicated situation is in the region MH7 – there are two O stars observed towards the centre of the region. The contribution of photoionization from them probably reduce the observed [S ii]/H as compared with the region d.
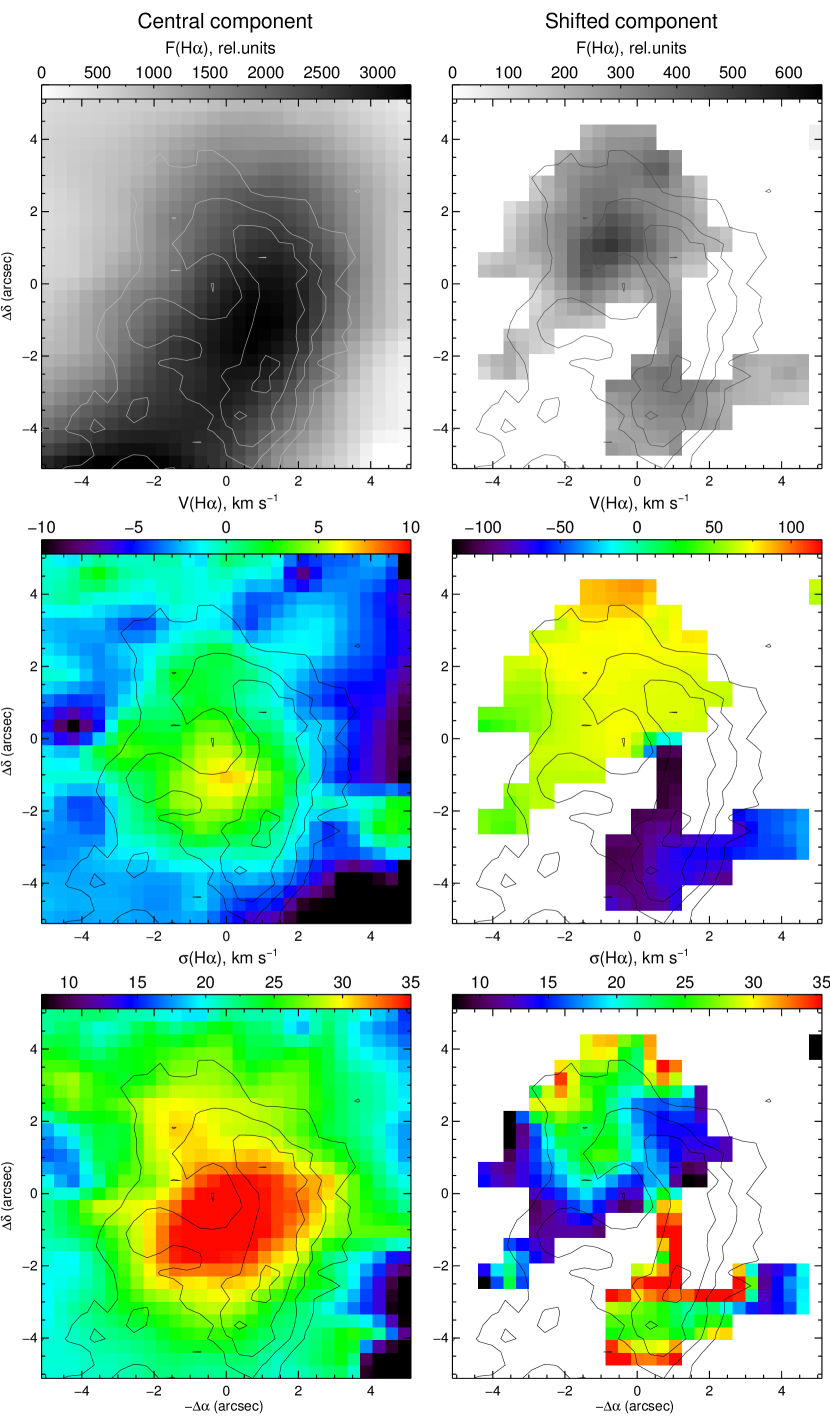
Fig. 14 presents a spatially resolved kinematics of the region MH7 in details: maps of the flux, line-of-sight velocity and, velocity dispersion of the central and shifted components are shown. It is clearly seen that the highest velocity dispersion corresponds to a non-shifted component in the centre of this shell-like region. It is interesting that while the flux distribution of the central component sets the morphology of the region, the blue- and redshifted components are clearly separated and dominate in different parts of MH7. We can explain this fact by a high inhomogeneity of the H i density in the region. Indeed, the local minimum of the H i density is observed towards the centre of MH7, while it grows up at its edges. Hence, the shifted components may correspond to the expanding bubble, whose receding side has a higher density in its northern part, while the approaching side – in the southern part.
Given the measured optical size and the expansion velocity of both SNR candidates d and MH7 (see Table 3), we can derive their energy of explosion necessary to match the observed properties of the nebulae. A high expansion velocity suggests that the SNR still undergoes adiabatic expansion. According to the self-similar solution of Sedov (1946), the evolution of an SNR at this stage can be described by the following equation:
where is the explosion energy, is the radius, is the age of an SNR. The expansion velocity of an SNR evolves as during this stage. The unperturbed density is derived from the H i data (helium contribution is taken into account). Using these relations, we obtained and 0.24 for the regions d and MH7, respectively, proposing the adiabatic stage of expansion. If a SNR currently undergo the post-adiabatic snow-plough stage of evolution, we can use the analysis performed by Chevalier (1974). According to this work,
that gives us and 0.87 for the regions d and MH7.
Such low values of derived from our analysis do not contradict the hypothesis of the SNR nature of the objects d and MH7. Indeed, according to modern understanding, supernovae having even much lower explosion energy are observed (see, e.g., Benetti et al., 2016; Chugai, 2016; Utrobin & Chugai, 2017). In addition, high radiation loses can also be responsible for the observed values of the SNR energy much lower, than the initial explosion energy (Sharma et al., 2014; Vasiliev et al., 2015b).
It is interesting that despite the fact that these two regions appear to be good SNR candidates, they do not exhibit any bright emission in the radio continuum. Only a faint source of the non-thermal radio continuum could be identified between the regions MH7 and d in the images presented by Hindson et al. (2018). This fact does not contradict their identification as SNRs. As follows from the analysis of detections of an extragalactic SNR performed by Bozzetto et al. (2017), optical SNR candidates statistically tend not to be detected in the radio or X rays. Probably, deeper radio observations are needed to clarify the nature of the MH7 and d regions.
7 Discussion
In this paper we present the deepest H images of Holmberg I available to date, as well as a detailed study of the ionized gas kinematics. These data allow us to treat star formation in the galaxy as a process taking place in large (several hundreds of pc) unified complexes presenting the same age and gas kinematics within them. All the individual H ii regions within a complex are tied together with faint filaments or diffuse clouds of ionized gas. We state that star formation in Holmberg I is a self-regulating process at the scales of such complexes, while the external factors like the SGS expansion influence the whole star formation in the galaxy.
All regions of the ongoing star formation in Holmberg I, similarly to other dIrr galaxies with SGSs, are located on the rim of the central H i SGS in the areas of high H i density. This is natural in the framework of the generally accepted theory of star formation, propagated within an expanding supershell. Complex #2 represents another example of the same process but on a smaller scale. The bright nebulae of this complex are located in the walls of the local H i supershell #7.
Another well known mechanism of triggering of star formation is the collision of several expanding supershells. It was reproduced in numerical and analytical models by different authors (e.g., Chernin et al., 1995; Ntormousi et al., 2011; Kawata et al., 2014; Vasiliev & Shchekinov, 2017) and observed in a number of nearby galaxies (e.g. Lozinskaya, 2002; Egorov et al., 2017). Several facts point to the conclusion that the supershell collision is a mechanism that triggered the ongoing star formation in the complex NW. Its related H i supershell #1 has the same age as the SGS (see Table 3) which points to their previous independent evolution. Currently, the rims of both supershells are in contact, and the ionized gas is distributed between them. Moreover, the distribution of young stars of different ages (see Fig. 4) inside the complex NW shows a gradient from the centre of H i supershell #1 towards its northeastern part that is the evidence for its independent evolution by the influence of stellar feedback from these stars. Such a gradient is absent in the southeastern part of the complex (towards the SGS) that allows one to propose triggering of star formation there as a result of the supershell collision. Warren et al. (2012) have found several clumps of the cold low-dispersion H i gas in Holmberg I. The most extended of them are located on the rims of the NW shell (in particular, between supershell #1 and the SGS) that also points to the ongoing cooling and compression of the ISM that stimulates star formation.
Triggering of star formation by colliding shells can take place also for several other regions in the galaxy. Thus, the H ii regions MH10 and MH26 are located at the intersections of several H i supershells. The first one probably formed in the collision of quite young H i supersells #2, 3 with an older one #11. A collision of two old H i supershells of almost an equal age – SGS and #8 – can stimulate star formation in the MH26 region. Young OB stars are also observed in the intersection of the SGS and H i supershell #3 (see Fig. 4).
Taking into account the old age of supershells #9 and #10 together with their location relative to the SGS, we may also propose that star formation in H ii complexes #3 and #4 was also triggered by the collision of those shells with the SGS several Myr ago. However, we cannot exclude now an opposite scenario – that these supershells on the rim of the SGS were produced by feedback of supernovae and stellar winds in the mentioned complexes supposing that star formation in them was taking place at least for several tens of Myr. The last scenario is supported by a large number of BHeB stars with ages of 50–200 Myr inside supershell #9, while only few of such stars are observed inside supershell #10.
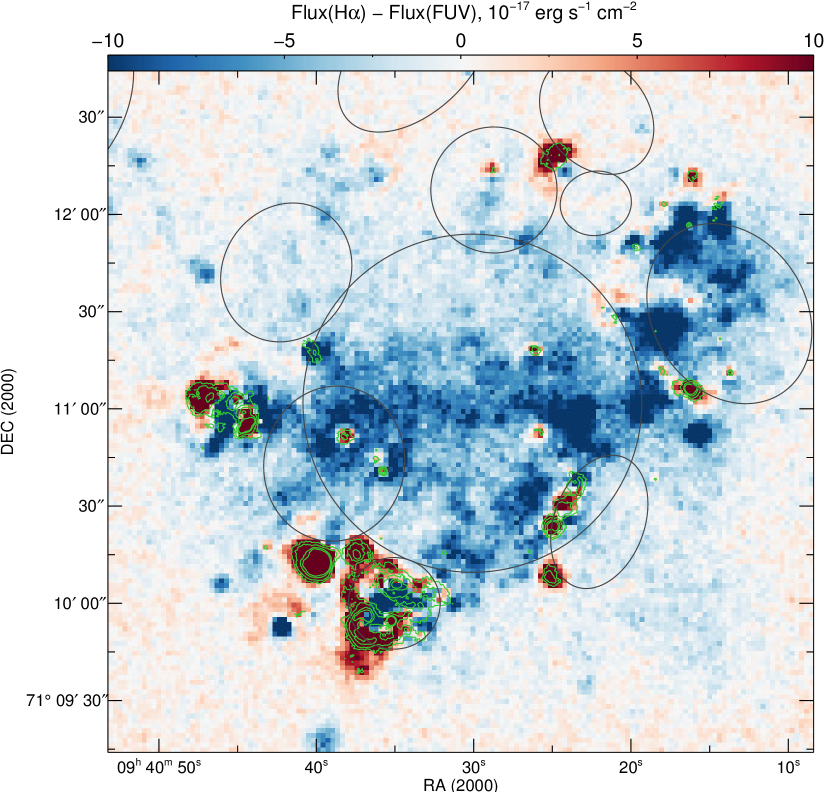
The signs of star-formation propagation and triggering in Holmberg I are shown not only by the distribution of stars of different ages, but also by the comparison between H and FUV images. Both H and FUV emission trace the young stellar population in galaxies but they dominate at different ages. The H emission is a good tracer of the current star formation (age < 10 Myr), while the FUV emission traces the recent star formation that took place on longer timescales (age < 100 Myr). Fig. 15 shows the evolution of the H/FUV flux ratio as well as their difference according to the STARBURST99 simulations (Leitherer et al., 1999) for the Holmberg I metallicity . The red line traces the change of the normalized H – FUV flux difference with the age of the star cluster. This difference is positive at ages less than about 9 Myr and negative for older regions. The map of H – FUV (Fig. 16) exhibits the regions with a negative value (older than 9 Myr) in blue and with a positive value (younger than 9 Myr) in red. Hence, red colour in this image corresponds to the regions of the ongoing star formation, while blue regions – to the areas where star formation has recently occurred. In many places, especially in complexes #1, 2, and NW, the blue area is closely bordered by a younger red area, that points to star formation propagation within the complex.
The morphology of ionized and neutral gas together with the young-star distribution allow us to make some speculative assumptions on further evolution of the SGS. Given a large number of H ii regions and young massive stars, we may expect a gradual fragmentation and destruction of the SGS in the area of its interaction with supershell #1 (NW complex), where the observed H i density is lower than in other parts of the SGS. This process will form an open tunnel in the H i distribution like it is already observed in the eastern part of the galaxy (towards supershell #6).
As we have mentioned before, the origin of two expanding supershells #9 and #10 observed on the rim of the SGS is unclear now. But in any case, their presence demonstrates a current instability of the SGS there. If they were formed on the rim of the SGS during the late stages of its evolution, then these supershells could be considered as a consequence of the ongoing fragmentation of the SGS driven by stellar feedback. Or else, if they have evolved independently of the SGS, we now observe a process of dissipation of these two supershells as a result of their collision with the SGS – this process should destabilize the SGS as well.
Summing up, we observe a propagation of star formation in Holmberg I, and in some places it is triggered by the interaction of several H i supershells. In its turn, the ongoing star formation on the rims of the SGS gradually leads to its destruction.
8 Summary
We present a detailed multiwavelength analysis of the regions of star formation in the nearby dIrr galaxy Holmberg I. Since all the H ii regions in the galaxy are located inside the galaxy-sized H i supergiant shell, we focused on investigation of star-formation triggering on the rims of the SGS, as well as on the role of star formation in the evolution of the SGS.
Our work was based on the data set obtained with the SCORPIO and SCORPIO-2 focal reducers at the 6-m SAO RAS telescope: deep H, [S ii], and [O iii] narrow-band images of the galaxy, four long-slit spectra crossing most of the H ii regions, and the high spectral resolution H data cube obtained with the scanning Fabry–Perot interferometer. These data were complemented with the archival data in H i 21-cm (VLA) and FUV (GALEX) from the LITTLE THINGS archive, as well as by the photometric data of individual stars observed with the HST (ANGST archive). Using all these data, we performed an analysis of the ionized and neutral gas morphology and kinematics; described the emission spectrum of H ii regions in terms of their excitation mechanism and metallicity; identified young massive stars and compared their energetics and distribution with properties of the observed ionized gas; traced the spatial distribution of the ongoing and recent star formation in the galaxy. Below we highlight the most important results obtained.
-
•
Four expanding H i supershells and 9 new faint H ii regions were found and analysed in addition to the previously known.
-
•
We show that star formation in the galaxy takes place in five large unified complexes rather than in the individual H ii regions. The H ii regions in these complexes are tied together by faint filaments of ionized gas or embedded into common clouds of diffuse ionized gas.
-
•
Triggering of star formation on scales of individual complexes, as well as of the whole galaxy, is observed. Most H ii regions surround places of the recent star formation. In the northwestern complex, we also observed a gradient in the age distribution of individual stars. Also our observations point to the fact that the current star formation there was triggered by the collision of the SGS with other H i supershells.
-
•
The ionized gas distribution in the galaxy reveals 18 shell-like structures. Most of them appear to be expanding superbubbles (according to their enhanced velocity dispersion), yet only a half demonstrate weak high-velocity components in the H line profile, and only two of them show a clearly multicomponent line profile.
-
•
We identified two SNR candidates and one WR star in the galaxy. One object with the bright radio continuum emission previously proposed as a possible SNR candidate turned out to be a background quasar.
-
•
A large fraction of the escaping ionizing radiation from each H ii complex is observed. It points to the expected large amount of diffuse ionized gas which appears to be only partially detected in our observations.
-
•
The presence of younger H i supershells of a smaller size on the rims of the SGS together with a large fraction of escaping ionizing quanta allows us to propose that currently we observe a process of SGS fragmentation and destruction by the influence of star formation on its rim.
Acknowledgements
We thank the anonymous referee for detailed comments that helped us to improved the clarity of this manuscript.
This work is based on the observations obtained with the 6-m telescope of the Special Astrophysical Observatory of the Russian Academy of Sciences carried out with the financial support of the Ministry of Education and Science of the Russian Federation (agreement No. 14.619.21.0004, project ID RFMEFI61914X0004). We thank A. Burenkov, D. Oparin, and R. Uklein for the assistance in 6-m telescope observations.
The study was supported by the Russian Foundation for Basic Research (RFBR), project 18-02-00976. OE is also thankful to the European Astronomical Society for a travel grant for participation in the EWASS-2017 conference, where the first results of this work have been presented.
The study is partially based on the observations made with the NASA/ESA Hubble Space Telescope obtained from the Data Archive at the Space Telescope Science Institute which is operated by the Association of Universities for Research in Astronomy, Inc., under the NASA contract NAS 5-26555. These observations are associated with program # 10605.
References
- Afanasiev & Moiseev (2005) Afanasiev V. L., Moiseev A. V., 2005, Astronomy Letters, 31, 194
- Afanasiev & Moiseev (2011) Afanasiev V. L., Moiseev A. V., 2011, Baltic Astronomy, 20, 363
- Allen et al. (2008) Allen M. G., Groves B. A., Dopita M. A., Sutherland R. S., Kewley L. J., 2008, ApJS, 178, 20
- Bagetakos et al. (2011) Bagetakos I., Brinks E., Walter F., de Blok W. J. G., Usero A., Leroy A. K., Rich J. W., Kennicutt R. C., 2011, AJ, 141, 23
- Baldwin et al. (1981) Baldwin J. A., Phillips M. M., Terlevich R., 1981, PASP, 93, 5
- Bastian et al. (2011) Bastian N., et al., 2011, MNRAS, 412, 1539
- Benetti et al. (2016) Benetti S., et al., 2016, MNRAS, 456, 3296
- Berg et al. (2012) Berg D. A., et al., 2012, ApJ, 754, 98
- Bozzetto et al. (2017) Bozzetto L. M., et al., 2017, ApJS, 230, 2
- Bressan et al. (2012) Bressan A., Marigo P., Girardi L., Salasnich B., Dal Cero C., Rubele S., Nanni A., 2012, MNRAS, 427, 127
- Cannon et al. (2011a) Cannon J. M., et al., 2011a, ApJ, 735, 35
- Cannon et al. (2011b) Cannon J. M., et al., 2011b, ApJ, 735, 36
- Cardelli et al. (1989) Cardelli J. A., Clayton G. C., Mathis J. S., 1989, ApJ, 345, 245
- Chen et al. (2014) Chen Y., Girardi L., Bressan A., Marigo P., Barbieri M., Kong X., 2014, MNRAS, 444, 2525
- Chen et al. (2015) Chen Y., Bressan A., Girardi L., Marigo P., Kong X., Lanza A., 2015, MNRAS, 452, 1068
- Chernin et al. (1995) Chernin A. D., Efremov Y. N., Voinovich P. A., 1995, MNRAS, 275, 313
- Chevalier (1974) Chevalier R. A., 1974, ApJ, 188, 501
- Chugai (2016) Chugai N. N., 2016, Astronomy Letters, 42, 82
- Copetti et al. (1986) Copetti M. V. F., Pastoriza M. G., Dottori H. A., 1986, A&A, 156, 111
- Crowther & Smith (1997) Crowther P. A., Smith L. J., 1997, A&A, 320, 500
- Croxall et al. (2009) Croxall K. V., van Zee L., Lee H., Skillman E. D., Lee J. C., Côté S., Kennicutt R. C., Miller B. W., 2009, ApJ, 705, 723
- Dalcanton et al. (2009) Dalcanton J. J., et al., 2009, ApJS, 183, 67
- Dohm-Palmer et al. (1997) Dohm-Palmer R. C., et al., 1997, AJ, 114, 2527
- Egorov et al. (2014) Egorov O. V., Lozinskaya T. A., Moiseev A. V., Smirnov-Pinchukov G. V., 2014, MNRAS, 444, 376
- Egorov et al. (2017) Egorov O. V., Lozinskaya T. A., Moiseev A. V., Shchekinov Y. A., 2017, MNRAS, 464, 1833
- Fitzpatrick (1999) Fitzpatrick E. L., 1999, PASP, 111, 63
- Guerrero et al. (1998) Guerrero M. A., Villaver E., Manchado A., 1998, ApJ, 507, 889
- Hindson et al. (2018) Hindson L., et al., 2018, ApJS, 234, 29
- Hoessel & Danielson (1984) Hoessel J. G., Danielson G. E., 1984, ApJ, 286, 159
- Hoopes & Walterbos (2003) Hoopes C. G., Walterbos R. A. M., 2003, /apj, 586, 902
- Hunter et al. (2010) Hunter D. A., Elmegreen B. G., Ludka B. C., 2010, AJ, 139, 447
- Hunter et al. (2012) Hunter D. A., et al., 2012, The Astronomical Journal, 144, 134
- Karachentsev & Kaisin (2007) Karachentsev I. D., Kaisin S. S., 2007, AJ, 133, 1883
- Karachentsev et al. (2013) Karachentsev I. D., Makarov D. I., Kaisina E. I., 2013, AJ, 145, 101
- Kauffmann et al. (2003) Kauffmann G., et al., 2003, MNRAS, 346, 1055
- Kawata et al. (2014) Kawata D., Gibson B. K., Barnes D. J., Grand R. J. J., Rahimi A., 2014, MNRAS, 438, 1208
- Kewley & Ellison (2008) Kewley L. J., Ellison S. L., 2008, ApJ, 681, 1183
- Kewley et al. (2001) Kewley L. J., Dopita M. A., Sutherland R. S., Heisler C. A., Trevena J., 2001, ApJ, 556, 121
- Koleva et al. (2009) Koleva M., Prugniel P., Bouchard A., Wu Y., 2009, A&A, 501, 1269
- Leitherer et al. (1999) Leitherer C., et al., 1999, ApJS, 123, 3
- Levesque & Leitherer (2013) Levesque E. M., Leitherer C., 2013, ApJ, 779, 170
- López-Sánchez et al. (2012) López-Sánchez Á. R., Dopita M. A., Kewley L. J., Zahid H. J., Nicholls D. C., Scharwächter J., 2012, MNRAS, 426, 2630
- Lozinskaya (2002) Lozinskaya T. A., 2002, Astronomical and Astrophysical Transactions, 21, 223
- Markwardt (2009) Markwardt C. B., 2009, in Bohlender D. A., Durand D., Dowler P., eds, Astronomical Society of the Pacific Conference Series Vol. 411, Astronomical Data Analysis Software and Systems XVIII. p. 251 (arXiv:0902.2850)
- Martins et al. (2006) Martins F., Schaerer D., Hillier D. J., 2006, A&A, 436, 1049
- McGaugh (1991) McGaugh S. S., 1991, ApJ, 380, 140
- McQuinn et al. (2009) McQuinn K. B. W., Skillman E. D., Cannon J. M., Dalcanton J. J., Dolphin A. E., Stark D., Weisz D. R., 2009, ApJ, 695, 561
- McQuinn et al. (2010a) McQuinn K. B. W., et al., 2010a, ApJ, 721, 297
- McQuinn et al. (2010b) McQuinn K. B. W., et al., 2010b, ApJ, 724, 49
- Miller & Hodge (1994) Miller B. W., Hodge P. W., 1994, ApJ, 427, 656
- Miller & Hodge (1996) Miller B. W., Hodge P. W., 1996, ApJ, 458, 467
- Moiseev (2002) Moiseev A. V., 2002, Bulletin of the Special Astrophysics Observatory, 54, 74
- Moiseev (2015) Moiseev A. V., 2015, Astrophysical Bulletin, 70, 494
- Moiseev & Egorov (2008) Moiseev A. V., Egorov O. V., 2008, Astrophysical Bulletin, 63, 181
- Moiseev & Lozinskaya (2012) Moiseev A. V., Lozinskaya T. A., 2012, MNRAS, 423, 1831
- Moustakas et al. (2010) Moustakas J., Kennicutt Jr. R. C., Tremonti C. A., Dale D. A., Smith J.-D. T., Calzetti D., 2010, ApJS, 190, 233
- Muñoz-Tuñon et al. (1996) Muñoz-Tuñon C., Tenorio-Tagle G., Castañeda H. O., Terlevich R., 1996, AJ, 112, 1636
- Ntormousi et al. (2011) Ntormousi E., Burkert A., Fierlinger K., Heitsch F., 2011, ApJ, 731, 13
- Oey et al. (2007) Oey M. S., et al., 2007, ApJ, 661, 801
- Oh et al. (2011) Oh S.-H., de Blok W. J. G., Brinks E., Walter F., Kennicutt Jr. R. C., 2011, AJ, 141, 193
- Osterbrock & Ferland (2006) Osterbrock D. E., Ferland G. J., 2006, Astrophysics of gaseous nebulae and active galactic nuclei, 2nd edn. University Science Books
- Ott et al. (2001) Ott J., Walter F., Brinks E., Van Dyk S. D., Dirsch B., Klein U., 2001, AJ, 122, 3070
- Pilyugin & Grebel (2016) Pilyugin L. S., Grebel E. K., 2016, MNRAS, 457, 3678
- Pilyugin & Thuan (2005) Pilyugin L. S., Thuan T. X., 2005, ApJ, 631, 231
- Puche & Westpfahl (1994) Puche D., Westpfahl D., 1994, in Meylan G., Prugniel P., eds, European Southern Observatory Conference and Workshop Proceedings Vol. 49, European Southern Observatory Conference and Workshop Proceedings. p. 273
- Rahner et al. (2017) Rahner D., Pellegrini E. W., Glover S. C. O., Klessen R. S., 2017, MNRAS, 470, 4453
- Sargent et al. (1983) Sargent W. L. W., Sancisi R., Lo K. Y., 1983, ApJ, 265, 711
- Schaerer & Vacca (1998) Schaerer D., Vacca W. D., 1998, ApJ, 497, 618
- Sedov (1946) Sedov L. I., 1946, Dokl. Akad. Nauk SSSR, 52, 17
- Seon (2009) Seon K.-I., 2009, ApJ, 703, 1159
- Sharma et al. (2014) Sharma P., Roy A., Nath B. B., Shchekinov Y., 2014, MNRAS, 443, 3463
- Simpson et al. (2005) Simpson C. E., Hunter D. A., Knezek P. M., 2005, The Astronomical Journal, 129, 160
- Skillman et al. (1988) Skillman E. D., Terlevich R., Teuben P. J., van Woerden H., 1988, A&A, 198, 33
- Smith et al. (2002) Smith L. J., Norris R. P. F., Crowther P. A., 2002, MNRAS, 337, 1309
- Stilp et al. (2013) Stilp A. M., Dalcanton J. J., Warren S. R., Skillman E., Ott J., Koribalski B., 2013, ApJ, 765, 136
- Tang et al. (2014) Tang J., Bressan A., Rosenfield P., Slemer A., Marigo P., Girardi L., Bianchi L., 2014, MNRAS, 445, 4287
- Tully et al. (1978) Tully R. B., Bottinelli L., Fisher J. R., Gougenheim L., Sancisi R., van Woerden H., 1978, A&A, 63, 37
- Utrobin & Chugai (2017) Utrobin V. P., Chugai N. N., 2017, MNRAS, 472, 5004
- Vasiliev & Shchekinov (2017) Vasiliev E. O., Shchekinov Y. A., 2017, Open Astronomy, 26, 233
- Vasiliev et al. (2015a) Vasiliev E. O., Moiseev A. V., Shchekinov Y. A., 2015a, Baltic Astronomy, 24, 213
- Vasiliev et al. (2015b) Vasiliev E. O., Nath B. B., Shchekinov Y., 2015b, MNRAS, 446, 1703
- Vorobyov & Basu (2005) Vorobyov E. I., Basu S., 2005, A&A, 431, 451
- Walter et al. (2008) Walter F., Brinks E., de Blok W. J. G., Bigiel F., Kennicutt R. C., Thornley M. D., Leroy A. K., 2008, AJ, 136, 2563
- Warren et al. (2011) Warren S. R., et al., 2011, ApJ, 738, 10
- Warren et al. (2012) Warren S. R., et al., 2012, ApJ, 757, 84
- Weaver et al. (1977) Weaver R., McCray R., Castor J., Shapiro P., Moore R., 1977, ApJ, 218, 377
- Weisz et al. (2008) Weisz D. R., Skillman E. D., Cannon J. M., Dolphin A. E., Kennicutt Jr. R. C., Lee J. C., Walter F., 2008, ApJ, 689, 160
- Weisz et al. (2009a) Weisz D. R., Skillman E. D., Cannon J. M., Walter F., Brinks E., Ott J., Dolphin A. E., 2009a, ApJ, 691, L59
- Weisz et al. (2009b) Weisz D. R., Skillman E. D., Cannon J. M., Dolphin A. E., Kennicutt R. C., Lee J. C., Walter F., 2009b, ApJ, 704, 1538
- Westpfahl & Puche (1994) Westpfahl D., Puche D., 1994, in Meylan G., Prugniel P., eds, European Southern Observatory Conference and Workshop Proceedings Vol. 49, European Southern Observatory Conference and Workshop Proceedings. p. 295
- Wiebe et al. (2014) Wiebe D. S., Khramtsova M. S., Egorov O. V., Lozinskaya T. A., 2014, Astronomy Letters, 40, 278
- Young & Lo (1997) Young L. M., Lo K. Y., 1997, ApJ, 490, 710
- Zhang et al. (2017) Zhang K., et al., 2017, MNRAS, 466, 3217
- de Vaucouleurs et al. (1991) de Vaucouleurs G., de Vaucouleurs A., Corwin Jr. H. G., Buta R. J., Paturel G., Fouqué P., 1991, Third Reference Catalogue of Bright Galaxies. Volume I: Explanations and references. Volume II: Data for galaxies between 0h and 12h. Volume III: Data for galaxies between 12h and 24h.
- van Dyk et al. (1998) van Dyk S. D., Puche D., Wong T., 1998, AJ, 116, 2341