Multiobjective Differential Evolution Enhanced with Principle Component Analysis for Constrained Optimization111This work was supported by the National Natural Science Foundation of China under Grant 61573157
Abstract
Multiobjective evolutionary algorithms (MOEAs) have been successfully applied to a number of constrained optimization problems. Many of them adopt mutation and crossover operators from differential evolution. However, these operators do not explicitly utilise features of fitness landscapes. To improve the performance of algorithms, this paper aims at designing a search operator adapting to fitness landscapes. Through an observation, we find that principle component analysis (PCA) can be used to characterise fitness landscapes. Based on this finding, a new search operator, called PCA-projection, is proposed. In order to verify the effectiveness of PCA-projection, we design two algorithms enhanced with PCA-projection for solving constrained optimization problems, called PMODE and HECO-PDE, respectively. Experiments have been conducted on the IEEE CEC 2017 competition benchmark suite in constrained optimisation. PMODE and HECO-PDE are compared with the algorithms from the IEEE CEC 2018 competition and another recent MOEA for constrained optimisation. Experimental results show that an algorithm enhanced with PCA-projection performs better than its corresponding opponent without this operator. Furthermore, HECO-PDE is ranked first on all dimensions according to the competition rules. This study reveals that decomposition-based MOEAs, such as HECO-PDE, are competitive with best single-objective and multiobjective evolutionary algorithms for constrained optimisation, but MOEAs based on non-dominance, such as PMODE, may not.
keywords:
constrained optimization; multiobjective optimization; principle component analysis; differential evolution; fitness landscape.1 Introduction
Optimization problems in the real world often contain different types of constraints. In mathematics, a constrained optimization problem (COP) can be formulated as
| (1) | ||||
| (5) |
where is the bounded constraint. and denote lower and upper boundaries respectively. is the th inequality constraint. is the th equality constraint.
There exist a variety of evolutionary algorithms (EAs) for solving COPs, which employ different constraint handling techniques, such as the penalty function method, feasibility rule, repair method and multi-objective optimization [1, 2, 3]. This paper focuses on the multi-objective optimization method [4], which is to convert a COP into a multi-objective optimization problem without any constraint. The advantage of using this method is no need to handle constraints in a special way, because constraints themselves are converted into objectives and a COP will be solved by MOEAs.
The converted problem often is a bi-objective optimization problem [5, 6]:
| (6) |
in which one objective is the original objective function and the other is the degree of violating the constraints .
| (7) |
The first part in the formula is the sum of the degree of violating an inequality constraint, given by
| (8) |
The second part is the sum of the degree of violating an equal constraint, given by
| (9) |
where is a tolerance allowed for the equality constraint.
Many MOEAs have been proposed for solving constrained optimisation problems [4]. Most of them adopt mutation and crossover operators from differential evolution (DE). However, these operators do not explicitly utilise characteristics of fitness landscapes. Intuitively, a search operator which adapts to fitness landscapes may be more efficient than those without adaptation. A recent theoretical study also claims that in terms of the time-based fitness landscape, unimodal functions are the easiest and deceptive functions to EAs are the hardest [7]. Therefore, it is important to design a landscape-adaptive search operator which may improve the performance of EAs.
Our idea is to enhance EAs with principle component analysis (PCA). There exist a suite of studies which have shown PCA may improve the performance of EAs. Munteanu and Lazarescu [8] designed a PCA-mutation operator and claimed that PCA-mutation is more successful in maintaining population diversity during search. Because of PCA’s inherent capability of rebuilding a new coordinate system, Li et al. [9] applied PCA to the design of crossover for reducing correlations among variables. PCA was used in particle swam optimization (PSO) to mine population information for promising principal component directions [10, 11, 12]. This information is utilized in velocity vectors of particles. Because PCA is a powerful tool in dimensional reduction, it helped EAs solve high dimensional optimization problems [13, 14]. Besides its application in designing search operators, local principal component analysis is used for building a regularity model in multiobjective estimation of distribution algorithms [15, 16]. However, the number of references of applying PCA to EAs is still very small and it is worth making further investigations.
In this paper, we design a new search operator adapting to fitness landscapes with the aid of PCA. PCA is used to identify the maximal variance direction in a population. Given a “valley” fitness landscape in the 3-dimensional space, we observe that the direction obtained by PCA is consistent with the valley direction. Based on this observation, we design a new search operator, called PCA-projection. The research question of this paper is whether a MOEA enhanced with PCA-projection is able to outperform its rival without this operator or other state-of-arts EAs. To answer this question, we design two MOEAs enhanced with PCA-projection, conduct experiments on the IEEE CEC 2017 benchmark suit for constrained optimisation competition [17] and compare them with EAs from the CEC 2018 competition [18].
The remainder of this paper is organised as follows. Section 2 reviews MOEAs for constrained optimisation. Section 3 introduces related work in differential evolution and PCA’s applications in EAs. Section 4 explains PCA-projection in detail. Section 5 designs two EAs enhanced with PCA-projection. Section 6 reports comparative experimental results. Section 7 concludes this paper.
2 Literature Review of Multiobjective Evolutionary Algorithms for Constrained Optimisation
The idea of applying MOEAs to constrained optimisation has attracted researchers’ interest in last two decades. Surry and Radcliff [5] proposed constrained optimization by multi-objective genetic algorithms. They considered a COP in a dual perspective, as a constraint satisfaction problem and an unconstrained optimization problem. Coello [19] introduced the concept of non-dominance to handle constraints into the fitness function of a genetic algorithm. Feasible individuals are ranked higher than infeasible ones, while infeasible individuals with a lower degree of constraint violation is ranked higher than those with a higher degree. Zhou et al. [6] converts a COP to a two-objective optimization model composed of the original objective function and the degree function violating the constraints. Then they designed a real-coded genetic algorithm based on Pareto strength and Minimal Generation Gap model.
Most MOEAs for constrained optimisation belong to the category of MOEAs based on non-dominance or Pareto ranking. Venkatraman and Yen [20] proposed a two-phase genetic algorithm framework for solving COPs. In the first phase, a COP is treated as a constraint satisfaction problem. In the second phase, a COP is treated as a bi-objective optimization problem with the simultaneous optimization of the objective function and the satisfaction of the constraints. Then the Non-Dominated Sorting Genetic Algorithm (NSGA-II) is used. Cai and Wang [21, 22] combined multiobjective optimization with differential evolution (CMODE) to solve COPs which is based on the two-objective model. The search is guided by infeasible solution archiving and replacement mechanism. Furthermore, they provided a dynamic hybrid framework [23], which consists of global search and local search models. More recently, Gao and Yen et al. [24] considered COPs as a bi-objective optimization problem, where the first objective is the reward function or actual cost to be optimized, while the second objective is the constraint violations degree. Gao et al. [25] proposed a reverse comparison strategy based on multi-objective dominance concept. That strategy converted the original COPs to a multi-objective problem with one constraint, and weeds out worse solutions with smaller fitness value regardless of its constraints violation. Li et al. [26] and Zeng et al. [27] converted a COP into a dynamic constrained many-objective optimization problem, and considered three types of MOEAs, i.e., Pareto ranking-based, decomposition-based, and hype-volume indicator-based to instantiate the framework.
Recently, MOEAs based on objective decomposition have been applied to constrained optimisation. Xu et al. [28] constructed several helper objective functions using the weighted sum method but with static weights. Then they employed DE for optimising optimisation subproblems. Wang et al. [29] considered the weighted sum approach with dynamical weight to decompose the problem (24) and also applied DE to solve them. Peng et al. [30] adopted the Chebyshev approach in objective decomposition with biased dynamic weights.
The purpose of using MOEAs for constrained optimisation is to seek the optimal feasible solution, but not to generate a uniformly distributed Pareto front. Therefore, we guess that decomposition-based MOEAs are more flexible than MOEAs based on non-dominance or Pareto ranking, because through biased dynamic weights, we may adjust the search direction of decomposition-based MOEAs. At the beginning, a MOEA searches different directions, but at the later stage, it focuses more on the direction towards the optimal feasible solution.
3 Two Pieces of Related Work
Our work is linked to classical DE [31] and the application of PCA in EAs [8]. This section reviews them one by one.
3.1 Differential Evolution
DE is a popular EA for solving continuous optimization problems [31]. In DE, a population is represented by -dimensional vectors:
| (10) | |||
| (11) |
where is the population size. Initial individuals are chosen randomly from . An initial individual is generated at random as follows:
| (12) |
where is the random number .
The DE algorithm consists of three operations: mutation, crossover and selection, which are described as follows [31, 28].
- Mutation:
-
for each individual where a mutant vector is generated by
(13) where individuals are chosen from at random but mutually different. They are also chosen to be different from . is a real and constant factor from which controls the amplification of the differential variation . In case is out of the interval , the mutation operation is repeated until falls in .
- Crossover:
-
in order to increase population diversity, crossover is also used in DE. The trial vector is generated by mixing the target vector with the mutant vector .
Trial vector is constructed as follows:(14) where is a uniform random number from . Index is randomly chosen from . denotes the crossover constant which has to be determined by the user. In addition, the condition “” is used to ensure the trial vector gets at least one parameter from vector .
- Selection:
-
a greedy criterion is used to decide whether the offspring generated by mutation and crossover should replace its parent. Trail vector is compared to target vector , then the better one will be reserved to the next generation.
Notice that both mutation and crossover operators do not explicitly utilise features of fitness landscapes.
There exist several variants of DE algorithms. A classical DE algorithm is the DE/Rand/1/bin DE [32] which is illustrated below.
3.2 Application of Principle Component Analysis in Evolutionary algorithms
It is an interesting idea to apply PCA to the design of EAs but so far only a few research papers can be found on this topic. Munteanu and Lazarescu’s work [8] designed a mutation operator based on PCA. They claimed that a PCA-mutation genetic algorithm (GA) is more successful in maintaining population diversity during search. Their experimental results show that a GA with the PCA-mutation obtained better solutions compared to solutions found using GAs with classical mutation operators for a filter design problem.
Munteanu and Lazarescu [8] designed a new mutation operator on a projection search space generated by PCA, rather than the original space. Their PCA mutation is described as follows. A population with individuals is represented by an matrix where is the space dimension and the population size. Each is an individual represented by a column vector.
| (15) |
| (16) |
| (17) |
| (18) |
| (19) |
Notice that the above PCA-mutation doesn’t reduce the data set into a lower dimension space, instead and have the same dimension. This PCA-mutation aims to conduct mutation in the projection space rather than the original space. However the dimensions of the projection space and original space are the same.
4 A New Search Operator: PCA-projection
In order to improve the performance of EAs, we propose a new search operator, called PCA-projection, which is able to adapt to fitness landscapes.
4.1 Principle Component Analysis and Valley Direction
Although PCA-mutation proposed in [8] was efficient for a filter design problem, it has a disadvantage. PCA-mutation still acts on the same dimension space as the original search space. Thus, as the population size increases, the calculation of eigenvalues and eigenvectors in PCA becomes more and more expensive. In this paper, we propose a different PCA-search operator in which PCA is only applied to several selected points. A question is how to select points from a population for implementing PCA? The solution relies on the “valley” concept.
In the 3-dimensional space, a valley is intuitive which means a low area between two hills or mountains. However, this definition is really fuzzy in high-dimensional spaces. What does a valley in a higher dimensional space mean? How to identify the location of a valley? So far there exist no clear mathematical definition about the valley. In this paper, we study the valley landscape using PCA and find that PCA provides a statistic method of identifying the valley direction.
Let’s explain our idea using the well-known Rosenbrock function:
| (20) |
Its minimum point is at with . Fig. 1a shows the contour graph of Rosenbrock function. From Fig. 1a, it is obvious that a deep valley exists on this landscape. But how to identify the valley?
In the following we show a statistical method of calculating the valley direction. First we sample 20 points at random and select 6 points with smallest function values from the population. Fig. 1b depicts that these 6 points (labelled by squared points) are closer to the valley than other points.
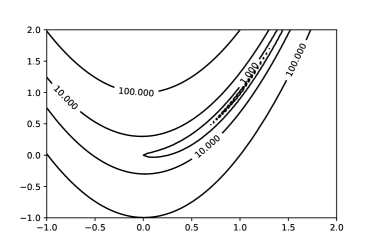
Next we identify the valley direction. Since the selected 6 points distribute along the valley, the valley direction can be regarded as a direction along which the variance of the 6 points is maximal. This direction can be identified by PCA. Assume that the valley direction is a linear line, the valley in fact can be approximated by the first principle component found by PCA. Let’s project the 6 selected points onto the first principle component. Fig. 1c shows that the projected points (labeled by dotted points) approximately represent the valley direction.
But it should be pointed out if we apply PCA to the whole population and project all 20 points onto the first principle component, we cannot obtain the valley direction. Fig. 1d shows that the mapped points (labeled by dotted points)) don’t distribute along the valley direction. The mapped points could represent any direction if these 20 points are sampled at random.
4.2 Proposed PCA Projection
Based on the observation in the above subsection, we propose a new search operator. Here is our idea: Given a population, we select a group of points with smaller function values from the population and apply PCA to calculate principle components; then project the points onto the principle components; at the end, reconstruct the projected points in the original search space. These points are taken as the children. The procedure is described in detail as follows:
- PCA-projection:
-
Given a population and a fitness function ,
1:Select individuals with smaller fitness values from the population ( is a small constant). Denote these individuals by .2:Calculate the mean vector and covariance matrix :(21) 3:Calculate the eigenvectors of the covariance matrix , sorted them so that the eigenvalues of is larger than for . Select the first eigenvectors and form a matrix where is a small constant (e.g., ).4:Project onto the -dimensional space:(22) 5:Reconstruct the projected point in the original space:(23)
We call the search operator PCA-projection, rather than PCA-mutation [8], because it does not include a mutation step.
4.3 Characteristics of PCA-projection
PCA-projection is a nonlinear mapping from points in to points in which are assigned along the first principle components. It can be regarded as a multi-parent recombination operator. Like other recombination operators, it works only if the parent population keeps a degree of diversity. Otherwise, it might degenerate. For example, if points are identical (say ), then after PCA-projection, the projected points are still . If points distribute on the same line (say ), then the first principle component is . After PCA-projection, there is no change on these points.
PCA-projection generates the direction along which the distribution of points has the maximal variance. It is not the gradient direction. Let’s show the difference through a simple example. Consider the minimisation problem
If points distribute on the same line (say where ), then the first component direction found by PCA-projection is . But the gradient direction is perpendicular to the line .
Compared with PCA-mutation in [8], PCA-projection has three new characteristics:
-
1.
The time complexity of PCA-projection is less than PCA-mutation in [8]. Given points in , the covariance matrix computation in PCA is and its eigenvalue decomposition is . So, the complexity of PCA is . In PCA-projection, only good points are sampled from the population. For example, in this paper, so, its time complexity is . But in PCA-mutation, the number of points equals to the population size. For example, population size is , so, its time complexity is .
-
2.
The PCA-projection has an intuitive explanation. Given a valley landscape, it projects an individual to a new position along the valley direction.
-
3.
It also takes the advantage of compressing a higher dimensional data into a lower dimension space. It projects a point into a lower dimensional space.
5 Two New Algorithms Enhanced by PCA-Projection
In this section, we present two MOEAs enhanced with PCA-projection for COPs.
5.1 New Algorithm 1: PMODE = CMODE + PCA-projection
We design the first algorithm though adding PCA-projection to CMODE, an algorithm proposed by Cai and Wang [21, 22]. It combines multiobjective optimization with differential evolution. CMODE is used to solve the standard bi-objective problem:
| (24) |
CMODE belongs to the family of MOEAs based on non-dominance. At each generation, it identifies non-dominant solutions under functions and replaces those dominated solutions. It is straightforward to add PCA-projection into CMODE through the mixed strategy, that is to apply PCA-projection with probability and normal mutation and crossover operations with probability . After PCA-projection is added into CMODE, we name the new algorithm PMODE. The pseudo-code of PMODE is shown as below.
For the sake of self-contained presentation, we explain PMODE in detail. Lines 1-4 are initialisation steps. In lines 1 and 2, an initial population is generated at random, in which all initial vectors are chosen randomly from . Then the fitness value and constraint violation degree of each individual are evaluated. In line 3, records the number of fitness evaluations. In line 4, is an archive to store the infeasible individual with the lowest degree of constraint violation. Initially it is set to an empty set.
Lines 5 to 31 are the main loop of this algorithm. represents the maximum number of function evaluations. In line 6, is a set to keep the children generated by PCA- projection, mutation and crossover. Initially it is set to an empty set.
In lines 7 and 8, individuals (denoted by ) are selected from population . denotes the rest individuals in . Subpopulation takes part in PCA-projection, mutation and crossover, but subpopulation does not.
In lines 10 to 15, a trial vector is generated by a mixed strategy. PCA-projection is chosen with probability 0.1, or mutation and crossover are chosen with probability 0.9. is a random number in . This is the main difference form CMODE [22] in which PCA-projection exists.
In line 11, PCA-projection is conducted on subpopulation , then new solutions are generated. The procedure of PCA-projection on is given as follows: (1) calculate the eigenvectors of the covariance matrix with the largest eigenvalues; (2) project onto a lower-dimensional space; (3) reconstruct the projected point in the original space, denoted by . In line 12, set the trial vector
In line 14, generate a mutant vector by
| (25) |
where random indexes are mutually different integers. They are also chosen to be different from the running index . is a real and constant factor from which controls the amplification of the differential variation .
Then the trial vector is generated by crossover on the mutant vector . In more detail, trial vector is constructed as follows:
| (28) |
where is a uniform random number from . Index is randomly chosen from . denotes the crossover constant which has to be determined by the user. In addition, the condition “” is used to ensure the trial vector gets at least one parameter from vector .
In line 16, the trail vector is added into children subpopulation .
In line 18, the values of and of each individual in are evaluated. Then in line 19, all non-dominated solutions in are identified and stored in set . In lines 21 and 22, non-dominated individuals in replace dominated individuals in at random.
In line 24, a new generation population is generated by merging .
The difference between PMODE and CMODE is PCA-projection. There is no other change in other parts. This design aims to evaluate the effectiveness of PCA-project without the interface of other factors.
5.2 New Algorithm 2: HECO-PDE = HECO-DE +PCA-projection
We design the second algorithm through adding PCA-projection to HECO-DE222Xu, T., He, J.,& Shang, C. (2019). Helper and Equivalent Objectives: An Efficient Approach to Constrained Optimisation. arXiv preprint arXiv:1903.04886. Also in ACM GECCO 2019 Competition in Constrained Optimisation., an algorithm proposed by Xu, He and Shang under the framework of helper and equivalent objectives. HECO-DE is built upon a single-objective EA (LSHADE44) for constrained optimisation [33], but aims at minimising two objective functions within population :
| (29) |
This bi-objective optimisation problem is different from the standard one (24) because function is given by
| (30) |
where are weights. Function in which denotes the best individual’s fitness in population , given as
HECO-DE belongs to the family of MOEAs based on decomposition. Problem (29) is decomposed into single objective subproblems through the weighted sum method: for
| (32) |
where are tuples of weights.
An extra term is added besides the original objective function and constraint violation degree , so problem (32) is equivalent to a tri-objective optimisation problem.
| (33) |
PCA-projection is added into HECO-DE through a mixed strategy, that is to apply PCA-projection with probability and normal mutation and crossover operations with probability . For the new algorithm enhanced with PCA-projection, we call it HECO-PDE. The pseudo-code of HECO-PDE is shown as follows.
For the sake of self-contained presentation, we explain HECO-PDE in detail. Lines 2 and 3 are to initialise several algorithm parameters, including:
-
1.
is the required initial population size and is final size;
-
2.
is a pre-defined maximum number of fitness evaluations;
-
3.
and are two circle memories for parameters;
-
4.
is the size of historical memories;
-
5.
are the initial probability distribution of four strategies
-
6.
is external archive;
-
7.
is the number of generations.
Lines 4-6 are to generate an initial population at random and evaluate the objective value and constraint violation for each individual . The number of fitness evaluation .
In line 8, weights on functions are adjusted by the following formulas:
| (37) |
Weights and increase over but decreases over .
In line 9, sets and are assigned to an empty set for each strategy. Here a strategy means a combination of a mutation operator and a crossover operator. Sets and are used to preserve successful values of in mutation and in crossover for each search strategy respectively.
In line 10, set (used for saving children population) is also assigned to an empty set.
In line 11, individuals (denoted as ) are selected randomly from without putting them back to . Since calculating the value of the equivalent function (30) relies on ranking individuals in , its size is set to a small constant. Thus, the time complexity of ranking is a constant. This is different from LSHADE44 [33] which applies a search strategy to population . The time complexity of ranking in LSHADE44 [33] is a function of .
In lines 13-19, a trial vector is generated by a mixed strategy. PCA-projection is chosen with probability 0.1, or mutation and crossover are chosen with probability 0.9. is a random number in .
In lines 14 and 15, PCA-projection is conducted on . Then projected vectors are generated, denoted by , . Let .
In line 17, the th search strategy is selected with probability . A mechanism of competition of strategies [34, 35] is employed to create trial points. The probability is adapted according to its success counts. A used strategy is considered successful if a generated trial point is better than the original point . The selection probability
| (38) |
where is the count of the th strategy’s successes, and is a constant. Parameters and are generated from respective circle memories.
Then trial vector is generated by a strategy, i.e., mutation plus crossover. There are two mutation operators used in the algorithm. The first one is current-to-pbest/1 mutation as proposed in JADE [36].
| (39) |
where is the target point. is randomly chosen from the top of population where a parameter. is uniformly chosen from population . Individual is randomly selected from where is an archive. is a mutation factor.
The second mutation is randrl/1 mutation [37].
| (40) | |||
| (41) |
In mutation (40), , and are randomly chosen from population . These three points are mutually distinct and different from . In mutation (41), , and are selected as mutation (40) and then are ranked. is the best individual while and denote the rest two. () is the mutation factor. Kaelo and Ali [37] tested the randrl/1 mutation on a set of 50 difficult benchmark problems, with the results indicating that the use of this strategy speeds up the search by without significant decreasing the reliability as compared to searching with the original mutation operator.
There are two crossover operators used in the algorithm. The first one is binomial crossover: It combines coordinates of with coordinates of mutant into a trial point
| (44) |
where the index is a randomly chosen integer from . is a uniform random number. is a crossover control parameter.
The second crossover is the exponential crossover [32]. It combines the coordinates of with the coordinates of the mutant into a trial point as follows:
| (47) |
where denotes a modulo function with modulus D. is the starting integer number randomly chosen from , and the integer is drawn from subject to an exponential probability distribution. Thus, four search strategies (combinations) can be produced.
In line 21, is appended to subpopulation , which results in an enlarged subpopulation . In line 22, the values of , and normalised by the max-min normalisation for each individual in . Then the values of and are calculated according to formula (32). If , i.e., the trial point is better than its parent in terms of , then in line 25, is saved into archive , and into children set . The th individual in subpopulation is used to minimise . HECO-DE minimises objective functions simultaneously.
In line 26, parameters in mutation and in crossover are saved into respective sets and . Then the respective success counter is updated.
After completing search on subpopulation , in lines 29, circle memories and are updated using respective and for each strategy. The detail of this process refers to LSHADE44 [33].
In line 30, population is updated by merging children and those individuals not involved in search. In line 31-34, if population size is greater than the required size , then non-best individuals are removed from at random where is given by
| (48) |
Similarly in lines 35-38, if archive size is greater than the maximum size , then individuals are removed from at random.
Except PCA-projection, the other part of HECO-PDE is the same as HECO-DE. This design aims to evaluate the effectiveness of PCA-project without the interface of other factors.
6 Comparative Experiments and Results
In order to demonstrate the effectiveness of PCA-projection, HECO-PDE and PMODE are tested on the IEEE CEC 2017 benchmark suite in constrained optimization competition [17] and compared with the state-of-art EAs participated in the CEC 2018 competition [18].
6.1 The CEC 2017 Benchmark Suit
The IEEE CEC 2017 benchmark suit in constrained optimisation competition [18] consists of problems with the dimension , therefore, instances in total. This suit was adopted by both CEC 2017 and 2018 competitions [17]. The detail of these problems are listed in Table 1.
| Problem Search Range | Type of Objective | Number of Constraints | |
| C01 [-100,100]D | Non Separable | 0 | 1 Separable |
| C02 [-100,100]D | Non Separable, Rotated | 0 | 1 Non Separable, Rotated |
| C03 [-100,100]D | Non Separable | 1 Separable | 1 Separable |
| C04 [-10,10]D | Separable | 0 | 2 Separable |
| C05 [-10,10]D | Non Separable | 0 | 2 Non Separable, Rotated |
| C06 [-20,20]D | Separable | 6 | 0 Separable |
| C07 [-50,50]D | Separable | 2 Separable | 0 |
| C08 [-100,100]D | Separable | 2 Non Separable | 0 |
| C09 [-10,10]D | Separable | 2 Non Separable | 0 |
| C10 [-100,100]D | Separable | 2 Non Separable | 0 |
| C11 [-100,100]D | Separable | 1 Non Separable | 1 Non Separable |
| C12 [-100,100]D | Separable | 0 | 2 Separable |
| C13 [-100,100]D | Non Separable | 0 | 3 Separable |
| C14 [-100,100]D | Non Separable | 1 Separable | 1 Separable |
| C15 [-100,100]D | Separable | 1 | 1 |
| C16 [-100,100]D | Separable | 1 Non Separable | 1 Separable |
| C17 [-100,100]D | Non Separable | 1 Non Separable | 1 Separable |
| C18 [-100,100]D | Separable | 1 | 2 |
| C19 [-50,50]D | Separable | 0 | 2 Non Separable |
| C20 [-100,100]D | Non Separable | 0 | 2 |
| C21 [-100,100]D | Rotated | 0 | 2 Rotated |
| C22 [-100,100]D | Rotated | 0 | 3 Rotated |
| C23 [-100,100]D | Rotated | 1 Rotated | 1 Rotated |
| C24 [-100,100]D | Rotated | 1 Rotated | 1 Rotated |
| C25 [-100,100]D | Rotated | 1 Rotated | 1 Rotated |
| C26 [-100,100]D | Rotated | 1 Rotated | 1 Rotated |
| C27 [-100,100]D | Rotated | 1 Rotated | 2 Rotated |
| C28 [-50,50]D | Rotated | 0 | 2 Rotated |
6.2 Experimental Settings
As suggested by the CEC 2018 competition [18], the maximum number of function evaluations . For each algorithm, 25 independent runs were taken on each problem and dimension respectively.
The parameters of PMODE are set as follows. For a fair comparison, the setting is chosen as the same as that used in CMODE although fine-tuning parameters of PMODE may lead to better results.
-
1.
population size is set as 180;
-
2.
scaling factor is randomly chosen between 0.5 and 0.6;
-
3.
PCA crossover controlling parameter is randomly chosen between 0.9 and 0.95;
-
4.
subpopulation size ;
-
5.
the interval of executing infeasible solution replacement .
The parameters of HECO-PDE are set as follows. Although fine-tuning parameters of HECO-PDE may lead to better results, the setting is chosen as the same as that used in HECO-DE for a fair comparison.
-
1.
the number of subproblem ;
-
2.
in strategy competition, , , ;
-
3.
the size of historical memories ;
-
4.
the initial and final required population sizes , .
6.3 Description of EAs under Comparison
HECO-PDE and PMODE are compared with all seven EAs participated in the CEC 2018 constrained optimisation competition [18] apart from HECO-DE and CMODE. All EAs from the CEC 2017 competition belong to the single-objective method for COPs. Thus, a latest decomposition-based multi-objective EA, DeCODE [29], is also taken in the comparison. These algorithms are described as follows.
-
1.
CAL-SHADE [38]: Success-History based Adaptive Differential Evolution Algorithm including liner population size reduction, enhanced with adaptive constraint violation handling, i.e. adaptive -constraint handling.
-
2.
LSHADE+IDE [39]: A simple framework for cooperation of two advanced adaptive DE variants. The search process is divided into two stages: (i) search feasible solutions via minimizing the mean violation and stopped if a number of feasible solutions are found. (ii) minimize the function value until the stop condition is reached.
-
3.
LSHADE44 [33]: Success-History based Adaptive Differential Evolution Algorithm including liner population size reduction, uses three different additional strategies compete, with Deb’s superiority of feasibility rule.
-
4.
UDE [40]: Uses three trial vector generation strategies and two parameter settings. At each generation, UDE divides the current population into two sub-populations. In the first population, UDE employs all the three trial vector generation strategies on each target vector. For another one, UDE employs strategy adaption from learning experience from evolution in first population.
-
5.
MA-ES [41]: Combines the Matrix Adaptation Evolution Strategy for unconstrained optimization with well-known constraint handling techniques. It handles box-constraints by reflecting exceeding components into the predefined box. Additional in-/equality constraints are dealt with by application of two constraint handling techniques: -level ordering and a repair step that is based on gradient approximation.
-
6.
IUDE [42]: An improved version of UDE. Different from UDE, local search and duplication operators have been removed, it employs a combination of -constraint handling technique and Deb’s superiority of feasibility rule.
-
7.
LSHADE-IEpsilon [43]: An improved -constrained handling method (IEpsilon) for solving constrained single-objective optimization problems. The IEpsilon method adaptively adjusts the value of according to the proportion of feasible solutions in the current population. Furthermore, a new mutation operator DE/randr1*/1 is proposed.
-
8.
DeCODE [29]: A recent decomposition-based EA made use of the weighted sum approach to decompose the transformed bi-objective problem into a number of scalar optimisation subproblems and then applied differential evolution to solve them. They designed a strategy of adjusting weights and a restart strategy to tackle COPs with complicated constraints.
6.4 The Rules for Ranking Algorithms
Because the CEC 2017 competition aimed to compare performance of a group of EAs together, a set of rules was provided for ranking all algorithms [17]. Our comparison follows the same rules, which are listed as below.
-
1.
The procedure for ranking algorithms based on mean values:
-
(a)
Rank the algorithms based on feasibility rate;
-
(b)
Then rank the algorithms according to the mean violation amounts;
-
(c)
At last, rank the algorithms in terms of mean objective function value.
-
(a)
-
2.
The procedure for ranking the algorithms based on the median solutions:
-
(a)
A feasible solution is better than an infeasible solution;
-
(b)
Rank feasible solutions based on their objective function values;
-
(c)
Rank infeasible solutions according to their constraint violation amounts.
-
(a)
-
3.
Ranking all algorithms on multiple problems: for each problem, algorithms’ ranks are determined in terms of the mean values and median solutions at maximum allowed number of evaluations, respectively. The total rank value of an algorithm is calculated as below:
(49)
6.5 Comparative Experimental Results
Table 2 summarises ranks of all algorithms on four dimensions and total ranks. HECO-PDE and PMODE got lower rank values than HECO-DE and CMODE, respectively. This result clearly demonstrates that HECO-DE and CMODE are improved by PCA-projection. Moreover, HECO-PDE got the lowest rank value among all compared algorithms. This result means that HECO-PDE enhanced with PCA-projection is the best in terms of the overall performance.
| Algorithm/Dimension | Total | ||||
| CAL_LSAHDE(2017) | 418 | 398 | 428 | 435 | 1679 |
| LSHADE44+IDE(2017) | 299 | 365 | 385 | 353 | 1402 |
| LSAHDE44(2017) | 319 | 313 | 308 | 310 | 1250 |
| UDE(2017) | 330 | 344 | 345 | 390 | 1409 |
| MA_ES(2018) | 266 | 240 | 243 | 246 | 995 |
| IUDE(2018) | 193 | 226 | 224 | 292 | 935 |
| LSAHDE_IEpsilon(2018) | 199 | 246 | 292 | 333 | 1070 |
| DeCODE | 237 | 276 | 277 | 296 | 1086 |
| CMODE | 443 | 618 | 628 | 631 | 2320 |
| PMODE | 425 | 610 | 630 | 626 | 2291 |
| HECO-DE | 173 | 164 | 177 | 183 | 697 |
| HECO-PDE | 155 | 138 | 152 | 177 | 622 |
The detailed rank values of all algorithms on mean values and median solutions on 28 test problems with the dimension of 10D, 30D, 50D and 100D are shown in Table 3-10, respectively.
Regarding the test functions with , rank values based on mean values and median solution on the 28 test functions are reported in Table 3 and 4, respectively. As shown in Table 3, in terms of mean values with , HECO-DE and CMODE got total rank values, with and respectively. By contrast, HECO-PDE got the lowest rank value, with and PMODE also got a lower rank value than CMODE, with . As shown in Table 4, in terms of median solutions with , HECO-DE and CMODE got total rank values, with and respectively. By contrast, HECO-PDE got the lowest rank value, with while PMODE got the same rank value with CMODE, with .
| Problem | 1 | 2 | 3 | 4 | 5 | 6 | 7 | 8 | 9 | 10 | 11 | 12 | 13 | 14 | 15 | 16 | 17 | 18 | 19 | 20 | 21 | 22 | 23 | 24 | 25 | 26 | 27 | 28 | Total |
| CAL_LSAHDE(2017) | 1 | 1 | 10 | 10 | 12 | 6 | 7 | 12 | 11 | 12 | 7 | 1 | 12 | 7 | 8 | 10 | 11 | 12 | 1 | 8 | 12 | 12 | 9 | 10 | 10 | 12 | 10 | 1 | 235 |
| LSHADE44+IDE(2017) | 1 | 1 | 8 | 7 | 1 | 12 | 6 | 1 | 1 | 2 | 1 | 3 | 1 | 9 | 5 | 8 | 6 | 10 | 4 | 4 | 2 | 7 | 8 | 8 | 8 | 6 | 11 | 10 | 151 |
| LSAHDE44(2017) | 1 | 1 | 9 | 5 | 1 | 11 | 5 | 1 | 10 | 2 | 2 | 10 | 1 | 8 | 9 | 9 | 7 | 9 | 2 | 1 | 4 | 9 | 7 | 7 | 9 | 7 | 9 | 11 | 167 |
| UDE(2017) | 1 | 1 | 7 | 8 | 11 | 7 | 4 | 1 | 8 | 2 | 10 | 1 | 11 | 6 | 6 | 7 | 8 | 8 | 9 | 10 | 8 | 11 | 6 | 4 | 7 | 9 | 8 | 7 | 186 |
| MA_ES(2018) | 1 | 1 | 1 | 9 | 1 | 5 | 2 | 1 | 1 | 2 | 5 | 12 | 7 | 10 | 12 | 1 | 12 | 1 | 12 | 9 | 9 | 8 | 10 | 6 | 1 | 8 | 2 | 9 | 158 |
| IUDE(2018) | 1 | 1 | 5 | 3 | 1 | 1 | 8 | 1 | 1 | 2 | 6 | 7 | 1 | 3 | 4 | 1 | 5 | 7 | 4 | 7 | 3 | 10 | 1 | 4 | 1 | 4 | 7 | 6 | 105 |
| LSAHDE_IEpsilon(2018) | 1 | 1 | 6 | 4 | 1 | 8 | 3 | 1 | 1 | 2 | 3 | 5 | 1 | 2 | 7 | 1 | 4 | 2 | 3 | 6 | 5 | 1 | 3 | 9 | 1 | 5 | 1 | 12 | 99 |
| DeCODE | 1 | 1 | 1 | 6 | 1 | 1 | 1 | 11 | 8 | 1 | 9 | 4 | 10 | 1 | 1 | 6 | 3 | 11 | 10 | 5 | 1 | 1 | 5 | 1 | 6 | 3 | 12 | 4 | 125 |
| CMODE | 1 | 1 | 11 | 11 | 1 | 10 | 12 | 1 | 12 | 10 | 12 | 6 | 7 | 11 | 11 | 11 | 9 | 6 | 11 | 12 | 11 | 1 | 11 | 11 | 11 | 11 | 6 | 8 | 236 |
| PMODE | 1 | 1 | 12 | 12 | 1 | 9 | 10 | 1 | 1 | 10 | 11 | 11 | 7 | 12 | 10 | 12 | 10 | 5 | 4 | 11 | 10 | 1 | 12 | 12 | 12 | 10 | 5 | 5 | 218 |
| HECO-DE | 1 | 1 | 1 | 1 | 1 | 1 | 11 | 1 | 1 | 2 | 8 | 9 | 1 | 5 | 2 | 1 | 1 | 4 | 4 | 3 | 7 | 1 | 4 | 3 | 1 | 1 | 3 | 3 | 82 |
| HECO-PDE | 1 | 1 | 1 | 1 | 1 | 1 | 9 | 1 | 1 | 2 | 4 | 8 | 1 | 3 | 2 | 1 | 1 | 3 | 4 | 2 | 6 | 1 | 2 | 2 | 1 | 2 | 4 | 2 | 68 |
| Problem | 1 | 2 | 3 | 4 | 5 | 6 | 7 | 8 | 9 | 10 | 11 | 12 | 13 | 14 | 15 | 16 | 17 | 18 | 19 | 20 | 21 | 22 | 23 | 24 | 25 | 26 | 27 | 28 | Total |
| CAL_LSAHDE(2017) | 1 | 1 | 10 | 10 | 1 | 8 | 5 | 12 | 12 | 1 | 4 | 3 | 1 | 8 | 8 | 10 | 10 | 11 | 1 | 8 | 4 | 1 | 9 | 12 | 10 | 10 | 11 | 1 | 183 |
| LSHADE44+IDE(2017) | 1 | 1 | 9 | 5 | 1 | 10 | 6 | 1 | 1 | 2 | 2 | 4 | 1 | 10 | 7 | 9 | 6 | 10 | 4 | 4 | 5 | 1 | 10 | 9 | 9 | 8 | 10 | 2 | 148 |
| LSAHDE44(2017) | 1 | 1 | 8 | 7 | 1 | 9 | 7 | 1 | 1 | 2 | 4 | 12 | 1 | 9 | 10 | 8 | 7 | 8 | 2 | 1 | 1 | 1 | 8 | 8 | 8 | 6 | 9 | 11 | 152 |
| UDE(2017) | 1 | 1 | 6 | 8 | 1 | 7 | 4 | 1 | 10 | 2 | 10 | 1 | 1 | 1 | 5 | 7 | 9 | 9 | 11 | 10 | 1 | 1 | 1 | 5 | 7 | 9 | 8 | 7 | 144 |
| MA_ES(2018) | 1 | 1 | 1 | 9 | 1 | 1 | 2 | 1 | 1 | 2 | 2 | 5 | 1 | 3 | 12 | 1 | 8 | 1 | 10 | 9 | 6 | 1 | 3 | 7 | 1 | 7 | 1 | 10 | 108 |
| IUDE(2018) | 1 | 1 | 1 | 1 | 1 | 1 | 8 | 1 | 1 | 2 | 1 | 8 | 1 | 3 | 5 | 1 | 1 | 6 | 4 | 7 | 7 | 1 | 4 | 5 | 1 | 1 | 7 | 7 | 88 |
| LSAHDE_IEpsilon(2018) | 1 | 1 | 7 | 4 | 1 | 1 | 3 | 1 | 1 | 2 | 6 | 6 | 1 | 3 | 4 | 1 | 5 | 2 | 3 | 6 | 11 | 1 | 6 | 3 | 1 | 5 | 2 | 12 | 100 |
| DeCODE | 1 | 1 | 1 | 6 | 1 | 1 | 1 | 1 | 10 | 2 | 9 | 1 | 1 | 1 | 1 | 6 | 4 | 12 | 12 | 5 | 1 | 1 | 1 | 1 | 6 | 4 | 12 | 9 | 112 |
| CMODE | 1 | 1 | 11 | 12 | 1 | 11 | 11 | 1 | 1 | 12 | 12 | 7 | 1 | 11 | 11 | 11 | 11 | 5 | 4 | 12 | 8 | 1 | 11 | 10 | 11 | 11 | 6 | 2 | 207 |
| PMODE | 1 | 1 | 12 | 11 | 1 | 12 | 12 | 1 | 1 | 2 | 11 | 9 | 1 | 12 | 9 | 12 | 12 | 7 | 4 | 11 | 10 | 1 | 12 | 11 | 12 | 12 | 5 | 2 | 207 |
| HECO-DE | 1 | 1 | 1 | 1 | 1 | 1 | 9 | 1 | 1 | 2 | 8 | 11 | 1 | 6 | 2 | 1 | 2 | 4 | 4 | 3 | 9 | 1 | 7 | 4 | 1 | 3 | 3 | 2 | 91 |
| HECO-PDE | 1 | 1 | 1 | 1 | 1 | 1 | 10 | 1 | 1 | 2 | 7 | 10 | 1 | 6 | 2 | 1 | 2 | 3 | 4 | 2 | 12 | 1 | 5 | 2 | 1 | 2 | 4 | 2 | 87 |
Regarding the test functions with , rank values based on mean values and median solution on the 28 test functions are reported in Table 5 and 6, respectively. As shown in Table 5, in terms of mean values with , HECO-DE and CMODE got total rank values, with and respectively. By contrast, HECO-PDE got the lowest rank value, with and PMODE got a slightly lower rank value than CMODE, with . As shown in Table 6, in terms of median solutions with , HECO-DE and CMODE got total rank values, with and respectively. By contrast, HECO-PDE got the lowest rank value, with and PMODE got lower rank value than CMODE, with .
| Problem | 1 | 2 | 3 | 4 | 5 | 6 | 7 | 8 | 9 | 10 | 11 | 12 | 13 | 14 | 15 | 16 | 17 | 18 | 19 | 20 | 21 | 22 | 23 | 24 | 25 | 26 | 27 | 28 | Total |
| CAL_LSAHDE(2017) | 1 | 1 | 10 | 10 | 10 | 6 | 8 | 1 | 10 | 10 | 4 | 10 | 10 | 10 | 11 | 12 | 10 | 11 | 1 | 3 | 10 | 10 | 10 | 12 | 10 | 10 | 10 | 1 | 222 |
| LSHADE44+IDE(2017) | 1 | 1 | 9 | 6 | 1 | 11 | 4 | 10 | 1 | 9 | 3 | 7 | 7 | 9 | 7 | 8 | 7 | 9 | 4 | 5 | 8 | 7 | 9 | 9 | 8 | 7 | 11 | 9 | 187 |
| LSAHDE44(2017) | 1 | 1 | 8 | 4 | 1 | 10 | 5 | 2 | 1 | 1 | 2 | 5 | 6 | 8 | 8 | 9 | 6 | 6 | 2 | 1 | 7 | 8 | 7 | 8 | 9 | 6 | 9 | 10 | 151 |
| UDE(2017) | 1 | 1 | 5 | 9 | 7 | 4 | 2 | 9 | 7 | 8 | 8 | 8 | 8 | 6 | 6 | 7 | 8 | 7 | 9 | 9 | 4 | 6 | 5 | 6 | 6 | 8 | 8 | 6 | 178 |
| MA_ES(2018) | 1 | 1 | 1 | 8 | 1 | 3 | 1 | 2 | 1 | 1 | 1 | 9 | 1 | 7 | 12 | 1 | 9 | 2 | 10 | 10 | 9 | 1 | 6 | 7 | 1 | 9 | 1 | 4 | 120 |
| IUDE(2018) | 1 | 1 | 6 | 5 | 1 | 7 | 7 | 2 | 7 | 1 | 5 | 2 | 5 | 1 | 5 | 4 | 3 | 5 | 7 | 8 | 6 | 5 | 4 | 3 | 5 | 2 | 5 | 7 | 120 |
| LSAHDE_IEpsilon(2018) | 1 | 1 | 7 | 1 | 1 | 9 | 3 | 2 | 1 | 1 | 9 | 6 | 9 | 5 | 3 | 6 | 5 | 1 | 3 | 2 | 3 | 9 | 2 | 5 | 7 | 5 | 2 | 12 | 121 |
| DeCODE | 1 | 1 | 1 | 7 | 9 | 5 | 6 | 8 | 9 | 1 | 12 | 1 | 1 | 2 | 4 | 5 | 4 | 12 | 8 | 4 | 5 | 4 | 8 | 4 | 4 | 1 | 12 | 5 | 144 |
| CMODE | 12 | 12 | 12 | 11 | 12 | 8 | 11 | 12 | 12 | 12 | 10 | 12 | 11 | 11 | 10 | 10 | 12 | 10 | 11 | 11 | 12 | 12 | 11 | 10 | 11 | 11 | 7 | 11 | 307 |
| PMODE | 11 | 11 | 11 | 12 | 11 | 12 | 12 | 11 | 11 | 11 | 11 | 11 | 12 | 12 | 9 | 11 | 11 | 8 | 12 | 12 | 11 | 11 | 12 | 11 | 12 | 12 | 6 | 8 | 305 |
| HECO-DE | 1 | 1 | 1 | 2 | 8 | 1 | 9 | 2 | 1 | 1 | 7 | 4 | 1 | 4 | 1 | 1 | 1 | 4 | 4 | 6 | 2 | 3 | 3 | 2 | 1 | 4 | 3 | 3 | 81 |
| HECO-PDE | 1 | 1 | 1 | 2 | 1 | 1 | 10 | 2 | 1 | 1 | 6 | 3 | 1 | 3 | 1 | 1 | 2 | 3 | 4 | 7 | 1 | 2 | 1 | 1 | 1 | 3 | 4 | 2 | 67 |
| Problem | 1 | 2 | 3 | 4 | 5 | 6 | 7 | 8 | 9 | 10 | 11 | 12 | 13 | 14 | 15 | 16 | 17 | 18 | 19 | 20 | 21 | 22 | 23 | 24 | 25 | 26 | 27 | 28 | Total |
| CAL_LSAHDE(2017) | 1 | 1 | 10 | 10 | 1 | 6 | 8 | 1 | 1 | 1 | 4 | 8 | 10 | 7 | 9 | 12 | 10 | 9 | 1 | 3 | 3 | 10 | 6 | 12 | 12 | 10 | 9 | 1 | 176 |
| LSHADE44+IDE(2017) | 1 | 1 | 9 | 2 | 1 | 10 | 6 | 10 | 2 | 10 | 3 | 2 | 1 | 10 | 7 | 8 | 8 | 11 | 4 | 5 | 9 | 7 | 9 | 9 | 8 | 5 | 11 | 9 | 178 |
| LSAHDE44(2017) | 1 | 1 | 8 | 5 | 1 | 9 | 5 | 2 | 2 | 2 | 2 | 7 | 8 | 9 | 8 | 9 | 7 | 5 | 2 | 1 | 8 | 8 | 8 | 7 | 9 | 8 | 10 | 10 | 162 |
| UDE(2017) | 1 | 1 | 5 | 9 | 1 | 4 | 2 | 9 | 8 | 9 | 8 | 9 | 7 | 6 | 6 | 5 | 9 | 7 | 7 | 9 | 3 | 6 | 1 | 6 | 6 | 9 | 7 | 6 | 166 |
| MA_ES(2018) | 1 | 1 | 1 | 8 | 1 | 3 | 1 | 2 | 2 | 2 | 1 | 10 | 1 | 8 | 12 | 1 | 6 | 1 | 10 | 10 | 10 | 1 | 7 | 8 | 1 | 6 | 1 | 4 | 120 |
| IUDE(2018) | 1 | 1 | 6 | 6 | 1 | 8 | 4 | 2 | 8 | 2 | 6 | 4 | 1 | 1 | 3 | 4 | 3 | 6 | 7 | 8 | 3 | 1 | 1 | 1 | 5 | 1 | 5 | 7 | 106 |
| LSAHDE_IEpsilon(2018) | 1 | 1 | 7 | 1 | 1 | 7 | 3 | 2 | 2 | 2 | 9 | 5 | 9 | 3 | 5 | 7 | 5 | 2 | 3 | 2 | 7 | 9 | 4 | 5 | 7 | 2 | 2 | 12 | 125 |
| DeCODE | 1 | 1 | 1 | 6 | 1 | 5 | 7 | 2 | 8 | 2 | 12 | 1 | 1 | 1 | 3 | 5 | 4 | 12 | 9 | 4 | 3 | 1 | 10 | 4 | 4 | 7 | 12 | 5 | 132 |
| CMODE | 12 | 11 | 12 | 11 | 12 | 11 | 11 | 12 | 12 | 11 | 11 | 12 | 11 | 11 | 11 | 10 | 12 | 10 | 11 | 11 | 12 | 12 | 11 | 10 | 11 | 11 | 8 | 11 | 311 |
| PMODE | 11 | 12 | 11 | 12 | 11 | 12 | 12 | 11 | 11 | 12 | 10 | 11 | 12 | 12 | 10 | 11 | 11 | 8 | 12 | 12 | 11 | 11 | 12 | 11 | 10 | 12 | 6 | 8 | 305 |
| HECO-DE | 1 | 1 | 1 | 2 | 1 | 1 | 9 | 2 | 2 | 2 | 7 | 6 | 1 | 4 | 1 | 1 | 2 | 4 | 4 | 6 | 2 | 5 | 5 | 3 | 1 | 4 | 3 | 2 | 83 |
| HECO-PDE | 1 | 1 | 1 | 2 | 1 | 1 | 10 | 2 | 2 | 2 | 5 | 3 | 1 | 4 | 1 | 1 | 1 | 3 | 4 | 7 | 1 | 1 | 3 | 2 | 1 | 3 | 4 | 3 | 71 |
Regarding the test functions with , rank values based on mean values and median solution on the 28 test functions are reported in Table 7 and 8, respectively. As shown in Table 7, in terms of mean values with , HECO-DE and CMODE got total rank values, with and respectively. By contrast, HECO-PDE got the lowest rank value, with and PMODE got a slightly lower rank value than CMODE, with . As shown in Table 8, in terms of median solutions with , HECO-DE and CMODE got total rank values, with and respectively. By contrast, HECO-PDE got the lowest rank value, with while PMODE got a higher rank value than CMODE, with .
| Problem | 1 | 2 | 3 | 4 | 5 | 6 | 7 | 8 | 9 | 10 | 11 | 12 | 13 | 14 | 15 | 16 | 17 | 18 | 19 | 20 | 21 | 22 | 23 | 24 | 25 | 26 | 27 | 28 | Total |
| CAL_LSAHDE(2017) | 10 | 10 | 10 | 10 | 9 | 4 | 8 | 10 | 10 | 8 | 4 | 7 | 10 | 10 | 10 | 10 | 10 | 8 | 1 | 12 | 6 | 9 | 10 | 10 | 10 | 10 | 7 | 1 | 234 |
| LSHADE44+IDE(2017) | 9 | 1 | 9 | 5 | 1 | 10 | 5 | 9 | 7 | 10 | 1 | 4 | 7 | 9 | 7 | 8 | 8 | 7 | 4 | 4 | 9 | 5 | 8 | 9 | 9 | 8 | 10 | 9 | 192 |
| LSAHDE44(2017) | 1 | 1 | 8 | 3 | 1 | 9 | 4 | 1 | 3 | 1 | 2 | 9 | 6 | 8 | 8 | 9 | 7 | 6 | 3 | 1 | 10 | 6 | 6 | 8 | 8 | 7 | 6 | 8 | 150 |
| UDE(2017) | 1 | 1 | 5 | 9 | 10 | 3 | 2 | 8 | 1 | 9 | 5 | 6 | 9 | 6 | 6 | 6 | 9 | 11 | 9 | 7 | 3 | 8 | 5 | 6 | 6 | 9 | 11 | 5 | 176 |
| MA_ES(2018) | 1 | 1 | 1 | 8 | 1 | 1 | 1 | 2 | 8 | 1 | 3 | 10 | 8 | 7 | 9 | 1 | 6 | 1 | 10 | 9 | 8 | 4 | 7 | 7 | 1 | 5 | 1 | 4 | 126 |
| IUDE(2018) | 1 | 1 | 6 | 7 | 1 | 11 | 7 | 4 | 1 | 1 | 7 | 3 | 5 | 1 | 3 | 5 | 3 | 5 | 8 | 8 | 4 | 3 | 4 | 3 | 5 | 1 | 5 | 7 | 120 |
| LSAHDE_IEpsilon(2018) | 1 | 1 | 7 | 4 | 8 | 8 | 3 | 7 | 6 | 7 | 8 | 8 | 4 | 4 | 5 | 7 | 5 | 2 | 7 | 2 | 5 | 10 | 2 | 5 | 7 | 6 | 2 | 10 | 151 |
| DeCODE | 1 | 1 | 1 | 6 | 1 | 2 | 6 | 3 | 9 | 6 | 12 | 5 | 1 | 2 | 4 | 4 | 4 | 12 | 2 | 3 | 7 | 2 | 9 | 4 | 4 | 4 | 12 | 6 | 133 |
| CMODE | 12 | 12 | 11 | 11 | 11 | 12 | 12 | 12 | 11 | 12 | 11 | 11 | 12 | 12 | 12 | 11 | 12 | 9 | 12 | 10 | 11 | 11 | 11 | 11 | 11 | 11 | 9 | 11 | 314 |
| PMODE | 11 | 11 | 12 | 12 | 12 | 7 | 11 | 11 | 12 | 11 | 10 | 12 | 11 | 11 | 11 | 12 | 11 | 10 | 11 | 11 | 12 | 12 | 12 | 12 | 12 | 12 | 8 | 12 | 312 |
| HECO-DE | 1 | 1 | 1 | 1 | 1 | 6 | 9 | 6 | 3 | 5 | 9 | 1 | 3 | 5 | 1 | 1 | 2 | 3 | 4 | 5 | 1 | 7 | 3 | 2 | 1 | 3 | 3 | 2 | 90 |
| HECO-PDE | 1 | 1 | 1 | 1 | 1 | 5 | 10 | 5 | 3 | 4 | 6 | 2 | 2 | 3 | 1 | 1 | 1 | 4 | 4 | 6 | 2 | 1 | 1 | 1 | 1 | 2 | 4 | 3 | 77 |
| Problem | 1 | 2 | 3 | 4 | 5 | 6 | 7 | 8 | 9 | 10 | 11 | 12 | 13 | 14 | 15 | 16 | 17 | 18 | 19 | 20 | 21 | 22 | 23 | 24 | 25 | 26 | 27 | 28 | Total |
| CAL_LSAHDE(2017) | 1 | 1 | 10 | 10 | 1 | 6 | 8 | 10 | 7 | 8 | 4 | 7 | 10 | 6 | 12 | 10 | 10 | 9 | 1 | 3 | 7 | 9 | 6 | 10 | 10 | 10 | 7 | 1 | 194 |
| LSHADE44+IDE(2017) | 1 | 1 | 9 | 2 | 1 | 9 | 5 | 9 | 9 | 10 | 3 | 3 | 8 | 10 | 7 | 9 | 8 | 8 | 5 | 5 | 9 | 7 | 9 | 9 | 9 | 8 | 11 | 9 | 193 |
| LSAHDE44(2017) | 1 | 1 | 8 | 5 | 1 | 8 | 4 | 1 | 3 | 1 | 1 | 10 | 7 | 9 | 9 | 8 | 7 | 6 | 4 | 1 | 10 | 8 | 8 | 8 | 8 | 7 | 6 | 8 | 158 |
| UDE(2017) | 1 | 1 | 5 | 9 | 10 | 5 | 2 | 8 | 1 | 9 | 5 | 5 | 9 | 7 | 6 | 6 | 9 | 7 | 10 | 8 | 1 | 6 | 2 | 7 | 6 | 9 | 10 | 5 | 169 |
| MA_ES(2018) | 1 | 1 | 1 | 8 | 1 | 3 | 1 | 2 | 8 | 1 | 2 | 9 | 1 | 8 | 8 | 1 | 5 | 1 | 9 | 10 | 8 | 5 | 7 | 6 | 1 | 4 | 1 | 4 | 117 |
| IUDE(2018) | 1 | 1 | 6 | 7 | 1 | 10 | 7 | 3 | 1 | 1 | 6 | 4 | 1 | 3 | 1 | 5 | 1 | 5 | 2 | 9 | 4 | 4 | 2 | 1 | 4 | 2 | 5 | 7 | 104 |
| LSAHDE_IEpsilon(2018) | 1 | 1 | 7 | 1 | 1 | 7 | 3 | 7 | 3 | 7 | 8 | 8 | 6 | 1 | 5 | 7 | 6 | 2 | 8 | 2 | 5 | 10 | 5 | 5 | 7 | 6 | 2 | 10 | 141 |
| DeCODE | 1 | 1 | 1 | 6 | 1 | 4 | 6 | 6 | 10 | 6 | 12 | 5 | 1 | 3 | 4 | 4 | 4 | 12 | 3 | 4 | 6 | 3 | 10 | 4 | 4 | 5 | 12 | 6 | 144 |
| CMODE | 12 | 12 | 12 | 11 | 11 | 12 | 12 | 12 | 11 | 11 | 11 | 12 | 12 | 11 | 10 | 11 | 11 | 10 | 12 | 11 | 11 | 11 | 12 | 11 | 11 | 11 | 8 | 12 | 314 |
| PMODE | 11 | 11 | 11 | 12 | 12 | 11 | 11 | 11 | 12 | 12 | 10 | 11 | 11 | 12 | 11 | 12 | 12 | 11 | 11 | 12 | 12 | 12 | 11 | 12 | 12 | 12 | 9 | 11 | 318 |
| HECO-DE | 1 | 1 | 1 | 2 | 1 | 2 | 9 | 4 | 3 | 4 | 9 | 2 | 1 | 5 | 2 | 1 | 3 | 4 | 5 | 6 | 3 | 2 | 4 | 3 | 1 | 3 | 3 | 2 | 87 |
| HECO-PDE | 1 | 1 | 1 | 2 | 1 | 1 | 10 | 5 | 3 | 4 | 7 | 1 | 1 | 2 | 2 | 1 | 2 | 3 | 5 | 7 | 2 | 1 | 1 | 2 | 1 | 1 | 4 | 3 | 75 |
Regarding the test functions with , rank values based on mean values and median solution on the 28 test functions are reported in Table 9 and 10, respectively. As shown in Table 9, in terms of mean values with , HECO-DE got highest total rank value with and CMODE got respectively. By contrast, HECO-PDE got higher rank value than HECO-DE with while PMODE got a lower rank value than CMODE, with . As shown in Table 10, in terms of median solutions with , HECO-DE and CMODE got total rank values, with and respectively. By contrast, HECO-PDE got the lowest rank value with , while PMODE got a higher rank value than CMODE with .
According to the CEC 2018 competition rules, the ranks of HECO-PDE and HECO-DE are on the top two on each dimension but CMODE and PMODE on the bottom two. This result confirms our guess that MOEAs based on non-dominance, such as PMODE and CMODE, may not perform as good as decomposition-based MOEAs, such as HECO-PDE and HECO-DE for solving COPs.
| Problem | 1 | 2 | 3 | 4 | 5 | 6 | 7 | 8 | 9 | 10 | 11 | 12 | 13 | 14 | 15 | 16 | 17 | 18 | 19 | 20 | 21 | 22 | 23 | 24 | 25 | 26 | 27 | 28 | Total |
| CAL_LSAHDE(2017) | 9 | 9 | 11 | 10 | 6 | 3 | 9 | 10 | 8 | 9 | 5 | 5 | 9 | 10 | 10 | 10 | 10 | 11 | 1 | 12 | 10 | 7 | 10 | 10 | 10 | 10 | 9 | 1 | 234 |
| LSHADE44+IDE(2017) | 10 | 10 | 8 | 4 | 4 | 11 | 4 | 6 | 2 | 7 | 1 | 1 | 6 | 9 | 5 | 8 | 8 | 7 | 3 | 4 | 5 | 6 | 6 | 7 | 9 | 8 | 10 | 7 | 176 |
| LSAHDE44(2017) | 1 | 1 | 7 | 3 | 3 | 10 | 5 | 1 | 1 | 1 | 4 | 10 | 7 | 8 | 8 | 9 | 6 | 6 | 2 | 3 | 9 | 5 | 8 | 6 | 8 | 6 | 6 | 9 | 153 |
| UDE(2017) | 8 | 8 | 5 | 9 | 10 | 4 | 2 | 9 | 10 | 8 | 6 | 2 | 10 | 5 | 7 | 5 | 9 | 8 | 9 | 8 | 4 | 10 | 2 | 8 | 5 | 9 | 11 | 5 | 196 |
| MA_ES(2018) | 1 | 1 | 1 | 7 | 9 | 1 | 1 | 2 | 9 | 4 | 2 | 8 | 4 | 7 | 9 | 1 | 5 | 1 | 10 | 9 | 8 | 2 | 7 | 4 | 1 | 5 | 3 | 4 | 126 |
| IUDE(2018) | 1 | 1 | 9 | 8 | 5 | 12 | 7 | 3 | 6 | 5 | 3 | 3 | 8 | 1 | 4 | 6 | 3 | 5 | 8 | 7 | 2 | 8 | 5 | 5 | 6 | 3 | 5 | 8 | 147 |
| LSAHDE_IEpsilon(2018) | 7 | 7 | 6 | 5 | 8 | 9 | 3 | 7 | 7 | 6 | 8 | 4 | 5 | 4 | 6 | 7 | 7 | 2 | 6 | 2 | 3 | 9 | 4 | 9 | 7 | 7 | 4 | 10 | 169 |
| DeCODE | 1 | 1 | 1 | 6 | 7 | 2 | 6 | 8 | 3 | 10 | 10 | 6 | 3 | 6 | 3 | 4 | 4 | 12 | 7 | 1 | 1 | 1 | 9 | 3 | 4 | 4 | 12 | 6 | 141 |
| CMODE | 12 | 12 | 10 | 12 | 12 | 8 | 12 | 11 | 12 | 12 | 11 | 11 | 12 | 11 | 12 | 12 | 11 | 10 | 12 | 11 | 12 | 12 | 11 | 11 | 12 | 12 | 8 | 11 | 315 |
| PMODE | 11 | 11 | 12 | 11 | 11 | 6 | 11 | 12 | 11 | 11 | 12 | 12 | 11 | 12 | 11 | 11 | 12 | 9 | 11 | 10 | 11 | 11 | 12 | 12 | 11 | 11 | 7 | 12 | 305 |
| HECO-DE | 1 | 1 | 1 | 1 | 1 | 7 | 8 | 4 | 3 | 2 | 9 | 7 | 1 | 3 | 1 | 1 | 1 | 3 | 3 | 5 | 7 | 3 | 3 | 2 | 3 | 2 | 2 | 2 | 87 |
| HECO-PDE | 1 | 1 | 1 | 2 | 1 | 5 | 10 | 5 | 3 | 3 | 7 | 9 | 2 | 2 | 1 | 1 | 2 | 4 | 3 | 6 | 6 | 4 | 1 | 1 | 2 | 1 | 1 | 3 | 88 |
| Problem | 1 | 2 | 3 | 4 | 5 | 6 | 7 | 8 | 9 | 10 | 11 | 12 | 13 | 14 | 15 | 16 | 17 | 18 | 19 | 20 | 21 | 22 | 23 | 24 | 25 | 26 | 27 | 28 | Total |
| CAL_LSAHDE(2017) | 9 | 9 | 10 | 10 | 7 | 5 | 9 | 10 | 6 | 9 | 5 | 4 | 9 | 1 | 10 | 10 | 10 | 9 | 1 | 1 | 3 | 7 | 6 | 10 | 10 | 10 | 10 | 1 | 201 |
| LSHADE44+IDE(2017) | 10 | 10 | 9 | 1 | 3 | 9 | 5 | 6 | 2 | 8 | 4 | 2 | 6 | 10 | 6 | 8 | 7 | 6 | 3 | 5 | 7 | 5 | 7 | 8 | 9 | 7 | 6 | 8 | 177 |
| LSAHDE44(2017) | 1 | 1 | 8 | 4 | 4 | 8 | 6 | 1 | 1 | 1 | 2 | 10 | 7 | 9 | 9 | 9 | 5 | 7 | 2 | 4 | 8 | 4 | 9 | 9 | 8 | 4 | 7 | 9 | 157 |
| UDE(2017) | 8 | 8 | 5 | 9 | 10 | 4 | 2 | 9 | 8 | 10 | 6 | 1 | 10 | 6 | 8 | 5 | 9 | 8 | 9 | 9 | 5 | 10 | 3 | 6 | 5 | 8 | 8 | 5 | 194 |
| MA_ES(2018) | 1 | 1 | 1 | 7 | 9 | 2 | 1 | 2 | 10 | 5 | 1 | 6 | 4 | 8 | 4 | 1 | 4 | 1 | 10 | 10 | 6 | 3 | 8 | 4 | 1 | 5 | 1 | 4 | 120 |
| IUDE(2018) | 1 | 1 | 7 | 8 | 5 | 10 | 4 | 3 | 9 | 4 | 3 | 3 | 8 | 2 | 7 | 6 | 3 | 5 | 7 | 8 | 2 | 8 | 5 | 5 | 6 | 3 | 5 | 7 | 145 |
| LSAHDE_IEpsilon(2018) | 7 | 7 | 6 | 5 | 8 | 6 | 3 | 7 | 7 | 6 | 8 | 5 | 5 | 5 | 4 | 7 | 6 | 2 | 6 | 3 | 4 | 9 | 4 | 7 | 7 | 6 | 4 | 10 | 164 |
| DeCODE | 1 | 1 | 1 | 6 | 6 | 3 | 7 | 8 | 3 | 7 | 12 | 7 | 3 | 7 | 3 | 4 | 8 | 12 | 8 | 2 | 1 | 1 | 10 | 3 | 4 | 9 | 12 | 6 | 155 |
| CMODE | 12 | 12 | 11 | 12 | 11 | 11 | 12 | 11 | 12 | 12 | 10 | 11 | 11 | 11 | 11 | 12 | 11 | 10 | 11 | 11 | 12 | 12 | 11 | 11 | 11 | 12 | 11 | 11 | 316 |
| PMODE | 11 | 11 | 12 | 11 | 12 | 12 | 11 | 12 | 11 | 11 | 11 | 12 | 12 | 12 | 12 | 11 | 12 | 11 | 12 | 12 | 11 | 11 | 12 | 12 | 12 | 11 | 9 | 12 | 321 |
| HECO-DE | 1 | 1 | 1 | 3 | 1 | 7 | 8 | 4 | 3 | 2 | 9 | 9 | 2 | 4 | 1 | 1 | 1 | 3 | 3 | 6 | 10 | 2 | 2 | 2 | 3 | 2 | 3 | 2 | 96 |
| HECO-PDE | 1 | 1 | 1 | 1 | 1 | 1 | 10 | 5 | 3 | 3 | 7 | 8 | 1 | 3 | 1 | 1 | 2 | 4 | 3 | 7 | 9 | 6 | 1 | 1 | 2 | 1 | 2 | 3 | 89 |
7 Conclusions
From an experimental observation, we find that given a valley landscape, the maximal variance direction in a population can be regarded as the valley direction. Based on this finding, a new search operator, called PCA-projection, is proposed, in which PCA is used to project points along the maximal variance direction. PCA-projection can be easily added into an existing MOEA through a mixed strategy. We design two MOEAs enhanced with PCA-projection, called HECO-PDE and PMODE, for evaluating the effectiveness of this new operator. Experimental results show that an EA enhanced with PCA-projection performs better than its corresponding opponent without this operator. Furthermore, HECO-PDE is ranked first on all dimensions when compared with the state-of-art single-objective EAs from the IEEE CEC 2018 competition and another recent MOEA (DeCODE) for constrained optimisation. This study also reveals that decomposition-based MOEAs, such as HECO-PDE and HECO-DE, are competitive with best single-objective and multi-objective EAs in constrained optimisation, but MOEAs based on non-dominance, such as PMODE and CMODE, may not perform so well. For the future work, PCA-projection can be applied to other EAs.
References
References
- [1] Z. Michalewicz, M. Schoenauer, Evolutionary algorithms for constrained parameter optimization problems, Evolutionary computation 4 (1) (1996) 1–32.
- [2] C. A. Coello Coello, Theoretical and numerical constraint-handling techniques used with evolutionary algorithms: A survey of the state of the art, Computer Methods in Applied Mechanics and Engineering 191 (11-12) (2002) 1245–1287.
- [3] E. Mezura-Montes, C. A. Coello Coello, Constraint-handling in nature-inspired numerical optimization: past, present and future, Swarm and Evolutionary Computation 1 (4) (2011) 173–194.
- [4] C. Segura, C. A. C. Coello, G. Miranda, C. León, Using multi-objective evolutionary algorithms for single-objective constrained and unconstrained optimization, Annals of Operations Research 240 (1) (2016) 217–250.
- [5] P. D. Surry, N. J. Radcliffe, The COMOGA method: constrained optimisation by multi-objective genetic algorithms, Control and Cybernetics 26 (1997) 391–412.
- [6] Y. Zhou, Y. Li, J. He, L. Kang, Multi-objective and MGG evolutionary algorithm for constrained optimisation, in: Proceedings of 2003 IEEE Congress on Evolutionary Computation, IEEE Press, Canberra, Australia, 2003, pp. 1–5.
- [7] J. He, T. Chen, X. Yao, On the easiest and hardest fitness functions, IEEE Transactions on Evolutionary Computation 19 (2) (2015) 295–305.
- [8] C. Munteanu, V. Lazarescu, Improving mutation capabilities in a real-coded genetic algorithm, in: Workshops on Applications of Evolutionary Computation, Springer, 1999, pp. 138–149.
- [9] Y.-l. Li, J. Zhang, W.-n. Chen, Differential evolution algorithm with pca-based crossover, in: Proceedings of the 14th annual conference companion on Genetic and evolutionary computation, ACM, 2012, pp. 1509–1510.
- [10] W. Chu, X. Gao, S. Sorooshian, Fortify particle swam optimizer (pso) with principal components analysis: A case study in improving bound-handling for optimizing high-dimensional and complex problems, in: 2011 IEEE Congress of Evolutionary Computation (CEC), IEEE, 2011, pp. 1644–1648.
- [11] X. Zhao, W. Lin, Q. Zhang, Enhanced particle swarm optimization based on principal component analysis and line search, Applied Mathematics and Computation 229 (2014) 440–456.
- [12] B. T. Ong, M. Fukushima, Automatically terminated particle swarm optimization with principal component analysis, International Journal of Information Technology & Decision Making 14 (01) (2015) 171–194.
- [13] G. Xu, X. Zhao, R. Li, Cooperative co-evolution with principal component analysis for large scale optimization, in: International Conference on Bio-Inspired Computing: Theories and Applications, Springer, 2018, pp. 426–434.
- [14] Z. Cui, F. Li, W. Zhang, Bat algorithm with principal component analysis, International Journal of Machine Learning and Cybernetics (2018) 1–20.
- [15] Q. Zhang, A. Zhou, Y. Jin, RM-MEDA: A regularity model-based multiobjective estimation of distribution algorithm, IEEE Transactions on Evolutionary Computation 12 (1) (2008) 41–63.
- [16] Y. Wang, J. Xiang, Z. Cai, A regularity model-based multiobjective estimation of distribution algorithm with reducing redundant cluster operator, Applied Soft Computing 12 (11) (2012) 3526–3538.
-
[17]
P. N. Suganthan,
The CEC 2017 competition on constrained real-parameter
optimization (2017).
URL http://web.mysites.ntu.edu.sg/epnsugan/PublicSite/SharedDocuments/CEC-2017 -
[18]
P. N. Suganthan, The CEC 2018 competition on constrained real-parameter
optimization (2018).
URL http://web.mysites.ntu.edu.sg/epnsugan/PublicSite/SharedDocuments/CEC-2018 - [19] C. A. Coello Coello, Constraint-handling using an evolutionary multiobjective optimization technique, Civil Engineering Systems 17 (4) (2000) 319–346.
- [20] S. Venkatraman, G. G. Yen, A generic framework for constrained optimization using genetic algorithms, IEEE Transactions on Evolutionary Computation 9 (4) (2005) 424–435.
- [21] Z. Cai, Y. Wang, A multiobjective optimization-based evolutionary algorithm for constrained optimization, IEEE Transactions on Evolutionary Computation 10 (6) (2006) 658–675.
- [22] Y. Wang, Z. Cai, Combining multiobjective optimization with differential evolution to solve constrained optimization problems, IEEE Transactions on Evolutionary Computation 16 (1) (2012) 117–134.
- [23] Y. Wang, Z. Cai, A dynamic hybrid framework for constrained evolutionary optimization, IEEE Transactions on Systems, Man, and Cybernetics, Part B: Cybernetics 42 (1) (2012) 203–217.
- [24] W.-F. Gao, G. G. Yen, S.-Y. Liu, A dual-population differential evolution with coevolution for constrained optimization, IEEE Transactions on Cybernetics 45 (5) (2015) 1094–1107.
- [25] L. Gao, Y. Zhou, X. Li, Q. Pan, W. Yi, Multi-objective optimization based reverse strategy with differential evolution algorithm for constrained optimization problems, Expert Systems with Applications 42 (14) (2015) 5976–5987.
- [26] X. Li, S. Zeng, C. Li, J. Ma, Many-objective optimization with dynamic constraint handling for constrained optimization problems, Soft Computing 21 (24) (2017) 7435–7445.
- [27] S. Zeng, R. Jiao, C. Li, X. Li, J. S. Alkasassbeh, A general framework of dynamic constrained multiobjective evolutionary algorithms for constrained optimization, IEEE transactions on Cybernetics 47 (9) (2017) 2678–2688.
- [28] T. Xu, J. He, C. Shang, W. Ying, A new multi-objective model for constrained optimisation, in: P. Angelov, A. Gegov, C. Jayne, Q. Shen (Eds.), Advances in Computational Intelligence Systems: the 16th UK Workshop on Computational Intelligence, Springer, 2017, pp. 71–85.
- [29] B.-C. Wang, H.-X. Li, Q. Zhang, Y. Wang, Decomposition-based multiobjective optimization for constrained evolutionary optimization, IEEE Transactions on Systems, Man, and Cybernetics: Systems.
- [30] C. Peng, H.-L. Liu, F. Gu, A novel constraint-handling technique based on dynamic weights for constrained optimization problems, Soft Computing 22 (12) (2018) 3919–3935.
- [31] R. Storn, K. Price, Differential evolution–a simple and efficient heuristic for global optimization over continuous spaces, Journal of global optimization 11 (4) (1997) 341–359.
- [32] R. Storn, System design by constraint adaptation and differential evolution, IEEE Transactions on Evolutionary Computation 3 (1) (1999) 22–34.
- [33] R. Poláková, L-shade with competing strategies applied to constrained optimization, in: Evolutionary Computation (CEC), 2017 IEEE Congress on, IEEE, 2017, pp. 1683–1689.
- [34] J. Tvrdık, Competitive differential evolution, in: MENDEL, 2006, pp. 7–12.
- [35] J. Tvrdík, Adaptation in differential evolution: A numerical comparison, Applied Soft Computing 9 (3) (2009) 1149–1155.
- [36] J. Zhang, A. C. Sanderson, Jade: adaptive differential evolution with optional external archive, IEEE Transactions on evolutionary computation 13 (5) (2009) 945–958.
- [37] P. Kaelo, M. Ali, A numerical study of some modified differential evolution algorithms, European journal of operational research 169 (3) (2006) 1176–1184.
- [38] A. Zamuda, Adaptive constraint handling and success history differential evolution for cec 2017 constrained real-parameter optimization, in: Evolutionary Computation (CEC), 2017 IEEE Congress on, IEEE, 2017, pp. 2443–2450.
- [39] J. Tvrdík, R. Poláková, A simple framework for constrained problems with application of l-shade44 and ide, in: Evolutionary Computation (CEC), 2017 IEEE Congress on, IEEE, 2017, pp. 1436–1443.
- [40] A. Trivedi, K. Sanyal, P. Verma, D. Srinivasan, A unified differential evolution algorithm for constrained optimization problems, in: Evolutionary Computation (CEC), 2017 IEEE Congress on, IEEE, 2017, pp. 1231–1238.
- [41] M. Hellwig, H.-G. Beyer, A matrix adaptation evolution strategy for constrained real-parameter optimization, in: 2018 IEEE Congress on Evolutionary Computation (CEC), IEEE, 2018, pp. 1–8.
- [42] A. Trived, D. Srinivasan, N. Biswas, An improved unified differential evolution algorithm for constrained optimization problems, in: 2018 IEEE Congress on Evolutionary Computation (CEC), IEEE, 2018, pp. 1–10.
- [43] Z. Fan, Y. Fang, W. Li, Y. Yuan, Z. Wang, X. Bian, Lshade44 with an improved constraint-handling method for solving constrained single-objective optimization problems, in: 2018 IEEE Congress on Evolutionary Computation (CEC), IEEE, 2018, pp. 1–8.
8 Supplement
This supplement provides detailed experimental results of PMODE and HECO-PDE. 25 independent runs of PMODE and HECO-PDE are taken on each problem and dimension respectively. The maximum function evaluations is set to , where is the dimension of an optimization problem.
8.1 Detailed Experimental results of PMODE
Tables 1114 gives the experimental results of PMODE in terms of the best, median, worst, mean, standard deviation and feasibility rate of the function values , , and . is the number of violated constraints at the median solution: the sequence of three numbers indicate the number of violations (including inequality and equality) by more than 1.0, in the range and in the range respectively. denotes the mean value of the violations of all constraints at the median solution. SR is the feasibility rate of the solutions obtained in 25 runs. denotes the mean constraint violation value of all the solutions of 25 runs.
| problem | C01 | C02 | C03 | C04 | C05 | C06 | C07 |
| best | 2.14611e-24 | 9.11866e-25 | 9.41726e+03 | 3.88033e+01 | 9.91336e-22 | 7.39402e+01 | -1.60857e+02 |
| median | 5.68959e-24 | 4.44967e-24 | 1.71079e+04 | 8.32015e+01 | 3.52520e-20 | 1.78727e+02 | -7.46900e+01 |
| c | 0 0 0 | 0 0 0 | 0 1 0 | 0 0 0 | 0 0 0 | 2 3 0 | 2 0 0 |
| 0.00000e+00 | 0.00000e+00 | 1.16861e-02 | 0.00000e+00 | 0.00000e+00 | 5.24831e-01 | 7.57086e+01 | |
| Mean | 8.63981e-24 | 6.48690e-24 | 5.94558e+04 | 8.13511e+01 | 6.08489e-20 | 2.16101e+02 | -5.61896e+01 |
| Worst | 3.43159e-23 | 1.80413e-23 | 4.46449e+04 | 1.02793e+02 | 2.59659e-19 | 1.35417e+03 | -9.13489e+01 |
| std | 7.75626e-24 | 4.92035e-24 | 8.34239e+04 | 1.39084e+01 | 6.96775e-20 | 2.51834e+02 | 5.98942e+01 |
| SR | 100 | 100 | 4 | 100 | 100 | 16 | 4 |
| 0.00000e+00 | 0.00000e+00 | 1.65910e-02 | 0.00000e+00 | 0.00000e+00 | 5.21616e-01 | 7.85737e+01 | |
| problem | C08 | C09 | C10 | C11 | C12 | C13 | C14 |
| best | -1.34840e-03 | -4.97525e-03 | -5.09646e-04 | -1.62228e+02 | 3.98790e+00 | 5.15504e-21 | 2.39559e+00 |
| median | -1.34840e-03 | -4.97525e-03 | -5.09645e-04 | -3.70137e+02 | 3.98863e+00 | 6.58037e-20 | 3.39761e+00 |
| c | 0 0 0 | 0 0 0 | 0 0 0 | 1 0 0 | 0 0 0 | 0 0 0 | 0 0 0 |
| 0.00000e+00 | 0.00000e+00 | 0.00000e+00 | 2.40353e+02 | 0.00000e+00 | 0.00000e+00 | 4.58844e-06 | |
| Mean | -1.34840e-03 | -4.97525e-03 | -5.09645e-04 | -3.55967e+02 | 4.83886e+00 | 1.59463e-01 | 3.45367e+00 |
| Worst | -1.34840e-03 | -4.97525e-03 | -5.09637e-04 | -5.43096e+02 | 1.46065e+01 | 3.98658e+00 | 3.67062e+00 |
| std | 3.25752e-10 | 0.00000e+00 | 2.05524e-09 | 9.43249e+01 | 2.87977e+00 | 7.81207e-01 | 3.43063e-01 |
| SR | 100 | 100 | 100 | 0 | 100 | 100 | 48 |
| 0.00000e+00 | 0.00000e+00 | 0.00000e+00 | 2.37912e+02 | 0.00000e+00 | 0.00000e+00 | 5.32261e-05 | |
| problem | C15 | C16 | C17 | C18 | C19 | C20 | C21 |
| best | 5.49772e+00 | 5.18363e+01 | 9.97584e-01 | 1.00000e+01 | 0.00000e+00 | 1.47930e+00 | 3.98790e+00 |
| median | 1.17811e+01 | 5.65481e+01 | 9.14289e-01 | 3.62209e+01 | 0.00000e+00 | 1.81463e+00 | 3.98881e+00 |
| c | 0 0 1 | 0 0 1 | 1 1 0 | 0 1 0 | 1 0 0 | 0 0 0 | 0 0 0 |
| 5.51058e-05 | 1.46131e-04 | 5.50540e+00 | 1.29979e-01 | 6.63359e+03 | 0.00000e+00 | 0.00000e+00 | |
| Mean | 1.21578e+01 | 6.15751e+01 | 9.80767e-01 | 4.10083e+01 | 0.00000e+00 | 1.81955e+00 | 5.46111e+00 |
| Worst | 8.63678e+00 | 5.65464e+01 | 1.00244e+00 | 5.17217e+01 | 0.00000e+00 | 2.17692e+00 | 2.27853e+01 |
| std | 3.90569e+00 | 8.31210e+00 | 5.62635e-02 | 1.44737e+01 | 0.00000e+00 | 1.76447e-01 | 4.99452e+00 |
| SR | 40 | 12 | 0 | 4 | 0 | 100 | 100 |
| 3.24071e-04 | 1.99125e-04 | 5.50824e+00 | 2.93346e+00 | 6.63359e+03 | 0.00000e+00 | 0.00000e+00 | |
| problem | C22 | C23 | C24 | C25 | C26 | C27 | C28 |
| best | 4.75166e-21 | 2.40531e+00 | 5.49772e+00 | 5.65486e+01 | 1.51776e-01 | 6.28153e+01 | 0.00000e+00 |
| median | 1.04790e-19 | 3.81500e+00 | 1.49229e+01 | 4.39817e+01 | 1.00954e+00 | 1.37228e+01 | 0.00000e+00 |
| c | 0 0 0 | 0 0 0 | 0 0 1 | 0 0 1 | 1 0 1 | 0 2 0 | 1 0 0 |
| 0.00000e+00 | 0.00000e+00 | 2.11608e-04 | 1.46534e-04 | 5.50411e+00 | 2.76359e-01 | 6.63359e+03 | |
| Mean | 2.88192e-19 | 3.29617e+00 | 1.37914e+01 | 6.26432e+01 | 9.08549e-01 | 2.33382e+01 | 1.62221e+00 |
| Worst | 2.27974e-18 | 3.31445e+00 | 1.49199e+01 | 7.53947e+01 | 1.00543e+00 | 2.82342e+00 | 6.37173e+00 |
| std | 5.20942e-19 | 4.03648e-01 | 3.65075e+00 | 1.19573e+01 | 2.12119e-01 | 2.20528e+01 | 2.92278e+00 |
| SR | 100 | 52 | 20 | 4 | 0 | 0 | 0 |
| 0.00000e+00 | 6.82870e-05 | 4.23089e-04 | 2.31590e-04 | 5.46639e+00 | 2.48248e-01 | 6.63622e+03 |
| problem | C01 | C02 | C03 | C04 | C05 | C06 | C07 |
| best | 8.45246e+00 | 1.31645e+00 | 1.21533e+05 | 1.62387e+02 | 2.37034e+01 | 8.68151e+02 | -7.78047e+01 |
| median | 6.22106e+01 | 6.14986e+01 | 4.46899e+05 | 3.66171e+02 | 1.22896e+02 | 2.23162e+03 | -1.15271e+02 |
| c | 0 0 0 | 0 0 0 | 0 1 0 | 0 0 0 | 0 0 0 | 4 1 0 | 2 0 0 |
| 0.00000e+00 | 0.00000e+00 | 1.56053e-02 | 0.00000e+00 | 0.00000e+00 | 3.04630e+00 | 1.40266e+03 | |
| Mean | 1.01581e+02 | 8.79346e+01 | 5.24967e+05 | 3.25711e+02 | 1.76987e+02 | 2.75522e+03 | -6.32051e+01 |
| Worst | 3.13217e+02 | 5.79893e+02 | 2.19709e+05 | 3.91920e+02 | 8.55390e+02 | 1.96412e+03 | -1.85538e+02 |
| std | 8.75557e+01 | 1.15326e+02 | 4.36345e+05 | 7.78934e+01 | 1.76071e+02 | 1.34597e+03 | 8.25769e+01 |
| SR | 100 | 100 | 8 | 100 | 100 | 0 | 0 |
| 0.00000e+00 | 0.00000e+00 | 2.97523e-02 | 0.00000e+00 | 0.00000e+00 | 3.07096e+00 | 1.37837e+03 | |
| problem | C08 | C09 | C10 | C11 | C12 | C13 | C14 |
| best | 4.30883e+00 | -2.66551e-03 | 2.93934e+00 | -1.95483e+03 | 2.58898e+02 | 7.91928e+05 | 1.16005e+01 |
| median | 8.11294e+00 | 1.04331e+00 | 1.12307e+00 | -2.39334e+03 | 8.71198e+02 | 4.03949e+06 | 1.73876e+01 |
| c | 2 0 0 | 0 0 0 | 2 0 0 | 1 0 0 | 1 0 0 | 1 0 0 | 2 0 0 |
| 2.27078e+02 | 0.00000e+00 | 9.07387e+04 | 6.74605e+02 | 3.93445e+02 | 2.83340e+02 | 2.44359e+03 | |
| Mean | 9.09124e+00 | 1.22155e+00 | 5.79186e+00 | -1.58495e+03 | 9.71512e+02 | 1.01176e+07 | 1.69531e+01 |
| Worst | 1.59694e+01 | 5.12011e+00 | 8.62571e+00 | -1.61106e+03 | 3.21002e+03 | 6.20270e+07 | 1.95298e+01 |
| std | 3.15098e+00 | 1.49632e+00 | 3.96077e+00 | 5.24220e+02 | 5.76453e+02 | 1.34472e+07 | 1.88152e+00 |
| SR | 0 | 60 | 0 | 0 | 0 | 0 | 0 |
| 2.63526e+02 | 4.79756e-02 | 1.04036e+05 | 8.29760e+02 | 4.46996e+02 | 3.57934e+02 | 2.53791e+03 | |
| problem | C15 | C16 | C17 | C18 | C19 | C20 | C21 |
| best | 1.17809e+01 | 2.01062e+02 | 1.02982e+00 | 2.55074e+02 | 4.15257e+01 | 8.22588e+00 | 2.89044e+02 |
| median | 1.49226e+01 | 2.08916e+02 | 1.15328e+00 | 8.36250e+02 | 4.02094e+01 | 9.25366e+00 | 7.53484e+02 |
| c | 0 0 0 | 0 0 1 | 2 0 0 | 1 0 0 | 1 0 0 | 0 0 0 | 1 0 0 |
| 9.70150e-06 | 7.20124e-05 | 2.62061e+02 | 4.75943e+05 | 2.14626e+04 | 0.00000e+00 | 3.14773e+02 | |
| Mean | 1.81898e+01 | 2.11052e+02 | 1.17571e+00 | 9.55141e+02 | 5.60410e+01 | 9.23266e+00 | 7.69190e+02 |
| Worst | 2.12045e+01 | 2.01059e+02 | 1.45716e+00 | 2.05000e+03 | 8.07226e+01 | 1.00181e+01 | 1.32907e+03 |
| std | 2.73591e+00 | 1.23599e+01 | 1.00234e-01 | 4.97848e+02 | 1.26095e+01 | 4.38197e-01 | 2.77606e+02 |
| SR | 48 | 16 | 0 | 0 | 0 | 100 | 0 |
| 1.84991e-04 | 1.85297e-04 | 3.06938e+02 | 9.84241e+05 | 2.14638e+04 | 0.00000e+00 | 3.45572e+02 | |
| problem | C22 | C23 | C24 | C25 | C26 | C27 | C28 |
| best | 2.62086e+06 | 1.90652e+01 | 1.49225e+01 | 1.90066e+02 | 1.21225e+00 | 9.75533e+02 | 6.22618e+01 |
| median | 2.21334e+07 | 2.03930e+01 | 1.80597e+01 | 2.01061e+02 | 1.59385e+00 | 5.32941e+03 | 7.70427e+01 |
| c | 2 0 0 | 2 0 0 | 0 0 1 | 0 0 1 | 2 0 0 | 1 0 0 | 1 0 0 |
| 6.24786e+02 | 1.24452e+04 | 3.08672e-03 | 1.07590e-04 | 1.14320e+03 | 4.62537e+05 | 2.14813e+04 | |
| Mean | 4.79527e+07 | 2.04905e+01 | 1.89402e+01 | 2.36413e+02 | 1.65233e+00 | 3.53610e+03 | 9.64144e+01 |
| Worst | 3.09761e+08 | 2.13998e+01 | 2.61751e+01 | 3.56724e+02 | 2.35945e+00 | 7.53113e+03 | 1.69217e+02 |
| std | 6.33025e+07 | 7.08163e-01 | 2.51595e+00 | 3.83776e+01 | 3.21242e-01 | 1.96683e+03 | 2.58908e+01 |
| SR | 0 | 0 | 36 | 28 | 0 | 0 | 0 |
| 7.67227e+02 | 1.37688e+04 | 1.47415e+02 | 2.75679e+02 | 1.26016e+03 | 9.43760e+05 | 2.14813e+04 |
| problem | C01 | C02 | C03 | C04 | C05 | C06 | C07 |
| best | 2.28064e+03 | 1.98396e+03 | 1.93920e+05 | 3.55349e+02 | 5.97421e+03 | 1.75834e+03 | -5.36955e+02 |
| median | 4.52311e+03 | 3.66519e+03 | 8.18781e+06 | 4.77077e+02 | 1.92933e+04 | 8.24012e+03 | -1.18883e+02 |
| c | 0 0 0 | 0 0 0 | 0 1 0 | 0 0 0 | 0 0 0 | 3 1 0 | 2 0 0 |
| 0.00000e+00 | 0.00000e+00 | 2.11433e-02 | 0.00000e+00 | 0.00000e+00 | 3.67257e+00 | 2.89321e+03 | |
| Mean | 4.57826e+03 | 3.86686e+03 | 2.56010e+06 | 5.28980e+02 | 2.07483e+04 | 5.21220e+03 | -1.52570e+02 |
| Worst | 6.58848e+03 | 5.80477e+03 | 1.80087e+06 | 6.71820e+02 | 6.05995e+04 | 4.84112e+03 | -2.33206e+02 |
| std | 9.65902e+02 | 9.24684e+02 | 3.45818e+06 | 1.19169e+02 | 1.16951e+04 | 2.34983e+03 | 1.35106e+02 |
| SR | 100 | 100 | 8 | 100 | 100 | 16 | 0 |
| 0.00000e+00 | 0.00000e+00 | 4.21099e-02 | 0.00000e+00 | 0.00000e+00 | 3.45598e+00 | 2.82329e+03 | |
| problem | C08 | C09 | C10 | C11 | C12 | C13 | C14 |
| best | 1.02717e+01 | 5.74202e+00 | 1.74030e+01 | -1.47463e+03 | 3.75936e+03 | 4.56714e+07 | 1.83443e+01 |
| median | 1.47237e+01 | 6.01563e+00 | 2.35321e+01 | -1.04457e+03 | 6.65909e+03 | 1.81715e+08 | 1.96039e+01 |
| c | 2 0 0 | 1 0 0 | 2 0 0 | 1 0 0 | 1 0 0 | 2 0 0 | 2 0 0 |
| 1.36576e+03 | 1.25530e+02 | 2.42791e+06 | 4.02216e+03 | 3.25068e+03 | 2.07518e+03 | 1.03922e+04 | |
| Mean | 1.67054e+01 | 7.26445e+00 | 1.77968e+01 | -1.28194e+03 | 7.21543e+03 | 1.91988e+08 | 1.96436e+01 |
| Worst | 2.12763e+01 | 9.49550e+00 | 1.47180e+01 | -9.95573e+02 | 1.61630e+04 | 6.34024e+08 | 2.09103e+01 |
| std | 3.86802e+00 | 1.35384e+00 | 5.56564e+00 | 3.36372e+02 | 2.58950e+03 | 1.28596e+08 | 6.79060e-01 |
| SR | 0 | 0 | 0 | 0 | 0 | 0 | 0 |
| 1.34029e+03 | 2.09972e+02 | 2.50252e+06 | 4.14513e+03 | 3.50114e+03 | 2.07567e+03 | 1.00248e+04 | |
| problem | C15 | C16 | C17 | C18 | C19 | C20 | C21 |
| best | 1.80641e+01 | 4.08407e+02 | 1.81562e+00 | 4.67375e+03 | 1.25353e+02 | 1.62035e+01 | 3.46898e+03 |
| median | 2.23511e+01 | 4.03140e+02 | 2.69752e+00 | 1.04115e+04 | 1.35750e+02 | 1.75255e+01 | 7.01829e+03 |
| c | 2 0 0 | 1 1 0 | 2 0 0 | 2 0 0 | 1 0 0 | 0 0 0 | 1 0 0 |
| 7.95359e+02 | 5.63050e+02 | 3.32053e+03 | 5.38874e+07 | 3.63004e+04 | 0.00000e+00 | 3.40038e+03 | |
| Mean | 2.41366e+01 | 4.36228e+02 | 2.61806e+00 | 8.17305e+03 | 1.28788e+02 | 1.74999e+01 | 6.90454e+03 |
| Worst | 2.81105e+01 | 6.32413e+02 | 3.56693e+00 | 9.97025e+03 | 1.40672e+02 | 1.87708e+01 | 1.08995e+04 |
| std | 5.05616e+00 | 6.03201e+01 | 3.83810e-01 | 2.02373e+03 | 1.62059e+01 | 5.63727e-01 | 1.86784e+03 |
| SR | 8 | 4 | 0 | 0 | 0 | 100 | 0 |
| 9.94883e+02 | 8.85680e+02 | 3.16162e+03 | 5.42517e+07 | 3.62998e+04 | 0.00000e+00 | 3.34437e+03 | |
| problem | C22 | C23 | C24 | C25 | C26 | C27 | C28 |
| best | 6.58082e+08 | 2.09123e+01 | 3.70265e+01 | 5.58189e+02 | 4.31932e+00 | 1.50354e+04 | 1.72173e+02 |
| median | 2.09933e+09 | 2.14984e+01 | 4.47071e+01 | 7.44848e+02 | 6.25467e+00 | 2.78702e+04 | 2.02544e+02 |
| c | 2 0 0 | 2 0 0 | 2 0 0 | 2 0 0 | 2 0 0 | 2 0 0 | 1 0 0 |
| 7.26657e+03 | 4.93000e+04 | 9.13401e+03 | 7.52269e+03 | 1.04348e+04 | 4.85357e+07 | 3.63275e+04 | |
| Mean | 2.02531e+09 | 2.13180e+01 | 4.55004e+01 | 7.72193e+02 | 6.51825e+00 | 2.64735e+04 | 2.12540e+02 |
| Worst | 4.14934e+09 | 2.14182e+01 | 7.05414e+01 | 9.87128e+02 | 9.74742e+00 | 5.25566e+04 | 3.08671e+02 |
| std | 7.91057e+08 | 2.26072e-01 | 9.58023e+00 | 1.16580e+02 | 1.46486e+00 | 7.94598e+03 | 3.13167e+01 |
| SR | 0 | 0 | 0 | 0 | 0 | 0 | 0 |
| 6.99710e+03 | 4.94889e+04 | 9.41546e+03 | 7.98474e+03 | 1.09620e+04 | 5.85456e+07 | 3.63287e+04 |
| problem | C01 | C02 | C03 | C04 | C05 | C06 | C07 |
| best | 2.19725e+04 | 3.08252e+04 | 8.81317e+05 | 8.80889e+02 | 1.74982e+05 | 4.28539e+03 | -5.36330e+01 |
| median | 3.48956e+04 | 4.21954e+04 | 1.64864e+07 | 1.05770e+03 | 3.53987e+05 | 1.18699e+04 | -3.22051e+02 |
| c | 0 0 0 | 0 0 0 | 0 1 0 | 0 0 0 | 0 0 0 | 5 0 0 | 2 0 0 |
| 0.00000e+00 | 0.00000e+00 | 4.56214e-02 | 0.00000e+00 | 0.00000e+00 | 6.78371e+00 | 6.86213e+03 | |
| Mean | 3.48826e+04 | 4.22447e+04 | 4.43083e+06 | 1.07373e+03 | 3.44449e+05 | 1.10830e+04 | -1.49642e+02 |
| Worst | 4.50649e+04 | 5.53684e+04 | 1.44167e+07 | 1.40462e+03 | 5.35239e+05 | 5.70569e+03 | -9.51640e+01 |
| std | 6.46300e+03 | 6.58780e+03 | 3.88766e+06 | 1.34842e+02 | 8.99856e+04 | 4.10730e+03 | 1.92704e+02 |
| SR | 100 | 100 | 8 | 100 | 100 | 8 | 0 |
| 0.00000e+00 | 0.00000e+00 | 6.03512e-02 | 0.00000e+00 | 0.00000e+00 | 6.29700e+00 | 6.90888e+03 | |
| problem | C08 | C09 | C10 | C11 | C12 | C13 | C14 |
| best | 2.07891e+01 | 1.02028e+01 | 3.48310e+01 | -1.42141e+03 | 3.13441e+04 | 1.56586e+09 | 2.07419e+01 |
| median | 2.76848e+01 | 8.33249e+00 | 3.71183e+01 | -9.50141e+02 | 3.75117e+04 | 3.12784e+09 | 2.12499e+01 |
| c | 2 0 0 | 1 0 0 | 2 0 0 | 1 0 0 | 1 0 0 | 1 0 0 | 2 0 0 |
| 7.53044e+03 | 6.19357e+03 | 4.52030e+07 | 1.53424e+04 | 1.84512e+04 | 1.19932e+04 | 5.14897e+04 | |
| Mean | 2.57686e+01 | 9.37371e+00 | 3.81451e+01 | -1.44764e+03 | 3.79194e+04 | 3.21154e+09 | 2.12221e+01 |
| Worst | 3.55284e+01 | 9.85473e+00 | 3.92237e+01 | -1.87066e+03 | 4.90522e+04 | 5.25677e+09 | 2.12777e+01 |
| std | 4.91663e+00 | 8.36433e-01 | 5.42529e+00 | 2.32202e+02 | 4.38064e+03 | 9.73355e+08 | 1.97632e-01 |
| SR | 0 | 0 | 0 | 0 | 0 | 0 | 0 |
| 7.58180e+03 | 6.67623e+03 | 4.67914e+07 | 1.58347e+04 | 1.86740e+04 | 1.22397e+04 | 5.20788e+04 | |
| problem | C15 | C16 | C17 | C18 | C19 | C20 | C21 |
| best | 3.77923e+01 | 1.29718e+03 | 6.87595e+00 | 3.08885e+04 | 2.94193e+02 | 3.74545e+01 | 2.74753e+04 |
| median | 3.78513e+01 | 1.49338e+03 | 1.01553e+01 | 3.87156e+04 | 3.56124e+02 | 3.90835e+01 | 3.62471e+04 |
| c | 2 0 0 | 2 0 0 | 2 0 0 | 2 0 0 | 1 0 0 | 0 0 0 | 1 0 0 |
| 1.52068e+04 | 1.30303e+04 | 1.81611e+04 | 1.06212e+09 | 7.33963e+04 | 0.00000e+00 | 1.78372e+04 | |
| Mean | 4.32079e+01 | 1.50611e+03 | 9.95507e+00 | 4.00109e+04 | 3.50146e+02 | 3.90733e+01 | 3.58695e+04 |
| Worst | 5.12716e+01 | 1.65646e+03 | 1.20672e+01 | 4.21590e+04 | 4.24377e+02 | 4.02646e+01 | 4.50014e+04 |
| std | 3.66450e+00 | 1.00916e+02 | 1.27062e+00 | 3.97574e+03 | 2.95260e+01 | 7.19816e-01 | 4.72648e+03 |
| SR | 0 | 0 | 0 | 0 | 0 | 100 | 0 |
| 1.49949e+04 | 1.33886e+04 | 1.77606e+04 | 1.03625e+09 | 7.33968e+04 | 0.00000e+00 | 1.76425e+04 | |
| problem | C22 | C23 | C24 | C25 | C26 | C27 | C28 |
| best | 1.61392e+10 | 2.14640e+01 | 6.86652e+01 | 2.11668e+03 | 2.04175e+01 | 9.99239e+04 | 3.98592e+02 |
| median | 3.19578e+10 | 2.15640e+01 | 7.90501e+01 | 2.58110e+03 | 2.85646e+01 | 1.39773e+05 | 5.50789e+02 |
| c | 2 0 0 | 2 0 0 | 2 0 0 | 2 0 0 | 2 0 0 | 2 0 0 | 1 0 0 |
| 3.76342e+04 | 1.88806e+05 | 5.61628e+04 | 4.98537e+04 | 5.49798e+04 | 1.06865e+09 | 7.34298e+04 | |
| Mean | 3.42906e+10 | 2.14957e+01 | 7.90906e+01 | 2.52591e+03 | 2.92427e+01 | 1.26691e+05 | 4.94682e+02 |
| Worst | 6.23980e+10 | 2.15599e+01 | 8.25268e+01 | 3.05519e+03 | 3.75458e+01 | 1.25816e+05 | 6.46487e+02 |
| std | 1.15359e+10 | 1.46944e-01 | 4.83272e+00 | 2.06318e+02 | 4.91052e+00 | 1.78593e+04 | 5.21990e+01 |
| SR | 0 | 0 | 0 | 0 | 0 | 0 | 0 |
| 3.82006e+04 | 1.85570e+05 | 5.70819e+04 | 4.89022e+04 | 5.63358e+04 | 1.09278e+09 | 7.34291e+04 |
8.2 Experimental Results of HECO-PDE
Tables 1518 shows the experimental results of HECO-PDE in terms of the best, median, worst, mean, standard deviation and feasibility rate of the function values , , and . is the number of violated constraints at the median solution: the sequence of three numbers indicate the number of violations (including inequality and equality) by more than 1.0, in the range and in the range respectively. denotes the mean value of the violations of all constraints at the median solution. SR is the feasibility rate of the solutions obtained in 25 runs. denotes the mean constraint violation value of all the solutions of 25 runs.
| problem | C01 | C02 | C03 | C04 | C05 | C06 | C07 |
| best | 0.00000e+00 | 0.00000e+00 | 0.00000e+00 | 0.00000e+00 | 0.00000e+00 | 0.00000e+00 | -2.58748e+02 |
| median | 0.00000e+00 | 0.00000e+00 | 0.00000e+00 | 0.00000e+00 | 0.00000e+00 | 0.00000e+00 | -1.17310e+03 |
| c | 0 0 0 | 0 0 0 | 0 0 0 | 0 0 0 | 0 0 0 | 0 0 0 | 0 0 2 |
| 0.00000e+00 | 0.00000e+00 | 0.00000e+00 | 0.00000e+00 | 0.00000e+00 | 0.00000e+00 | 1.91686e-03 | |
| Mean | 0.00000e+00 | 0.00000e+00 | 0.00000e+00 | 0.00000e+00 | 0.00000e+00 | 0.00000e+00 | -7.46594e+02 |
| Worst | 0.00000e+00 | 0.00000e+00 | 0.00000e+00 | 0.00000e+00 | 0.00000e+00 | 0.00000e+00 | -4.48664e+02 |
| std | 0.00000e+00 | 0.00000e+00 | 0.00000e+00 | 0.00000e+00 | 0.00000e+00 | 0.00000e+00 | 7.86557e+02 |
| SR | 100 | 100 | 100 | 100 | 100 | 100 | 4 |
| 0.00000e+00 | 0.00000e+00 | 0.00000e+00 | 0.00000e+00 | 0.00000e+00 | 0.00000e+00 | 2.31995e-03 | |
| problem | C08 | C09 | C10 | C11 | C12 | C13 | C14 |
| best | -1.34840e-03 | -4.97525e-03 | -5.09647e-04 | -1.68819e-01 | 3.98790e+00 | 0.00000e+00 | 2.37633e+00 |
| median | -1.34840e-03 | -4.97525e-03 | -5.09647e-04 | -1.68792e-01 | 3.98883e+00 | 0.00000e+00 | 2.37633e+00 |
| c | 0 0 0 | 0 0 0 | 0 0 0 | 0 0 0 | 0 0 0 | 0 0 0 | 0 0 0 |
| 0.00000e+00 | 0.00000e+00 | 0.00000e+00 | 0.00000e+00 | 0.00000e+00 | 0.00000e+00 | 0.00000e+00 | |
| Mean | -1.34840e-03 | -4.97525e-03 | -5.09647e-04 | -1.68092e-01 | 3.98918e+00 | 0.00000e+00 | 2.37633e+00 |
| Worst | -1.34840e-03 | -4.97525e-03 | -5.09647e-04 | -1.58782e-01 | 3.99096e+00 | 0.00000e+00 | 2.37633e+00 |
| std | 3.48093e-16 | 0.00000e+00 | 3.31451e-15 | 2.15091e-03 | 1.08240e-03 | 0.00000e+00 | 0.00000e+00 |
| SR | 100 | 100 | 100 | 100 | 100 | 100 | 100 |
| 0.00000e+00 | 0.00000e+00 | 0.00000e+00 | 0.00000e+00 | 0.00000e+00 | 0.00000e+00 | 0.00000e+00 | |
| problem | C15 | C16 | C17 | C18 | C19 | C20 | C21 |
| best | 2.35612e+00 | 0.00000e+00 | 1.08553e-02 | 1.00000e+01 | 0.00000e+00 | 1.04005e-01 | 3.98796e+00 |
| median | 2.35612e+00 | 0.00000e+00 | 1.08553e-02 | 5.04203e+01 | 0.00000e+00 | 3.68418e-01 | 3.98991e+00 |
| c | 0 0 0 | 0 0 0 | 1 0 0 | 0 0 0 | 1 0 0 | 0 0 0 | 0 0 0 |
| 0.00000e+00 | 0.00000e+00 | 4.50000e+00 | 0.00000e+00 | 6.63359e+03 | 0.00000e+00 | 0.00000e+00 | |
| Mean | 2.35612e+00 | 0.00000e+00 | 1.08553e-02 | 3.91026e+01 | 0.00000e+00 | 3.58433e-01 | 3.98967e+00 |
| Worst | 2.35612e+00 | 0.00000e+00 | 1.08553e-02 | 5.04203e+01 | 0.00000e+00 | 5.20013e-01 | 3.99246e+00 |
| std | 1.11995e-15 | 0.00000e+00 | 1.08780e-16 | 1.81487e+01 | 0.00000e+00 | 1.07653e-01 | 1.26111e-03 |
| SR | 100 | 100 | 0 | 100 | 0 | 100 | 100 |
| 0.00000e+00 | 0.00000e+00 | 4.50000e+00 | 0.00000e+00 | 6.63359e+03 | 0.00000e+00 | 0.00000e+00 | |
| problem | C22 | C23 | C24 | C25 | C26 | C27 | C28 |
| best | 3.48642e-27 | 2.37633e+00 | 2.35612e+00 | 0.00000e+00 | 1.08553e-02 | 9.05515e+01 | 0.00000e+00 |
| median | 3.48642e-27 | 2.37633e+00 | 2.35612e+00 | 0.00000e+00 | 1.08553e-02 | 9.57215e+01 | 0.00000e+00 |
| c | 0 0 0 | 0 0 0 | 0 0 0 | 0 0 0 | 1 0 0 | 0 0 0 | 1 0 0 |
| 0.00000e+00 | 0.00000e+00 | 0.00000e+00 | 0.00000e+00 | 4.50000e+00 | 0.00000e+00 | 6.63359e+03 | |
| Mean | 3.49026e-27 | 2.37633e+00 | 2.35612e+00 | 0.00000e+00 | 7.37529e-02 | 9.40671e+01 | 0.00000e+00 |
| Worst | 3.51844e-27 | 2.37633e+00 | 2.35612e+00 | 0.00000e+00 | 7.10694e-01 | 9.57217e+01 | 0.00000e+00 |
| std | 1.04062e-29 | 5.21413e-07 | 5.18534e-08 | 0.00000e+00 | 1.75700e-01 | 2.41167e+00 | 0.00000e+00 |
| SR | 100 | 100 | 100 | 100 | 0 | 100 | 0 |
| 0.00000e+00 | 0.00000e+00 | 0.00000e+00 | 0.00000e+00 | 4.50000e+00 | 0.00000e+00 | 6.63359e+03 |
| problem | C01 | C02 | C03 | C04 | C05 | C06 | C07 |
| best | 0.00000e+00 | 0.00000e+00 | 0.00000e+00 | 1.35728e+01 | 0.00000e+00 | 0.00000e+00 | -2.45791e+03 |
| median | 9.33075e-30 | 1.17959e-29 | 3.49071e-29 | 1.35728e+01 | 0.00000e+00 | 0.00000e+00 | -2.68829e+03 |
| c | 0 0 0 | 0 0 0 | 0 0 0 | 0 0 0 | 0 0 0 | 0 0 0 | 0 0 2 |
| 0.00000e+00 | 0.00000e+00 | 0.00000e+00 | 0.00000e+00 | 0.00000e+00 | 0.00000e+00 | 7.93332e-04 | |
| Mean | 1.59799e-29 | 1.96421e-29 | 3.95614e-29 | 1.35728e+01 | 0.00000e+00 | 0.00000e+00 | -1.94723e+03 |
| Worst | 7.51020e-29 | 6.70162e-29 | 1.34895e-28 | 1.35728e+01 | 0.00000e+00 | 0.00000e+00 | -2.51299e+03 |
| std | 2.11761e-29 | 1.97404e-29 | 3.35121e-29 | 1.28144e-14 | 0.00000e+00 | 0.00000e+00 | 9.19644e+02 |
| SR | 100 | 100 | 100 | 100 | 100 | 100 | 0 |
| 0.00000e+00 | 0.00000e+00 | 0.00000e+00 | 0.00000e+00 | 0.00000e+00 | 0.00000e+00 | 1.05592e-03 | |
| problem | C08 | C09 | C10 | C11 | C12 | C13 | C14 |
| best | -2.83981e-04 | -2.66551e-03 | -1.02842e-04 | -9.24713e-01 | 3.98253e+00 | 0.00000e+00 | 1.40852e+00 |
| median | -2.83981e-04 | -2.66551e-03 | -1.02842e-04 | -8.77334e-01 | 3.98257e+00 | 0.00000e+00 | 1.40852e+00 |
| c | 0 0 0 | 0 0 0 | 0 0 0 | 0 0 0 | 0 0 0 | 0 0 0 | 0 0 0 |
| 0.00000e+00 | 0.00000e+00 | 0.00000e+00 | 0.00000e+00 | 0.00000e+00 | 0.00000e+00 | 0.00000e+00 | |
| Mean | -2.83981e-04 | -2.66551e-03 | -1.02842e-04 | -1.87293e+02 | 3.98269e+00 | 0.00000e+00 | 1.40852e+00 |
| Worst | -2.83981e-04 | -2.66551e-03 | -1.02840e-04 | -1.25684e+03 | 3.98341e+00 | 0.00000e+00 | 1.40852e+00 |
| std | 5.00769e-11 | 3.79326e-16 | 2.41501e-10 | 3.71804e+02 | 2.14922e-04 | 0.00000e+00 | 7.00761e-16 |
| SR | 100 | 100 | 100 | 64 | 100 | 100 | 100 |
| 0.00000e+00 | 0.00000e+00 | 0.00000e+00 | 1.26005e+01 | 0.00000e+00 | 0.00000e+00 | 0.00000e+00 | |
| problem | C15 | C16 | C17 | C18 | C19 | C20 | C21 |
| best | 2.35612e+00 | 0.00000e+00 | 3.08555e-02 | 3.00000e+01 | 0.00000e+00 | 2.50134e+00 | 3.98253e+00 |
| median | 2.35612e+00 | 0.00000e+00 | 1.44943e+00 | 5.34725e+01 | 0.00000e+00 | 2.84742e+00 | 3.98262e+00 |
| c | 0 0 0 | 0 0 0 | 1 0 0 | 0 0 0 | 1 0 0 | 0 0 0 | 0 0 0 |
| 0.00000e+00 | 0.00000e+00 | 1.45000e+01 | 0.00000e+00 | 2.13749e+04 | 0.00000e+00 | 0.00000e+00 | |
| Mean | 2.35612e+00 | 0.00000e+00 | 6.51135e-01 | 4.85514e+01 | 0.00000e+00 | 2.87611e+00 | 3.98269e+00 |
| Worst | 2.35612e+00 | 0.00000e+00 | 9.51999e-01 | 5.82173e+01 | 0.00000e+00 | 3.19426e+00 | 3.98327e+00 |
| std | 1.13742e-15 | 0.00000e+00 | 4.82474e-01 | 8.31285e+00 | 0.00000e+00 | 1.88661e-01 | 1.94653e-04 |
| SR | 100 | 100 | 0 | 100 | 0 | 100 | 100 |
| 0.00000e+00 | 0.00000e+00 | 1.49400e+01 | 0.00000e+00 | 2.13749e+04 | 0.00000e+00 | 0.00000e+00 | |
| problem | C22 | C23 | C24 | C25 | C26 | C27 | C28 |
| best | 3.59077e-14 | 1.40852e+00 | 2.35612e+00 | 0.00000e+00 | 6.11945e-01 | 2.08760e+02 | 0.00000e+00 |
| median | 7.91069e-10 | 1.40852e+00 | 2.35612e+00 | 0.00000e+00 | 8.53762e-01 | 2.51342e+02 | 3.33028e-06 |
| c | 0 0 0 | 0 0 0 | 0 0 0 | 0 0 0 | 1 0 0 | 0 0 0 | 1 0 0 |
| 0.00000e+00 | 0.00000e+00 | 0.00000e+00 | 0.00000e+00 | 1.55000e+01 | 0.00000e+00 | 2.13749e+04 | |
| Mean | 4.13459e-08 | 1.40853e+00 | 2.35612e+00 | 0.00000e+00 | 8.41942e-01 | 2.36013e+02 | 4.23646e-06 |
| Worst | 7.52530e-07 | 1.40858e+00 | 2.35612e+00 | 0.00000e+00 | 1.01187e+00 | 2.51347e+02 | 1.77740e-05 |
| std | 1.48613e-07 | 1.46320e-05 | 8.05949e-08 | 0.00000e+00 | 8.41683e-02 | 2.04397e+01 | 3.62229e-06 |
| SR | 100 | 100 | 100 | 100 | 0 | 100 | 0 |
| 0.00000e+00 | 0.00000e+00 | 0.00000e+00 | 0.00000e+00 | 1.55000e+01 | 0.00000e+00 | 2.13749e+04 |
| problem | C01 | C02 | C03 | C04 | C05 | C06 | C07 |
| best | 1.04672e-28 | 4.57539e-29 | 1.81832e-28 | 1.35728e+01 | 0.00000e+00 | 0.00000e+00 | -3.78512e+03 |
| median | 2.08259e-28 | 2.17442e-28 | 3.30138e-28 | 1.35728e+01 | 9.12120e-30 | 1.41843e+02 | -8.31534e+02 |
| c | 0 0 0 | 0 0 0 | 0 0 0 | 0 0 0 | 0 0 0 | 0 0 0 | 0 0 2 |
| 0.00000e+00 | 0.00000e+00 | 0.00000e+00 | 0.00000e+00 | 0.00000e+00 | 0.00000e+00 | 5.66334e-04 | |
| Mean | 2.51258e-28 | 2.17115e-28 | 4.12290e-28 | 1.35728e+01 | 4.52846e-29 | 1.16974e+02 | -2.79070e+03 |
| Worst | 5.16815e-28 | 4.33787e-28 | 8.70114e-28 | 1.35728e+01 | 4.25245e-28 | 1.66179e+02 | -3.52267e+03 |
| std | 1.21265e-28 | 8.04570e-29 | 1.98135e-28 | 2.10181e-15 | 8.97841e-29 | 9.83836e+01 | 9.79449e+02 |
| SR | 100 | 100 | 100 | 100 | 100 | 76 | 12 |
| 0.00000e+00 | 0.00000e+00 | 0.00000e+00 | 0.00000e+00 | 0.00000e+00 | 2.42773e-04 | 8.24621e-04 | |
| problem | C08 | C09 | C10 | C11 | C12 | C13 | C14 |
| best | -1.34466e-04 | -2.03709e-03 | -4.82659e-05 | -3.11531e+02 | 3.98145e+00 | 0.00000e+00 | 1.09995e+00 |
| median | -1.33456e-04 | -2.03709e-03 | -4.82628e-05 | -1.62884e+03 | 3.98150e+00 | 1.33101e-27 | 1.09995e+00 |
| c | 0 0 0 | 0 0 0 | 0 0 0 | 1 0 0 | 0 0 0 | 0 0 0 | 0 0 0 |
| 0.00000e+00 | 0.00000e+00 | 0.00000e+00 | 3.29899e+01 | 0.00000e+00 | 0.00000e+00 | 0.00000e+00 | |
| Mean | -1.31402e-04 | -2.03709e-03 | -4.82606e-05 | -1.54196e+03 | 4.22857e+00 | 1.59465e-01 | 1.10073e+00 |
| Worst | -1.12487e-04 | -2.03709e-03 | -4.82487e-05 | -2.67003e+03 | 7.06997e+00 | 3.98662e+00 | 1.11946e+00 |
| std | 4.80757e-06 | 1.40141e-15 | 4.96661e-09 | 6.80331e+02 | 8.37725e-01 | 7.81216e-01 | 3.82241e-03 |
| SR | 100 | 100 | 100 | 0 | 100 | 100 | 100 |
| 0.00000e+00 | 0.00000e+00 | 0.00000e+00 | 3.55113e+01 | 0.00000e+00 | 0.00000e+00 | 0.00000e+00 | |
| problem | C15 | C16 | C17 | C18 | C19 | C20 | C21 |
| best | 2.35612e+00 | 0.00000e+00 | 6.04826e-02 | 4.42174e+01 | 0.00000e+00 | 5.15997e+00 | 3.98145e+00 |
| median | 2.35612e+00 | 0.00000e+00 | 5.45231e-01 | 4.61632e+01 | 0.00000e+00 | 6.24310e+00 | 3.98149e+00 |
| c | 0 0 0 | 0 0 0 | 1 0 0 | 0 0 0 | 1 0 0 | 0 0 0 | 0 0 0 |
| 0.00000e+00 | 0.00000e+00 | 2.55000e+01 | 0.00000e+00 | 3.61162e+04 | 0.00000e+00 | 0.00000e+00 | |
| Mean | 2.35612e+00 | 0.00000e+00 | 6.17102e-01 | 4.76107e+01 | 0.00000e+00 | 6.10145e+00 | 4.10501e+00 |
| Worst | 2.35612e+00 | 0.00000e+00 | 9.20881e-01 | 6.22173e+01 | 0.00000e+00 | 6.92786e+00 | 7.06871e+00 |
| std | 1.55368e-15 | 0.00000e+00 | 3.32818e-01 | 3.65297e+00 | 0.00000e+00 | 4.34170e-01 | 6.04962e-01 |
| SR | 100 | 100 | 0 | 100 | 0 | 100 | 100 |
| 0.00000e+00 | 0.00000e+00 | 2.52200e+01 | 0.00000e+00 | 3.61162e+04 | 0.00000e+00 | 0.00000e+00 | |
| problem | C22 | C23 | C24 | C25 | C26 | C27 | C28 |
| best | 5.13492e-01 | 1.09995e+00 | 2.35612e+00 | 0.00000e+00 | 8.01254e-01 | 2.47635e+02 | 1.65653e-05 |
| median | 1.40918e+01 | 1.09996e+00 | 2.35612e+00 | 0.00000e+00 | 9.36281e-01 | 2.64205e+02 | 3.28074e+00 |
| c | 0 0 0 | 0 0 0 | 0 0 0 | 0 0 0 | 1 0 0 | 0 0 0 | 1 0 0 |
| 0.00000e+00 | 0.00000e+00 | 0.00000e+00 | 0.00000e+00 | 2.55000e+01 | 0.00000e+00 | 3.61248e+04 | |
| Mean | 1.34654e+01 | 1.09997e+00 | 2.35612e+00 | 3.02025e-14 | 9.31995e-01 | 2.58242e+02 | 2.76288e+00 |
| Worst | 1.60992e+01 | 1.10009e+00 | 2.35612e+00 | 7.55062e-13 | 1.01406e+00 | 2.64215e+02 | 7.12744e+00 |
| std | 2.82924e+00 | 3.13374e-05 | 1.72250e-08 | 1.47961e-13 | 5.29458e-02 | 7.95311e+00 | 2.53458e+00 |
| SR | 100 | 100 | 100 | 100 | 0 | 100 | 0 |
| 0.00000e+00 | 0.00000e+00 | 0.00000e+00 | 0.00000e+00 | 2.55000e+01 | 0.00000e+00 | 3.61255e+04 |
| problem | C01 | C02 | C03 | C04 | C05 | C06 | C07 |
| best | 4.74860e-24 | 2.08968e-23 | 1.09781e-23 | 1.35728e+01 | 1.24693e-16 | 5.85856e+02 | -6.04093e+03 |
| median | 2.96855e-22 | 7.65701e-22 | 2.63175e-22 | 1.35728e+01 | 5.60537e-15 | 9.10968e+02 | -5.12059e+03 |
| c | 0 0 0 | 0 0 0 | 0 0 0 | 0 0 0 | 0 0 0 | 0 0 0 | 0 0 2 |
| 0.00000e+00 | 0.00000e+00 | 0.00000e+00 | 0.00000e+00 | 0.00000e+00 | 0.00000e+00 | 3.43542e-04 | |
| Mean | 7.92774e-22 | 6.12831e-21 | 1.04964e-21 | 1.36666e+01 | 1.13652e-13 | 8.17227e+02 | -4.19316e+03 |
| Worst | 4.80812e-21 | 4.10046e-20 | 7.98385e-21 | 1.59192e+01 | 1.63788e-12 | 8.24776e+02 | -5.64890e+03 |
| std | 1.10948e-21 | 1.11876e-20 | 1.84224e-21 | 4.59810e-01 | 3.33214e-13 | 1.19466e+02 | 1.20840e+03 |
| SR | 100 | 100 | 100 | 100 | 100 | 64 | 20 |
| 0.00000e+00 | 0.00000e+00 | 0.00000e+00 | 0.00000e+00 | 0.00000e+00 | 1.07363e-03 | 4.02313e-04 | |
| problem | C08 | C09 | C10 | C11 | C12 | C13 | C14 |
| best | 9.89426e-05 | 0.00000e+00 | -1.69783e-05 | -6.28804e+03 | 1.88621e+01 | 3.32042e+01 | 7.84202e-01 |
| median | 4.62686e-04 | 0.00000e+00 | -1.66940e-05 | -6.98033e+03 | 3.16345e+01 | 3.32046e+01 | 7.86865e-01 |
| c | 0 0 0 | 0 0 0 | 0 0 0 | 1 0 0 | 0 0 0 | 0 0 0 | 0 0 0 |
| 0.00000e+00 | 0.00000e+00 | 0.00000e+00 | 8.12562e+01 | 0.00000e+00 | 0.00000e+00 | 0.00000e+00 | |
| Mean | 4.54336e-04 | 0.00000e+00 | -1.67005e-05 | -6.83288e+03 | 3.11306e+01 | 3.36826e+01 | 7.96313e-01 |
| Worst | 9.65755e-04 | 0.00000e+00 | -1.62289e-05 | -6.23668e+03 | 3.18122e+01 | 3.71880e+01 | 8.38008e-01 |
| std | 1.64588e-04 | 0.00000e+00 | 2.14329e-07 | 3.27748e+02 | 2.50488e+00 | 1.29435e+00 | 1.52042e-02 |
| SR | 100 | 100 | 100 | 0 | 100 | 100 | 100 |
| 0.00000e+00 | 0.00000e+00 | 0.00000e+00 | 9.43117e+01 | 0.00000e+00 | 0.00000e+00 | 0.00000e+00 | |
| problem | C15 | C16 | C17 | C18 | C19 | C20 | C21 |
| best | 2.35612e+00 | 0.00000e+00 | 2.59387e-01 | 4.62791e+01 | 0.00000e+00 | 1.47876e+01 | 1.20688e+01 |
| median | 2.35612e+00 | 0.00000e+00 | 8.79248e-01 | 1.30626e+02 | 0.00000e+00 | 1.58000e+01 | 3.15911e+01 |
| c | 0 0 0 | 0 0 0 | 1 0 0 | 1 0 0 | 1 0 0 | 0 0 0 | 0 0 0 |
| 0.00000e+00 | 0.00000e+00 | 5.05000e+01 | 2.11765e+01 | 7.29695e+04 | 0.00000e+00 | 0.00000e+00 | |
| Mean | 2.35612e+00 | 0.00000e+00 | 8.01474e-01 | 8.51306e+01 | 1.68587e-09 | 1.58580e+01 | 3.03467e+01 |
| Worst | 2.35612e+00 | 0.00000e+00 | 1.01669e+00 | 4.48688e+01 | 4.21468e-08 | 1.72009e+01 | 3.21128e+01 |
| std | 1.37309e-15 | 0.00000e+00 | 2.12703e-01 | 4.01418e+01 | 8.25906e-09 | 6.38805e-01 | 4.49296e+00 |
| SR | 100 | 100 | 0 | 32 | 0 | 100 | 100 |
| 0.00000e+00 | 0.00000e+00 | 5.05000e+01 | 1.18429e+01 | 7.29695e+04 | 0.00000e+00 | 0.00000e+00 | |
| problem | C22 | C23 | C24 | C25 | C26 | C27 | C28 |
| best | 7.82296e+01 | 7.84209e-01 | 2.35612e+00 | 1.57066e+00 | 1.00167e+00 | 2.84751e+02 | 2.38846e+01 |
| median | 2.12380e+04 | 7.84225e-01 | 2.35612e+00 | 1.57066e+00 | 1.04543e+00 | 2.84829e+02 | 5.38774e+01 |
| c | 1 0 0 | 0 0 0 | 0 0 0 | 0 0 0 | 1 0 0 | 0 0 0 | 1 0 0 |
| 1.54193e+01 | 0.00000e+00 | 0.00000e+00 | 0.00000e+00 | 5.05000e+01 | 0.00000e+00 | 7.30594e+04 | |
| Mean | 3.23001e+04 | 7.84396e-01 | 2.35612e+00 | 5.27774e+00 | 1.05214e+00 | 2.99755e+02 | 5.15351e+01 |
| Worst | 8.20487e+02 | 7.87071e-01 | 2.35612e+00 | 3.29866e+01 | 1.09745e+00 | 3.18890e+02 | 9.74830e+01 |
| std | 8.81380e+04 | 5.65603e-04 | 3.39107e-09 | 6.63285e+00 | 2.54681e-02 | 1.68980e+01 | 1.51348e+01 |
| SR | 48 | 100 | 100 | 100 | 0 | 100 | 0 |
| 3.65205e+01 | 0.00000e+00 | 0.00000e+00 | 0.00000e+00 | 5.05000e+01 | 0.00000e+00 | 7.30575e+04 |