Magnetoelastic phenomena in antiferromagnetic uranium intermetallics:
the case
Abstract
Thermal expansion, magnetostriction and magnetization measurements under magnetic field and hydrostatic pressure were performed on a single crystal. They revealed a large anisotropy of magnetoelastic properties manifested by prominent length changes leading to a collapse of the unit-cell volume accompanied by breaking the fourfold symmetry (similar to that in in the hidden-order state) in the antiferromagnetic state as consequences of strong magnetoelastic coupling. The magnetostriction curves measured at higher temperatures confirm a bulk character of the weak ferromagnetic phase. The large positive pressure change of the ordering temperature predicted from Ehrenfest relation contradicts the more than an order of magnitude smaller pressure dependence observed by the magnetization and specific heat measured under hydrostatic pressure. A comprehensive magnetic phase diagram of in magnetic field applied along the axis is presented. The ground-state antiferromagnetic phase is suppressed by a field-induced metamagnetic transition that changes its character from the second to the first order at the tricritical point.
pacs:
75.30.Gw, 75.30.Kz, 75.40.-s, 75.50.Ee, 75.80.+q, 65.40.DeI Introduction
The anharmonic lattice vibrations due to the asymmetric bonding potential lead to increasing equilibrium interatomic distances with rising temperature in solids. The corresponding thermal expansion is a monotonously increasing function of temperature. The anisotropy of bonding within the crystal lattice causes the anisotropy of thermal expansion which is manifested by different temperature dependences of the linear thermal expansion along the different crystallographic axes, . The thermal expansion of metals includes also a conduction-electron contribution. This plays a considerable role at low temperatures where the phonon term almost vanishes.
The magneto-structural coupling, reflecting the interplay between the spin and lattice degrees of freedom, brings additional contributions to the thermal expansion in magnetic compounds. The magnetocrystalline anisotropy leads to anisotropic magnetic contributions to the thermal expansion. Magnetic materials then exhibit unusual thermal-expansion behavior especially in a magnetically ordered state.
The thermal expansion, similar to the specific heat, is thus a useful probe for investigations of thermodynamic phenomena in magnetic materials (without applying magnetic field). The specific heat has only bulk character, whereas the thermal expansion enables us to study also the anisotropy of thermodynamic properties.
The spatially extended uranium 5-electron wave functions in solids considerably interact with the overlapping 5 orbitals of the nearest-neighbor U ions and the 5-electron states hybridize with valence-electron states of non-uranium ligands (5-ligand hybridizationKoelling et al. (1985)) and the 5 electrons even participate in bonding.Smith and Kmetko (1983); Eriksson et al. (1991) The exchange interactions that are coupling the uranium 5-electron magnetic moments in U antiferromagnets are strongly anisotropic. The direct exchange interactions are due to the 5-5 orbitals overlap. The anisotropy of these, typically ferromagnetic (FM), interactions and as well as the magnetocrystalline anisotropy are determined by the arrangement of the nearest-neighbor U ions in the lattice. The antiferromagnetic (AFM) interactions in U compounds are usually mediated by the anisotropic 5-ligand hybridization. The magnetoelastic coupling then produces highly anisotropic magnetic contributions to the thermal expansion and magnetostriction, especially in U antiferromagnets.
The anisotropy of magnetoelastic phenomena is a subject of numerous papers on U magnetics. Most frequently they have been dedicated to the intriguing properties of , the most thoroughly studied uranium compound in more than the last three decades. There were no doubts about bulk superconductivity in below since the earliest stage of research of this compound. Interpretation of the huge specific-heat peak and the Cr-like anomaly of electrical resistivity both at were, however, always a subject of dispute. First, these were interpreted in terms of a transition to a weak itinerant antiferromagnetism,Palstra et al. (1985) static charge-density wave (CDW) or spin-density wave (SDW) transitionMaple et al. (1986) or a local U-moment antiferromagnetism.Schlabitz et al. (1986) No long-range magnetic order nor any sign of a static CDW or SDW formation below has been confirmed by microscopic methods, however. Within time the term “hidden order” (HO) was introduced to describe the unknown ordered state which allows unconventional superconductivity to occur at . exhibits a non-magnetic, non-structural HO phase transition at where the order parameter and elementary excitations so far could not be determined by microscopic experiments and only dynamical magnetic fluctuations are observed. Comprehensive information on physics of can be found in Ref.Mydosh and Oppeneer (2011) and references therein. The volume of this compound reduces considerably below as manifested by a sharp positive peak in the thermal-expansion coefficient at . The volume reduction of the tetragonal structure is due to the basal-plane shrinkage. The simultaneous lattice expansion along the axis is too small to compensate the negative basal-plane effect.de Visser et al. (1986, 1990); Motoyama et al. (2008); Ran et al. (2016) The possibility of a slight orthorhombic distortion of the tetragonal lattice at temperatures below plays an important role in the physics of . We will come back to this point in the Discussion section.
The influence of anisotropic exchange interactions on the anisotropy of thermal expansion in U antiferromagnets is manifested by the magnetoelastic behavior of two other ( – transition metal, – -electron metal) compounds with the tetragonal structure, Andreev et al. (2017, 2013) and Honda et al. (1999) and several antiferromagnets from the family of hexagonal compounds crystalizing in the structure. In the both structures the nearest U-U neighbors are located in the basal plane where the U magnetic moments are coupled ferromagnetically. All these compounds exhibit the strong uniaxial anisotropy fixing the U moments to the axis, which is the easy magnetization direction. The AFM structures in these materials are built of the FM basal-plane layers antiferromagnetically coupled along the axis. The thermal expansion below the Néel temperature () in these antiferromagnets (similar to below ) is strongly anisotropic as well as the magnetostriction accompanying field-induced metamagnetic transitions from the AFM to paramagnetic state. The corresponding - and -axis linear thermal expansions and , respectively have in all cases opposite signs. The volume thermal expansion calculated according to
| (1) |
for the compounds is small as a result of compensation of the opposite-sign linear expansions. The linear magnetostrictions and accompanying a metamagnetic transition are also of opposite signs leading to small volume magnetostriction. However, they have opposite polarities with respect to the corresponding-direction of thermal expansions. In fact, the magnetic contributions to thermal expansion of an antiferromagnet below are suppressed by the opposite polarity corresponding to magnetostrictions caused by the metamagnetic transition.
belongs to the family of compounds which adopt the tetragonal structure ( and crystallize in the structureSechovsky and Havela (1998)). These compounds exhibit a spectrum of physical properties ranging from Pauli paramagnets (,Szytuka et al. (1988) , and Palstra et al. (1986)) to magnetically ordered systems which are mostly complex and either AFM (,Matsuda et al. (2003) ,Chełmicki et al. (1985) ,Chełmicki et al. (1983) ,Ptasiewicz-Bak (1981) ,Ptasiewicz-Bak (1981); Honma et al. (1998) ,Palstra et al. (1986); Dirkmaat et al. (1990) and Palstra et al. (1986)), or FM (Szytuka et al. (1988)). Chełmicki et al. (1985); D. Matsuda et al. (2005); Honda et al. (2006); Troć et al. (2012) exhibits a FM ground state with an additional AFM phase at higher temperatures. An exceptional case among them is the well-known Palstra et al. (1985) exhibiting the hidden-order transition. The magnetism of was for many years left unclear mainly due to metallurgical difficulties.Sechovsky and Havela (1998)
Quite recently we have successfully prepared a single crystal and commenced systematic investigations of its intrinsic properties. The results obtained by measurements of magnetization, specific heat and electrical resistivityTabata et al. (2016) followed by neutron diffraction Tabata et al. (2017a) and 29Si-NMRTabata et al. (2017b) experiments corroborate the conclusion about the ground state of as an uncompensated antiferromagnet, contrary to previous reports on polycrystals.Palstra et al. (1986); Rebelsky et al. (1991); Torikachvili et al. (1992); Lin et al. (1997); Saran and McAlister (1988) undergoes a FM-like transition at (referred to as ) followed by another magnetic phase transition () around . All our previous measurements show a large magnetocrystalline anisotropy with the direction of magnetic moments along the axis. The propagation vector is and the magnetic structure can be described as a stacking sequence (+ + -) of the FM plane sheets along the axis.Tabata et al. (2017a) The specific-heat measurements point to an enhanced value of the Sommerfeld coefficient . Now, we investigated the single crystal by use of thermal-expansion, magnetostriction and magnetization measurements up to high magnetic fields and under hydrostatic pressure. The results of the present paper, are complementary to our previous neutron-diffraction work, confirming the uncompenasted antiferromagnetic (UAFM) ground state of the compound,Tabata et al. (2017a) and bring evidence for the intrinsic nature of the FM component below previously reported as parasitic in our first single-crystal study.Tabata et al. (2016) Magnetization measurements in pulsed high magnetic fields helped us to complete the phase diagram of and revealed signs of the presence of a tricritical point (TCP).
II Experimental Details
The single crystal used in this study was prepared using the floating-zone method in an optical furnace (Crystal Systems Co.) in a similar way as in our previous work.Tabata et al. (2016) Nevertheless, to obtain a higher-quality and larger single crystals we have optimized the entire growth process. The initial polycrystalline rod with diameter of and length of was prepared from the starting elements of U (initially and consequently purified by the Solid State Electrotransport Method under ultra high vacuumHaga et al. (1998)), Au () and Si (). The rod was subsequently annealed at for three days, cut in two parts and placed in the optical furnace, where the shorter bottom part served as a polycrystalline seed and the main larger rod hung from the top as feed material for the growth. The chamber of the optical furnace was evacuated to and the growth itself was done under the protective Ar atmosphere with a flow of in an overpressure of . The power of the lamps in the furnace was adjusted to keep the temperature of the hot zone slightly above the melting point. Both, the seed and feed rod were slowly pulled through the hot zone with a speed of and without rotation. The quality of the grown single crystal was checked by the x-ray Laue method and Energy-dispersive x-ray (EDX) analysis.
Length changes were measured using a miniature capacitance dilatometerRotter et al. (2007) mounted in PPMS 9 T and PPMS 14 T (Quantum Design Co.) between and in magnetic fields up to . Magnetization measurements in static fields were done using the VSM option (Vibrating Sample Magnetometer) implemented in the PPMS 14 T. Specific heat measurements up to were performed using the relaxation technique by PPMS 9 T (Quantum Design Co.).
The magnetization in pulsed magnetic fields up to was measured at the Dresden High Magnetic Field Laboratory using a coaxial pick-up coil system. The high-field magnetometer is described in Ref. Skourski et al. (2011). Absolute values of the magnetization were calibrated using static-field measurements.
The magnetization measurements under hydrostatic pressure were performed in the MPMS SQUID (Quantum Design Co.) magnetometer using a CuBe pressure cellKamarád et al. (2004) with a liquid pressure medium and a piece of lead as manometer. The heat capacity of the sample under high pressures was measured by the means of steady-state calorimetry.Sullivan and Seidel (1968) Double-layered CuBe/NiCrAl piston-cylinder pressure cell was used to generate pressures up to , with a Daphne 7373 pressure medium and a manganin manometer. A micro strain-gauge was used for periodic heating of the sample and an Au/AuFe thermoucouple was used to measure it’s temperature oscillations. The amplitude of oscillations is inversely proportional to the sample heat capacity. Technical details of the methodSullivan and Seidel (1968); Kraftmakher (2004) and actual experimental setup used in our experiments Míšek (2013) are beyond the scope of this paper and can be found elsewhere.
III Results
III.1 Thermal-expansion measurements
The - and -axis linear thermal expansions together with the volume expansion calculated according to Eq. (1) are plotted in Fig. 1. The individual data are vertically shifted to set them equal to at . Below this magnetic phase transition we observe a significant change in the temperature dependence of the thermal expansion in line with our previous reports.Tabata et al. (2016, 2017a)
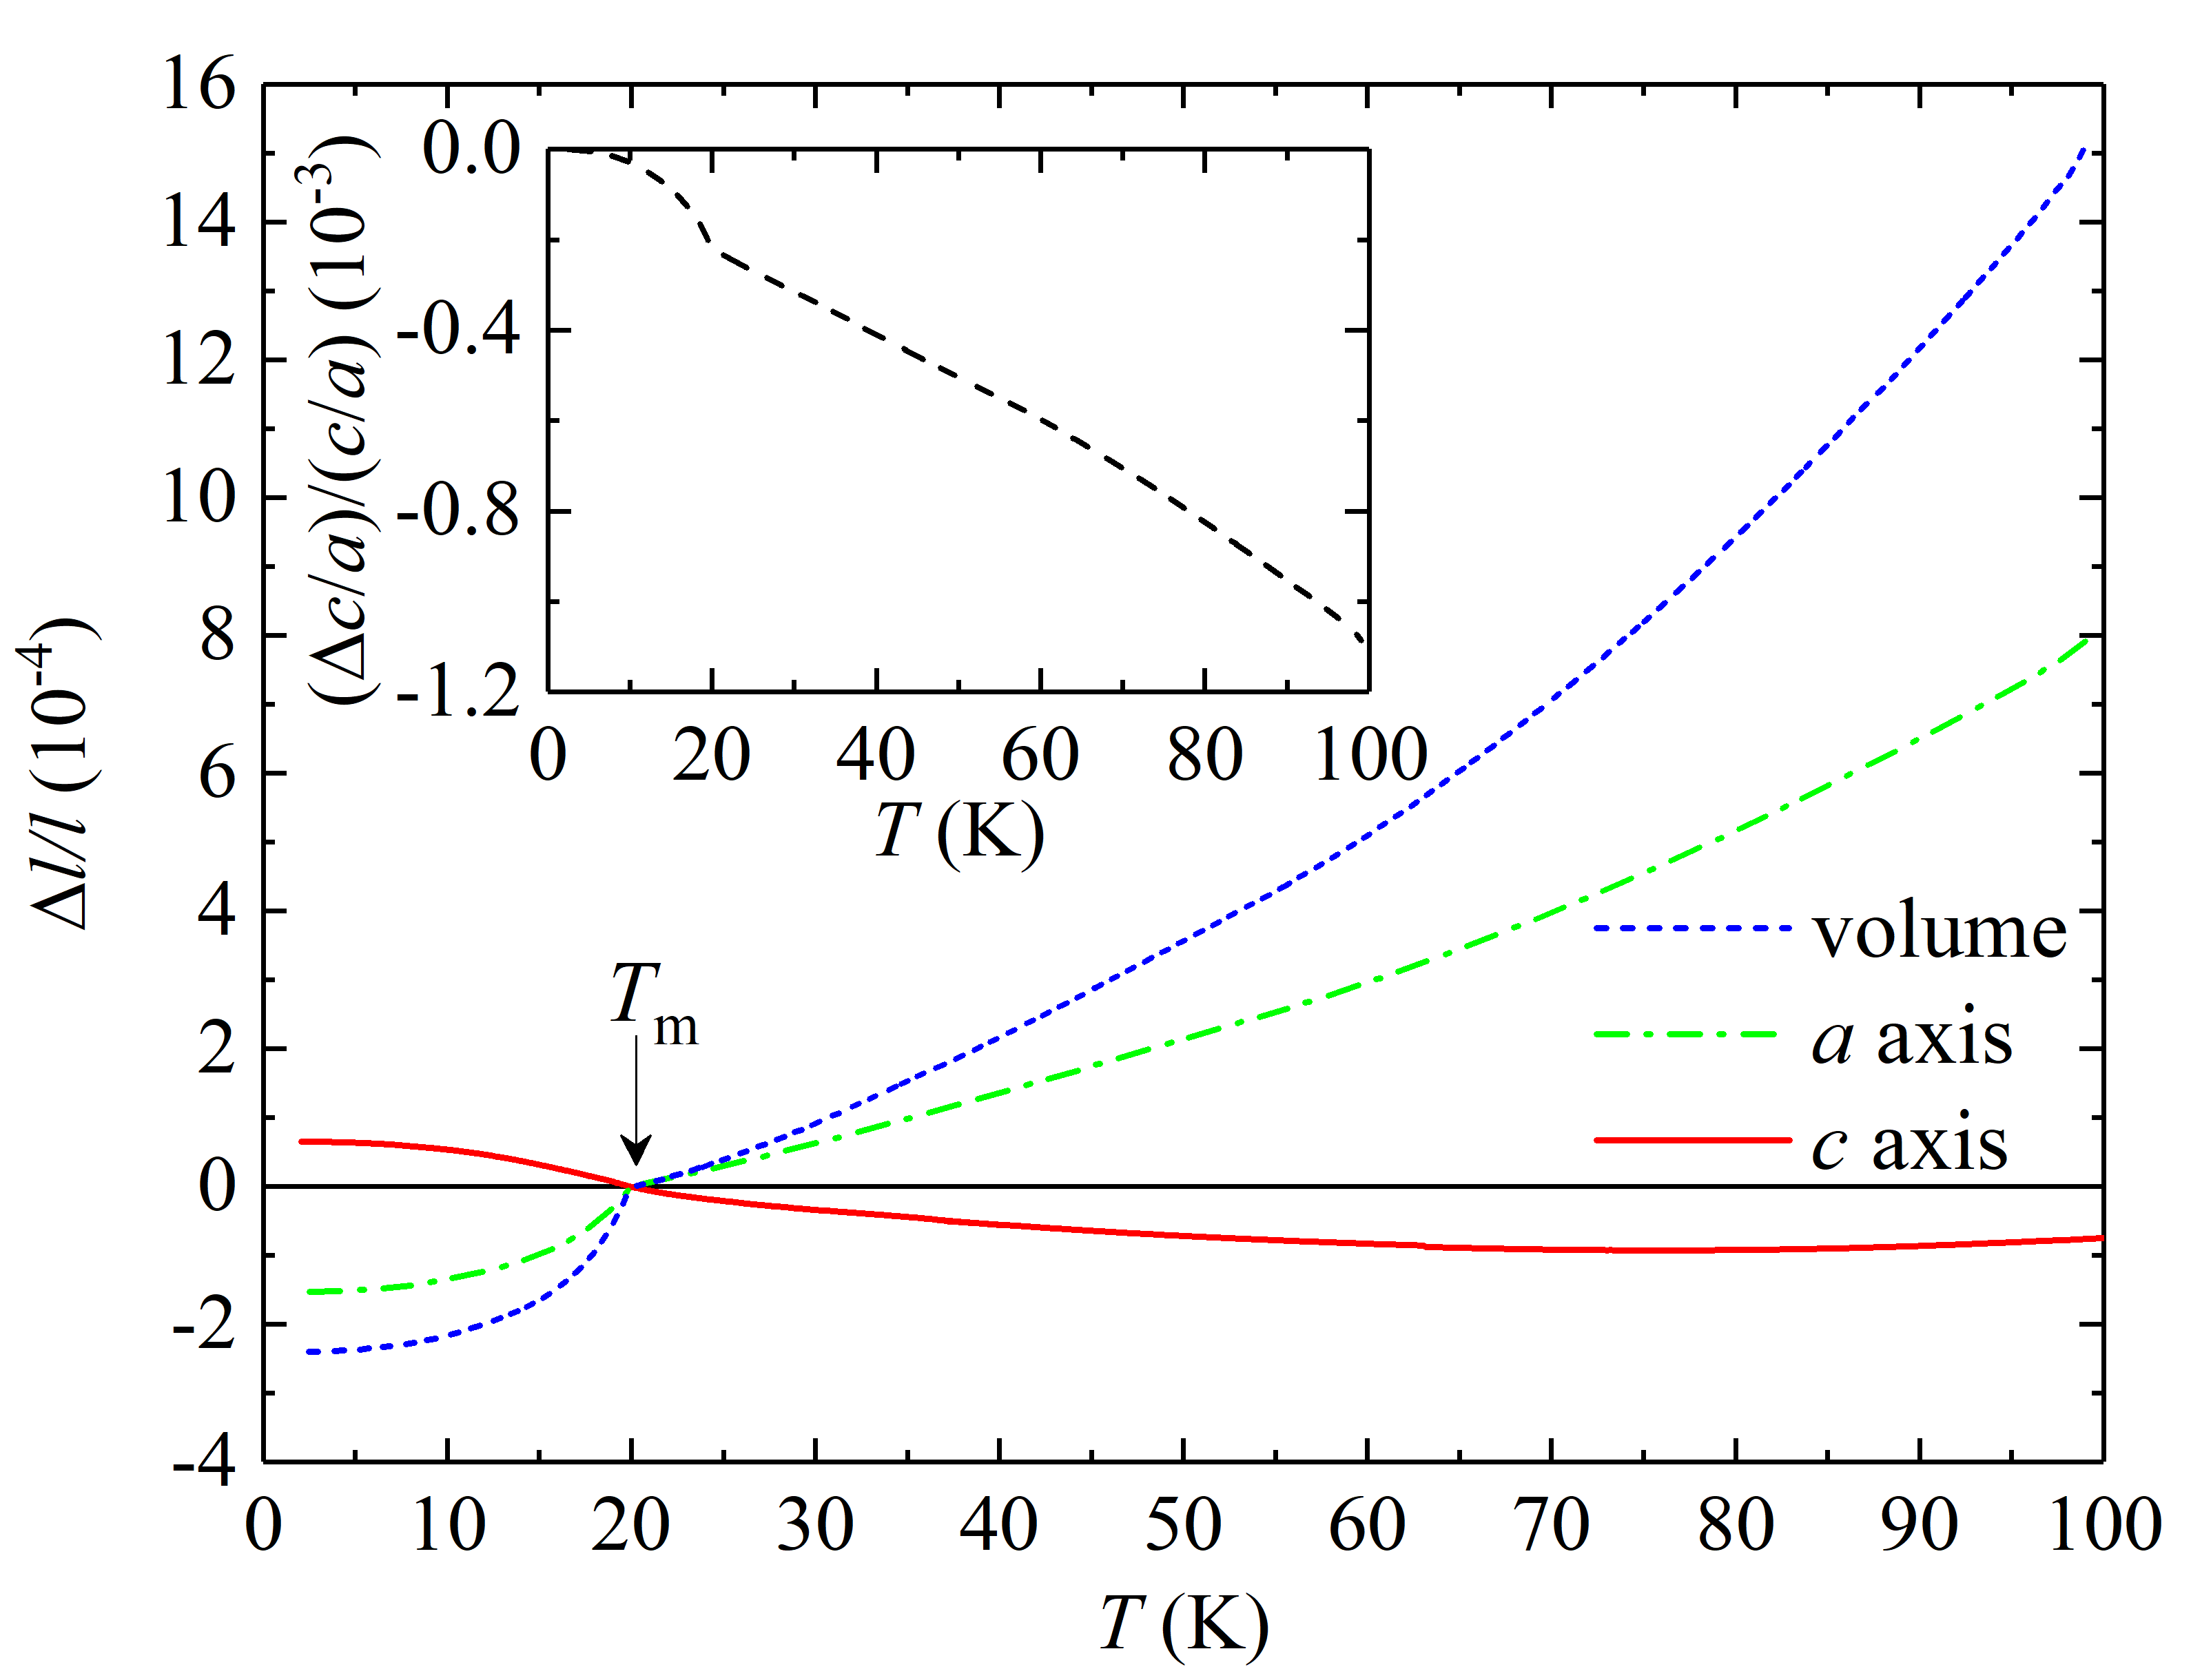
There obviously is a large anisotropy of the thermal expansion over the entire temperature range. The linear thermal expansion along the axis shows a continuous decrease from down to the ordering temperature , where it bends down rapidly pointing at a large contraction of the unit cell along the axis ( between and ). On the other hand, the thermal expansion along the axis shows a broad minimum around followed by an increase at lower temperatures. The ordering temperature appears as an inflection point and the -axis expansion below is . The volume thermal expansion is calculated using Eq. (1). The obtained relative volume change shows a large reduction below ( between and ) as shown in Fig. 1. The continuous character of the linear thermal expansion at points to a second-order transition.
The linear thermal-expansion coefficients are defined as temperature derivatives of the linear thermal expansion , i.e., . The calculated linear thermal-expansion coefficients are plotted in Fig. 2 together with the volume thermal-expansion coefficient defined as . It is also useful to determine the temperature dependence of the ratio. We, therefore, define the following temperature coefficient . Both quantities are plotted in Fig. 2.
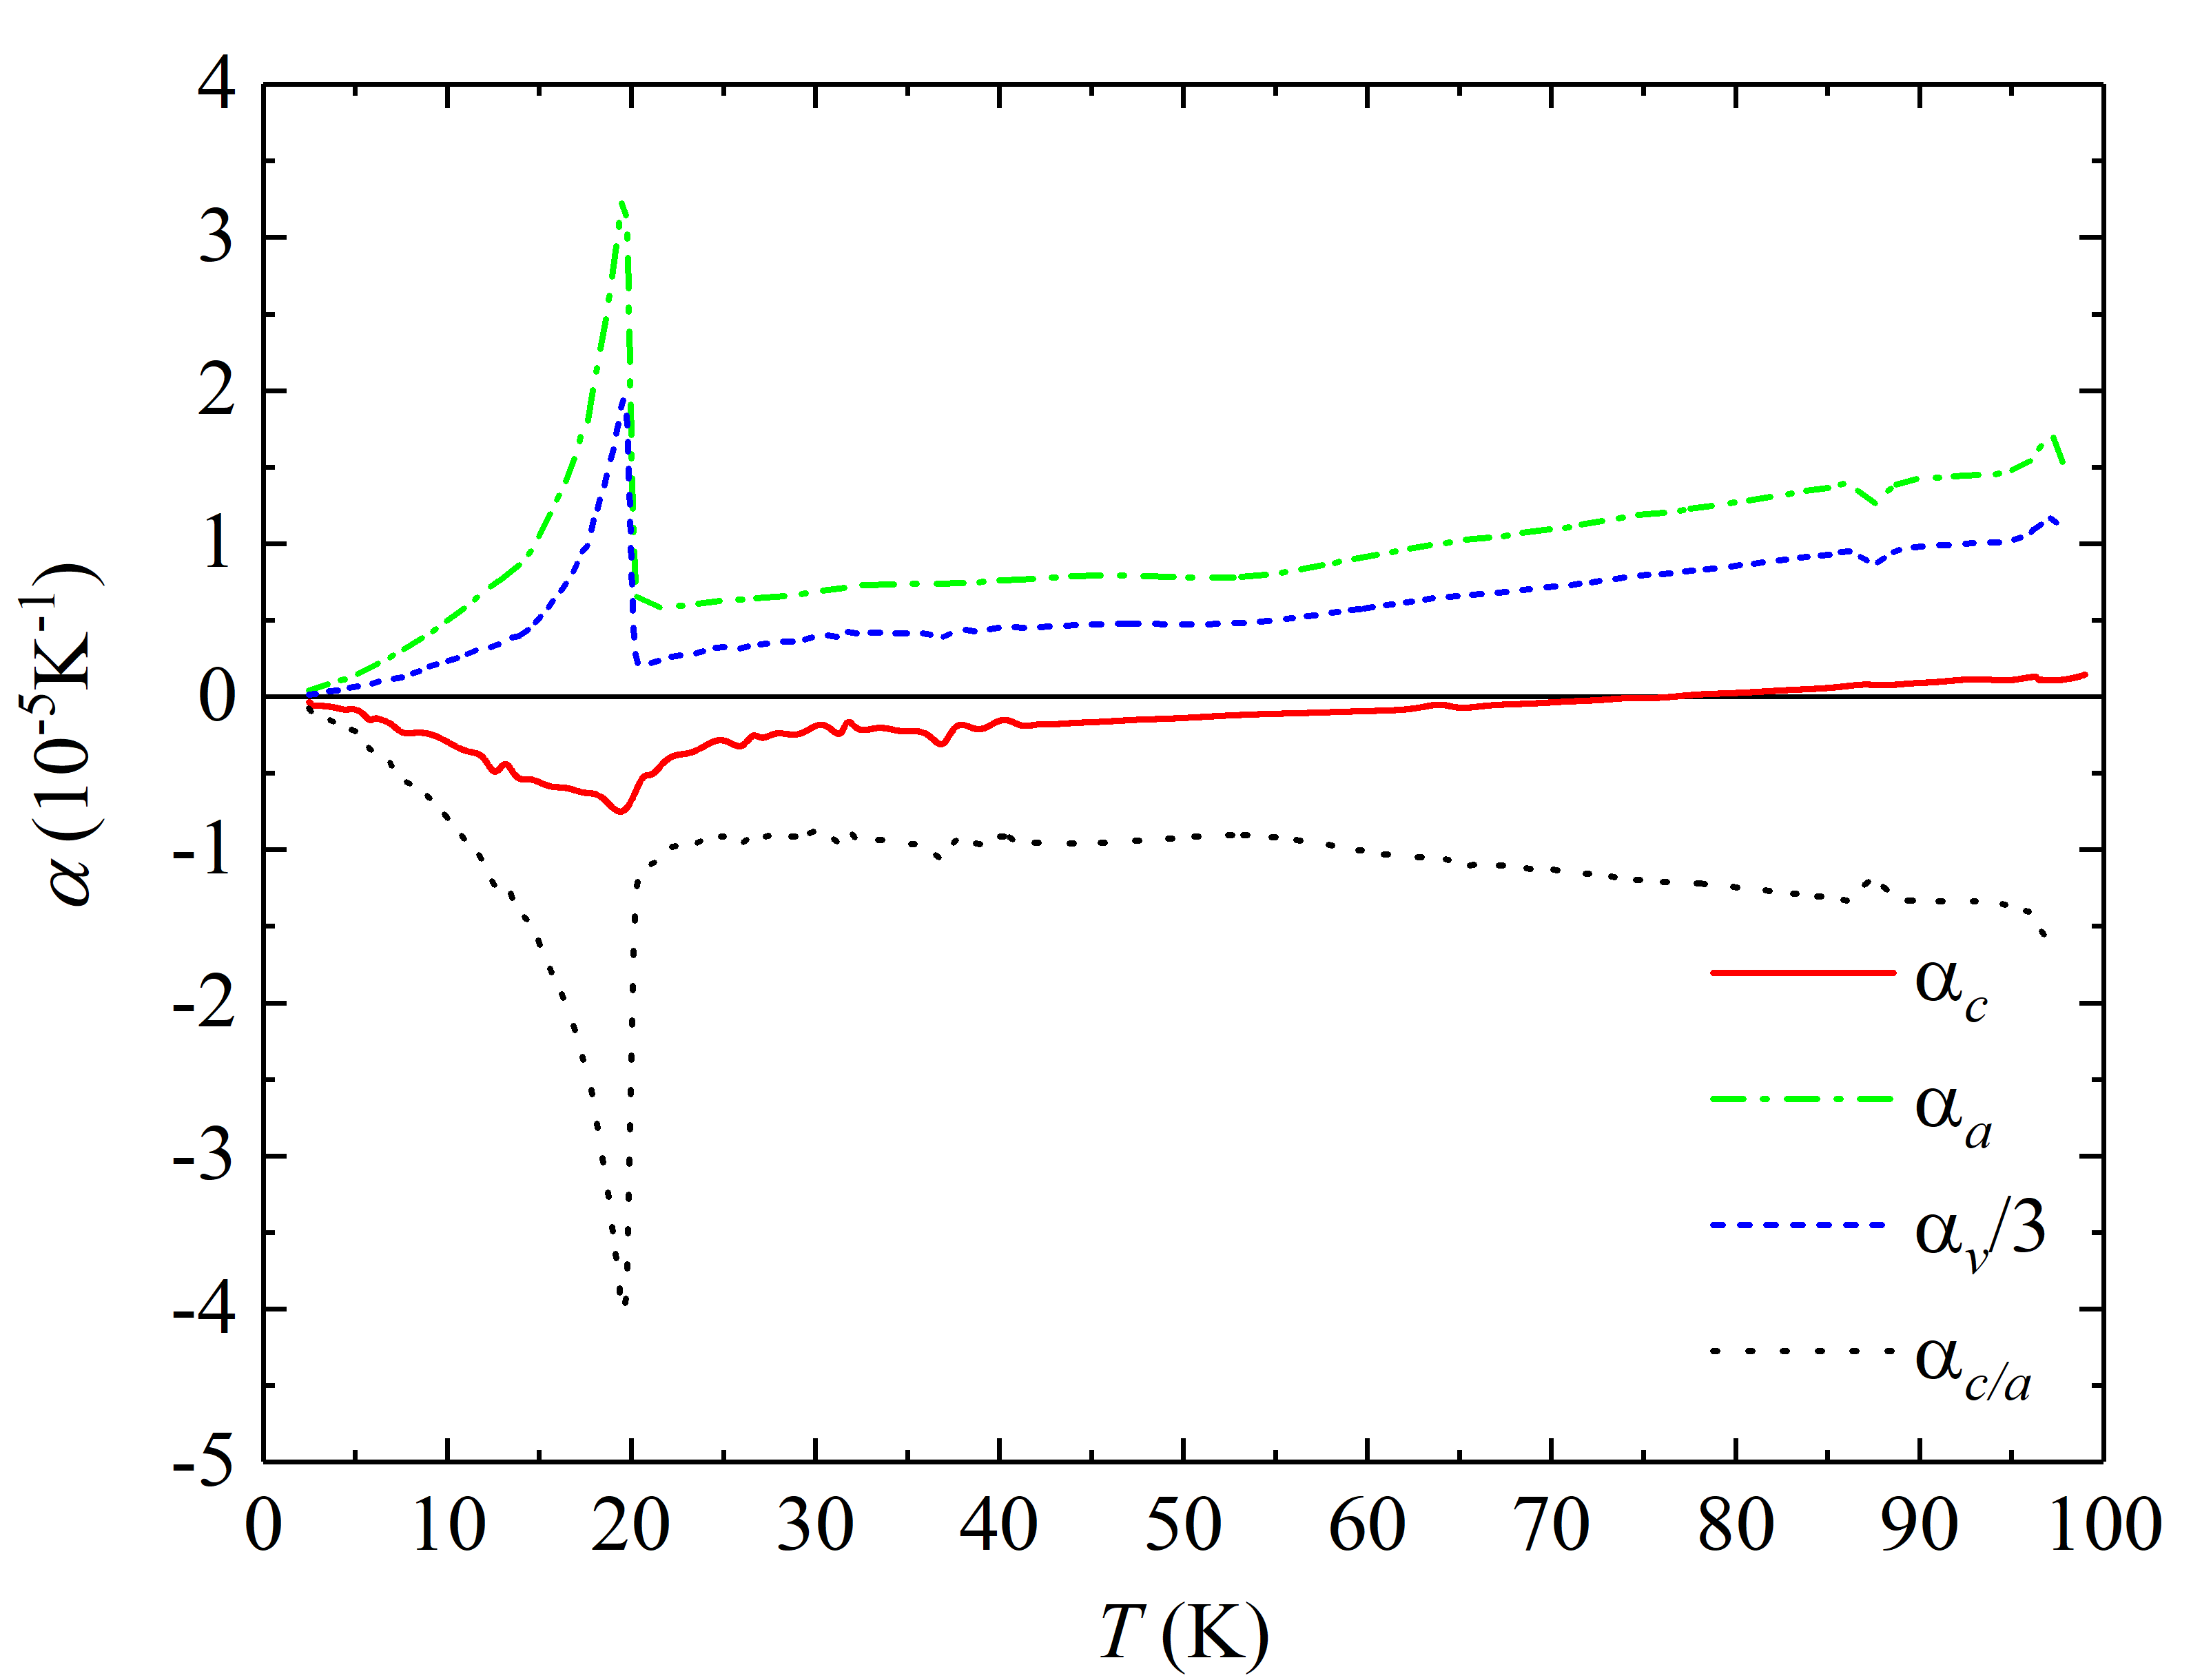
The linear thermal-expansion coefficient for the axis becomes negative below where the minimum of its relative length change occurs. There are sharp peaks at for all measured curves and a small change of the slope above visible in coefficient that is projected in the remaining computed quantities. Integration of the coefficient along the whole temperature range results in the relative temperature dependence of the ratio, see inset in Fig. 1.
The temperature dependence of this ratio is monotonous and decreasing nearly linear above . The slope increases below the , emphasizing again the prominent contraction of the axis.
As will be discussed below, ultra-pure samples of the isostructural compound studied by synchrotron x-ray diffraction show a small orthorhombic distortion when entering the hidden-order state.Tonegawa et al. (2014) The size of the distortion and/or sample quality are possible reasons why it was not observed by the thermal-expansion measurements. de Visser et al. (1986); Kuwahara et al. (1997)
In order to test the presence of a lattice distortion in we measured the thermal expansion also along the axis and 111we use Miller indices notation for this direction for its self-explanatory meaning, while for simplicity and are used for the and directions, respectively throughout the whole paper direction. The corresponding thermal expansions and the linear thermal-expansion coefficients are plotted in Fig. 3.
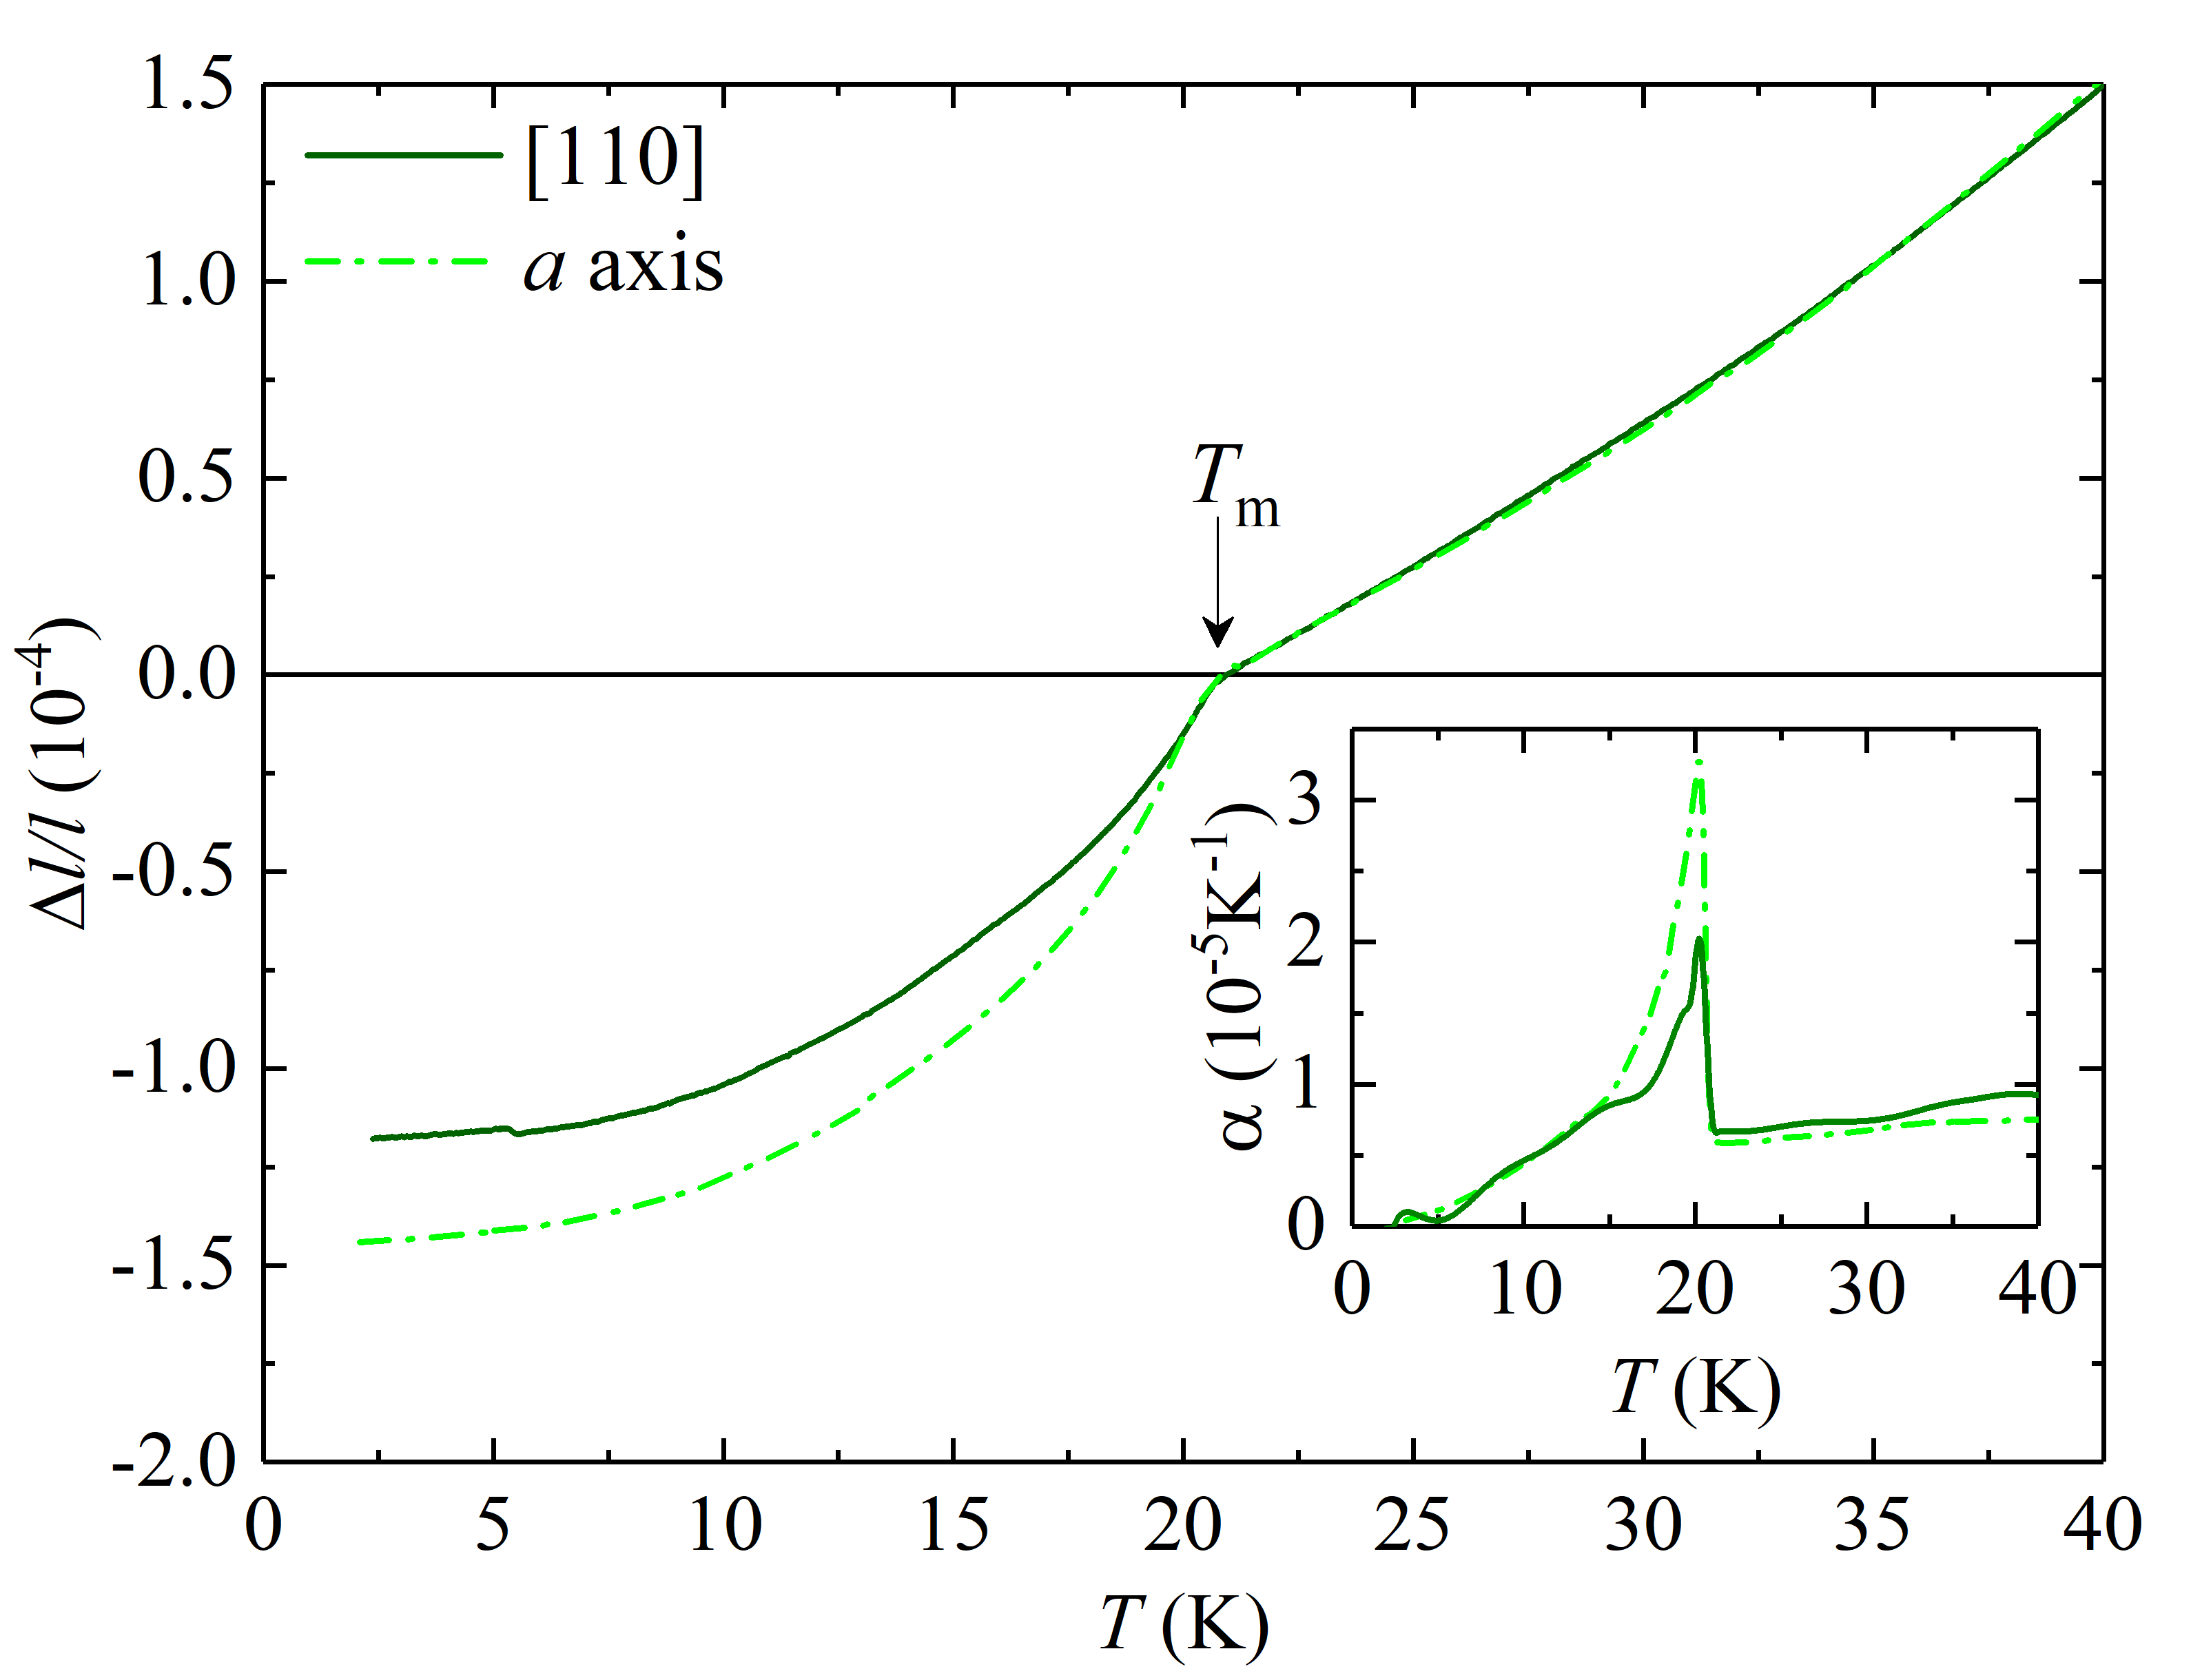
If the fourfold rotational symmetry of the tetragonal structure of in the UAFM phase can be broken similar to the case of isostructural the crystal structure itself is expected to have an orthorhombic distortion, lowering the space symmetry. For the space group, two subgroups and may have such orthorhombic distortions, but the plane primitive vector direction is rotated by 45° (Ref. Tonegawa et al. (2014)). This behavior is not seen in a macroscopic sample in ambient condition owing to the formation of domains. A small uniaxial pressure applied on multiple domains may change the domain structure towards an orthorhombic monodomain state so that the distortion may be indicated also macroscopically as suggested in case of .Kambe et al. (2013a) That is probably why we could observe the distortion in our dilatometer which exerts a slight uniaxial pressure along the direction of measurement.
The thermodynamic relation for second-order phase transitions known as Ehrenfest relation allows us to estimate the pressure dependence of the ordering temperature based on the jumps in the specific heat and the thermal-expansion coefficient at . It is defined as
| (2) |
and it can serve as an estimation for the hydrostatic-pressure dependence using the volume thermal-expansion coefficient , or for the uniaxial pressure dependences when the linear thermal-expansion coefficients or are used. The jumps of the thermal-expansion coefficients at and the corresponding hydrostatic-pressure and uniaxial-pressure derivatives of predicted using Eq. (2) are shown in Table 1.
| 2 . | 7(1) | ||
| -0 . | 44(1) | ||
| Volume | 4 . | 9(1) | |
III.2 Specific-heat, magnetization and magnetostriction measurements
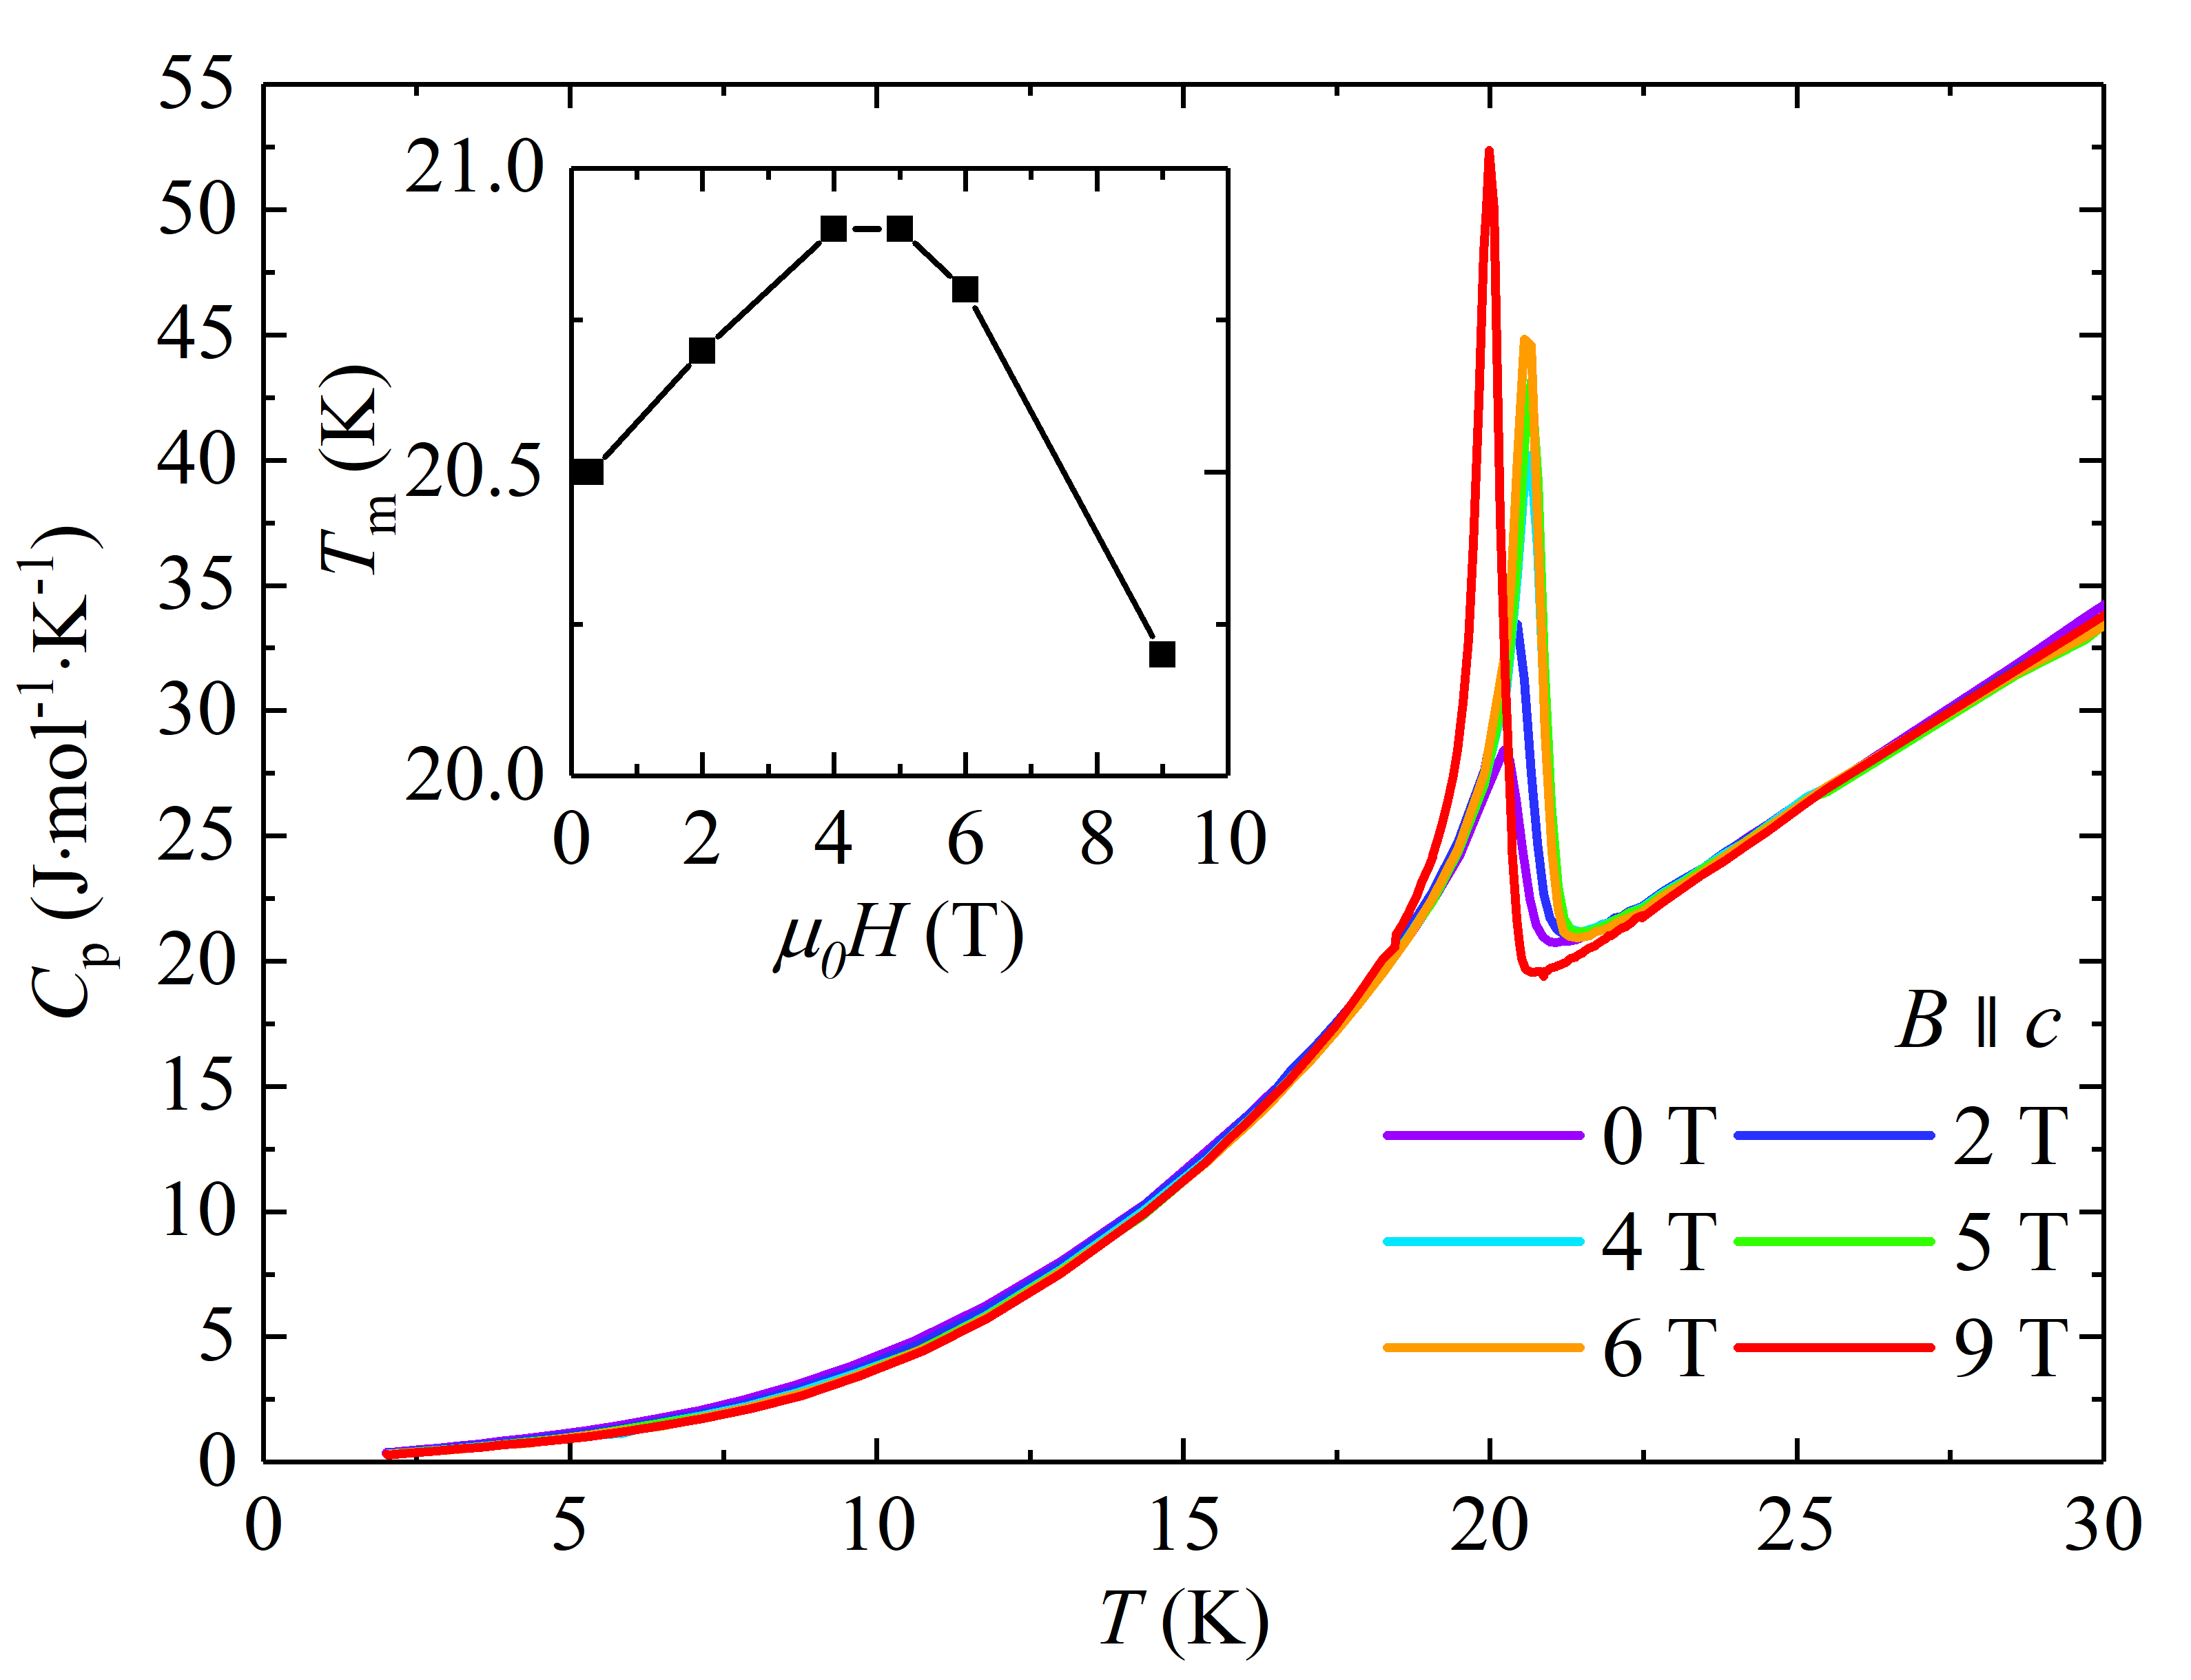
First we measured temperature dependences of specific-heat in various magnetic fields applied along the axis. In Fig. 4 we can indeed see that increases with magnetic field up to reaching the maximum value between and and then decreasing with further increasing the field.
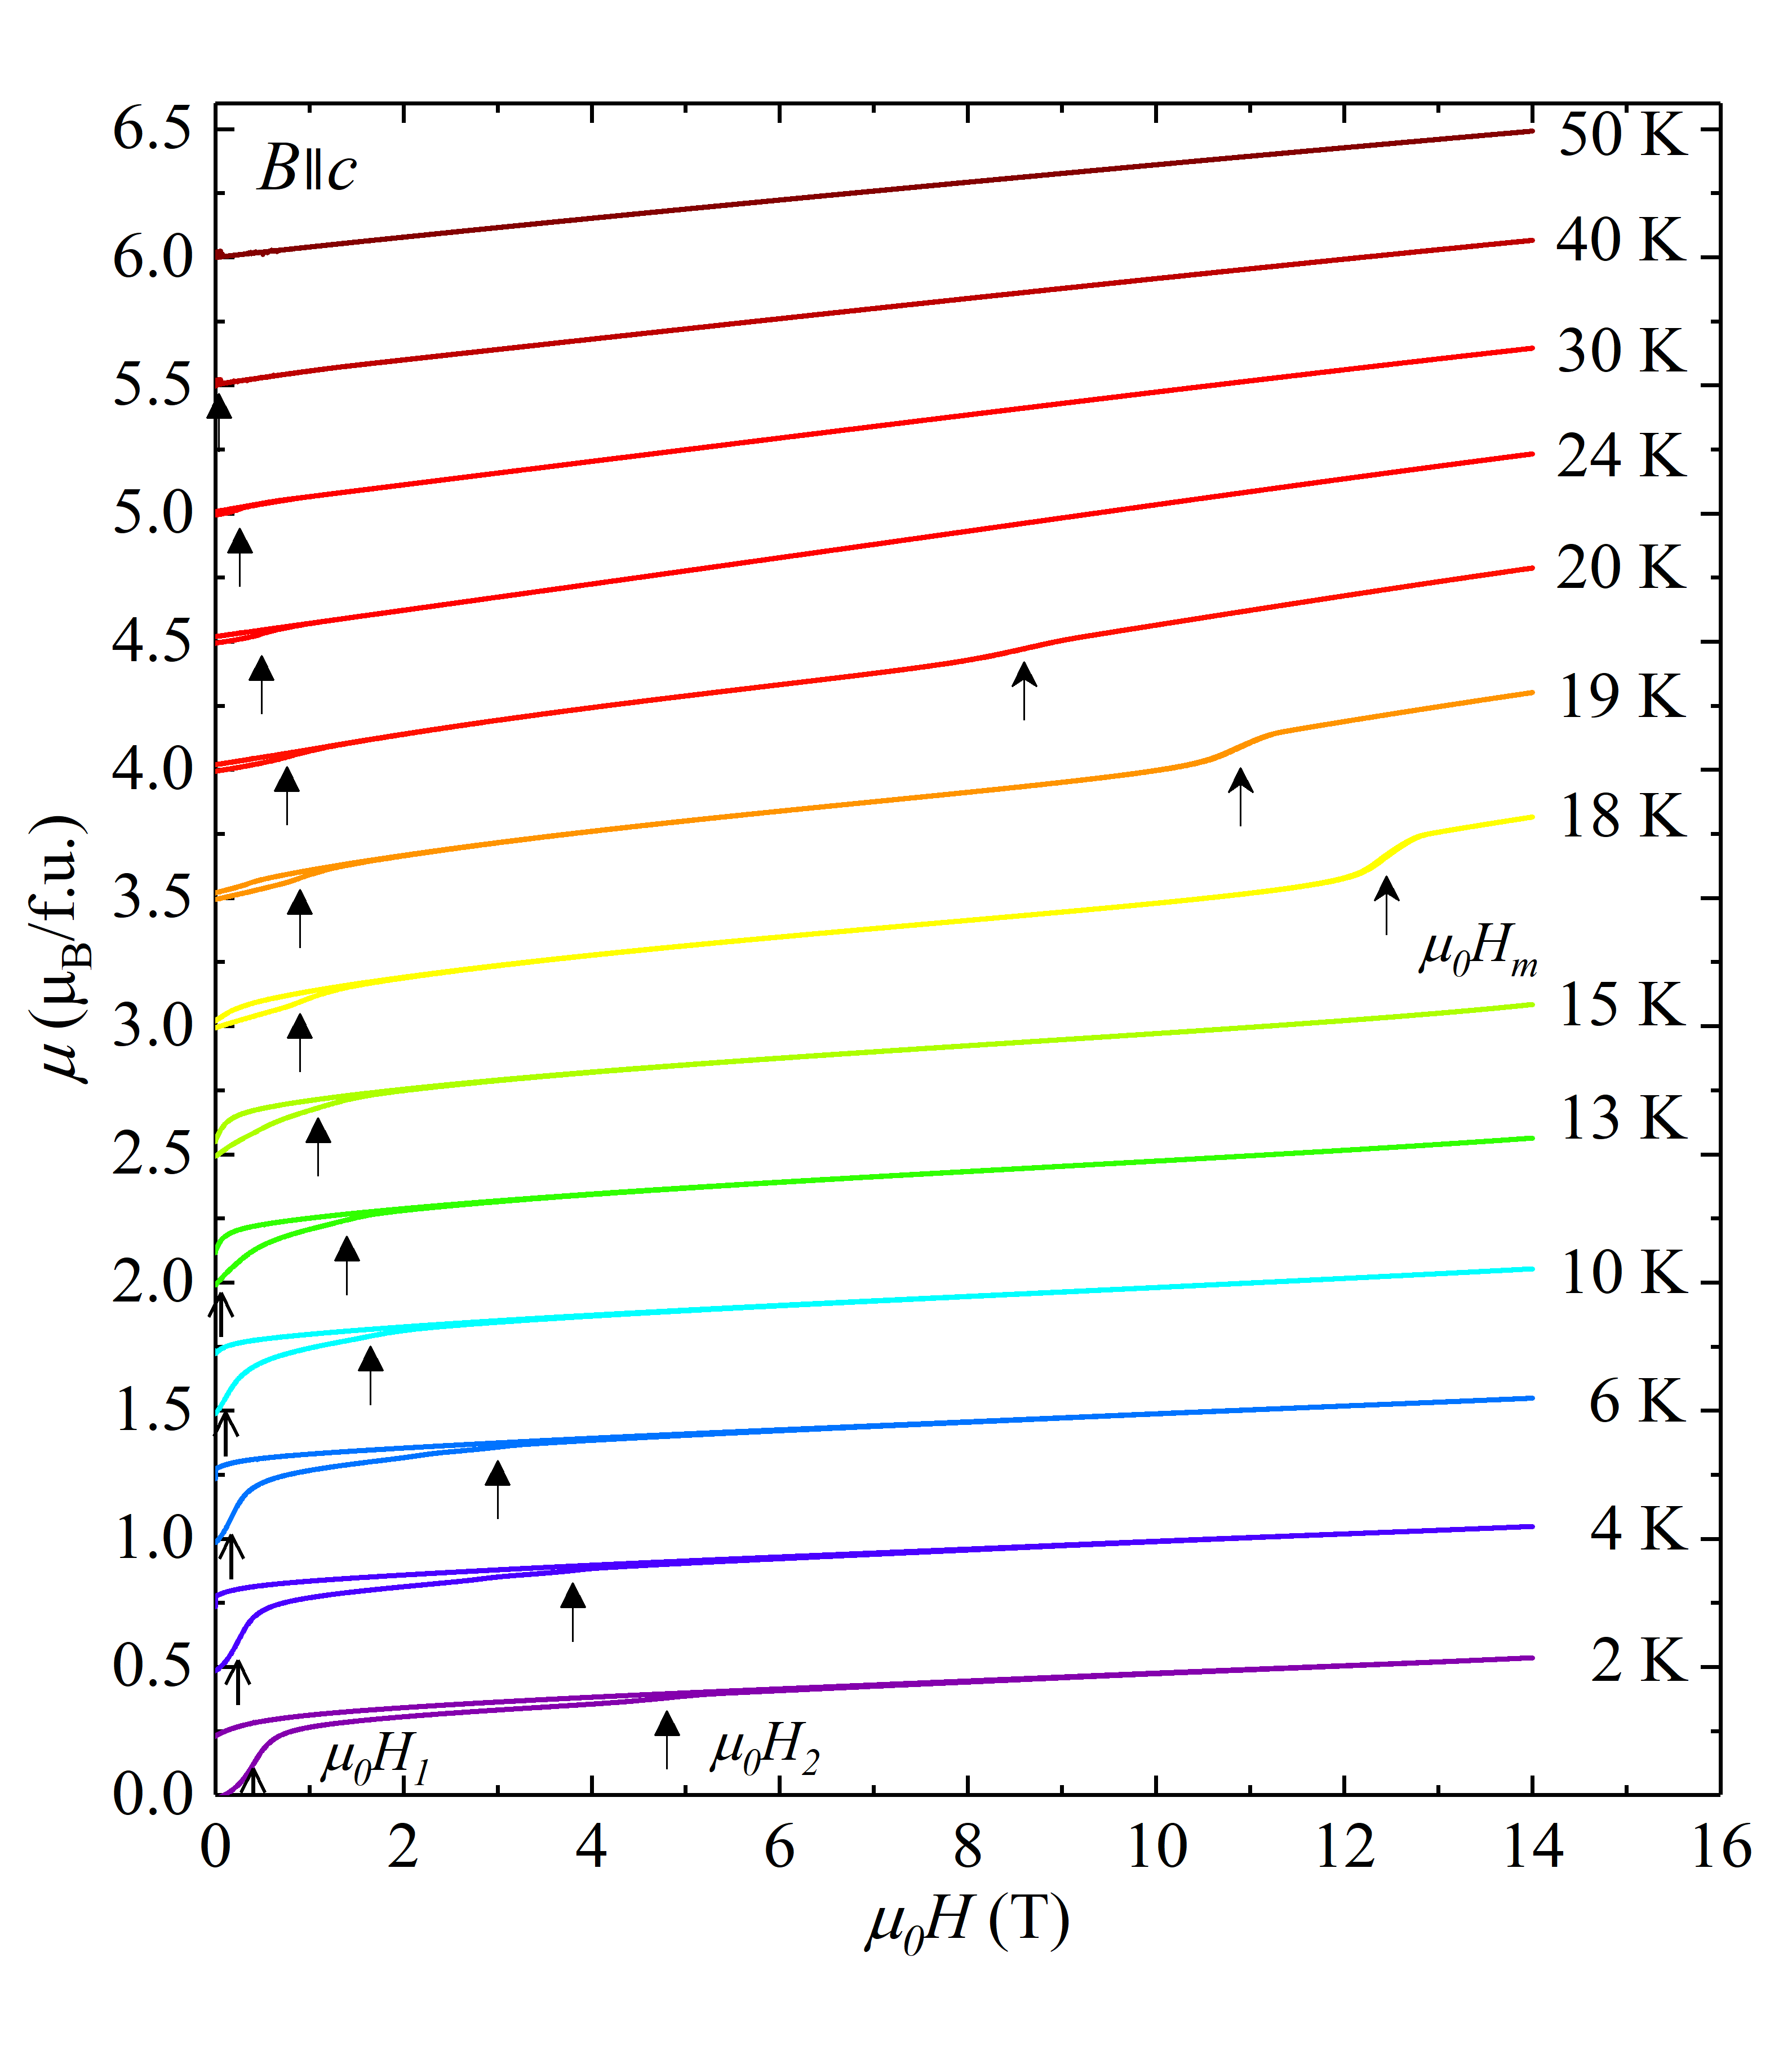
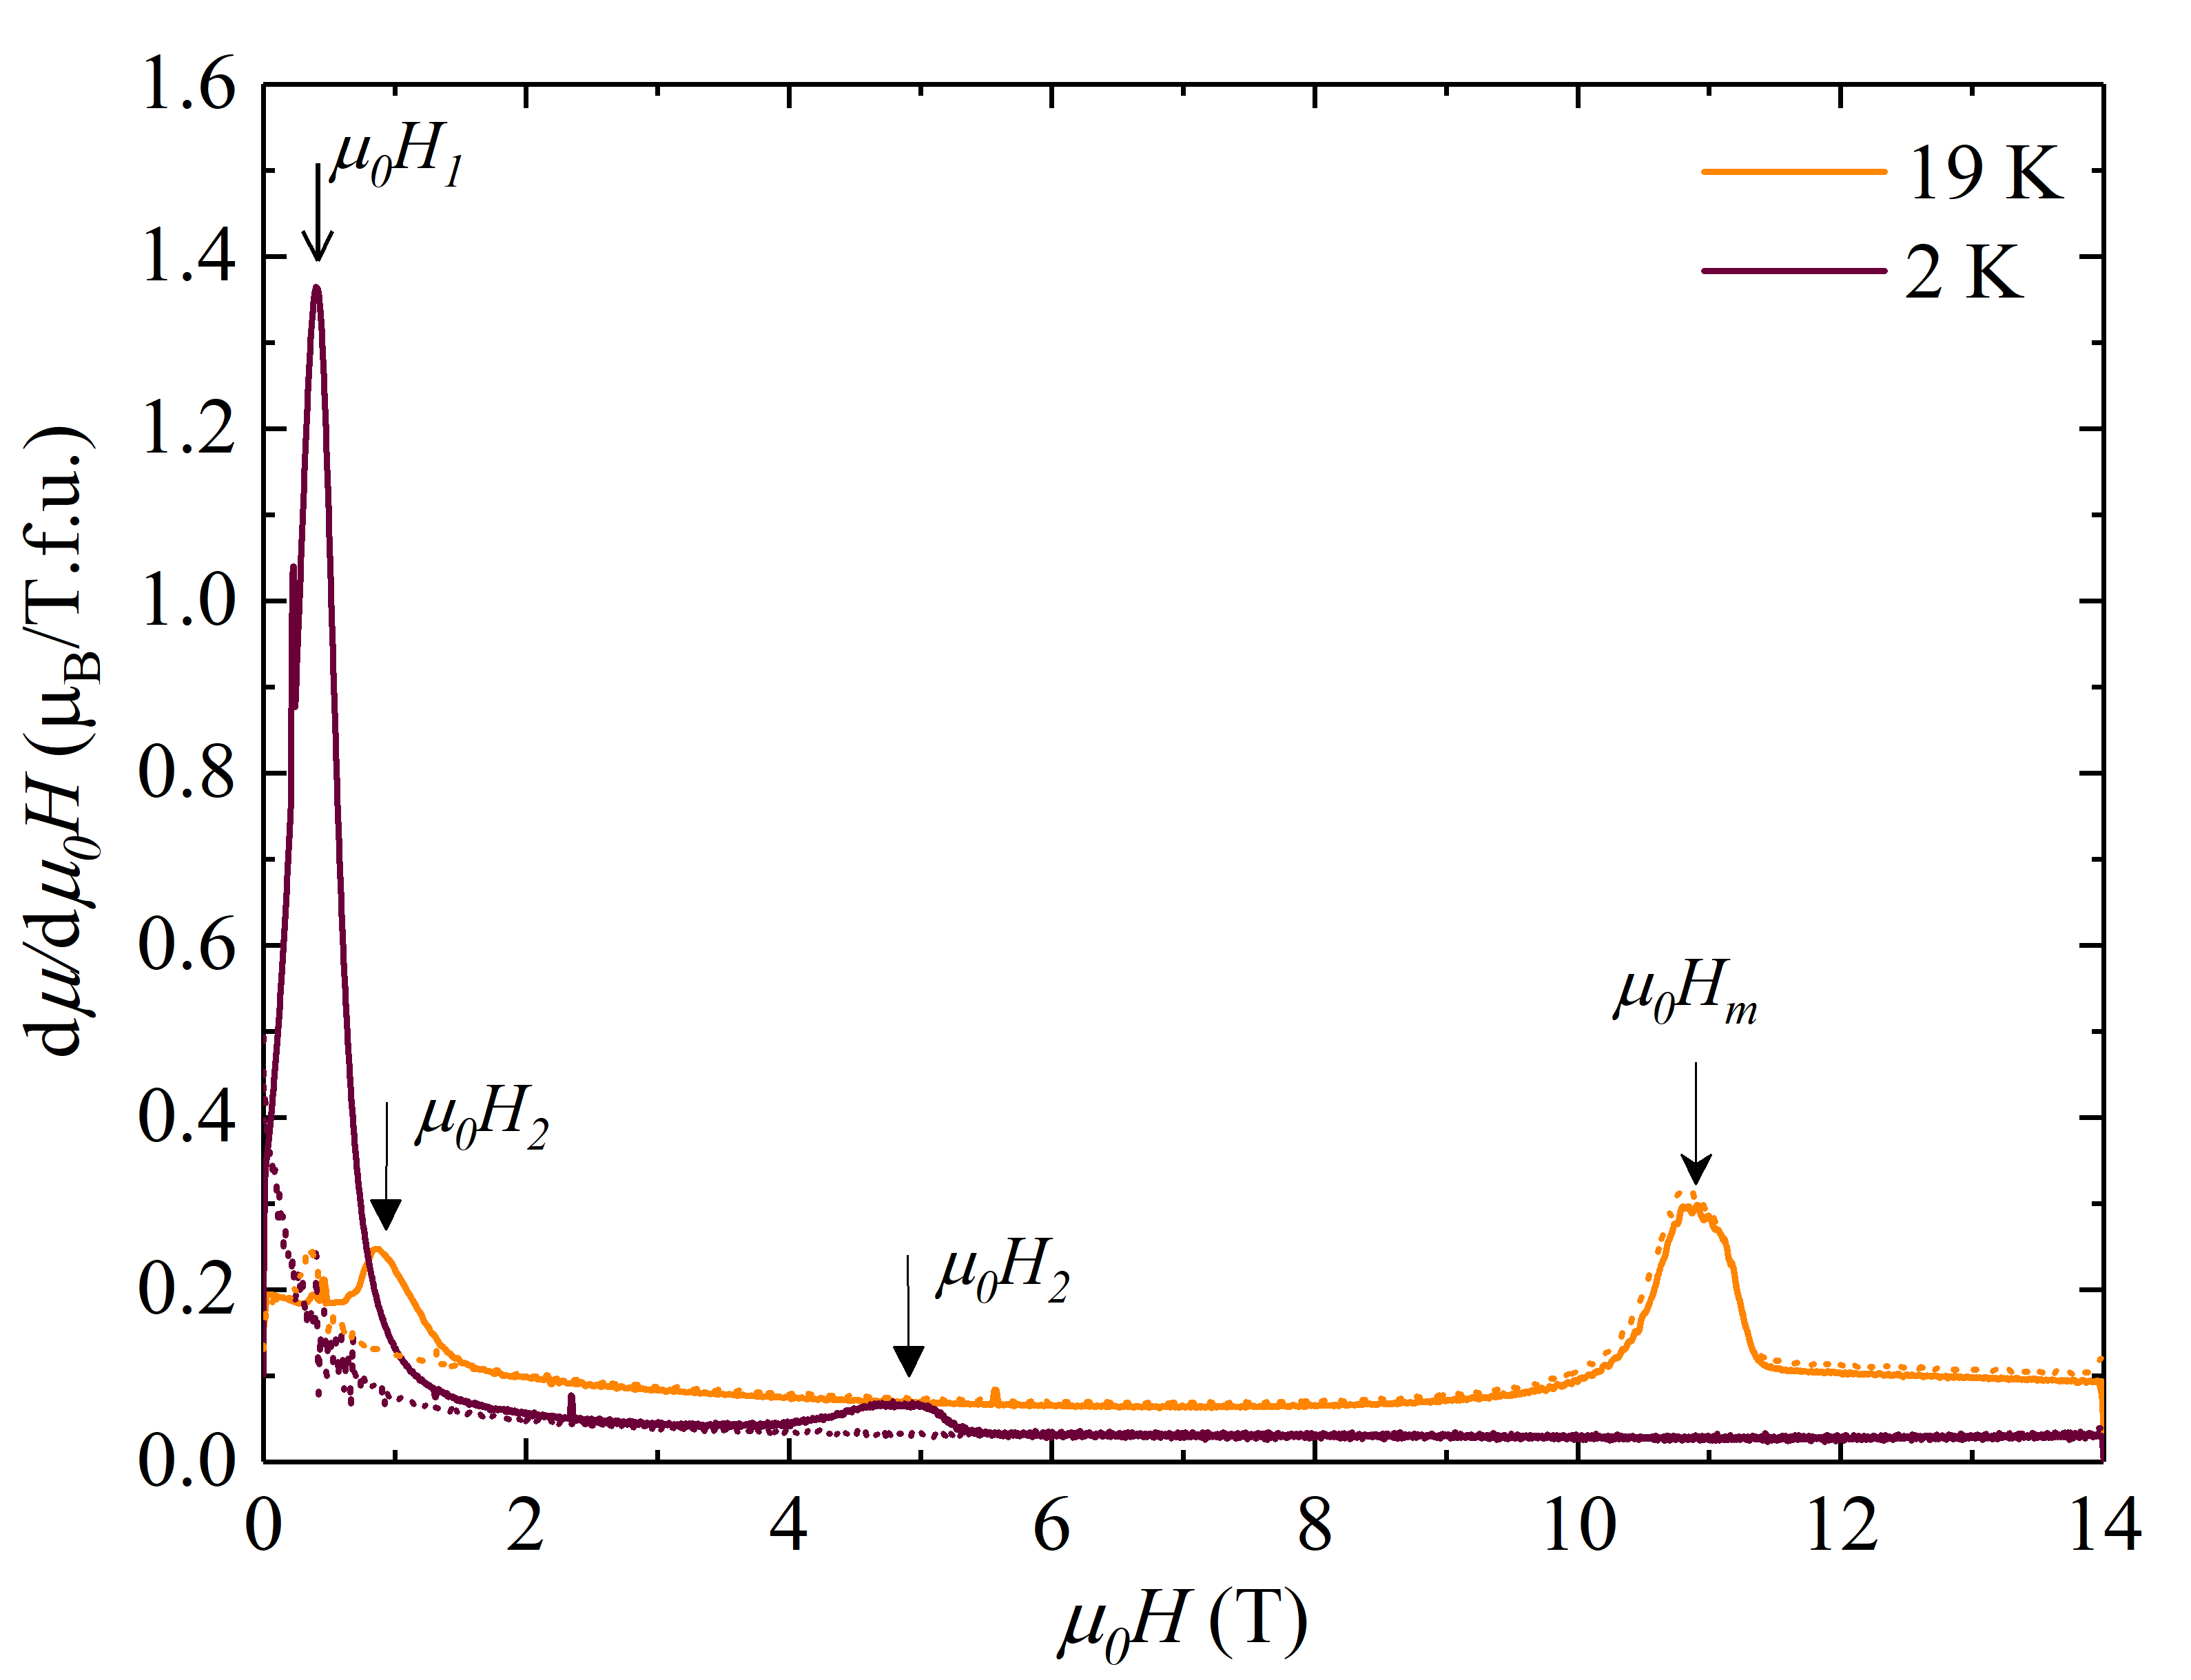
The magnetization was measured at various temperatures from to as function of magnetic field up to applied along the axis. This was followed by high-field measurements in pulsed magnetic fields up to . The results are shown in Fig. 5. The magnetization data up to show a low-field inflection point in the hysteretic part of the curve labeled as . Another step-like feature is present at higher field and is labeled as . Unlike the low-field transition, the anomaly can be traced to temperatures above and is clearly distinguishable even at . We have discussed this behavior in Ref. Tabata et al. (2016), especially in the parts connected with Figures 11, 18-20. Two components apparently coexist at temperatures below : a) a very weak ferromagnetic one which emerges around with cooling; its coercive field increases with decreasing temperature and exceeds at , b) an uncompensated AFM one (UAFM) with a considerably larger spontaneous magnetization but a much smaller coercive field . The magnetization isotherms in the vicinity of show another field-induced step-like transition at higher fields. Similar transitions were observed in our previous work on a different single crystal.Tabata et al. (2016) There, the anomalies labeled as were, however, much less pronounced probably due to lower crystal quality. The values of characteristic fields at different temperatures have been determined using plots of vs. shown in Fig. 6 for results at and .
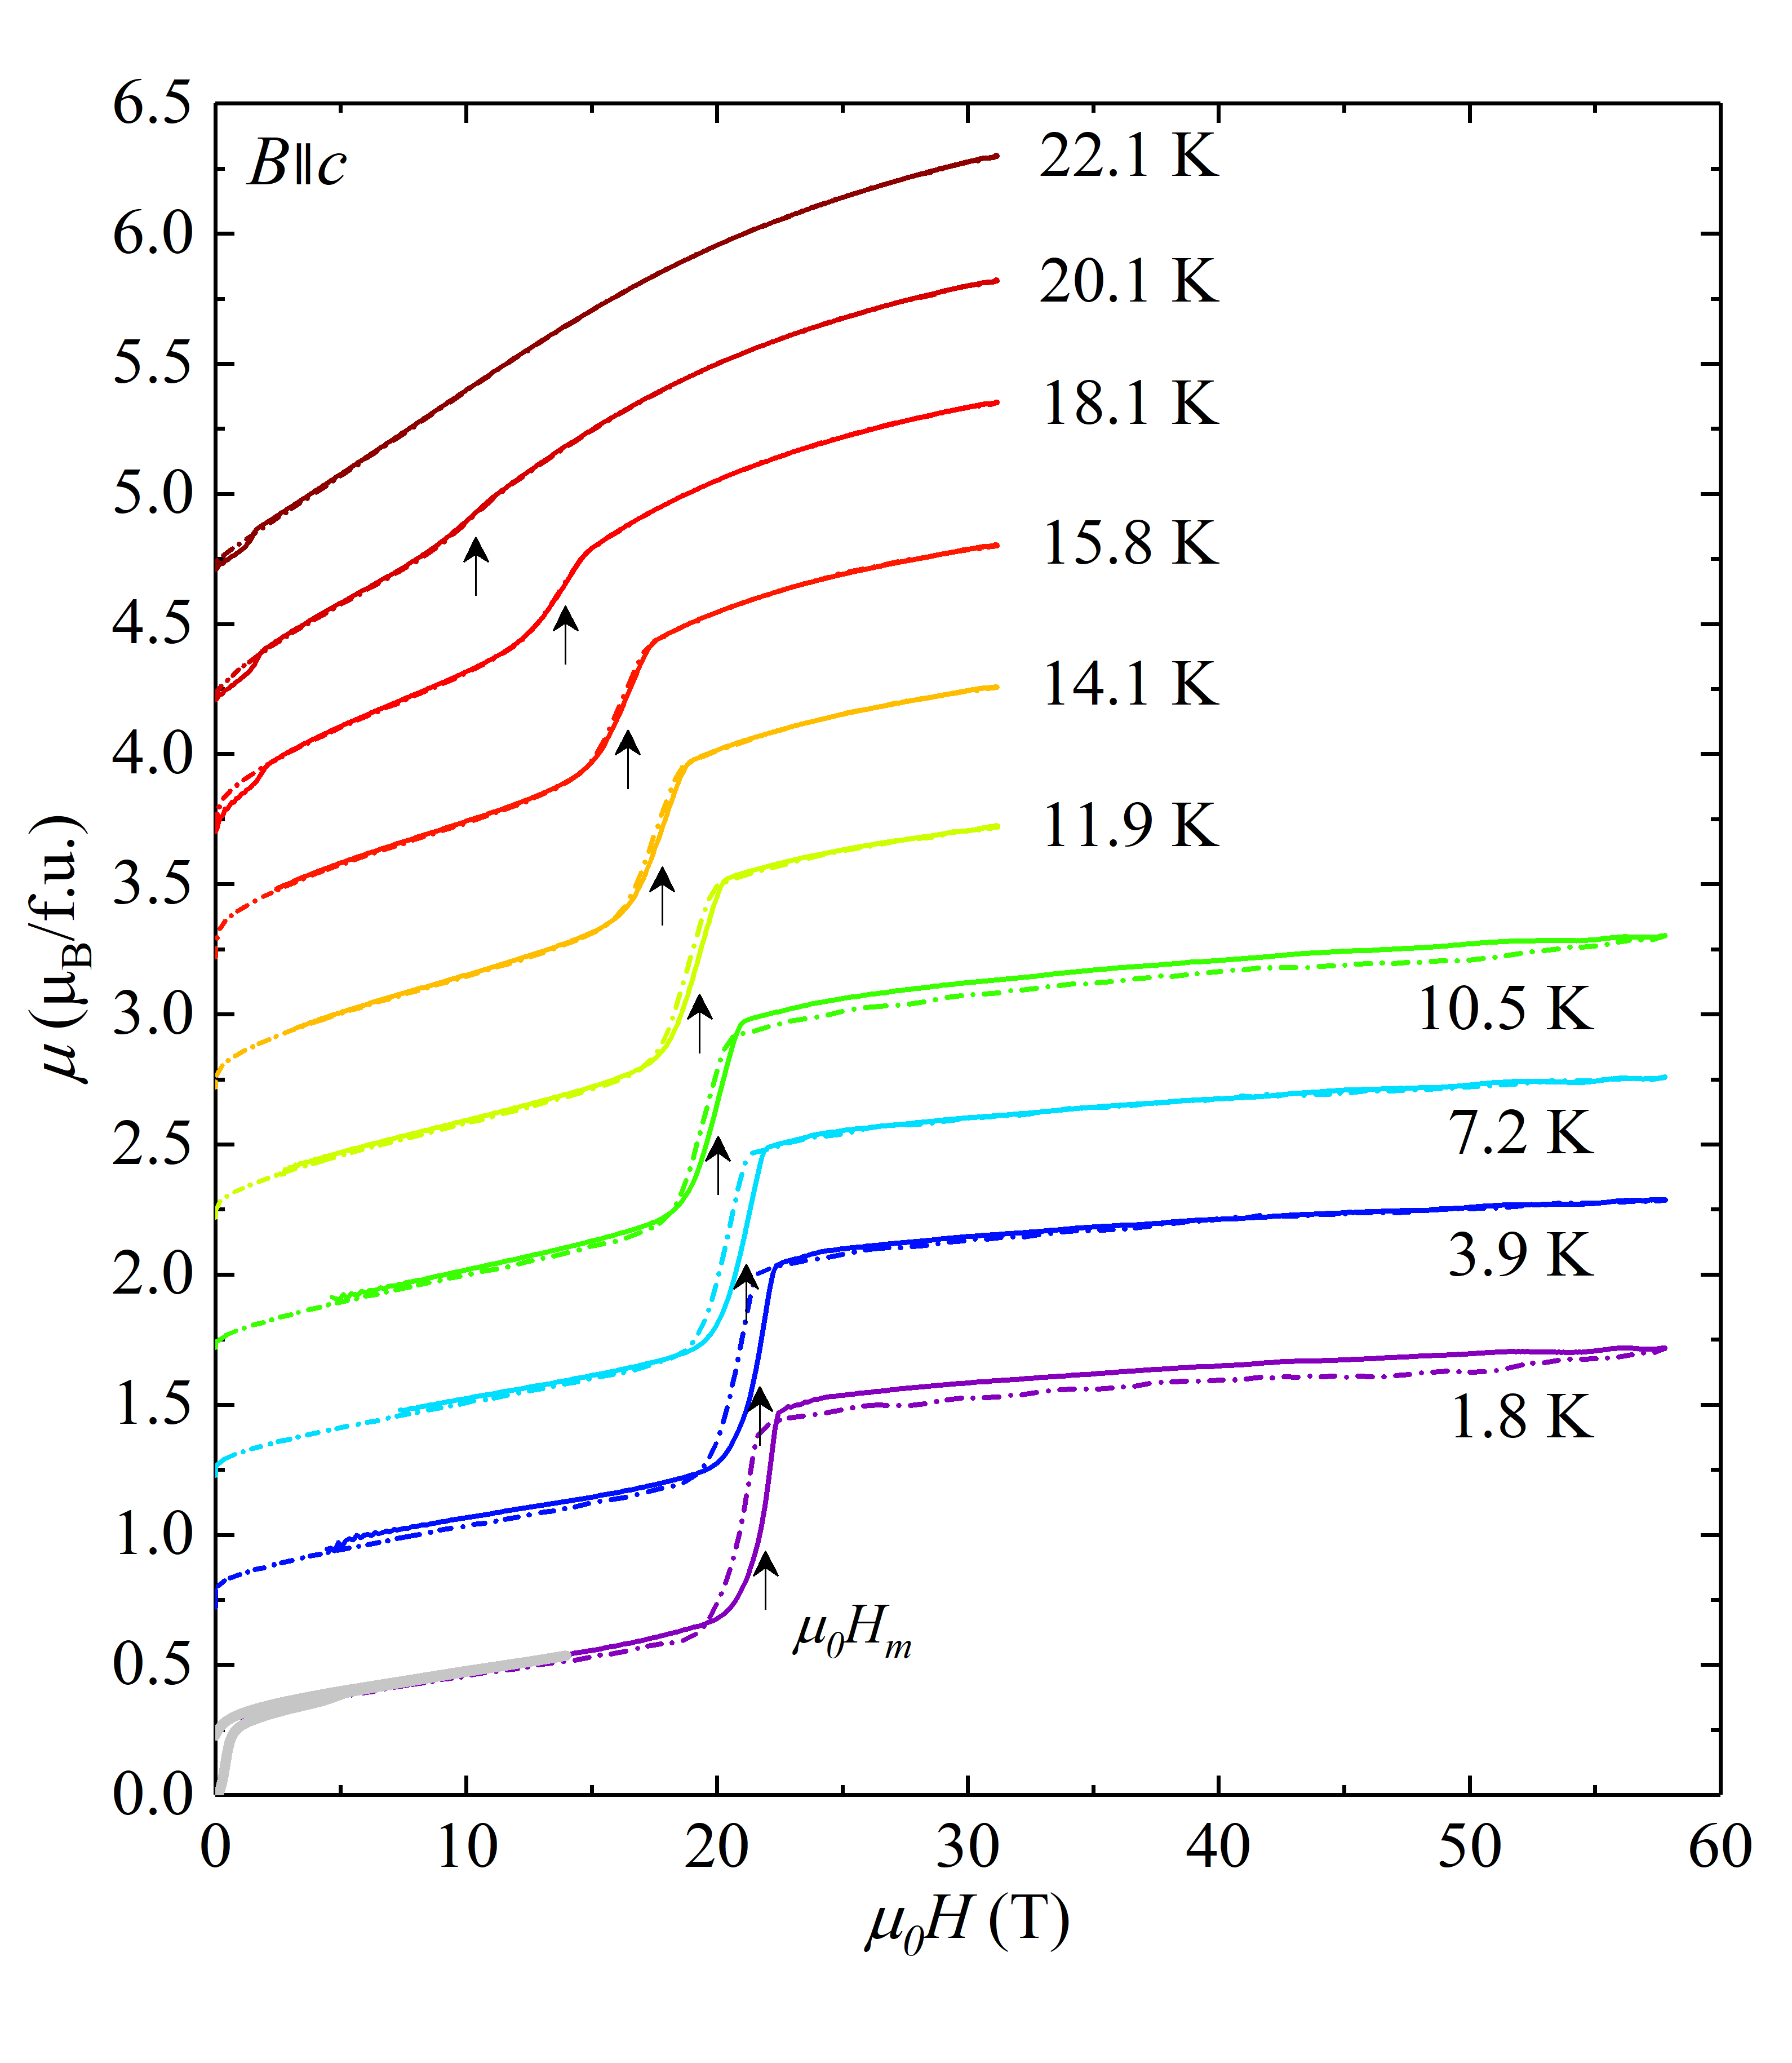
Further magnetization measurements in pulsed fields were performed to track the metamagnetic transition . The measured magnetization was scaled using the static-field data obtained at and a small linear background was subtracted to give the correct absolute values. Results of the high-field measurement are plotted in Fig. 7. A clear metamagnetic transition at is visible on all measured isotherms up to . The metamagnetic transition is most probably of spin-flip typeStryjewski and Giordano (1977) as one would expect for the system with large magnetocrystalline anisotropy. The low-temperature curves also show significant hystereses () between the up and down sweeps. The hysteresis narrows with increasing temperature and disappears around when . The temperature dependence of is shown in Fig. 12.
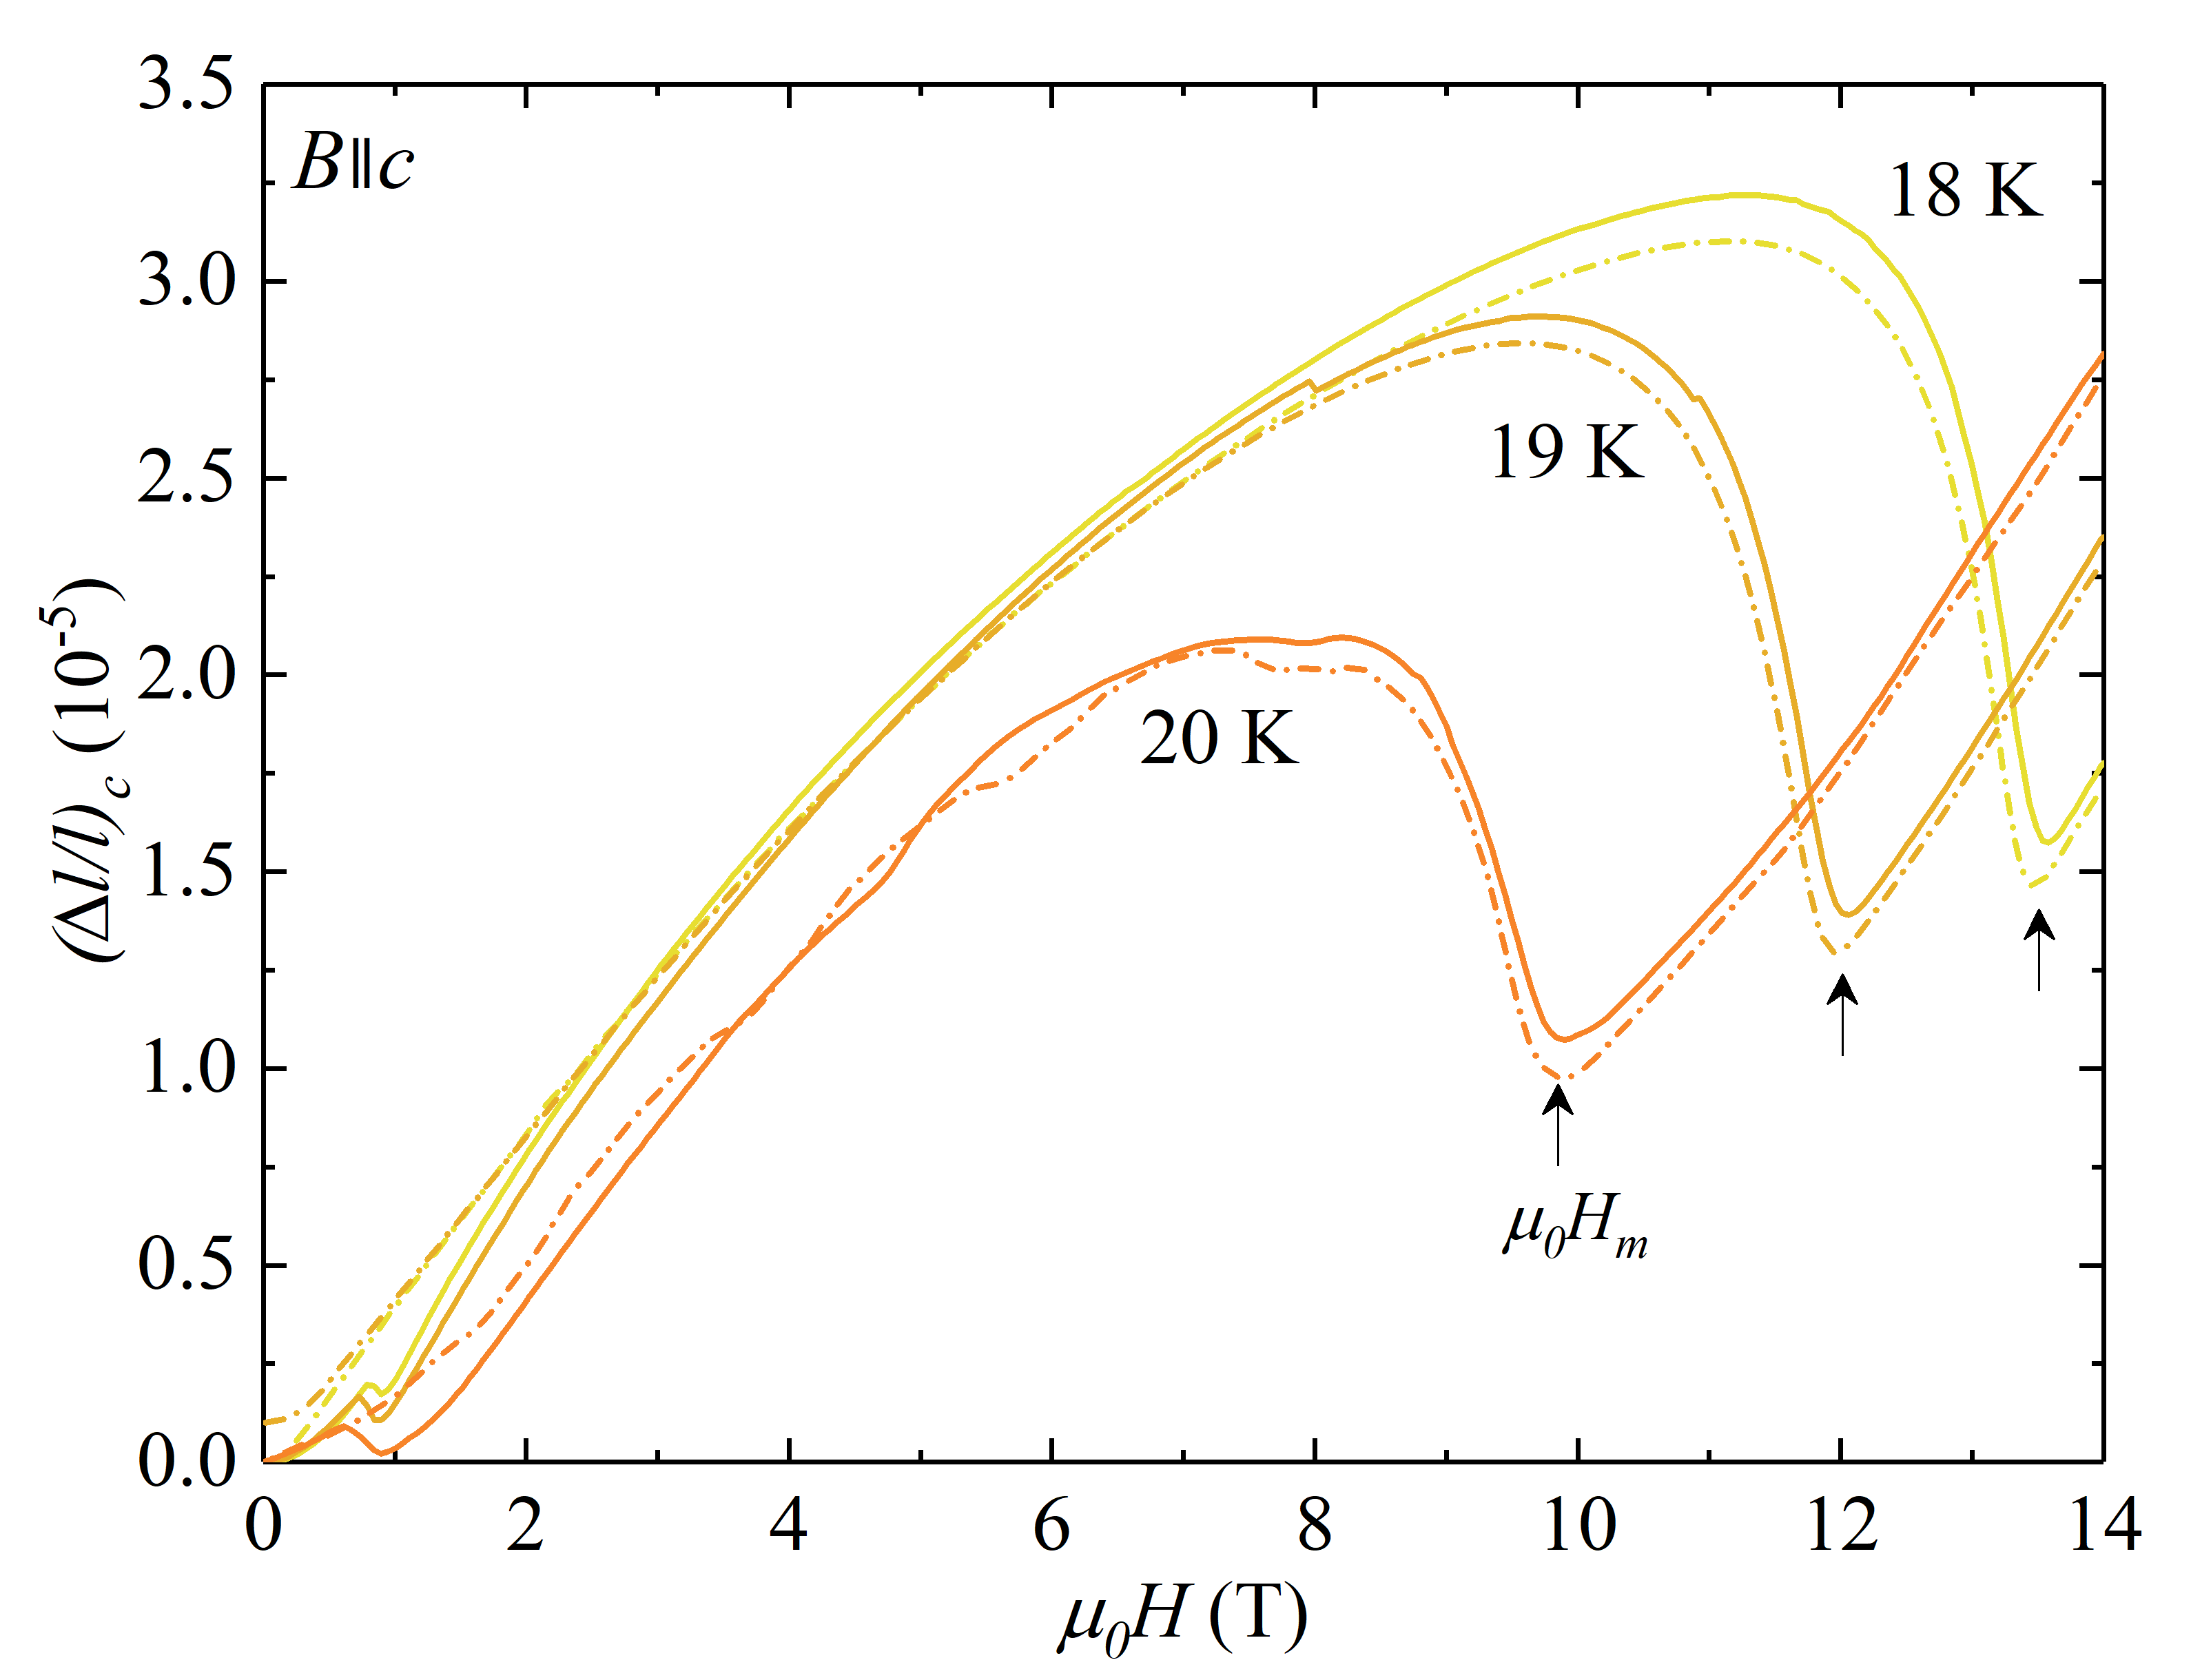
The longitudinal magnetostriction was measured at various temperatures with magnetic fields up to applied along the tetragonal axis, see Fig. 8.
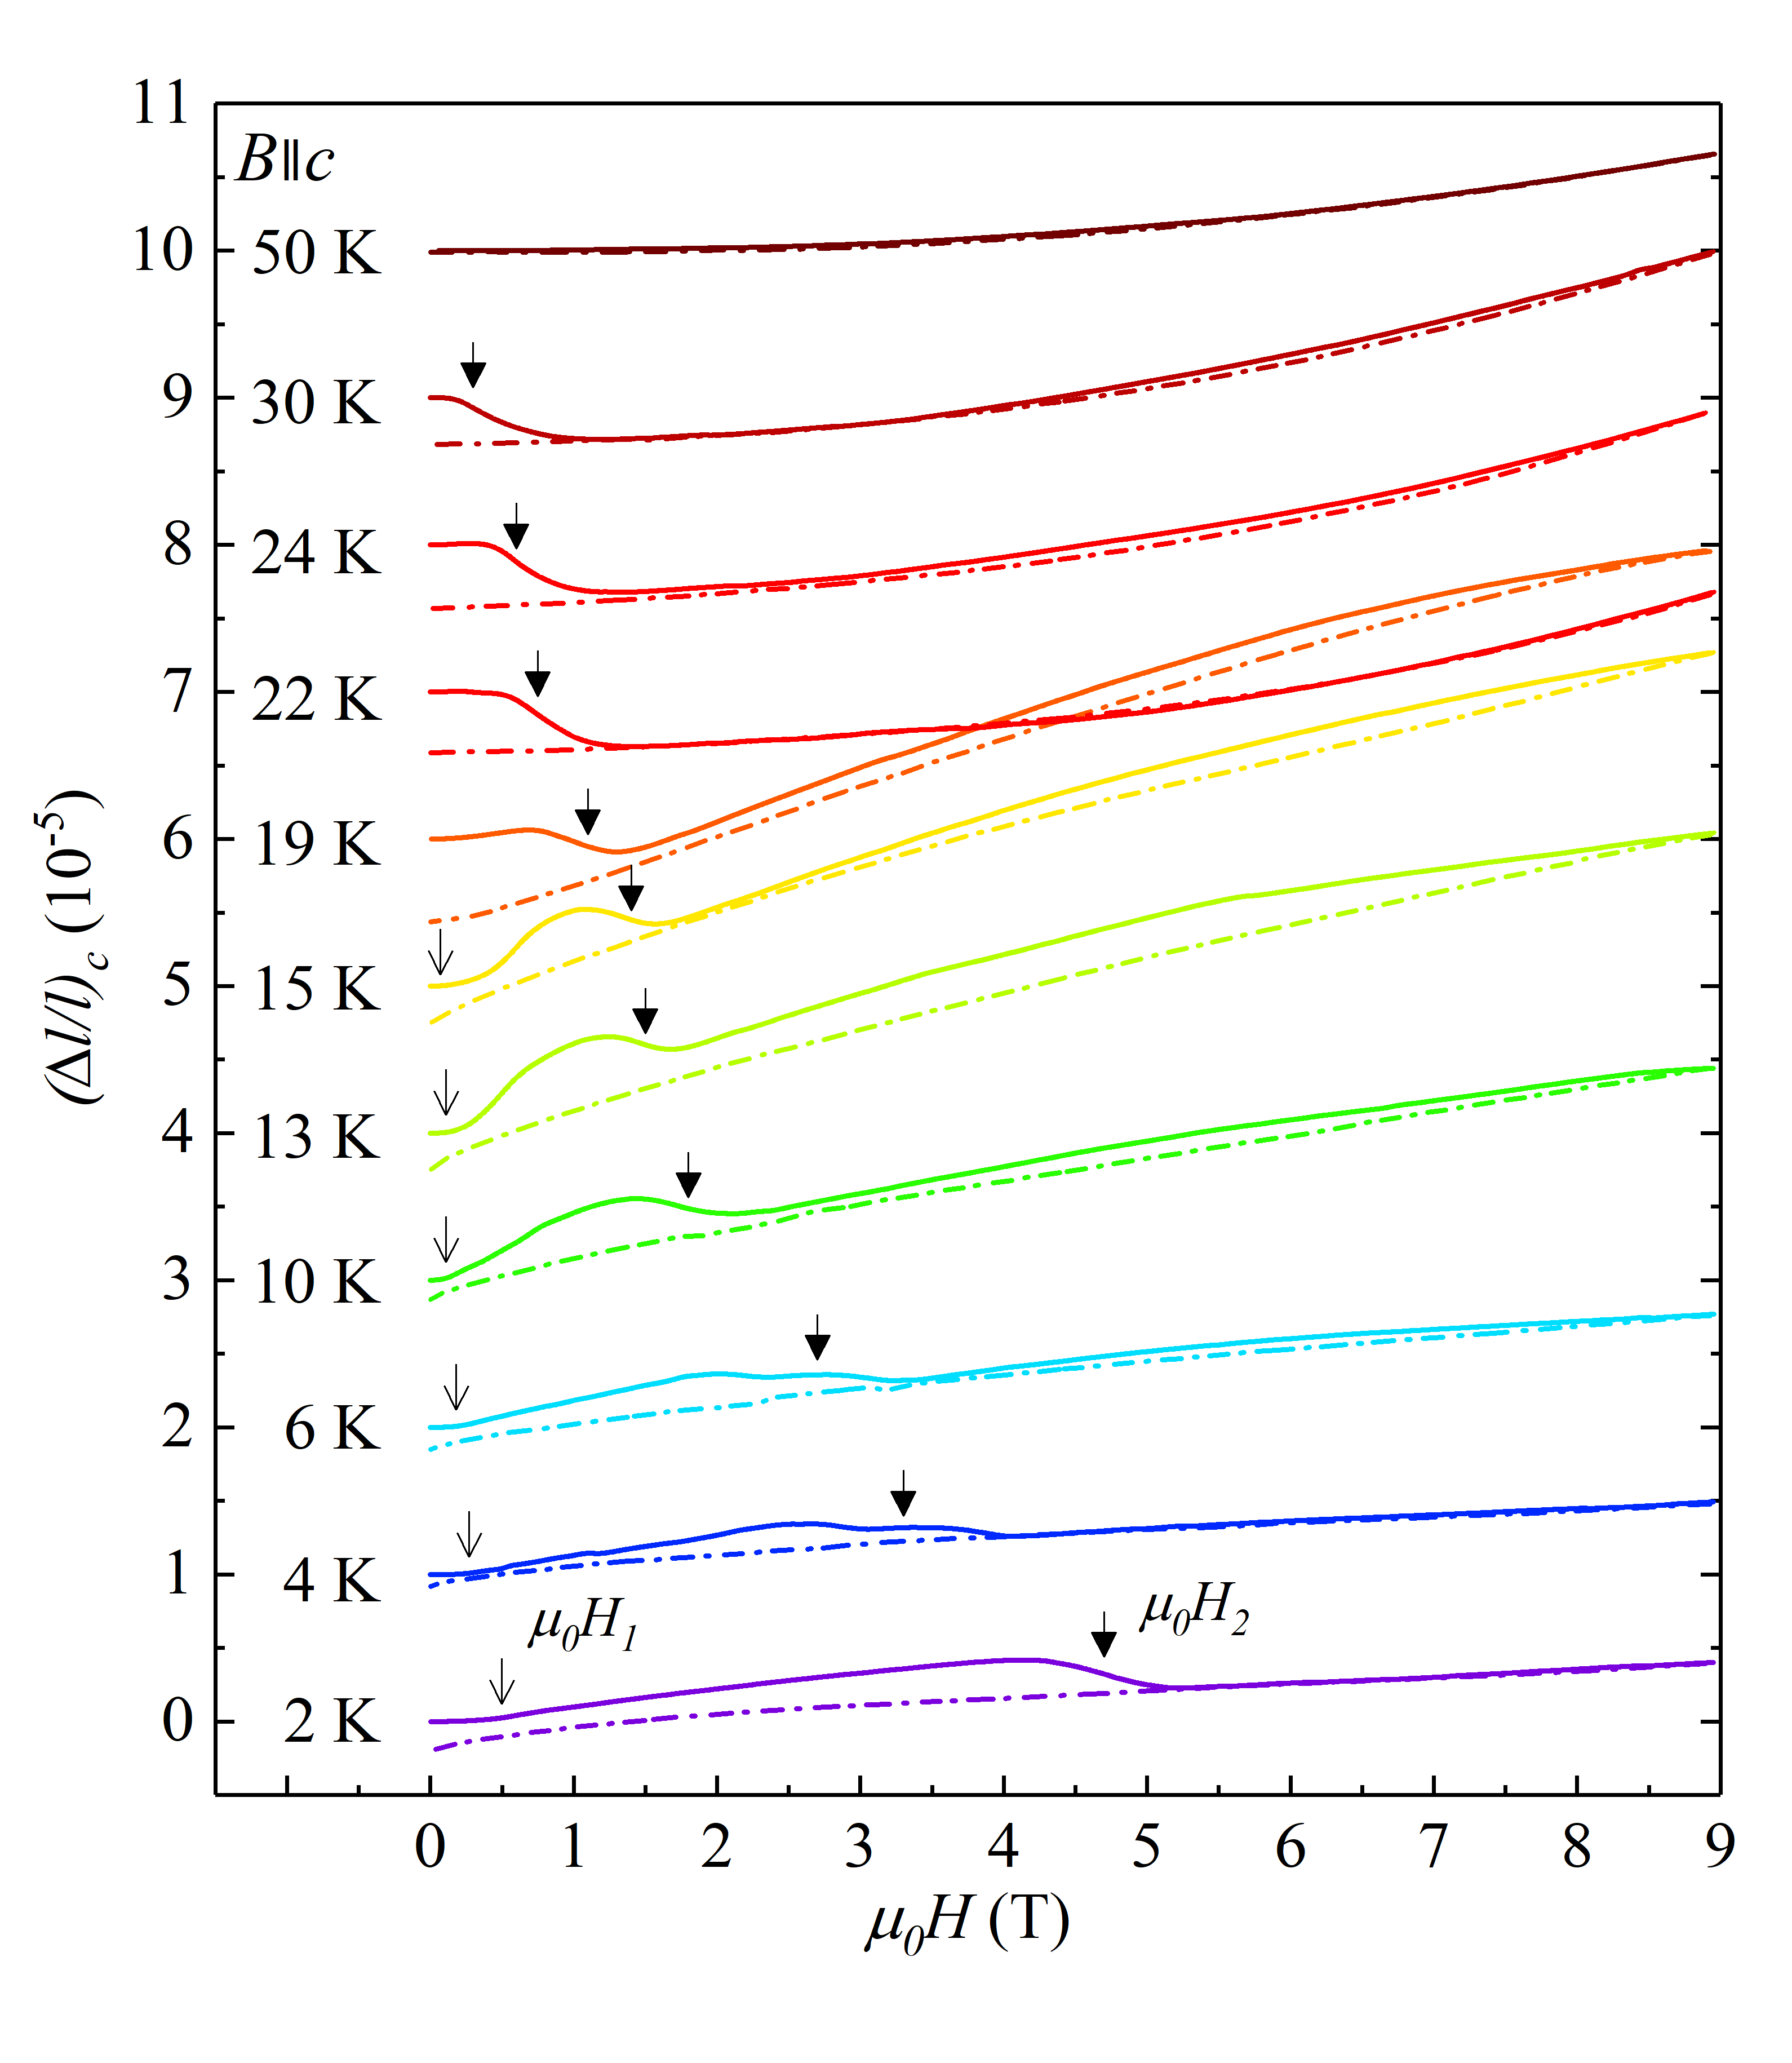
Fig. 9 shows how the coercive fields and were determined from magnetostriction data.
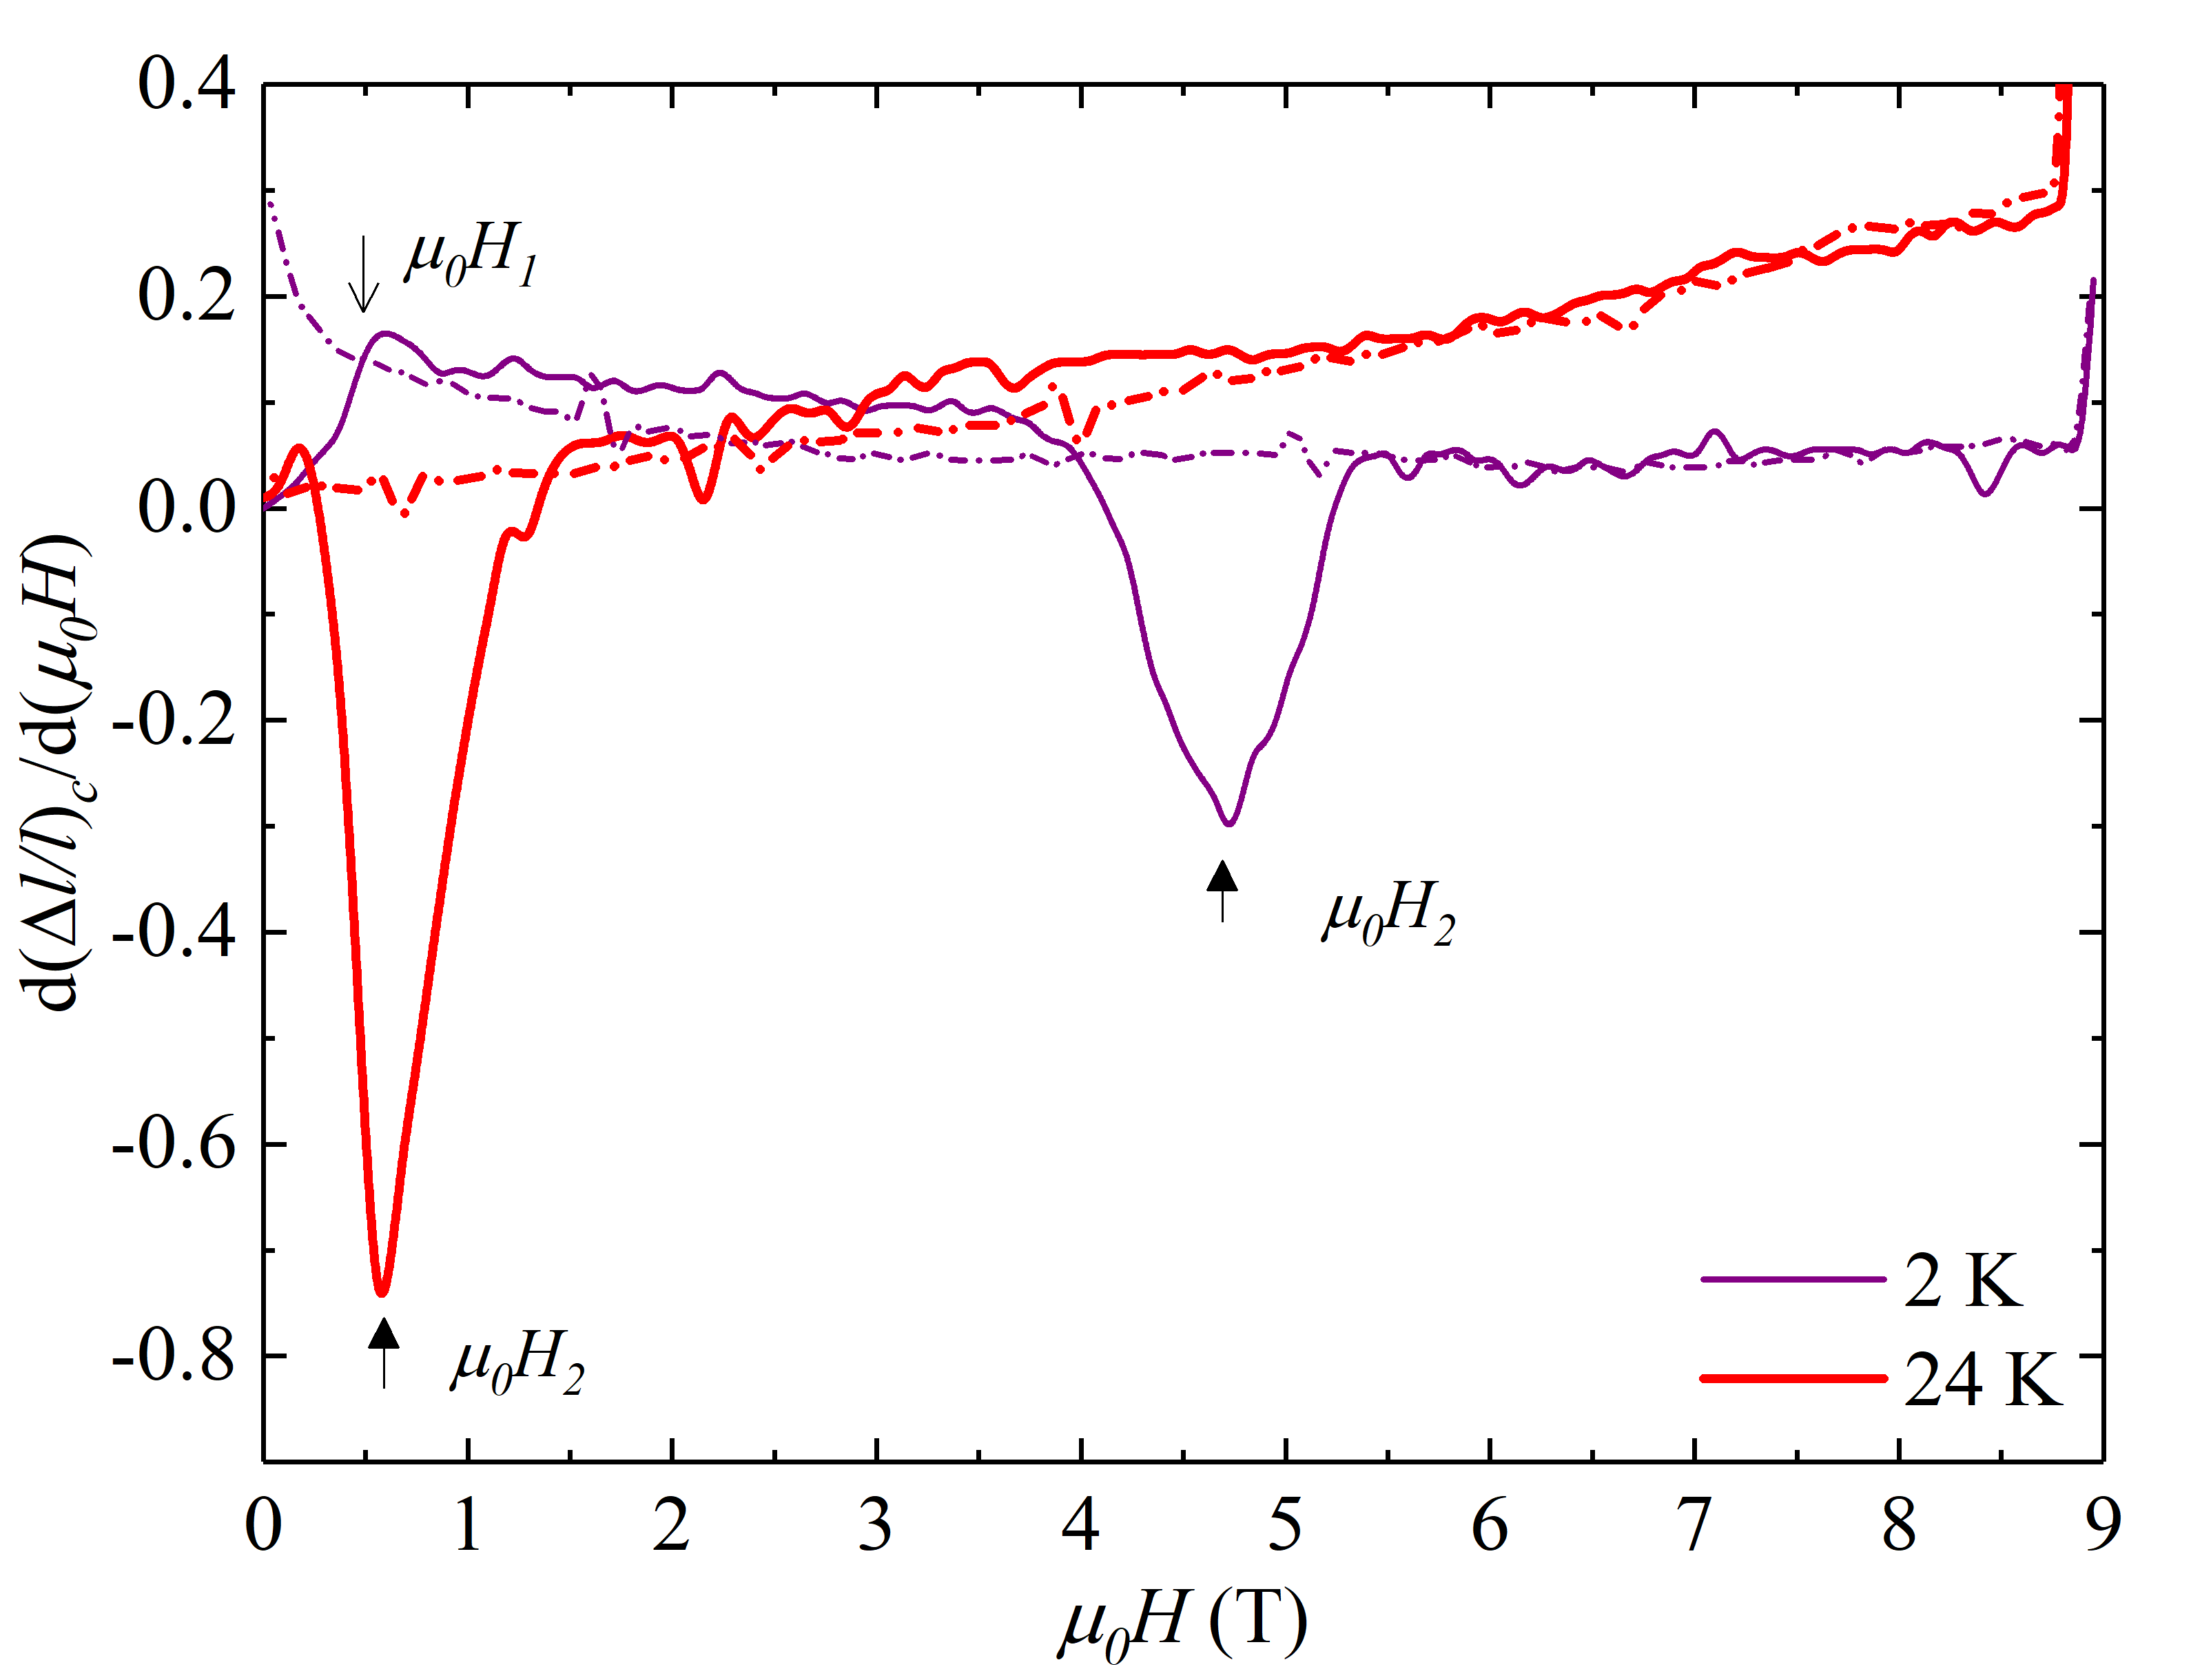
There is a significant change of the shape of the magnetostriction curves when crosses , going from a concave to a convex curvature. We have consequently conducted further measurements of the longitudinal magnetostriction along the axis up to at selected temperatures close to . These isotherms show the high-field anomaly as a pronounced sharp drop at (see Fig. 10), as determined from the magnetization measurements.
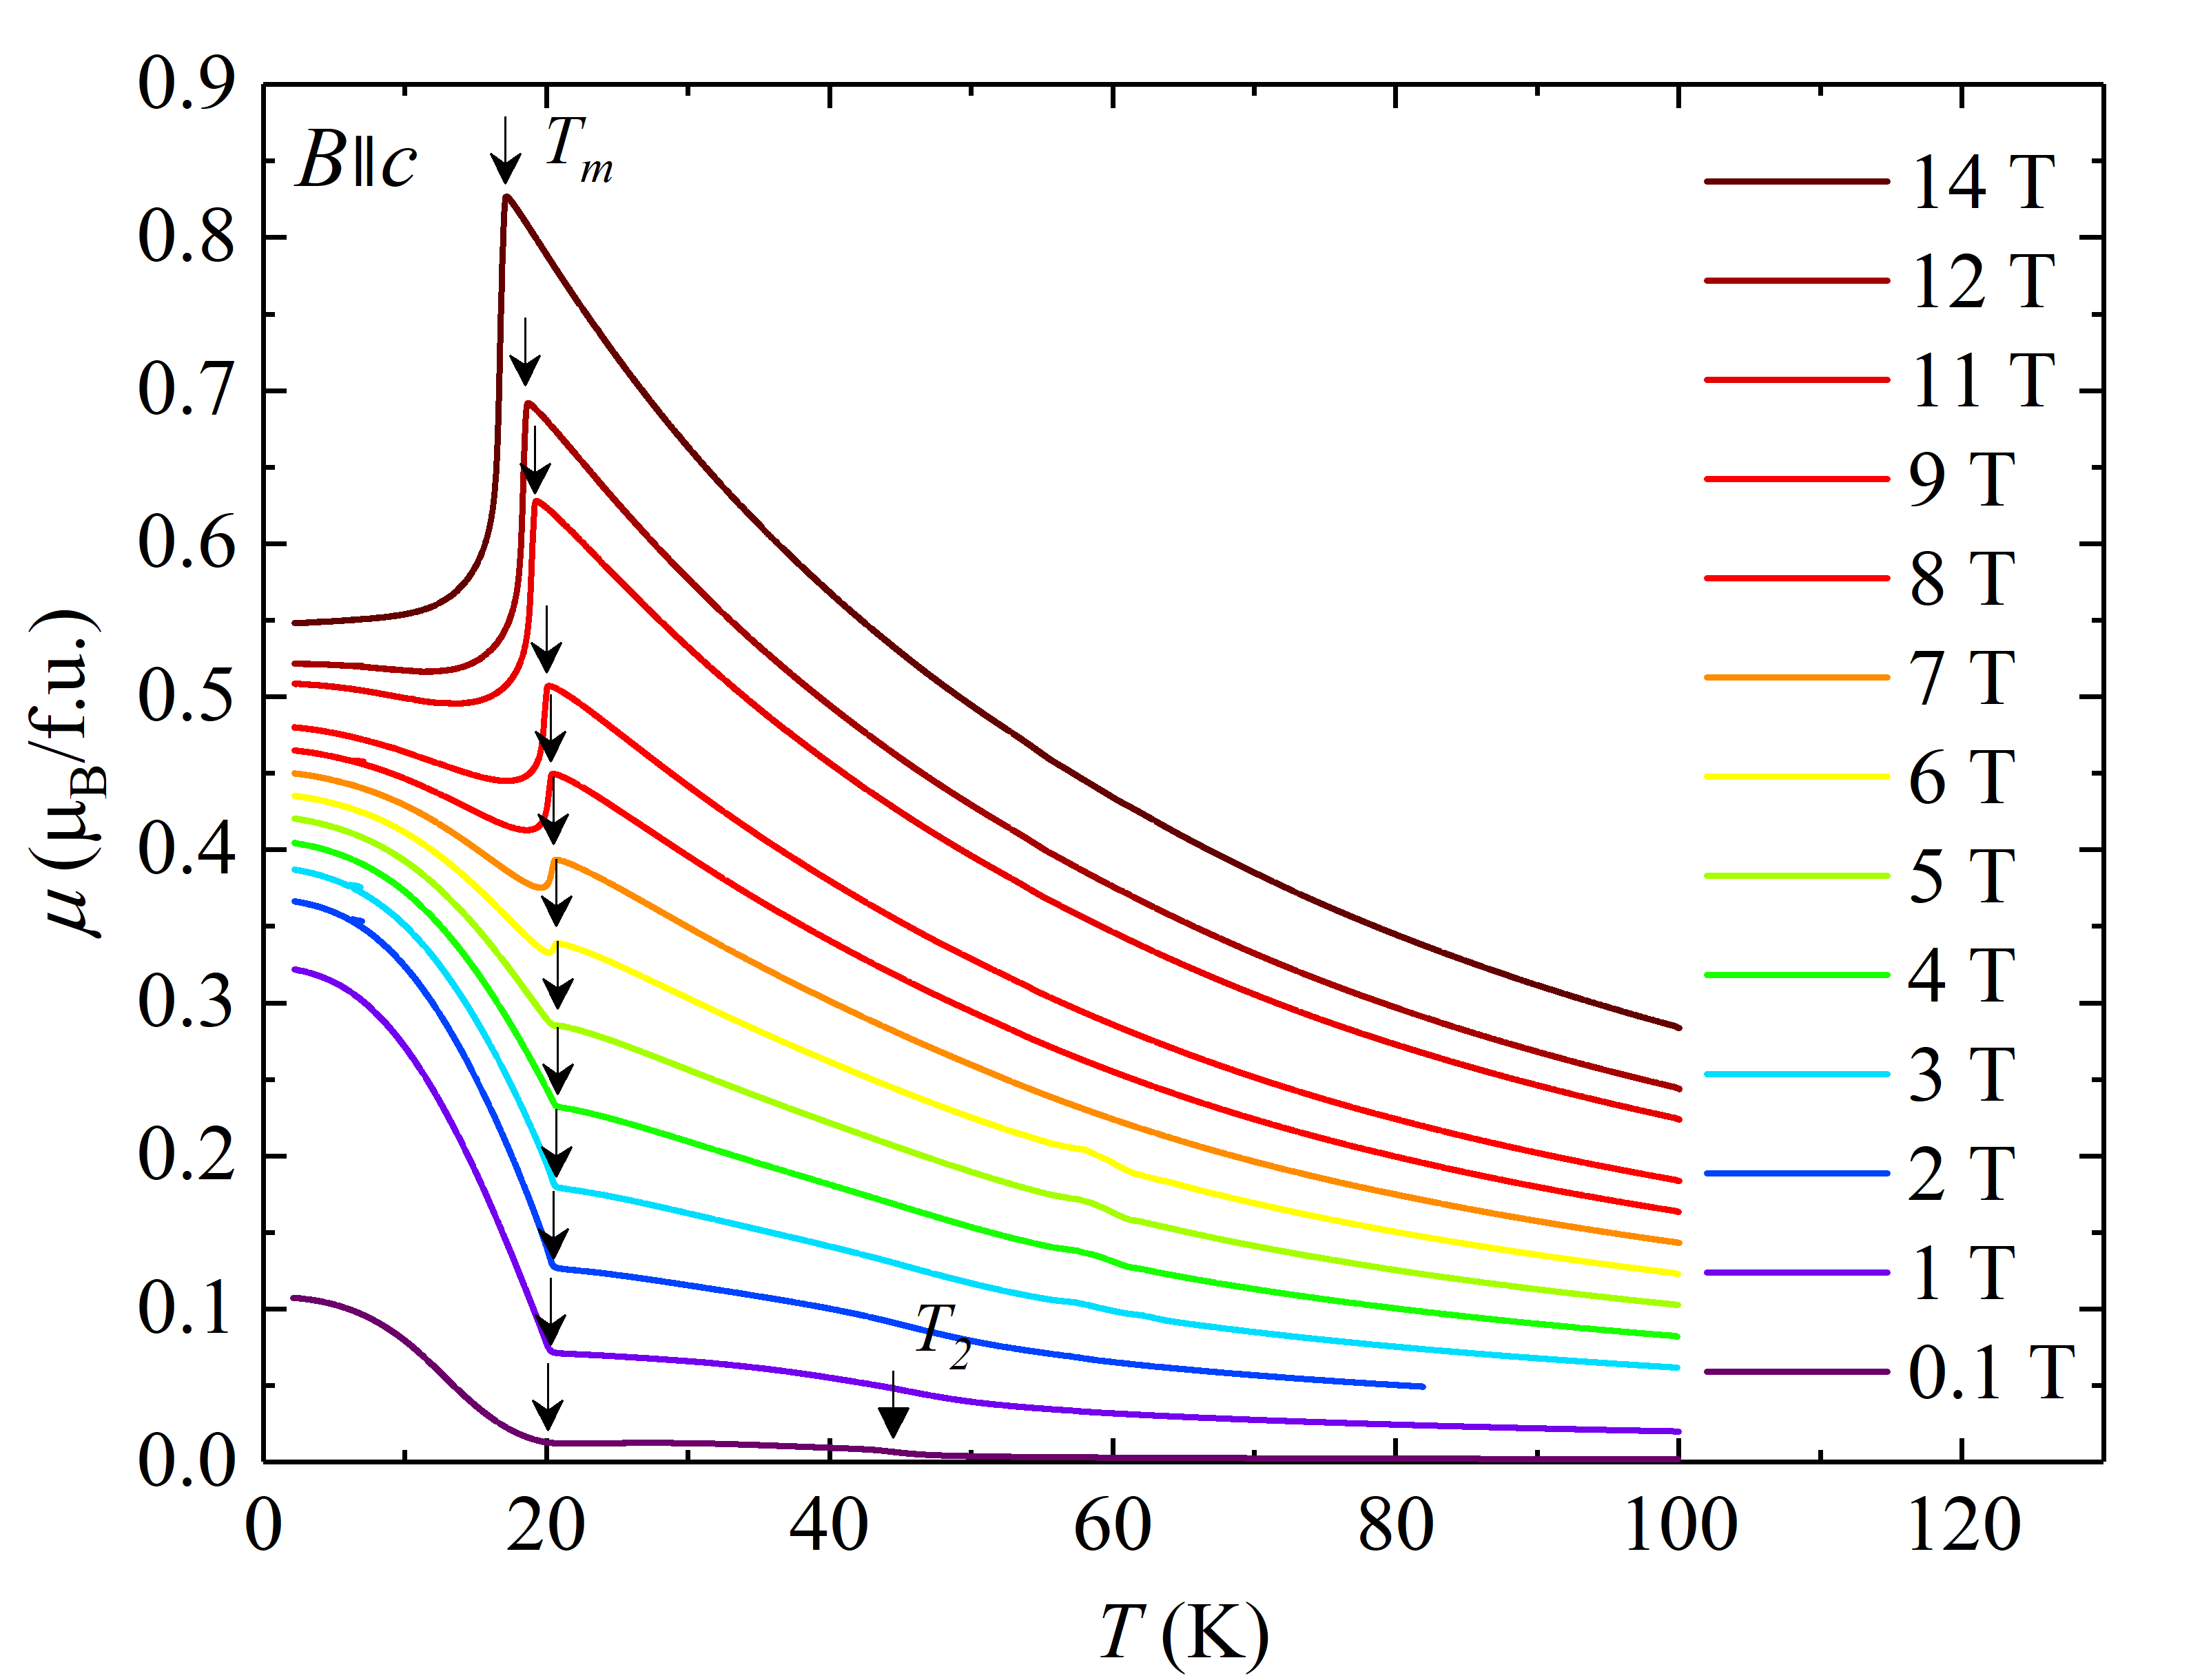
We have also measured the temperature dependence of the magnetization in various fields up to applied along the axis. These data agree with our previous results obtained on a different single crystal.Tabata et al. (2016) We can clearly see the anomaly labeled as , determined from the upturn of the magnetization for curves below and from the peak at higher fields. There is also another transition marked as that can be distinguished only in the low-field data at (see Fig. 11).
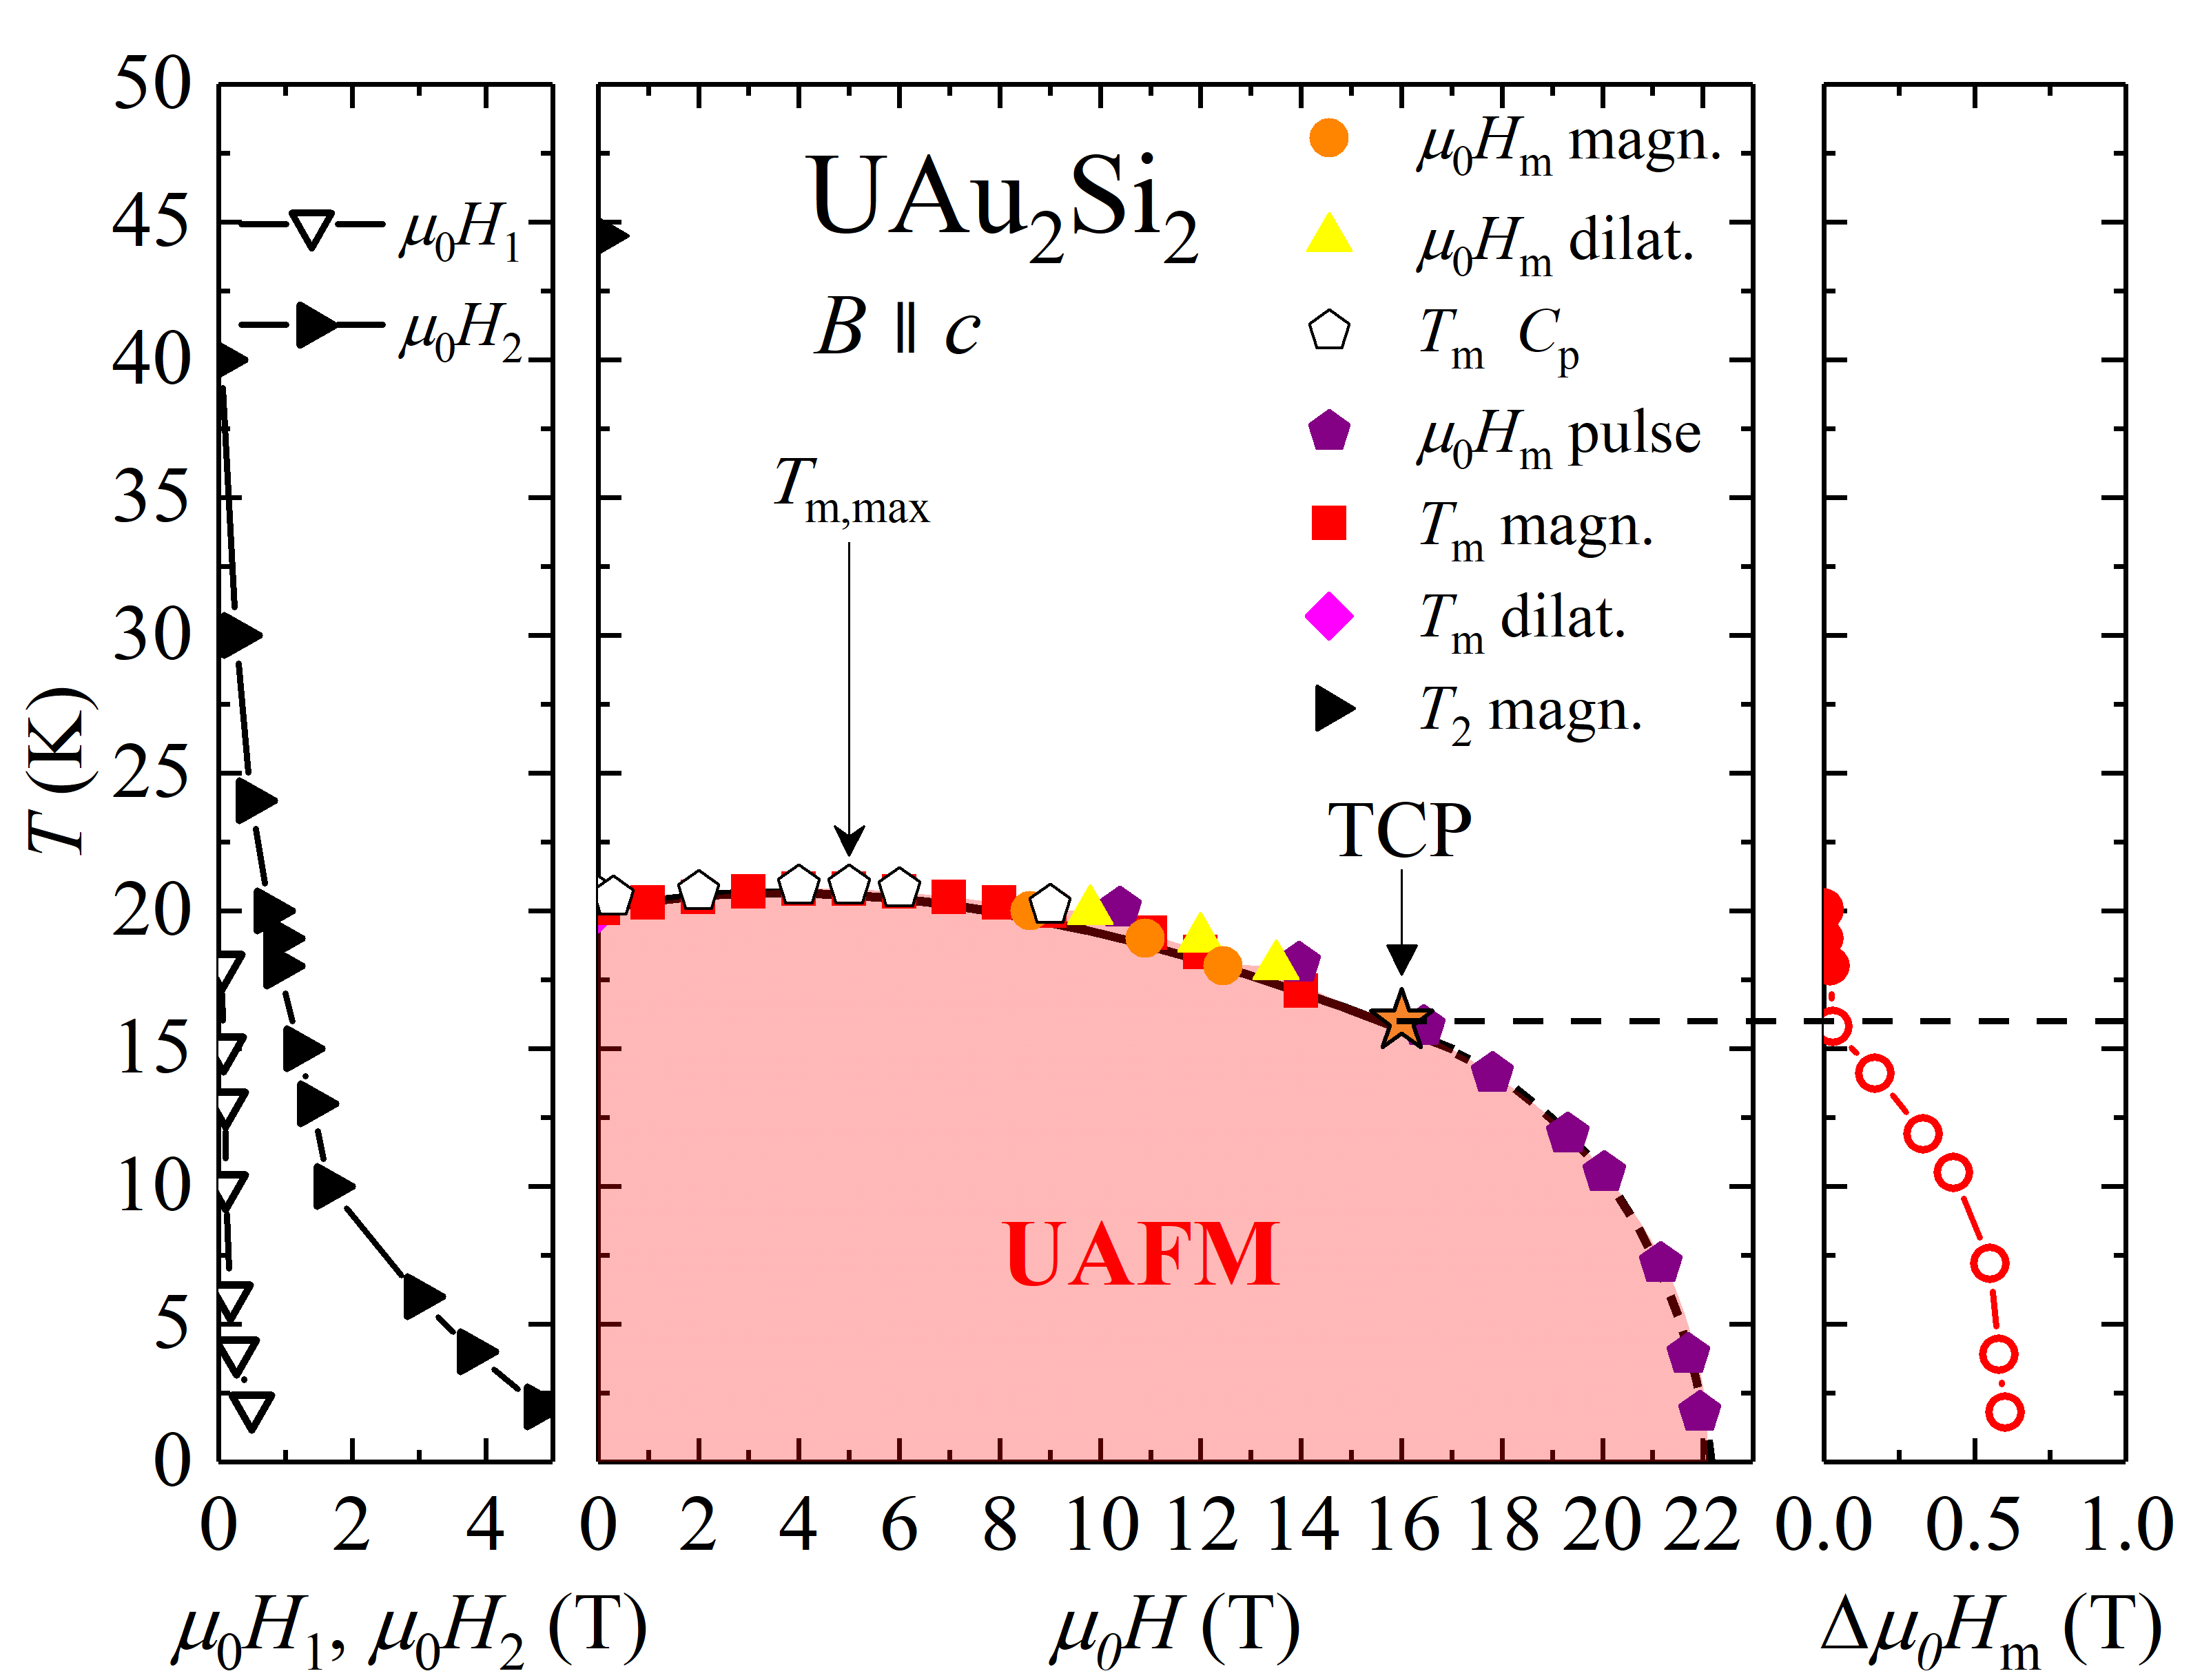
The whole set of anomalies observed in the magnetization, magnetostriction and thermal-expansion measurements allows us to construct the magnetic phase diagram as plotted in Fig. 12 together with the temperature dependence of the hystereses of the , and .
III.3 Hydrostatic pressure study
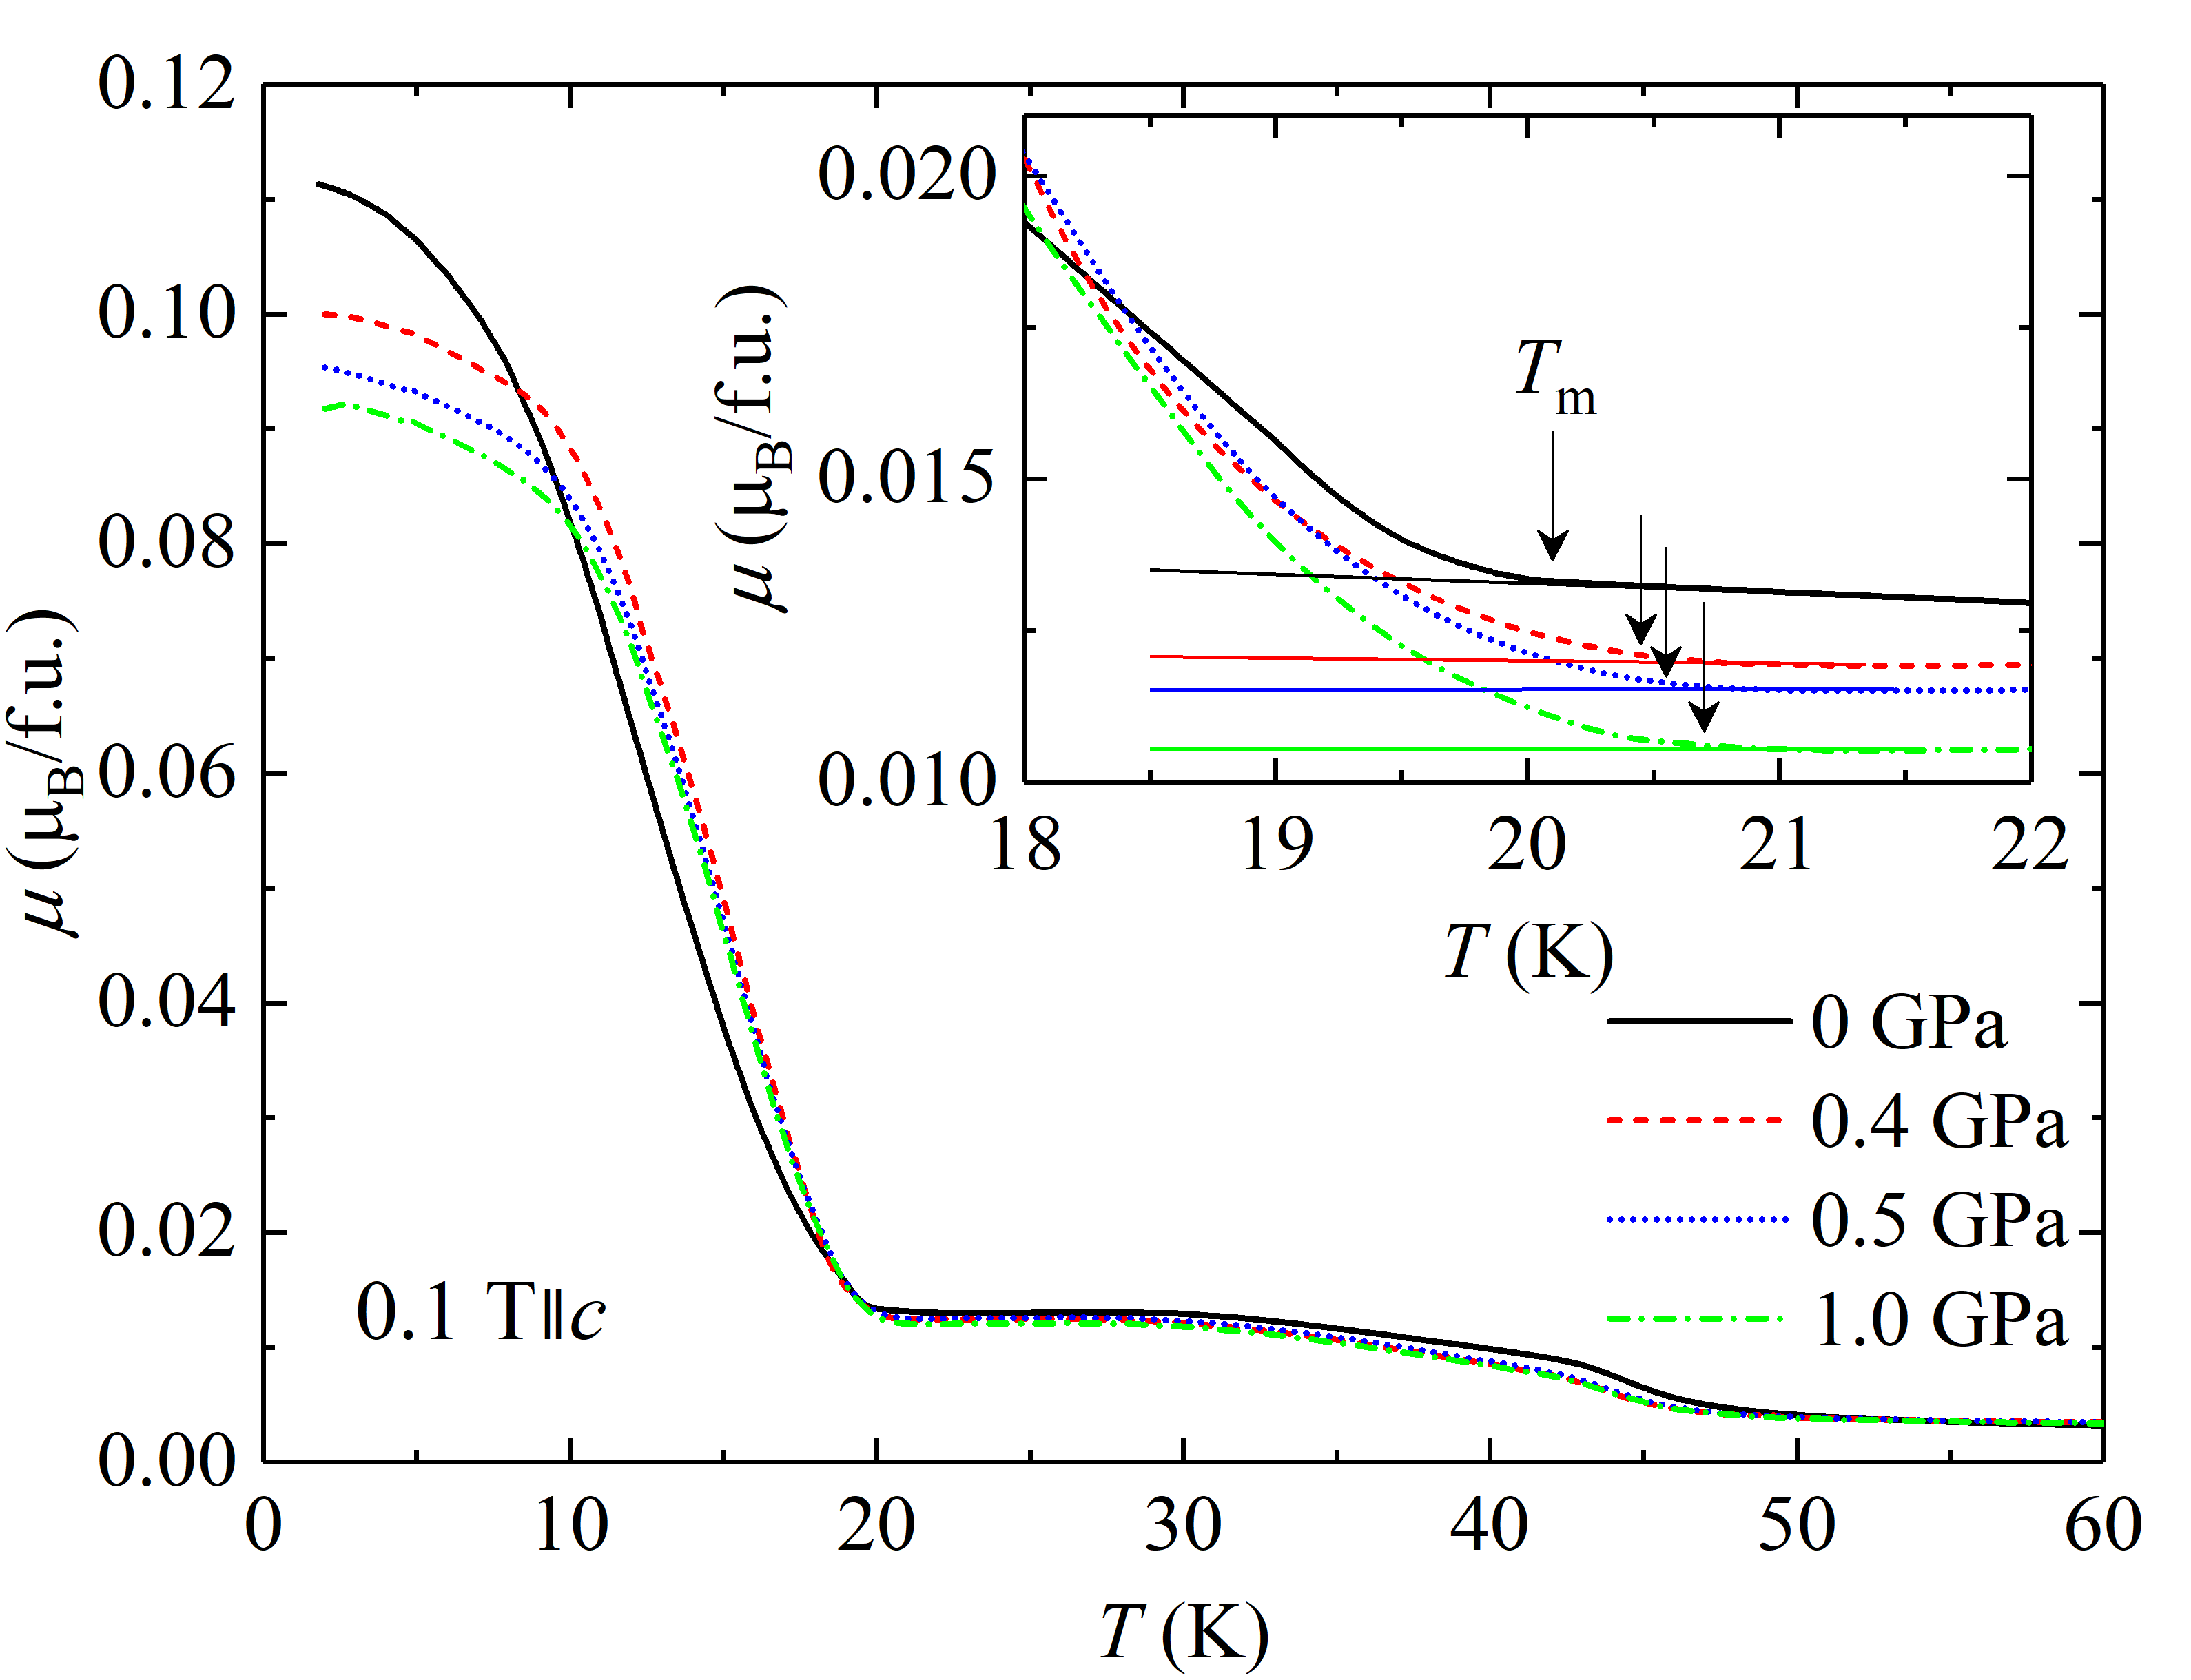
As our calculations using the Ehrenfest relation predict a rather dramatic positive effect of hydrostatic pressure on the ordering temperature () we wanted to verify this hypothesis. For that purpose, we measured the magnetization in a field of applied along the axis under hydrostatic pressures up to (see Fig. 13). The measured data were corrected for the diamagnetic contribution of the pressure cell. The shape of the ambient pressure curve differs from those obtained under pressure. This can be an effect of a slightly different orientation of the sample in the pressure cell. Contrary to our prediction, we observe only a small shift of the transition temperature with applied pressure (see inset of Fig. 13). The transition temperature again is defined by the upturn of the magnetization curve. The resulting small ratio of the pressure change of the ordering temperature is . A larger effect is visible in the reduction of the spontaneous magnetic moment with the slope .
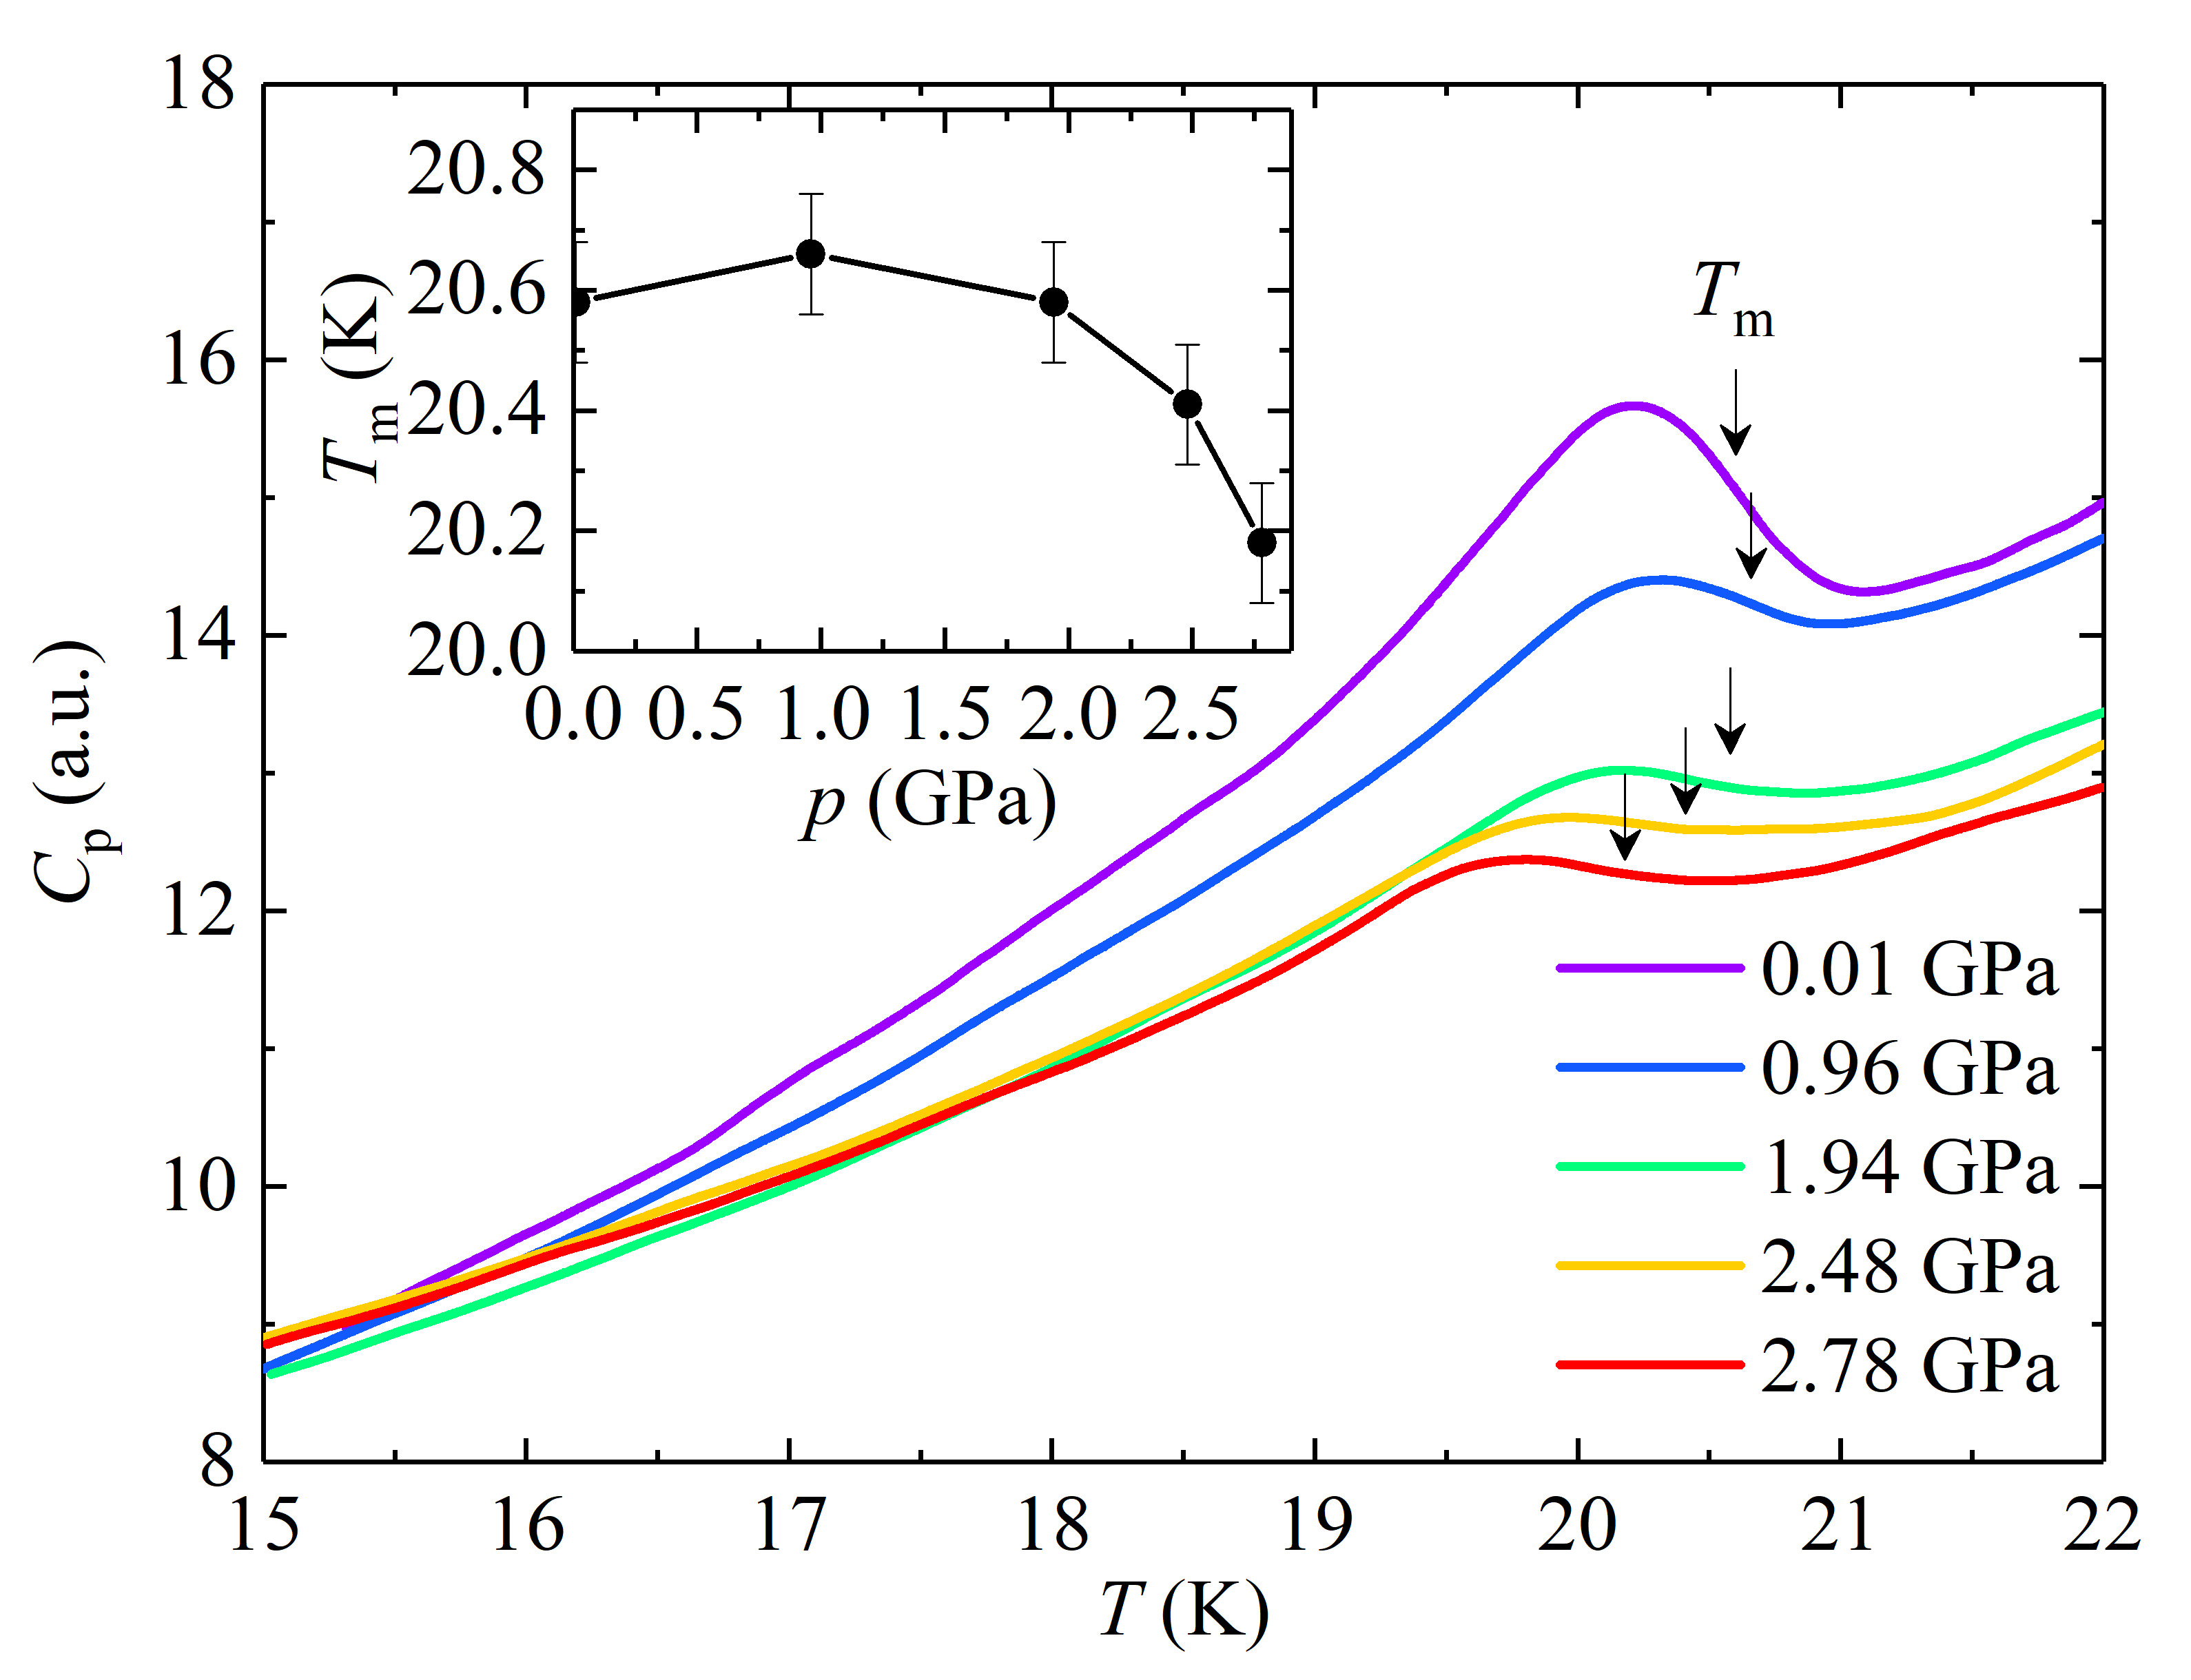
Temperature dependence of specific heat measured under hydrostatic pressure up to confirmed that slightly increases with applying pressure of and then decreases at gradually increasing rate with higher pressure (see Fig. 14). The total change of between ambient pressure and amounts only , i.e. . In any case the results of measurements of pressure influence on strongly contradict the predictions from Ehrenfest relation. This contradiction obviously requires further studies. At this stage we can only speculate that the reasons can be in a complex hierarchy of exchange interactions.
IV Discussion
Our thermal-expansion measurements on a single crystal revealed a large anisotropy which is mainly due to magnetic contributions. The ordered state below is connected with a dramatic lattice contraction in the basal plane ( axis). This together with the relatively small expansion of the axis leads to the ground state volume collapse (Fig. 1). This behavior strongly resembles the case of the isostructural heavy-fermion compound entering the hidden-order state at .de Visser et al. (1986) The linear thermal-expansion coefficient for the axis consequently exhibits a sharp positive anomaly at the ordering temperature whereas the -axis anomaly is negative and less pronounced (Fig. 2). The volume thermal-expansion coefficient of also exhibits a sharp and positive peak at that can be translated to a volume decrease in the ground state. A very similar behavior for both compounds can be found in the temperature dependence of the ratio. Both materials show an upturn below the ordering temperature, accenting the contraction in the basal plane, and nearly linear temperature dependence at higher temperatures up to . Nevertheless, the ratio of has a pronounced minimum around , that is not visible for which shows a linear temperature dependence up to . Even though the overall character of the thermal expansion of and is qualitatively similar, it does differ quantitatively. The step in the volume thermal-expansion coefficient is for de Visser et al. (1986) and almost an order of magnitude larger () for . It is believed, that anomalies in the thermal-expansion coefficient of the order of , can be connected with a structural transitionsde Visser et al. (1986) as in the case of .Ott et al. (1980) In that sense, does not evidence a structural change in the hidden-order state. Nevertheless, there is a list of studies which suggest the breaking of the fourfold rotational symmetry of the tetragonal axis,Okazaki et al. (2011); Shibauchi et al. (2014); Tonegawa et al. (2012, 2013); Kambe et al. (2013b); Riggs et al. (2015) whereas the high-resolution x-ray backscatteringTabata et al. (2014) and thermal–expansion datade Visser et al. (1986); Kuwahara et al. (1997) do not confirm this. However, lattice-symmetry breaking from the fourfold tetragonal to twofold orthorhombic structure was unambiguously observed by high-resolution synchrotron x-ray diffraction measurements in zero field.Tonegawa et al. (2014) The fact that this distortion is observed only in ultra-pure samples may explain the long list of more or less unsuccessful attempts to observe this.
As the thermal-expansion coefficients of are even one order of magnitude larger (i.e., ) the possibility of some kind of lattice distortion should be seriously considered. Our thermal-expansion measurements show an anisotropic expansion in the basal plane breaking the fourfold symmetry along the axis. The body-centered room-temperature tetragonal structure of belongs to the space group. It has 15 maximal non-isomorphic subgroups and only two of them have no fourfold symmetry along the axis. These are the orthorhombic and space groups. The same space groups were also considered in the synchrotron x-ray diffraction study of .Tonegawa et al. (2014) The space group was found to describe the system in the hidden-order state.
The measurement of thermal expansion, as a macroscopic quantity, is not sufficient to properly describe the space group of the distorted structure, even though it is more sensitive to detect distortions than diffraction studies. In that sense, high-resolution x-ray diffraction experiments are needed to resolve the structure of in the ordered state. Our results from an ultrasonic study show a Curie-type softening in the transverse mode toward , that could also point to orthorhombic distortion at .Yanagisawa In the analogy with the , there was also observed softening of the same mode suggesting that the -type lattice instability is innate in these systems.Kuwahara et al. (1997); Yanagisawa et al. (2012)
The large ground-state volume collapse of indicates initial positive pressure dependence of the ordering temperature of , according to the Ehrenfest relation. Uniaxial pressure applied along the axis should have a positive effect as well (). On the other hand, uniaxial pressure along the tetragonal axis should lower at a rate of . These findings qualitatively agree with the experimentally confirmed behavior of where the predicted pressure dependences are approximately eight times smaller. Ehrenfest-relation estimates give a pressure dependence of the hidden-order transition of (Ref. de Visser et al. (1986)) and high-pressure resistivity measurements show an experimental initial slope of (Ref. Hassinger et al. (2008)). The estimated pressure changes of the ordering temperature of the hidden order of and the UAFM state of are largely different. A similar dramatic change of the values was observed for the system, where doping of Fe leads to a change of the hidden order to “large-moment antiferromagnetism”.Ran et al. (2016) However, our measurement of the magnetization under hydrostatic pressure up to show only a weak pressure dependence of (Fig. 13). The estimated slope is . We also observed the lowering of the spontaneous magnetization with increasing pressure . The specific-heat measurement under hydrostatic pressure up to revealed small initial increase of up to followed by suppression for higher pressure. The observed inconsistency with the expected trend from the Ehrenfest relation is rather unexpected. It may be caused by a structural distortion that takes place at . In that case Eq. (1) is not valid and the real volume change can be different, i.e., possibly smaller. Another question is the applicability of the Ehrenfest relation itself. Although it is widely and successfully used to characterize the pressure dependence (both positive and negative) of AFMNeumeier et al. (2001); Schmiedeshoff et al. (2006) and FMGasparini et al. (2010); Sakarya et al. (2003); Neumeier et al. (2001) second-order phase transitions, it may strictly be applied only for the superconducting transitions.Pippard (1964) And even for some superconductors the predicted pressure dependence determined by use of the Ehrenfest relation differs from the experimental findings, such as in the case of Eloirdi et al. (2017) by an order of magnitude or even by sign in the layered iron-based superconductors of the series.da Luz et al. (2009) Both of these systems exhibit very anisotropic thermal-expansion coefficients, similar as for .
The magnetization isotherms (Fig. 5 and 7) clearly and reproducibly show anomalies at , , and in line with our previous study on a different single crystal. However, we now found a much sharper character of the step-like transition at . We suggest, that the deviation from the linear dependence of the magnetization, that was marked as in our previous work,Tabata et al. (2016) is a low-field sign of the step-like transition which takes place at higher fields. We have previously not observed this transition, possibly due to a lower crystal quality or slightly improper orientation of the axis with respect to the applied field.
Our magnetostriction measurements (Fig. 8 and 10) with field applied along the axis reproduce the anomalies observed in the magnetization data. The transition at is reflected in the thermal-expansion data only by a small slope change in , and around (Fig. 2). The size of the relative length change of the axis at the anomaly, is of the order of . This provides an evidence of its bulk character, which can be traced up to as in the magnetization data. A larger relative length contraction () takes place at . It resembles the -axis contraction at the field-induced phase transition of .Correa et al. (2012)
Our high-field magnetization measurements show that the temperature dependence of the hysteresis of the transition vanishes around (and ) where the transition changes its character from step like to continuous. This is attributed to the change of the order of the phase transition from first order (in higher fields) to second order (in lower fields). Such a point is usually referred to as a tricritical point (TCP).Stryjewski and Giordano (1977) We marked this point by a star in the phase diagram in Fig. 12. Similar tricritical points have recently been reported in the uranium-based antiferromagnets Stillwell et al. (2017) and .Shrestha et al. (2017) The critical field, where the transition temperature is suppressed to in is extrapolated to be about .
V Conclusions
Our thermal-expansion, specific-heat, magnetostriction and magnetization study allowed us to complete a comprehensive magnetic phase diagram for .
The magnetostriction curves measured at higher temperatures confirm bulk character of the weak FM phase. The large volume contraction in the UAFM ordered state suggests a large positive pressure dependence of . The linear thermal-expansion data point on the opposite effect for uniaxial pressure applied along the tetragonal axis and within the basal plane. Magnetization measurements in a hydrostatic pressure cell, however, revealed a negligible hydrostatic pressure effect on , namely in pressures up to . Small initial increase of under hydrostatic pressure up to was observed on the specific-heat data, while continuous decrease is found for higher pressure up to . These values are much smaller than the prediction from the Ehrenfest relations (). Further complex studies involving hydrostatic and uniaxial pressure would be desired to shed more light on the nature of this controversy.
As the order of all the relative length changes is , we can expect some structural changes or distortions of the unit cell in the ground state. Our comparative dilatometry measurements of the linear thermal expansion along the axis and along the direction clearly show the fourfold symmetry breaking in the basal plane. This may also affect the real low-pressure dependence of the ordering temperature. High-resolution diffraction measurements are needed to find the ground-state space group. Possible candidates are the orthorhombic non-isomorphic subgroups and , where the first one was found to describe the structure of the high-quality samples of in the hidden-order state. Our high-field magnetization measurements revealed a critical field of where the ordering temperature is suppressed to . The hysteresis of this transition emerges at a tricritical point given by and as a sign of the change of the transition from second to first order.
Acknowledgements.
The present research was supported by JSPS KAKENHI Grant Numbers JP17K05525, JP15KK0146, JP15K05882, JP15K21732, and the Strategic Young Researcher Overseas Visits Program for Accelerating Brain Circulation from JSPS. Single crystal growth and majority of experiments were performed in the Materials Growth and Measurement Laboratory MGML (see: http://mgml.eu). We acknowledge the support of HLD at HZDR, a member of the European Magnetic Field Laboratory (EMFL), where the magnetization measurements in high pulsed fields have been done. We would like to thank to Sergei Zherlitsyn for his help during the high-field magnetization measurement.References
- Koelling et al. (1985) D. D. Koelling, B. D. Dunlap, and G. W. Crabtree, Phys. Rev. B 31, 4966 (1985).
- Smith and Kmetko (1983) J. L. Smith and E. A. Kmetko, Journal of the Less Common Metals 90, 83 (1983).
- Eriksson et al. (1991) O. Eriksson, M. S. S. Brooks, B. Johansson, R. C. Albers, and A. M. Boring, J. Appl. Phys. 69, 5897 (1991).
- Palstra et al. (1985) T. T. M. Palstra, A. A. Menovsky, J. v. d. Berg, A. J. Dirkmaat, P. H. Kes, G. J. Nieuwenhuys, and J. A. Mydosh, Phys. Rev. Lett. 55, 2727 (1985).
- Maple et al. (1986) M. B. Maple, J. W. Chen, Y. Dalichaouch, T. Kohara, C. Rossel, M. S. Torikachvili, M. W. McElfresh, and J. D. Thompson, Phys. Rev. Lett. 56, 185 (1986).
- Schlabitz et al. (1986) W. Schlabitz, J. Baumann, B. Pollit, U. Rauchschwalbe, H. M. Mayer, U. Ahlheim, and C. D. Bredl, Zeitschrift für Physik B Condensed Matter 62, 171 (1986).
- Mydosh and Oppeneer (2011) J. A. Mydosh and P. M. Oppeneer, Rev. Mod. Phys. 83, 1301 (2011).
- de Visser et al. (1986) A. de Visser, F. E. Kayzel, A. A. Menovsky, J. J. M. Franse, J. van den Berg, and G. J. Nieuwenhuys, Phys. Rev. B 34, 8168 (1986).
- de Visser et al. (1990) A. de Visser, J. J. M. Franse, and J. Flouquet, Physica B 161, 324 (1990).
- Motoyama et al. (2008) G. Motoyama, N. Yokoyama, A. Sumiyama, and Y. Oda, J. Phys. Soc. Jpn. 77, 123710 (2008).
- Ran et al. (2016) S. Ran, C. T. Wolowiec, I. Jeon, N. Pouse, N. Kanchanavatee, B. D. White, K. Huang, D. Martien, T. DaPron, D. Snow, M. Williamsen, S. Spagna, P. S. Riseborough, and M. B. Maple, Proceedings of the National Academy of Sciences 113, 13348 (2016).
- Andreev et al. (2017) A. V. Andreev, Y. Skourski, D. I. Gorbunov, and K. Prokeš, Physica B (2017), https://doi.org/10.1016/j.physb.2017.06.025.
- Andreev et al. (2013) A. V. Andreev, S. Yasin, Y. Skourski, A. A. Zvyagin, S. Zherlitsyn, and J. Wosnitza, Phys. Rev. B 87, 214409 (2013).
- Honda et al. (1999) F. Honda, G. Oomi, A. V. Andreev, V. Sechovský, and A. A. Menovsky, Physica B 259-261, 256 (1999).
- Sechovsky and Havela (1998) V. Sechovsky and L. Havela, “Chapter 1 magnetism of ternary intermetallic compounds of uranium,” in Handbook of Magnetic Materials, Vol. 11 (Elsevier, 1998) pp. 1–289.
- Szytuka et al. (1988) A. Szytuka, S. Siek, J. Leciejewicz, A. Zygmunt, and Z. Ban, J. Phys. Chem. Solids 49, 1113 (1988).
- Palstra et al. (1986) T. T. M. Palstra, A. A. Menovsky, G. J. Nieuwenhuys, and J. A. Mydosh, J. Magn. Magn. Mater. 54-57, 435 (1986).
- Matsuda et al. (2003) T. D. Matsuda, N. Metoki, Y. Haga, S. Ikeda, K. Kaneko, E. Yamamoto, and Y. Onuki, J. Phys.: Condens. Matter 15, S2023 (2003).
- Chełmicki et al. (1985) L. Chełmicki, J. Leciejewicz, and A. Zygmunt, J. Phys. Chem. Solids 46, 529 (1985).
- Chełmicki et al. (1983) L. Chełmicki, J. Leciejewicz, and A. Zygmunt, Solid State Commun. 48, 177 (1983).
- Ptasiewicz-Bak (1981) H. Ptasiewicz-Bak, J. Phys. F: Met. Phys. 11, 1225 (1981).
- Honma et al. (1998) T. Honma, H. Amitsuka, S. Yasunami, K. Tenya, T. Sakakibara, H. Mitamura, T. Goto, G. Kido, S. Kawarazaki, Y. Miyako, K. Sugiyama, and M. Date, J. Phys. Soc. Jpn. 67, 1017 (1998).
- Dirkmaat et al. (1990) A. J. Dirkmaat, T. Endstra, E. A. Knetsch, G. J. Nieuwenhuys, J. A. Mydosh, A. A. Menovsky, F. R. de Boer, and Z. Tarnawski, Phys. Rev. B 41, 2589 (1990).
- D. Matsuda et al. (2005) T. D. Matsuda, Y. Haga, S. Ikeda, A. Galatanu, E. Yamamoto, H. Shishido, M. Yamada, J.-I. Yamaura, M. Hedo, Y. Uwatoko, T. Matsumoto, T. Tada, S. Noguchi, T. Sugimoto, K. Kuwahara, K. Iwasa, M. Kohgi, R. Settai, and Y. Ōnuki, J. Phys. Soc. Jpn. 74, 1552 (2005).
- Honda et al. (2006) F. Honda, N. Metoki, T. D. Matsuda, Y. Haga, and Y. Ōnuki, J. Phys.: Condens. Matter 18, 479 (2006).
- Troć et al. (2012) R. Troć, M. Samsel-Czekała, J. Stẹpień-Damm, and B. Coqblin, Phys. Rev. B 85, 224434 (2012).
- Tabata et al. (2016) C. Tabata, N. Miura, K. Uhlířová, M. Vališka, H. Saito, H. Hidaka, T. Yanagisawa, V. Sechovský, and H. Amitsuka, Phys. Rev. B 94, 214414 (2016).
- Tabata et al. (2017a) C. Tabata, M. Klicpera, B. Ouladdiaf, H. Saito, M. Vališka, K. Uhlířová, N. Miura, V. Sechovský, and H. Amitsuka, Phys. Rev. B 96, 214442 (2017a).
- Tabata et al. (2017b) C. Tabata, Y. Ihara, S. Shimmura, N. Miura, H. Hidaka, T. Yanagisawa, and H. Amitsuka, ArXiv e-prints (2017b).
- Rebelsky et al. (1991) L. Rebelsky, M. W. McElfresh, M. S. Torikachvili, B. M. Powell, and M. B. Maple, J. Appl. Phys. 69, 4810 (1991).
- Torikachvili et al. (1992) M. S. Torikachvili, R. F. Jardim, C. C. Becerra, C. H. Westphal, A. Paduan-Filho, V. M. Lopez, and L. Rebelsky, J. Magn. Magn. Mater. 104-107, 69 (1992).
- Lin et al. (1997) K. J. Lin, J. S. Hwang, C. S. Wur, R. Hsu, and C. Tien, Solid State Commun. 103, 185 (1997).
- Saran and McAlister (1988) M. Saran and S. P. McAlister, J. Magn. Magn. Mater. 75, 345 (1988).
- Haga et al. (1998) Y. Haga, T. Honma, E. Yamamoto, H. Ohkuni, Y. Ōnuki, M. Ito, and N. Kimura, Japanese Journal of Applied Physics 37, 3604 (1998).
- Rotter et al. (2007) M. Rotter, M. Doerr, M. Zschintzsch, A. Lindbaum, H. Sassik, and G. Behr, J. Magn. Magn. Mater. 310, 1383 (2007).
- Skourski et al. (2011) Y. Skourski, M. D. Kuz’min, K. P. Skokov, A. V. Andreev, and J. Wosnitza, Phys. Rev. B 83, 214420 (2011).
- Kamarád et al. (2004) J. Kamarád, Z. Machátová, and Z. Arnold, Rev. Sci. Instrum. 75, 5022 (2004).
- Sullivan and Seidel (1968) P. F. Sullivan and G. Seidel, Phys. Rev. 173, 679 (1968).
- Kraftmakher (2004) Y. Kraftmakher, Modulation Calorimetry: Theory and Applications (Springer Berlin Heidelberg, 2004).
- Míšek (2013) M. Míšek, Magnetic and transport properties of f-electron compounds under extreme conditions, PhD thesis, Charles University (2013).
- Tonegawa et al. (2014) S. Tonegawa, S. Kasahara, T. Fukuda, K. Sugimoto, N. Yasuda, Y. Tsuruhara, D. Watanabe, Y. Mizukami, Y. Haga, T. D. Matsuda, E. Yamamoto, Y. Onuki, H. Ikeda, Y. Matsuda, and T. Shibauchi, Nat. Commun. 5, 4188 (2014).
- Kuwahara et al. (1997) K. Kuwahara, H. Amitsuka, T. Sakakibara, O. Suzuki, S. Nakamura, T. Goto, M. Mihalik, A. Menovsky, A. de Visser, and J. M. Franse, J. Phys. Soc. Jpn. 66, 3251 (1997).
- Note (1) We use Miller indices notation for this direction for its self-explanatory meaning, while for simplicity and are used for the and directions, respectively throughout the whole paper.
- Kambe et al. (2013a) S. Kambe, D. Aoki, B. Salce, F. Bourdarot, D. Braithwaite, J. Flouquet, and J. P. Brison, Phys. Rev. B 87, 115123 (2013a).
- Stryjewski and Giordano (1977) E. Stryjewski and N. Giordano, Adv. Phys. 26, 487 (1977).
- Ott et al. (1980) H. R. Ott, K. Andres, and P. H. Schmidt, Physica B+C 102, 148 (1980).
- Okazaki et al. (2011) R. Okazaki, T. Shibauchi, H. J. Shi, Y. Haga, T. D. Matsuda, E. Yamamoto, Y. Onuki, H. Ikeda, and Y. Matsuda, Science 331, 439 (2011).
- Shibauchi et al. (2014) T. Shibauchi, H. Ikeda, and Y. Matsuda, Philos. Mag. 94, 3747 (2014).
- Tonegawa et al. (2012) S. Tonegawa, K. Hashimoto, K. Ikada, Y. H. Lin, H. Shishido, Y. Haga, T. D. Matsuda, E. Yamamoto, Y. Onuki, H. Ikeda, Y. Matsuda, and T. Shibauchi, Phys. Rev. Lett. 109, 036401 (2012).
- Tonegawa et al. (2013) S. Tonegawa, K. Hashimoto, K. Ikada, Y. Tsuruhara, Y. H. Lin, H. Shishido, Y. Haga, T. D. Matsuda, E. Yamamoto, Y. Onuki, H. Ikeda, Y. Matsuda, and T. Shibauchi, Phys. Rev. B 88, 245131 (2013).
- Kambe et al. (2013b) S. Kambe, Y. Tokunaga, H. Sakai, T. D. Matsuda, Y. Haga, Z. Fisk, and R. E. Walstedt, Phys. Rev. Lett. 110, 246406 (2013b).
- Riggs et al. (2015) S. C. Riggs, M. C. Shapiro, A. V. Maharaj, S. Raghu, E. D. Bauer, R. E. Baumbach, P. Giraldo-Gallo, M. Wartenbe, and I. R. Fisher, Nat. Commun. 6, 6425 (2015).
- Tabata et al. (2014) C. Tabata, T. Inami, S. Michimura, M. Yokoyama, H. Hidaka, T. Yanagisawa, and H. Amitsuka, Philos. Mag. 94, 3691 (2014).
- (54) T. Yanagisawa, to be published .
- Yanagisawa et al. (2012) T. Yanagisawa, S. Mombetsu, H. Hidaka, H. Amitsuka, M. Akatsu, S. Yasin, S. Zherlitsyn, J. Wosnitza, K. Huang, and M. Brian Maple, J. Phys. Soc. Jpn. 82, 013601 (2012).
- Hassinger et al. (2008) E. Hassinger, G. Knebel, K. Izawa, P. Lejay, B. Salce, and J. Flouquet, Phys. Rev. B 77, 115117 (2008).
- Neumeier et al. (2001) J. J. Neumeier, A. L. Cornelius, and K. Andres, Phys. Rev. B 64, 172406 (2001).
- Schmiedeshoff et al. (2006) G. M. Schmiedeshoff, S. M. Hollen, S. L. Bud’ko, and P. C. Canfield, AIP Conference Proceedings 850, 1297 (2006).
- Gasparini et al. (2010) A. Gasparini, Y. K. Huang, J. Hartbaum, H. v. Löhneysen, and A. de Visser, Phys. Rev. B 82, 052502 (2010).
- Sakarya et al. (2003) S. Sakarya, N. H. van Dijk, A. de Visser, and E. Brück, Phys. Rev. B 67, 144407 (2003).
- Pippard (1964) A. Pippard, Elements of Classical Thermodynamics:For Advanced Students of Physics (Cambridge University Press, 1964).
- Eloirdi et al. (2017) R. Eloirdi, C. Giacobbe, P. A. Celdran, N. Magnani, G. H. Lander, J. C. Griveau, E. Colineau, K. Miyake, and R. Caciuffo, Phys. Rev. B 95, 094517 (2017).
- da Luz et al. (2009) M. S. da Luz, J. J. Neumeier, R. K. Bollinger, A. S. Sefat, M. A. McGuire, R. Jin, B. C. Sales, and D. Mandrus, Phys. Rev. B 79, 214505 (2009).
- Correa et al. (2012) V. F. Correa, S. Francoual, M. Jaime, N. Harrison, T. P. Murphy, E. C. Palm, S. W. Tozer, A. H. Lacerda, P. A. Sharma, and J. A. Mydosh, Phys. Rev. Lett. 109, 246405 (2012).
- Stillwell et al. (2017) R. L. Stillwell, I. L. Liu, N. Harrison, M. Jaime, J. R. Jeffries, and N. P. Butch, Phys. Rev. B 95, 014414 (2017).
- Shrestha et al. (2017) K. Shrestha, D. Antonio, M. Jaime, N. Harrison, D. S. Mast, D. Safarik, T. Durakiewicz, J. C. Griveau, and K. Gofryk, Sci. Rep. 7, 6642 (2017).