Recurrent outbursts revealed in 3XMM J031820.8-663034
Abstract
3XMM J031820.8-663034, first detected by ROSAT in NGC 1313, is one of a few known transient ultraluminous X-ray sources (ULXs). In this paper, we present decades of X-ray data of this source from ROSAT, XMM-Newton, Chandra and the Neil Gehrels Swift Observatory. We find that its X-ray emission experienced four outbursts since 1992, with a typical recurrent time 1800 days, an outburst duration days, and a nearly constant peak X-ray luminosity erg/s. The upper limit of X-ray luminosity at the quiescent state is erg/s, and the total energy radiated during one outburst is erg. The spectra at the high luminosity states can be described with an absorbed disk black-body, and the disk temperature increases with the X-ray luminosity. We compare its outburst properties with other known transient ULXs including ESO 243-49 HLX-1. As its peak luminosity only marginally puts it in the category of ULXs, we also compare it with normal transient black hole binaries. Our results suggest that the source is powered by an accreting massive stellar-mass black hole, and the outbursts are triggered by the thermal-viscous instability.
Subject headings:
accretion, accretion disks — black hole physics — X-rays: binaries — X-rays: stars — X-rays: individual (3XMM J031820.8-663034)1. Introduction
Galactic low-mass X-ray binaries (LMXBs) span most their time in quiescence and enter into outbursts occasionally with X-ray luminosity increased by several orders of magnitude (e.g. Chen et al., 1997; Corral-Santana et al., 2016). Black hole LMXBs manifest themselves into five well-known spectral states (see Fender et al., 2004; McClintock & Remillard, 2006; Zhang, 2013; Yuan & Narayan, 2014, for reviews). As luminosity increases, sources leave the “off” state (i.e. the quiescent state, erg/s), and enter the low/hard state and the high/soft state. The X-ray spectra at the low/hard and the quiescent states are dominated by a power-law component. In contrast, the high/soft state is dominated by thermal emission from the accretion disk with much weaker variabilities. Meanwhile, the very high state and the intermediate state, representing transitions between the low/hard state and the high/soft state (e.g. McClintock & Remillard, 2006), have more complex spectral and temporal behaviors. Additionally, a few rare LMXBs could show episodes of super-Eddington accretion, e.g. V4641 Sgr (Revnivtsev et al., 2002) and V404 Cyg (e.g. Motta et al., 2017). The behaviors become sophisticated in these outbursts, and the knowledge on them is rather rudimentary.
It is widely accepted that outbursts of LMXBs result from thermal-viscous instability in accretion disk (e.g. Chen et al., 1997; Dubus et al., 2001). When the mass transfer rate from the donor star onto the compact object is less than a critical value, the inner region of the accretion disk is hot while the temperature of the outer disk drops below 6000 K – somewhere in between the disk should hence be unstable. This is because the accretion material in this region is partially ionized, and the hydrogen recombination results in a large change in opacity. Consequently, this region could be out of thermal-viscous equilibrium, and the instability would propagate in the disk, triggering an outburst. It has been noticed that such standard disk instability model (DIM) fails to explain some observed properties of the outbursts (e.g. the typical “fast-rise exponential-decay” light curves), and additional irradiation and truncation disk effects should be taken into account (see Lasota, 2001, for reviews).
Compared to LMXBs, ultraluminous X-ray sources (ULXs) found in nearby galaxies are more powerful ( erg/s) and more stable in X-ray (see Feng & Soria, 2011; Kaaret et al., 2017, for reviews). In general, the X-ray luminosities of ULXs vary by a factor of . For instance, M33 X-8 exhibits an X-ray variation amplitude of since discovered in 1981 (Weng et al., 2009; La Parola et al., 2015). Since their temporal and spectral properties are quite different from those observed in LMXBs, most ULXs are suggested as massive stellar-mass black holes (MsBHs, ) with super-Eddington accretion (Feng & Soria, 2011; Weng et al., 2014). In such an system, the mass transfer rate is large enough to keep the whole disk fully ionized (with the aid of powerful irradiation), and therefore the accretion proceeds stably.
However, a number of ULXs show more dramatic luminosity variations, manifesting themselves as transients (e.g. Zezas et al., 2006; Grimm et al., 2007; Crivellari et al., 2009). These sources may provide a bridge between LMXBs and luminosity ULXs. Due to the lack of observations, only a few transient ULXs have been studied in detail (e.g. Kaur et al., 2012; Middleton et al., 2012). It is yet unclear whether the outbursts in transient ULXs are driven by the DIM.
3XMM J031820.8-663034 (R.A. = 03:18:20.8, Dec = -66:30:35) is 0.8′ away from the center of NGC 1313. It was first detected by ROSAT with a maximum X-ray luminosity of erg/s (Liu & Bregman, 2005) by assuming a distance of Mpc (Gao et al., 2015). Investigating a set of XMM-Newton data, Lin et al. (2014) found that the source was only detected in two out of fourteen observations, revealing a transient nature of this source. Because there are two persistent ULXs (i.e. NGC 1313 X-1 and NGC 1313 X-2, Petre et al., 1994; Makishima et al., 2000; Bachetti et al., 2013; Weng et al., 2014; Pinto et al., 2016; Kosec et al., 2018), and one bright supernova (SN 1978K, Ryder et al., 1993; Zhao et al., 2017) in this region, numerous X-ray observations have been devoted to explore the spectral evolution of these sources. In this paper, we analyze all available X-ray data of 3XMM J031820.8-663034, collected by ROSAT, Chandra, XMM-Newton, and the Neil Gehrels Swift Observatory, and report its recurrent activities. The data reduction and results are described in §2. Because its peak luminosity marginally puts it in the category of ULXs, we compare in §3 its outburst properties with those of both known transient ULXs and normal LMXBs. We also discuss the origin of the outbursts and determine the black hole mass in 3XMM J031820.8-663034 according to the spectral investigation (§3).
2. Data Reduction & Results
2.1. XMM-Newton data
A total of 21 XMM-Newton observation covering 3XMM J031820.8-663034 were made from 2000 October and 2016 March (Table 1). We reduce all data collected from the EPIC camera (Strüder et al., 2001; Turner et al., 2001) using the Science Analysis System software (sas) version 14.0.0111https://heasarc.gsfc.nasa.gov/docs/xmm/abc/, and the intervals contaminated by flaring particle background are discarded. Besides the detections during two observations reported in Lin et al. (2014), the source turned up on MJD 56844 again. For the first two observations, only the EPIC-pn data are analyzed because the source fell in CCD gaps of MOS1/MOS2. Due to the same reason, we only use MOS1/MOS2 data for the observation on MJD 56844. Circular regions with radii of 15″and 30″are adopted for the source and background (nearby source free region), respectively. The spectral response files are generated by the sas task rmfgen and arfgen, and the spectra are grouped to have at least 15 counts per bin with the task specgroup to enable the use of chi-square statistics.
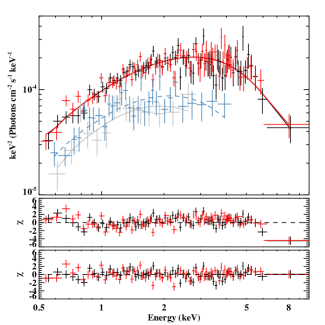
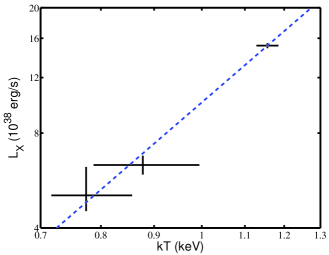
Both an absorbed steep power-law () and a disk black-body (tbabs*diskbb in XSPEC, Arnaud, 1996) provide adequate fits to the first two observations (Figure 1 and Table 2). The derived parameters are consistent with those reported by Lin et al. (2014, Table 3 in their paper). The spectrum obtained on MJD 56844, however, is poorly fitted by an absorbed power-law (, Table 2 and Figure 1), corresponding to a null hypothesis probability of . Contrarily, the data can be well described by a disk black-body (), and an additional power-law component is statistically not required ( according to F-). As shown in Figure 2, the disk temperature () increases with the unabsorbed X-ray luminosity in 0.5–10 keV. We fit the relation with a power-law function and take the error of into account. The best fitted power-law index is roughly consistent with (as predicted by the standard disk model with a constant inner radius, i.e. the innermost stable circular orbit).
3XMM J031820.8-663034 was not detected in the other 18 XMM-Newton observations, and 2 upper limits to the source count rates are estimated with the sas task eregionanalyse (Table 1).
| Instrument | ObsID | Date | MJD | Energy | Net exposure | Count rate | Flux |
|---|---|---|---|---|---|---|---|
| (keV) | (ks) | (cts s-1) | (erg cm-2 s-1) | ||||
| XMM-Newton/pnM | 0106860101 | 2000-10-17 | 51834 | 0.5–10 | 22.3 | ||
| XMM-Newton/pnT | 0150280101 | 2003-11-25 | 52968 | 0.5–10 | 1.2 | ||
| XMM-Newton/pnT | 0150280301 | 2003-12-21 | 52994 | 0.5–10 | 8.6 | ||
| XMM-Newton/pnT | 0150280401 | 2003-12-23 | 52996 | 0.5–10 | 4.1 | ||
| XMM-Newton/pnT | 0150280501 | 2003-12-25 | 52998 | 0.5–10 | 6.0 | ||
| XMM-Newton/pnT | 0150280601 | 2004-01-08 | 53012 | 0.5–10 | 10.2 | ||
| XMM-Newton/pnT | 0150281101 | 2004-01-16 | 53020 | 0.5–10 | 5.9 | ||
| XMM-Newton/pnT | 0205230201 | 2004-05-01 | 53126 | 0.5–10 | 0.7 | ||
| XMM-Newton/pnT | 0205230301 | 2004-06-05 | 53161 | 0.5–10 | 10.0 | ||
| XMM-Newton/pnT | 0205230401 | 2004-08-23 | 53240 | 0.5–10 | 10.1 | ||
| XMM-Newton/pnT | 0205230501 | 2004-11-23 | 53332 | 0.5–10 | 12.5 | ||
| XMM-Newton/pnT | 0205230601 | 2005-02-07 | 53408 | 0.5–10 | 9.8 | ||
| XMM-Newton/pnM | 0301860101 | 2006-03-06 | 53800 | 0.5–10 | 19.9 | ||
| XMM-Newton/pnM | 0405090101 | 2006-10-15 | 54023 | 0.5–10 | 98.8 | ||
| XMM-Newton/pnM | 0693850501 | 2012-12-16 | 56277 | 0.5–10 | 110.7 | ||
| XMM-Newton/pnM | 0693851201 | 2012-12-22 | 56283 | 0.5–10 | 114.8 | ||
| XMM-Newton/pnM | 0722650101 | 2013-06-08 | 56451 | 0.5–10 | 22.3 | ||
| XMM-Newton/MOSM | 0742590301 | 2014-07-05 | 56844 | 0.5–10 | 61.0/61.0 | ||
| XMM-Newton/pnM | 0742490101 | 2015-03-30 | 57111 | 0.5–10 | 94.8 | ||
| XMM-Newton/pnT | 0764770101 | 2015-12-05 | 57361 | 0.5–10 | 65.3 | ||
| XMM-Newton/pnT | 0764770401 | 2016-03-23 | 57470 | 0.5–10 | 21.9 | ||
| Swift/XRT | … | Quiescence∗ | … | 0.3–10 | 365 | ||
| ROSAT/PSPC | rp600045n00 | 1991-04-24 | 48371 | 0.1–2.5 | 11.0 | ||
| ROSAT/HRI | rh400065n00 | 1992-04-18 | 48730 | 0.1–2.5 | 5.4 | ||
| ROSAT/PSPC | rp600504n00 | 1993-11-03 | 49294 | 0.1–2.5 | 15.2 | ||
| ROSAT/HRI | rh600505n00 | 1994-06-23 | 49527 | 0.1–2.5 | 22.6 | ||
| ROSAT/HRI | rh500403n00 | 1995-01-31 | 49748 | 0.1–2.5 | 13.6 | ||
| ROSAT/HRI | rh500404n00 | 1995-02-02 | 49750 | 0.1–2.5 | 27.4 | ||
| ROSAT/HRI | rh600505a01 | 1995-04-12 | 49819 | 0.1–2.5 | 20.4 | ||
| ROSAT/HRI | rh500404a01 | 1995-05-08 | 49845 | 0.1–2.5 | 19.1 | ||
| ROSAT/HRI | rh500403a01 | 1995-05-09 | 49846 | 0.1–2.5 | 31.4 | ||
| ROSAT/HRI | rh500492n00 | 1997-09-30 | 50721 | 0.1–2.5 | 23.0 | ||
| ROSAT/HRI | rh500550n00 | 1998-03-21 | 50893 | 0.1–2.5 | 24.2 | ||
| Chandra/HRC-I | 2935 | 2002-09-19 | 52536 | 0.08–10 | 1.8 | ||
| Chandra/ACIS-S | 2950 | 2002-10-13 | 52560 | 0.5–7 | 19.9 | ||
| Chandra/ACIS-I | 3550 | 2002-11-09 | 52587 | 0.5–7 | 14.6 | ||
| Chandra/ACIS-I | 3551 | 2003-10-02 | 52914 | 0.5–7 | 14.8 | ||
| Chandra/ACIS-S | 4747 | 2003-11-17 | 52960 | 0.5–7 | 5.3 | ||
| Chandra/ACIS-S | 4748 | 2004-02-22 | 53057 | 0.5–7 | 5.1 | ||
| Chandra/ACIS-S | 4750 | 2004-02-22 | 53057 | 0.5–7 | 4.7 | ||
| Chandra/ACIS-I | 14676 | 2012-12-17 | 56278 | 0.5–7 | 9.8 | ||
| Chandra/ACIS-I | 15594 | 2012-12-24 | 56285 | 0.5–7 | 9.8 |
Note. — Energy: Energy band used to estimate the photon counts from each instrument. pnM: Medium filter was used. pnT: Thin filter was used. Quiescence: The summed image in 0.3–10 keV is generated for all Swift/XRT in the quiescence state (see text). Count rate: The 95.45% confidence upper limit in the corresponding energy band is given when the source is undetected. Flux: The unabsorbed flux (or its upper limit) in 0.5–10 keV is estimated by assuming a power-law model ( cm-2 and ).
| Observatory | MJD | /dof | /dof | Flux | |||||
|---|---|---|---|---|---|---|---|---|---|
| ( cm-2) | ( cm-2) | (keV) | () | ||||||
| XMM-Newton | 53332 | 9.8/12 | 11.0/12 | ||||||
| XMM-Newton | 53408 | 21.3/28 | 25.1/28 | ||||||
| XMM-Newton | 56844 | 229.7/137 | 151.4/137 | ||||||
| Swift | 55050–55200♯ | 19.2/22 | 18.7/22 | ||||||
| Swift | 56800–57100 | 16.5/22 | 15.3/22 |
Note. — Flux: 0.5–10.0 keV absorbed flux calculated with the disk black-body model in units of erg cm-2 s-1. All errors are in the 90% confidence level (1.645 ). : The C-statistic is adopted for the spectral fitting.
2.2. Swift observations
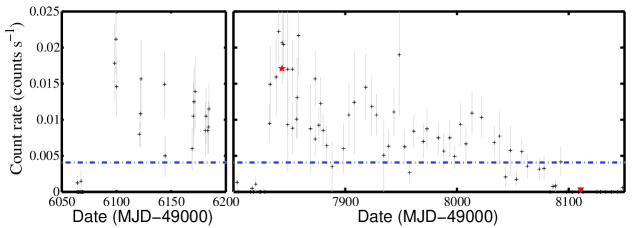
In this work, we analyze all 371 Swift (Gehrels et al., 2004) observations made before 2017 July. Two episodic outbursts of 3XMM J031820.8-663034 have been caught by the Swift dense observations, and Swift monitored the second entire outburst (Figure 3). The exposure time of individual Swift observations ranges from 138 s to 7.75 ks, with a mean value of 1.3 ks. We extract the source counts in 0.3–10 keV band from a circle aperture with a radius of 6 pixels centered at the source position, and the background from nearby source free regions. The telescope vignetting and point spread function corrections are applied by running the Swift script xrtlccorr.
Due to the limited photons in individual pointings, we stack all observations during each of the two outbursts. As only 137 photon counts were collected during the outburst in MJD 55050–55200, we rebin the spectrum to have at least 5 counts per bin and employ the C-statistic (Cash, 1979) in spectral fitting. During the 2nd outburst, a total of 396 counts were detected. We group the spectrum to have at least 15 counts per bin and the common statistic is applied. The spectral modeling confirms that the X-ray spectra during the outbursts are very soft, and can be fitted by either an absorbed steep power-law () or a disk black-body (Table 2). During other Swift observations, 3XMM J031820.8-663034 remains undetected. We estimate an upper limit of count rate cts/s (or an upper limit of LX erg/s) by summing all observations in the off state (with total exposure of ks from 285 snapshots).
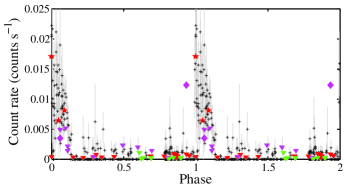
As shown explicitly in Figure 3, 3XMM J031820.8-663034 has almost the same peak luminosity during two outbursts. Coincidentally, when the source reached the peak of the second outburst, the XMM-Newton observation recorded an X-ray luminosity of erg/s (Section 1). Using the XMM-Newton spectral fitting model, we convert count rates (and upper limits) from different instruments into those expected from Swift/XRT, and plot them in Figures 3 and 4 for comparison.
2.3. ROSAT and Chandra archival data
We employ the ximage software to measure the count rate in all 9 ROSAT/HRI and 2 ROSAT/PSPC images (Truemper, 1982; Pfeffermann et al., 1987). 3XMM J031820.8-663034 was detected in 2 images (), and a maximum count rate ( cts/s) was obtained on MJD 49527 (see Table 1). Assuming a power-law with photon index of 1.7, we run the tool WebPIMMS222https://heasarc.gsfc.nasa.gov/cgi-bin/Tools/w3pimms/w3pimms.pl and estimate an unabsorbed luminosity of erg/s (0.5 – 10 keV), which is consistent with the value reported in Liu & Bregman (2005).
From September, 2002 to December, 2012, Chandra (Weisskopf et al., 2000) visited the source region 9 times. However, the 3XMM J031820.8-663034 was in quiescence state and was not detected in any observation. We estimate the flux upper limit with the tasks srcflux/aprates 333http://cxc.harvard.edu/ciao/threads/upperlimit/ in the ciao444http://asc.harvard.edu/ciao/ software (version 4.6.7). The deepest observation (ObsID = 2950) yields the strongest upper limit to its X-ray luminosity ( erg/s), which is more than two orders of magnitude fainter comparing with its maximum luminosity during the outbursts.
2.4. Outburst parameters
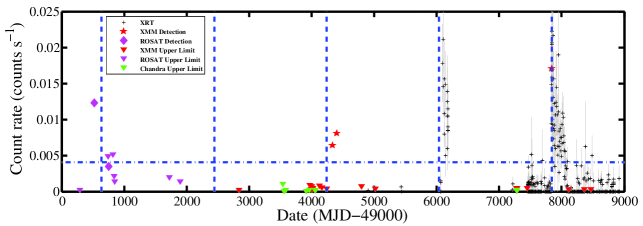
The Swift monitored the entire outburst from MJD 56800 to 57100, suggesting a fast rise slow decay light curve profile, an outburst duration of days and a total energy radiated during the outburst of erg/s. However, we are unable to determine the light curve profile precisely, including the rise and decay timescales owing to the large uncertainties of Swift data. The maximum fluxes recorded in ROSAT, Swift, and XMM-Newton data indicate that the peak luminosity remains constant ( erg/s) during different outbursts. The strongest upper limit for the quiescence state comes from the deepest Chandra pointing, indicating a variation amplitude of .
We plot X-ray count rates (and upper limits) from all observations in Fig. 4. All count rates from instruments other than Swift/XRT are converted into (with WebPIMMS) XRT count rates for comparison. For three XMM detections, the best-fit spectral models were adopted for the conversion. For ROSAT observations and all other upper limits, as accurate spectral modeling is unavailable, we assume a typical low/hard state spectrum for conversion, i.e. a hard power-law model ( cm-2 and ).
It seems that the source enters into outburst regularly with a recurrent time of days. We calculate the Lomb-Scargle periodogram (Horne & Baliunas, 1986) in a timescale range from 10 days to 5000 days with 50,000 independent frequencies. Since the source was non-detected during most observations, omitting these non-detections would yield too sparse sampling, and no periodical signal emerges in the periodogram. Here, we take all data into account, and 2 upper limits to the count rates are adopted for those non-detections. As can be seen in Figure 5, the signal at 1750 days and its 2nd/3rd harmonic frequencies (P 815/580 days) are higher than 99.9% white noise confidence level. Because the structured window function might lead to aliasing of signals in the data (e.g. VanderPlas, 2017), we examine the window power spectrum and do not find any significant feature. We further model the periodogram in the range of 1500-2000 days with a Gaussian, yielding a best-fit period of 1744 days with a FWHM of 418 days. The recurrent time of days is also verified with the folded light curve (Figure 6). However, we would like to caution that the periodic signal can not be robustly confirmed for the following reasons: (1) The source was not detected in many observations, and upper limits used in the test may introduce large uncertainty. (2) The confidence level of signals would be lower than the 99.9% with different assumptions of the noise (e.g. red noise). Future monitoring data are required to check the recurrence period.

3. Discussion & Conclusions
In this work, we investigate the wealth of X-ray data of 3XMM J031820.8-663034 and reveal four periods of activities, making it as a transient ULX. The outburst properties are summarized as follows: (1) The outbursts likely occur regularly; (2) One outburst with sufficiently dense sampling exhibits a fast rise slow decay profile; (3) The peak X-ray luminosity erg/s does not change much among different outbursts; (4) The source occupies the thermal state at the high luminosity; (5) The deepest Chandra observation provides a luminosity upper limit of erg/s for the quiescent state.
The evolving soft X-ray spectra from 3XMM J031820.8-663034 imply its accretion nature and the accreting object could be a black hole. High-mass X-ray binaries commonly consist of a neutron star and a young massive star, and have very hard X-ray spectra (e.g. Fabbiano, 2006; Walter et al., 2015; Wang et al., 2016b). Thereby, the scenario of a canonical high-mass X-ray binary is disfavored for 3XMM J031820.8-663034. Because its peak luminosity marginally puts the source in the category of ULXs, below we compare its outburst properties with normal transient black hole binaries and other known transient ULXs including the intermediate-mass black hole candidate ESO 243-49 HLX-1.
3.1. Association with NGC 1313
Before discussing the nature of outbursts, we need to determine whether 3XMM J031820.8-663034 is associated with NGC 1313, or a foreground/background object. The high Galactic latitude ( and ) indicates that the source is unlikely a foreground star. Moreover, if the source is at a distance of less than 10 kpc, its peak X-ray luminosity during the outbursts would be less than erg/s. The X-ray spectrum of such a very faint X-ray transient should be dominated by non-thermal component (e.g. McClintock & Remillard, 2006; Weng & Zhang, 2015; Wijnands et al., 2015), contradicting the XMM-Newton and Swift observations which are in favor of the thermal dominated spectra. We can therefore exclude the possibility of a Galactic counterpart.
Alternatively, we estimate the probability of background QSO/AGN using X-ray log–log (e.g. Wang et al., 2016a). According to the new XMM-Newton detection, the source has an absorbed flux in 0.5–2 keV of erg/cm2/s. We would expect 0.5 contaminating source per square degree with the same or higher flux based on the Lockman Hole log–log relation (Hasinger et al., 1998; Mushotzky et al., 2000; Moretti et al., 2003; Wang et al., 2016a). Meanwhile, the isophote of NGC 1313 is about (Liu & Bregman, 2005), and the distance between 3XMM J031820.8-663034 and the center of NGC 1313 is . Therefore, the number of expected background sources within the D25 of NGC 1313 (or in 0.8′) is only (or ). Furthermore, the chance that a background source has similar dramatic variations is even lower. We thus conclude the association of 3XMM J031820.8-663034 with NGC 1313 is convincing.
3.2. Repeated outbursts
A straightfoward explanation for the regular outbursts is that the mass transfer rate is significantly enhanced during the periastron passage of the donor star bounded to the black hole in an eccentric orbit. However the formation of a black hole binary with such long period ( days) could be challenging. To our knowledge, GRS 1915+105 has the longest orbital period ( days, Greiner et al., 2001) among LMXBs (Liu et al., 2007). Meanwhile, very few high-mass X-ray binaries have periods longer than 103 days (Liu et al., 2006), e.g. PSR B1259-63 ( years, Johnston et al., 1994) and PSR J2032+4127 ( years, Lyne et al., 2015; Ho et al., 2017), both of which are faint in X-ray ( erg/s). On the other hand, during the early observations HLX-1 displayed regular outbursts at an interval of yr (Farrell et al., 2009a; Webb et al., 2012). However, the initial hypothesis that the recurrence time corresponded to the binary period became controversial due to the increasing of the detected recurrence time (Godet et al., 2014; Weng & Feng, 2018).
In addition, the super-orbital periods have been reported in tens of X-ray binaries (Sood et al., 2007; Farrell et al., 2009b), and some of them could be more than days (e.g. 1667 days for LS I +61 303, Li et al., 2012), similar to the recurrent time of 3XMM J031820.8-663034. However the amplitude of super-orbital modulation (e.g. Smith et al., 2007; Corbet & Krimm, 2013) is significantly smaller than that of 3XMM J031820.8-663034 (). Thus, whether the outbursts of 3XMM J031820.8-663034 are some kind of super-orbital modulation is still questionable.
Note a small number of LMXBs, e.g. 4U 1630-47 (Parmar, 1995; Capitanio et al., 2015) and H1743-322 (Yan et al., 2015), exhibited some successive (not all) outbursts equally spaced in time. The light curve profiles of these outbursts could be complicated, but not always the typical “fast-rise exponential-decay”. It was suggested that the periodicity was resulted from the DIM, or sometimes with additional perturbation from the companion star mass transfer (Capitanio et al., 2015). Here, since only four outbursts are recorded for 3XMM J031820.8-663034 and the observation cadence is incomplete, we suggest that more monitoring data are required to check whether the quasi-periodic behaviors are temporary or represent some process in physics. As further discussed below, all available data at the current stage can be interpreted with the DIM.
3.3. Outburst mechanism
There are two transient ULXs detected in M31, i.e. CXOM31 J004253.1+411422 (Kaur et al., 2012; Middleton et al., 2012) and XMMU J004243.61+412519 (Middleton et al., 2013). Middleton et al. (2012) found the X-ray luminosity of CXOM31 J004253.1+411422 steadily declined from erg/s to erg/s over 1.5 month (see also Kaur et al., 2012). XMMU J004243.61+412519 entered an outburst in 2012 January, reached a peak X-ray luminosity of erg/s within a few days, and then decayed slowly (Middleton et al., 2013). Their outburst parameters resemble those found in Galactic LMXBs, indicating a DIM origin for these two sources as well (e.g. Yan & Yu, 2015). However only one outburst had been observed for each source thus the recurrence timescale is unavailable.
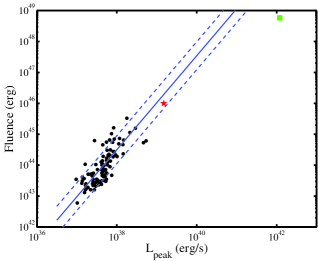
It is worth to note that the recurrence outbursts of the best studied transient ULX, HLX-1, are analogous to the outbursts of 3XMM J031820.8-663034 in many aspects. Meanwhile, the outbursts of HLX-1 have significantly higher luminosity at both active and quiescent states, and smaller amplitude of luminosity variation. The total energy radiated during an outburst is about 2-3 orders of magnitude larger than the averaged value observed in 3XMM J031820.8-663034 (Table 3). Yan et al. (2015) argued that HLX-1 and LMXBs follow the same linear relationship between the hard-to-soft state transition luminosity and the peak luminosity, but the data of HLX-1 deviate the correlation between the X-ray fluence and peak luminosity observed in LMXBs (Figure 7). The minimum observed X-ray luminosity of HLX-1 is up to erg/s, indicating that the thin disk within a very large radius ( cm) is fully ionized because of large accretion rate and the additional heating by the strong irradiation (Dubus et al., 2001; Soria et al., 2017). In this case, the local thermal-viscous instability should be ignited (if existed) at even larger physical radius (not the black hole mass scaled radius). Such instability would take at least 100 years to reach the inner most accretion disc, which however contradicts the observed value of days (Lasota et al., 2011). Therefore, the HLX-1 outbursts are unlikely due to thermal-viscous instability (i.e. DIM) but might be attributed to the radiation pressure instability (Lasota et al., 2011; Sun et al., 2016) or other instabilities.
Investigating the optical/UV and X-ray data, Soria et al. (2017) proposed an oscillating wind scenario for HLX-1: currently its accretion rate is on average of a few percent Eddington and its accretion disk is quite large ( cm); but only the inner region ( cm) of the inflow is modulated by the wind instability (Begelman et al., 1983; Shields et al., 1986), which drives the outbursts at a timescale of yr. Such model might also work for V404 Cyg (Muñoz-Darias et al., 2016). Due to the limited data, we do not know whether the strong wind can be launched from 3XMM J031820.8-663034, and whether the wind instability model is applicable to its repeated outbursts. The model is presented here as an option. Alternatively, we argue that the outburst properties of 3XMM J031820.8-663034 reported in this paper can be understood in the framework of DIM.
The X-ray luminosity at the quiescent state of 3XMM J031820.8-663034 ( erg/s) indicates that the disk is cool due to a low accretion rate and weak irradiation. The partial hydrogen ionization instability (i.e. thermal-viscous instability) thus emerges at a much smaller radius and allows the DIM to work. Additionally, we point out that most of the outbursts properties are consistent with the expectation of DIM: (1) The light curve shows a fast rise slow decay profile. (2) It falls on the same relation between the outburst fluence and the peak luminosity that was found for LMXBs (Yan & Yu, 2015). Such correlation is expected in DIM since the outburst peak increases with the mass of accretion disk (e.g. Dubus et al., 2001). Assuming a constant radiative efficiency, the mass of accretion disk and the peak accretion rate can be estimated from the fluence and the , respectively. (3) Taking the truncation and irradiation effects into account, theoretical DIM models yield the recurrence time of 1 180 years (Dubus et al., 2001; Lasota, 2001), conforming to that of 3XMM J031820.8-663034 ( 1800 days).
In addition to X-ray, the nature of the outbursts can be explored with multi-wavelength data. The optical/UV data could provide key information of the companion star and the X-ray irradiated accretion disk (e.g. Rykoff et al., 2007; Weng & Zhang, 2015; Soria et al., 2017). Furthermore, the connections between accretion flows and the radio jet have been widely studied (e.g. Fender et al., 2004; Zhang et al., 2014). A stable jet is commonly detected in the low/hard state, while the discrete ejection events are found to be associated with the transitions between the low/hard and the high/soft states. We search the radio images in the literature and the SkyView555https://skyview.gsfc.nasa.gov/current/cgi/query.pl, but do not find the point like source at the position of 3XMM J031820.8-663034 in the 1.4 GHz radio continuum map (Ryder et al., 1993) nor the SUMSS 843 MHz image. A detailed analysis on these data is beyond the purpose of this paper.
3.4. Accretion state & black hole mass
Most Galactic LMXBs are in the regime of sub-Eddington accretion with variable X-ray emission. Although different state classifications have been proposed by different authors (e.g. McClintock & Remillard, 2006; Zhang, 2013; Yuan & Narayan, 2014), the low/hard and the high/soft states are normally undisputed. The low/hard state is characterized by a hard spectrum and strong rapid variations. In contrast, the high/soft state is dominated by a thermal disk component and has a low level of variability. Meanwhile, several Galactic LMXBs can occasionally be brighter than erg/s, e.g. GRS 1915+105 (e.g. Belloni et al., 2000; Yan et al., 2017), V4641 Sgr (Revnivtsev et al., 2002) and V404 Cyg (e.g. Motta et al., 2017, and references therein). These three sources are highly variable on time-scales of minutes to hours during the outbursts. In particular, during the 2015 outburst, V404 Cyg showed violent variations in both X-ray and optical bands (Kimura et al., 2016) and the non-thermal dominated X-ray emission (e.g. Sánchez-Fernández et al., 2017; Motta et al., 2017). The source did not enter into the canonical high/soft state, but might be accreting at super-Eddington accretion rate. Its evolution pattern is distinct from other typical LMXBs.
The new XMM-Newton detection of 3XMM J031820.8-663034 performed at the peak of an outburst indicates that its spectrum is dominated by a thermal disk component and no significant variation is detected within the XMM exposure. The X-ray properties are consistent with the definition of the high/soft state, that is, the source reaches a luminosity of during the outbursts. Compared to those Galactic LMXBs at the high/soft state, 3XMM J031820.8-663034 has a higher peak X-ray luminosity ( erg/s), which might indicate a heavier black hole (tens of solar masses) hosted in the system. The MsBH scenario is also supported by the fitted disk black-body normalization (, Arnaud, 1996), which corresponds to a radius of km with a inclination angle of 60° and a spectral hardening factor of 1.7 adopted. If the accretion disk extends to the innermost stable circular orbit, the derived radius corresponds to for a Schwarzschild and a maximally rotating black hole, respectively.
References
- Arnaud (1996) Arnaud, K. A. 1996, in ASP Conf. Ser. 101, Astronomical Data Analysis Software and Systems V, ed. G. H. Jacoby &J. Barnes (San Francisco, CA: ASP), 17
- Bachetti et al. (2013) Bachetti, M., Rana, V., Walton, D. J., et al. 2013, ApJ, 778, 163
- Begelman et al. (1983) Begelman, M. C., McKee, C. F., Shields, G. A., 1983, ApJ, 271, 70
- Belloni et al. (2000) Belloni, T., Klein-Wolt, M., Méndez, M., van der Klis, M., & van Paradijs, J. 2000, A&A, 355, 271
- Capitanio et al. (2015) Capitanio, F., Campana, R., De Cesare, G., Ferrigno, C., 2015, MNRAS, 450, 3840
- Cash (1979) Cash, W., 1979, ApJ, 228, 939
- Chen et al. (1997) Chen, W., Shrader, C. R., Livio, M. 1997, ApJ, 491, 312
- Corbet & Krimm (2013) Corbet, R. H. D. & Krimm, H. A. 2013, ApJ, 778, 45
- Corral-Santana et al. (2016) Corral-Santana, J. M., Casares, J., Muñoz-Darias, T., et al. 2016, A&A, 587, 61
- Crivellari et al. (2009) Crivellari, E., Wolter, A., & Trinchieri, G. 2009, A&A, 501, 445
- Dubus et al. (2001) Dubus, G., Hameury, J. M., Lasota, J. P., 2001, A&A, 373, 251
- Fabbiano (2006) Fabbiano, G. 2006, ARA&A, 44, 323
- Farrell et al. (2009b) Farrell, S. A., Barret, D., Skinner, G. K., 2009b, MNRAS, 393, 139
- Farrell et al. (2009a) Farrell, S. A., Webb, N. A., Barret, D., Godet, O., & Rodrigues, J. M. 2009a, Natur, 460, 73
- Fender et al. (2004) Fender, R. P., Belloni, T. M., & Gallo, E. 2004, MNRAS, 355, 1105
- Feng & Soria (2011) Feng, H., & Soria, R. 2011, New Astron. Rev., 55, 166
- Gao et al. (2015) Gao, Q., Wang, W., Liu, J.-F., & Yoachim, P. 2015, ApJ, 799, 19
- Gehrels et al. (2004) Gehrels, N., Chincarini, G., Giommi, P., et al. 2004, ApJ, 611, 1005
- Godet et al. (2014) Godet, O., Lombardi, J. C., Antonini, F., et al. 2014, ApJ, 793, 105
- Greiner et al. (2001) Greiner, J., Cuby, J. G., & McCaughrean, M. J. 2001, Natur, 414, 522
- Grimm et al. (2007) Grimm, H.-J., McDowell, J., Zezas, A., Kim, D.-W., & Fabbiano, G. 2007, ApJS, 173, 70
- Hasinger et al. (1998) Hasinger, G., Burg, R., Giacconi, R., et al. 1998, A&A, 329, 482
- Ho et al. (2017) Ho, W. C. G., Ng, C.-Y., Lyne, A. G., et al. 2017, MNRAS, 464, 1211
- Horne & Baliunas (1986) Horne, J. H., & Baliunas, S. L. 1986, ApJ, 302, 757
- Johnston et al. (1994) Johnston, S., Manchester, R. N., Lyne, A. G., Nicastro, L., Spyromilio, J., 1994, MNRAS, 268, 430
- Kaaret et al. (2017) Kaaret, P., Feng, H. & Roberts, T. P. 2017, ARA&A, 55, 303
- Kaur et al. (2012) Kaur, A., Henze, M., Haberl, F., et al. 2012, A&A, 538, A49
- Kimura et al. (2016) Kimura, M., Isogai, K., Kato, T., et al. 2016, Nature, 529, 54
- Kosec et al. (2018) Kosec, P., Pinto, C., Fabian, A. C., & Walton, D. J., 2018, MNRAS, 473, 5680
- La Parola et al. (2015) La Parola, V., D Aí, A., Cusumano, G., & Mineo, T. 2015, A&A, 580, A71
- Lasota (2001) Lasota, J. P. 2001, New Astron. Rev., 45, 449
- Lasota et al. (2011) Lasota, J.-P., Alexander, T., Dubus, G., et al. 2011, ApJ, 735, 89
- Lasota et al. (2015) Lasota, J.-P., King, A. R., & Dubus, G. 2015, ApJL, 801, L4
- Li et al. (2012) Li, J., Torres, D. F., Zhang, S., et al. 2012, ApJL, 744, L13
- Lin et al. (2014) Lin, D., Webb, N. A., & Barret, D. 2014, ApJ, 780, 39
- Liu & Bregman (2005) Liu, J.-F., & Bregman, J. N. 2005, ApJS, 157, 59
- Liu et al. (2006) Liu, Q. Z., van Paradijs, J., & van den Heuvel, E. P. J. 2006, A&A, 455, 1165
- Liu et al. (2007) Liu, Q. Z., van Paradijs, J., & van den Heuvel, E. P. J. 2007, A&A, 469, 807
- Lyne et al. (2015) Lyne, A. G., Stappers, B. W., Keith, M. J., Ray, P. S., Kerr, M., Camilo, F., Johnson, T. J., 2015, MNRAS, 451, 581
- Makishima et al. (2000) Makishima, K., Kubota, A., Mizuno, T., et al. 2000, ApJ, 535, 632
- McClintock & Remillard (2006) McClintock, J. E., & Remillard, R. A. 2006, in Compact Stellar X-ray Sources, eds. W.H.G. Lewin and M. van der Klis (Cambridge: Cambridge Univ. Press)
- Middleton et al. (2012) Middleton, M. J., Sutton, A. D., Roberts, T. P., Jackson, F. E., & Done, C. 2012, MNRAS, 420, 2969
- Middleton et al. (2013) Middleton, M. J., Miller-Jones, J. C. A., Markoff, S., et al. 2013, Natur, 493, 187
- Miller et al. (2014) Miller, M. C., Farrell, S. A., & Maccarone, T. J. 2014, ApJ, 788, 116
- Moretti et al. (2003) Moretti, A., Campana, S., Lazzati, D., & Tagliaferri, G. 2003, ApJ, 588, 696
- Motta et al. (2017) Motta, S. E., Kajava, J. J. E., Sánchez-Fernández, C., et al. 2017, MNRAS, 471, 1797
- Mushotzky et al. (2000) Mushotzky, R., Cowie, L., Barger, A., & Arnaud, K. 2000, Nature, 404, 459
- Muñoz-Darias et al. (2016) Muñoz-Darias, T., et al., 2016, Nature, 534, 74
- Parmar (1995) Parmar, A. N., Angelini, L., White, N. E., 1995, ApJL, 452, L29
- Petre et al. (1994) Petre, R., Okada, K., Mihara, T., Makishima, K., & Colbert, E. J. M. 1994, PASJ, 46, L115
- Pfeffermann et al. (1987) Pfeffermann, E., Briel, U. G., Hippmann, H., et al. 1987, Proc. SPIE, 733, 519
- Pinto et al. (2016) Pinto, C., Middleton, M. J., & Fabian, A. C. 2016, Nature, 533, 64
- Reig (2011) Reig, P., 2011, Ap&SS, 332, 1
- Revnivtsev et al. (2002) Revnivtsev, M., Gilfanov, M., Churazov, E., Sunyaev, R., 2002, A&A, 391, 1013
- Ryder et al. (1993) Ryder, S., Staveley-Smith, L., Dopita, M., Petre, R., Colbert, E., Malin, D., & Schlegel, E. 1993, ApJ, 416, 167
- Rykoff et al. (2007) Rykoff, E. S., Miller, J. M., Steeghs, D., & Torres, M. A. P. 2007, ApJ, 666, 1129
- Sánchez-Fernández et al. (2017) Sánchez-Fernández, C., Kajava, J. J. E., Motta, S. E., & Kuulkers, E., 2017, A&A, 602, A40
- Shields et al. (1986) Shields, G. A., McKee, C. F., Lin, D. N. C., Begelman, M. C., 1986, ApJ, 306, 90
- Smith et al. (2007) Smith, D. M., Heindl, W. A., & Swank, J. H. 2002, ApJL, 578, L129
- Sood et al. (2007) Sood, R., Farrell, S., O’Neill, P., & Dieters, S. 2007, Advances in Space Research, 40, 1528
- Soria et al. (2017) Soria, R., Musaeva, A., Wu, K., et al. 2017, MNRAS, 469, 886
- Strüder et al. (2001) Strüder L. et al., 2001, A&A, 365, L18
- Sun et al. (2016) Sun, M., Gu, W.-M., Yan, Z., Wu, Q.-W., & Liu, T. 2016, MNRAS, 463, 99
- Truemper (1982) Truemper, J. 1982, AdSpR, 2, 241
- Turner et al. (2001) Turner M. J. L. et al., 2001, A&A, 365, L27
- VanderPlas (2017) VanderPlas, J. T. 2017, arXiv:1703.09824
- Walter et al. (2015) Walter, R., Lutovinov, A. A., Bozzo, E., & Tsygankov, S. S. 2015, A&A Rev., 23, 2
- Wang et al. (2016b) Wang, S., Liu, J.-F., Qiu, Y.-L., et al. 2016b, ApJS, 224, 40
- Wang et al. (2016a) Wang, S., Qiu, Y.-L., Liu, J.-F. & Bregman, J. N. 2016a, ApJ, 829, 20
- Webb et al. (2012) Webb, N., Cseh, D., Lenc, E., et al. 2012, Sci, 337, 554
- Weisskopf et al. (2000) Weisskopf, M. C., Tananbaum, H. D., Van Speybroeck, L. P., & O Dell, S. L. 2000, Proc. SPIE, 4012, 2
- Weng & Feng (2018) Weng, S.-S., & Feng, H. 2018, ApJ, 853, 115
- Weng et al. (2009) Weng, S.-S., Wang, J.-X., Gu, W.-M., & Lu, J.-F. 2009, PASJ, 61, 1287
- Weng et al. (2014) Weng, S.-S., Zhang, S.-N., & Zhao, H.-H. 2014, ApJ, 780, 147
- Weng & Zhang (2015) Weng, S.-S., & Zhang, S.-N. 2015, MNRAS, 447, 486
- Wijnands et al. (2015) Wijnands, R., Degenaar, N., Armas Padilla, M., et al. 2015, MNRAS, 454, 1371
- Yan & Yu (2015) Yan, Z., & Yu, W. 2015, ApJ, 805, 87
- Yan et al. (2015) Yan, Z., Zhang, W., Soria, R., Altamirano, D., & Yu, W. 2015, ApJ, 811, 23
- Yan et al. (2017) Yan, S.-P., Ji, L., Méndez, M., Liu, S.-M., Wang, N. et al. 2017, MNRAS, 465, 1926
- Yuan & Narayan (2014) Yuan, F., & Narayan, R. 2014, ARA&A, 52, 529
- Zezas et al. (2006) Zezas, A., Fabbiano, G., Baldi, A., et al. 2006, ApJS, 166, 211
- Zhang et al. (2014) Zhang, J.-F., Xu B., Lu J.-F., 2014, ApJ, 788, 143
- Zhang (2013) Zhang, S.-N. 2013, FrPhy, 8, 630
- Zhao et al. (2017) Zhao, H.-H., Weng, S.-S., & Ng, C.-Y. 2017, MNRAS, 468, 1551