Starspot activity and differential rotation in KIC 11560447
Abstract
Using high-precision photometry from the Kepler mission, we investigate patterns of spot activity on the K1-type subgiant component of KIC 11560447, a short-period late-type eclipsing binary. We tested the validity of maximum entropy reconstructions of starspots by numerical simulations. Our procedure successfully captures up to three large spot clusters migrating in longitude. We suggest a way to measure a lower limit for stellar differential rotation, using slopes of spot patterns in the reconstructed time-longitude diagram. We find solar-like differential rotation and recurrent spot activity with a long-term trend towards a dominant axisymmetric spot distribution during the period of observations.
keywords:
stars: activity, (stars:) binaries: eclipsing, stars: late-type, stars: spots1 Introduction
Using uninterrupted, high-precision Kepler photometry, we have been able to uncover the longitudinal distribution of differentially rotating starspots on the primary component of the eclipsing binary KIC 11560447 (K1IV+M5V; d; ). We present a summary of the main results of our extensive study of this system [(Özavcı et al. 2018)].
2 Results
Following stitching and corrections of Kepler data, we solved the system parameters using simultaneously (a) a single-spotted model of the most symmetric light curve in hand, and (b) the radial velocities derived from high-resolution spectra (see [(Özavcı et al. 2018), Özavcı et al. (2018)] for details).
We used the DoTS code [(Collier Cameron 1997)], which uses maximum entropy regularisation techniuque, to invert the light curves for consecutive orbital revolutions. As performance tests, we produced multiple series of synthetic spotted stars and their light curves, using the system parameters we found. Inverting these variable light curves for a thousand consecutive orbits, we reached the following results: (1) our procedure detects spontaneous conglomerations of unresolved small-scale spots as monolithic large spots; (2) it successfully tracks the longitudinal migration of up to three strong spot clusters superposed on randomly changing background of randomly scattered small-scale spots.
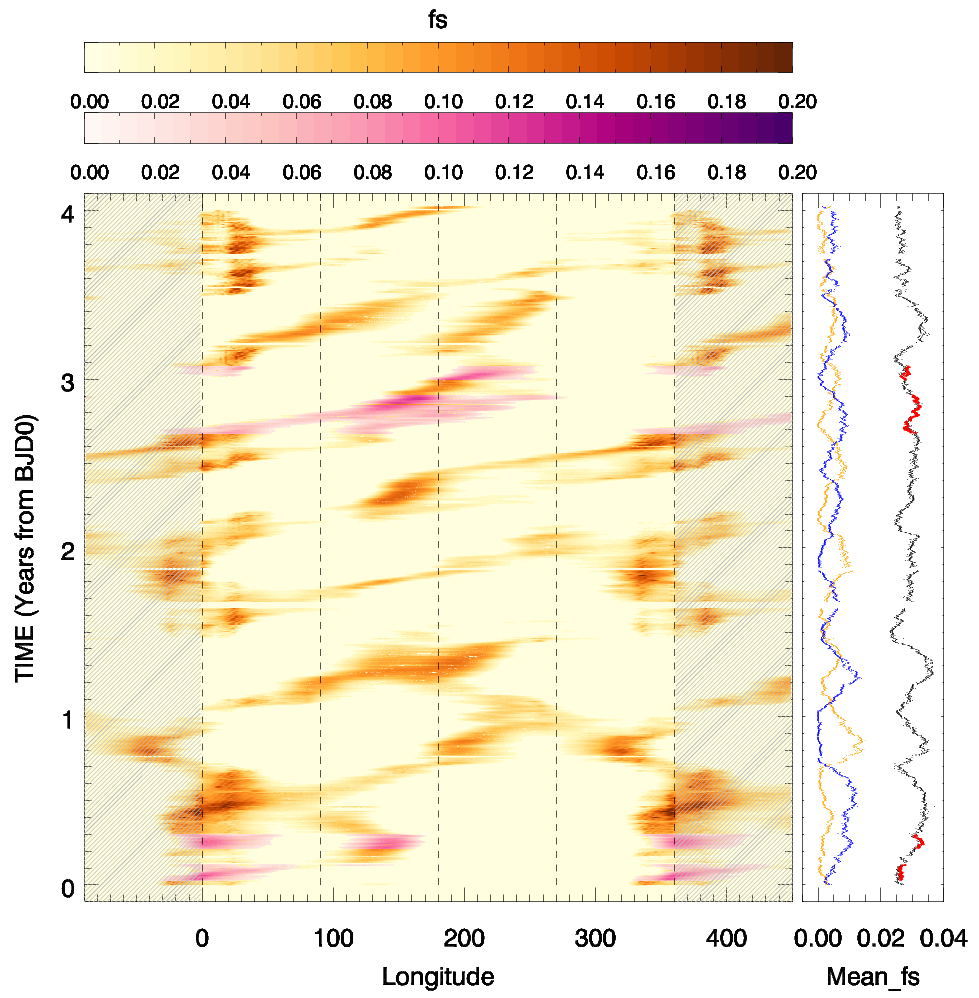
Next, we inverted light curves of the system, using 4-years of Kepler data, where we stopped the iterations at an optimal , below which the procedure attempts to fit photometric noise. The resulting time-longitude diagram of the latitudinally averaged relative spot filling factor of the primary component is shown in Fig. 1, along with global and hemispheric (east and west) mean relative spot coverages. Here, we see that spots or spot groups emerge at certain longitudes, and then they decay, while they rotate in most cases faster than the orbital rate, hence drift prograde. The hemispheric means show the so-called flip-flop pattern. Our numerical experiments have shown that this can be purely related to differential rotation. By fitting lines to such features, we were able to constrain surface differential rotation, which turned out to be compatible with what we get from periodograms of light curves with eclipse effects eliminated. We then measured peak-height ratios in periodograms and found that the differential rotation is solar-like [(Reinhold & Arlt 2015)]. We also found that rotation periods of the prominent spot groups gradually decrease within four years, while the system gets fainter.

Acknowledgements
HVS acknowledges support by the Scientific and Technological Research Council of Turkey (TÜBİTAK) through the project grant 115F033. EI thanks support by the Young Scientist Award Programme BAGEP-2016 of the Science Academy, Turkey.
References
- [(Collier Cameron 1997)] Collier Cameron, A. 1997, MNRAS, 287, 556
- [(Reinhold & Arlt 2015)] Reinhold, T., & Arlt, R. 2015, A&A, 576, A15
- [(Özavcı et al. 2018)] Özavcı, I., Şenavcı, H. V., Işık, E., et al. 2018, MNRAS, 474, 5534