Dusk Over Dawn O2 Asymmetry in Europa’s Near-Surface Atmosphere
Resumen
The evolution of Europa’s water-product exosphere over its 85-hour day, based on current models, has not been shown to exhibit any diurnal asymmetries. Here we simulate Europa’s exosphere using a 3-D Monte Carlo routine including, for the first time, the role of Europa’s rotation on the evolution of exospheric molecules tracked throughout the orbit. In this work we focus on understanding the behavior of a single atmospheric constituent, O2, sputtered by a trailing hemisphere source with a temperature-dependence under isotropic plasma conditions as also modeled by previous works. Under rotation, the O2 is also subject to the centrifugal and Coriolis forces in addition to the standard gravitational forces by Jupiter and Europa in our model. We find that the O2 component, while global, is not homogeneous in Europa local time. Rather, the O2 consistently accumulates along the direction of Europa’s rotation at the dusk hemisphere. When rotation is explicitly excluded in our simulations, no diurnal asymmetries exist, and any accumulation is due to the prescribed geometry of the sputtering source. We find that the assumed thermal-dependence on the O2 source is critical for a diurnal asymmetry: the diurnal surface temperature profile is imprinted on to the near-surface O2 atmosphere, due to small hop times for the non-adsorbing O2, which then effectively rotates with Europa. Simulation tests demonstrate that the diurnal asymmetry is not driven by the thermal inertia of the ice, found to have only a weak dependence (). Altogether, the various test cases presented in this work conclude that the dusk-over-dawn asymmetry is driven by Europa’s day-night O2 cycle synchronized with Europa’s orbital period based on our model assumptions on O2 production and loss. This conclusion is in agreement with the recent understanding that a non-adsorbing, rotating O2 source peaking at noon will naturally accumulate from dawn-to-dusk, should the O2 lifetime be sufficiently long compared to the orbital period. Lastly we compare hemispherically-averaged dusk-over-dawn ratios to the recently observed oxygen emission data by the Hubble Space Telescope. We find that while the simulations are globally consistent with brighter oxygen emission at dusk than at dawn, the orbital evolution of the asymmetries in our simulations can be improved by ameliorating the O2 source & loss rates, and possibly adsorption onto the regolith.
keywords:
Exospheres, O2 , Atmospheres , Aurorae1 Introduction
Europa’s molecular oxygen is of keen interest as it has been suggested to be a possible source of 0.1- 100 kg/s of O2 (Johnson et al., 2003 ; Hand et al., 2007; Greenberg, 2010) to Europa’s putative saltwater ocean, thought to have a chemistry analogous to Earth’s oceans (Vance et al., 2016).
This range of oceanic source rates can in principle be connected to the production and dynamics of the tenuous oxygen atmosphere, or exosphere, which we simulate in this work.
The origin of Europa’s water-product exosphere is ultimately linked to its neighboring satellite Io. Since the Voyager spacecraft first confirmed the presence of energetic ions trapped in the Jovian magnetosphere, the exosphere has been modeled to be predominantly generated by the bombardment of oxygen and sulfur ions ultimately sourced by Io’s extreme volcanism (Peale et al., 1979). These energetic ions both electronically excite and impart significant momentum to the water molecules in Europa’s surface triggering dissociation and chemistry (Johnson et al., 2013). The energy released by these processes leads to the ejection, or sputtering, of water-products: primarily H2O, H2, O2, and trace amounts of OH, H, O, and H2O2, which then populate the exosphere. We focus here on a single component: the molecular oxygen, to isolate our discussion to the orbital evolution of the neutral exosphere. In particular, we focus on the observed near-surface component (Hall et al. 1998) derived to have a variable column density between O2 cm-2 at an altitude below 400 km. The origin and fate of this O2 (Johnson et al. 2018), as well as a comprehensive overview of Europa’s global exosphere (Plainaki et al. 2018) has been recently reviewed.
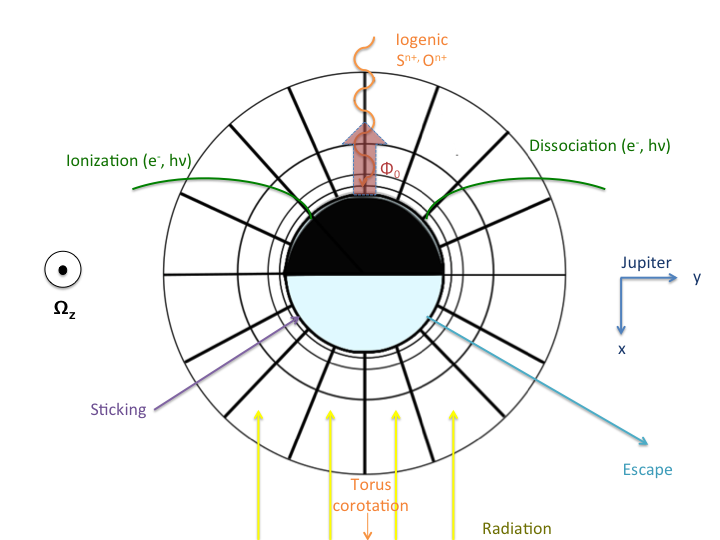
In order to focus primarily on the influence of rotation on Europa’s near-surface atmosphere, we employ a ballistic, 3-D Monte Carlo Exosphere Global Model (EGM: §2 ). The EGM simulates Europa’s neutral exosphere as it orbits Jupiter in Europa’s rotating frame (EphiO). The neutral O2 exosphere is governed by various physical processes illustrated in Fig. 1. The simulations demonstrate how Europa’s near-surface O2 exosphere behaves in the absence of detailed knowledge of influences such as the putative H2O plumes (Roth et al. (2014b); Roth et al. (2014a); Sparks et al. (2016); Teolis and Waite (2016) ; Sparks et al. (2017)) and the near-surface plasma conditions. Although such uncertain effects could be adjusted to fit the observations, here we focus on the neutral dynamics, the effect of the source distribution, and the rotation. Our work includes the influence of Europa’s rotation on the near-surface O2 exosphere for the first time. The simulations are carried out in Europa’s rotating reference frame, where the Coriolis and centripetal forces act on the exospheric molecules under a gravitational potential dictated by both Europa and Jupiter’s gravitational fields.
2 Europa Exosphere Global Model
Europa’s water product exosphere is simulated here by tracking representative particles (H2O, H2, O2, OH, H, and O) in a rotating, non-inertial reference frame, in spherical coordinates , centered on Europa and extending up to . We employ a parallelized Monte Carlo routine which is the core of the Exosphere Global Model (EGM). The numerical routines are similar to those described in detail in Turc et al. (2014), as well as in a companion paper on Ganymede’s orbital evolution (Leblanc et al., 2017), where the collisionless Boltzmann equation is solved for an imposed function distribution at the surface , for a species , a velocity , and the acceleration due to gravity , where r is the radial distance from Europa’s center . For a more detailed description of the EGM we refer the readers to Turc et al. (2014) and Section 2.2 of Leclercq (2015). In the EGM we eject test particles from Europa’s surface following known energy and angle distributions, as described later (§2.1). These test particles are on ballistic (collisionless) trajectories, and can escape, stick, and be re-emitted from the surface depending on their properties as indicated in Fig. 1. The fate of ions is not considered in this work. In the case of O2, we track its interaction with the surface and account for electron and photon induced dissociation as well as ionization. Following dissociation, we also track the O formed. This procedure is carried out until a steady state O2 exosphere is achieved. Steady state in our simulations is achieved when the computed thermodynamic quantities change by less than 10 % from one orbit to the next for any orbital position. These thermodynamic quantities are calculated based on the statistical weights of each test particle: . Here is the flux of ejected test particles, the area of the grid-cell, is the number of time steps between each test particle ejection, and is the time step between two successive positions of the test-particles, chosen so that these two positions are within one cell or two nearby cells. After a sufficient number of time-steps to achieve approximate steady state, the average number density , temperature , and velocity are calculated in each cell on a spherical grid, and at seven orbital positions, the sub-observer longitude of the satellite defined as when Europa is in eclipse behind Jupiter. In our analysis, we display the calculated densities at seven sub-observer longitudes: , , (sunlit leading), , , (sunlit trailing), and . To improve statistics, these quantities are reconstructed on intervals spanning six degrees in orbital longitude, around each orbital position, corresponding to a total of 1.4 hours.
2.1 Sputtering.
The O2 exosphere is thought to be produced primarily by ions originating in the Io-plasma torus. The torus, composed predominantly of sulfur and oxygen ions trapped in Jupiter’s magnetic field rotates, on average, seven times as fast as Europa, with the plasma primarily impacting Europa’s trailing hemisphere in the corotation direction (). Evidence for preferential bombardment of the trailing hemisphere by heavy ions has been observed by the Galileo Near-Infrared Mapping Spectrometer (NIMS) (Carlson et al., 1999). Following (Leblanc et al., 2002), we model the effective ion flux , onto Europa’s trailing hemisphere as diminishing with the corotation longitude :
| (1) |
Where the planetary longitude is 90∘ out of phase with the corotation: . Molecules are ejected from the trailing surface by the energy and momentum deposited by the incident ion flux in the water ice regolith. Here we use sputtering rates summarized in Cassidy et al. (2013) to discuss the fate of the oxygen component. We note that plasma diversion can affect the incoming flux of all ions and electrons, and thus the exact sputtering rates are still uncertain at present (Cassidy, 2016). In Cassidy et al. (2013) both the hot and thermal components of the incident plasma are accounted for as well as the regolith porosity, assuming the surface is primarily pure water ice. Cassidy et al. (2013) construct a temperature-dependent yield as the number of molecules ejected per incident ion based on Fama et al. (2008) and Johnson et al. (2008):
| (2) |
In Equation 2, is the local surface temperature, Y0 the yield at low temperature, and qi scales the temperature dependence of the yield for a species . For the total yield given, in terms of equivalent water molecules, qH2O= 200. The globally averaged O2 ejection rate also depends on the surface temperature of the ice, with , empirically derived from extensive laboratory data described in (Teolis et al. (2010); Teolis et al. (2017)), is O2 s-1, with an H2 yield that is twice this rate. (Cassidy et al., 2013) then estimates a globally averaged sputtering rate: H2O s-1, of which the primary ejecta are H2O, H2, O2 with trace amounts of O, H, OH.
The energy distribution, , of the ejected particles is modeled according to the species in question. The H2O, OH, O, and H are assumed to follow a water-ice sputtering distribution, based on the heavy ion () sputtering of H2O ice (Johnson, 1990):
| (3) |
where x = 0.7, and the effective surface binding energy U = 0.052 eV. The highly volatile molecular species O2 and H2 are produced by radiolysis. As the energetic ions penetrate the ice, they break bonds leading to chemistry and the temperature dependent formation of H2 and O2. The initial ejection energy of O2 (and H2) can also be described by Equation 3 using and U = 0.015 eV (Johnson, 1990). We refer to this distribution as in this work. After the first ejection, those molecules returning to the surface can either react or are subsequently thermally desorbed so that their ejection speeds are roughly determined by a Maxwell Boltzmann (MB) distribution at the surface. The Maxwell Boltzmann speed distribution, accurate for a localized point is given by:
| (4) |
This distribution applies since the desorbed molecules undergo multiple interactions with the surface, which we model to be fast relative to the production of a new O2, and are thus in local thermodynamic equilibrium with the surface ice, with an average energy, .
2.2 Surface Temperature
The effective temperature of the surface ice, is defined by radiative equilibrium. In our model, we consider a slab of ice with conductivity = 2.52 102 erg cm-1 K-1 s-1 (Abramov and Spencer, 2008), and calculate the equilibrium temperature across the surface, over latitude and planetary longitude :
| (5) |
is the total solar irradiance in erg s-1 cm-2 at 1 AU, the orbital distance in AU, and the Stefan-Boltzmann constant. The albedo, , is assumed to vary linearly with between 0.65 on the leading hemisphere and 0.45 on the trailing, approximating the most recent interpretation of Galileo PPR results (Rathbun et al., 2014). The emissivity of the ice, , is set at 0.96. A small correction for the latent heat of sublimation is included (Abramov and Spencer, 2008). Endogenic heatflow, as estimated by Spencer et al. (1999) with an upper limit of 5 108 erg s-1 cm-2, is neglected in this work.
The temperature gradient at the surface, in the last term of Eqn. 5 is given by the one dimensional equation for heat conduction along a direction that is normal to the surface:
| (6) |
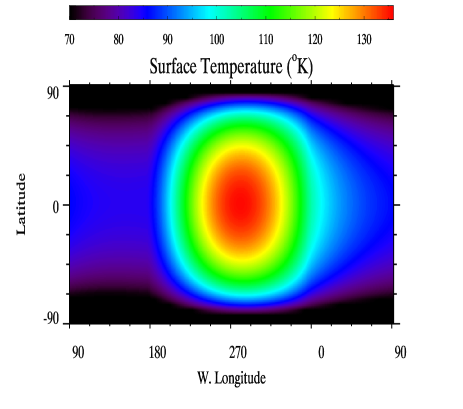
where is the mass density, taken as 0.92 g cm-3, and the specific heat at constant pressure, , is 1.96 107 erg g-1 K-1 (Vance and Goodman, 2009). Eq. 6 is solved with the aid of a thermal routine using the slab boundary method (Spencer et al. (1989); Young (2017)). Forcing of solar insolation over a synodic day in late Feb. 2015 is determined in 2∘ increments of and using the 309.bsp kernel provided by JPL. While this approach simplifies the variation of thermophysical parameters over the surface (Rathbun et al., 2010), it provides a basis for longitudinal asymmetries about the subsolar axis that result from the thermal inertia of the ice.
In Figure 2(a) we show the evolution of Europa’s equatorial surface ice temperature along its orbit in panel A, where we include the effect of Jupiter’s shadow. The Figure 2(a) inlet is a zoom of the eclipse region where Europa’s temperature drops by K before rising to at the brighter, leading hemisphere. Figure 2(b) is the corresponding temperature map of the darker, trailing hemisphere mapped in west longitude. As is true for most planetary bodies, on average, the largest thermal gradient is between noon and midnight, or day and night, as indicated in Fig. 2(b) with a slight increase in surface temperature, K , at dusk over dawn due to the thermal inertia of the ice. The surface temperature inhomogeneities due to thermal inertia, as we will explore below, contribute only to the observed dusk-over-dawn asymmetry.

3 Results
Here we present two results of our 3-D simulations of Europa’s water product exosphere. One in which Europa was held static, and one where Europa was able to rotate about Jupiter’s axis. In this work we focus on understanding the behavior of the primary atmospheric constituent: the near surface O2.
3.1 Atmospheric Bulges
3.1.1 No Rotation: Atmospheric O2 Bulge at Noon
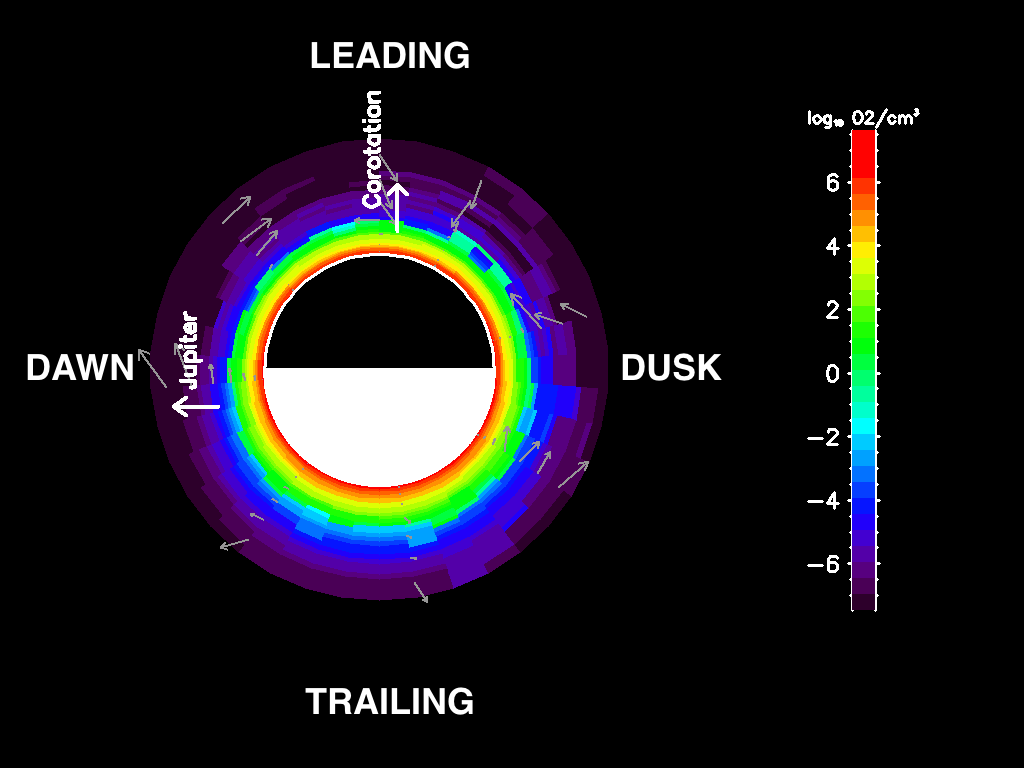
A trailing hemisphere O2 source at Europa may be expected to have a large ’atmospheric bulge’ at plasma ram, where the near-surface column density is larger than the background exosphere. As O2 is thought to weakly interact with the water ice, the O2 migrates stochastically due to the day-night temperature gradient. The gray vectors in our simulation depicted in Figure 3, demonstrate this migration. If migration were rapid, a night-side bulge would be expected like the Helium bulges on the Moon and Mercury (Leblanc and Chaufray, 2011). However, migration is slow compared to the O2 lifetime (c.f. Table 1) such that no asymmetry other than sputtering remains.
In a collisionless exosphere, ejected molecules return to the surface where they stick or are re-emitted with an energy determined by the local, surface ice temperature. On interacting with the surface, the fate of a molecule is sensitive to the surface residence time: where is the effective heat of adsorption. Initially for molecular oxygen, we assume the heat of adsorption is negligible and the surface residence time is extremely short, on the order of the vibration time for a Van der Waals potential () so that O2 has a negligible sticking coefficient. The effect of O2 sticking due to a longer residence time will be examined in section 4. Thus one can treat O2 motion as a series of random walks. Hunten et al. (1988) for example, defines , the ratio of gravitational binding energy, to the thermal energy at the surface, approximately equal to the ratio of planetary radius to the scale height, , so that . , is roughly equivalent to the number of ballistic hops a molecule experiences in traveling an average distance yielding a diffusion timescale: , where is the effective diffusion coefficient. As approximated in Hunten et al. (1988), , so that the migration time for traveling a distance rp at the surface is:
| (7) |
| Timescale () | |||
| Orbital Period | 1.0 | ||
| Ballistic O2 hop | |||
| Day-night migration | 4.2 | ||
| O2 lifetime∗ | 1.08 |
In Table 1, we estimate several timescales scaled to Europa’s orbital period , critical to the evolution of the near-surface O2 in the static and rotating cases (3.1.2). Under a uniform gravitational potential, the ballistic hop time for an O2 molecule is on the order of a few minutes, far shorter than the O2 lifetime. Table 1 also indicates that the O2 lifetime, , limited by the O2 production and loss rates is comparable to the orbital period, yielding an average exospheric column of O2 cm-2. Thus the exosphere, based on our assumptions, should be actively built and destroyed within one orbital timescale. Lastly, it is seen that the timescale for the day-to-night flow , is not only about four times longer than the O2 lifetime in the static case, but also four times as long as the orbital period, in the rotating case. In this way, the net spreading of the O2 source is on average slower than Europa’s orbital speed so we can, to first order, consider the O2 as coupled to the rotating surface. We will demonstrate that this coupling is the principal mechanism for the time-dependent atmospheric O2 bulge.
3.1.2 Rotating Case: Atmospheric O2 Bulge at Dusk.
Once rotation is activated and the O2 column density is tracked throughout the orbit, we simulate an atmospheric bulge persisting throughout Europa’s orbit. What is fascinating about this bulge, representing more than 10 % of the bulk O2 column density, is it exhibits a diurnal dependence peaking consistently at dusk. A diurnal dependence is of course linked to the solar cycle, which in our model only influences the surface ice temperature (Sec. 2.1). As described in Sec. 2.2, the O2 production is strongly dependent on the ice temperature. In this way, one can gain an intuitive understanding of an atmospheric bulge at dusk, by reexamining the timescales in Table 1 alone.
Given that the O2 is effectively coupled to the rotating surface and the near-surface O2 can be expected to follow the diurnal temperature variations in Fig. 2(b), and one can simply consider the atmospheric lifetime of an O2 bulge over one Europa day. For instance, the nominal atmospheric bulge at the sunlit trailing hemisphere noon (Fig. 3), will be able to survive for at least in the direction of rotation towards the dusk hemisphere. This 90∘ shift from noon was derived analytically for a tidally-locked satellite atmosphere in Oza et al. (2018). It was shown that the balance between the satellite’s atmospheric lifetime and orbital period over the orbit can be expressed as a parameter . The rotational shift of an atmospheric column peaking at noon for a thermally-desorbed collisionless exosphere then, can be estimated as: tan. Based on the modeled production and loss timescales, for Europa and for Ganymede (Leblanc et al. 2017), the O2 lifetime approaches one orbital period, so that , yielding . The 90∘ longitudinal shift is responsible for a maximum column at dusk and minimum column at dawn, yielding the dusk-over-dawn atmospheric asymmetry. A dusk-over-dawn asymmetry is not expected if due to far slower O2 loss for example, at Rhea and Dione Teolis and Waite (2016). On the other hand, if , the O2 bulge would be lost too quickly, before it has time to accumulate towards dusk.
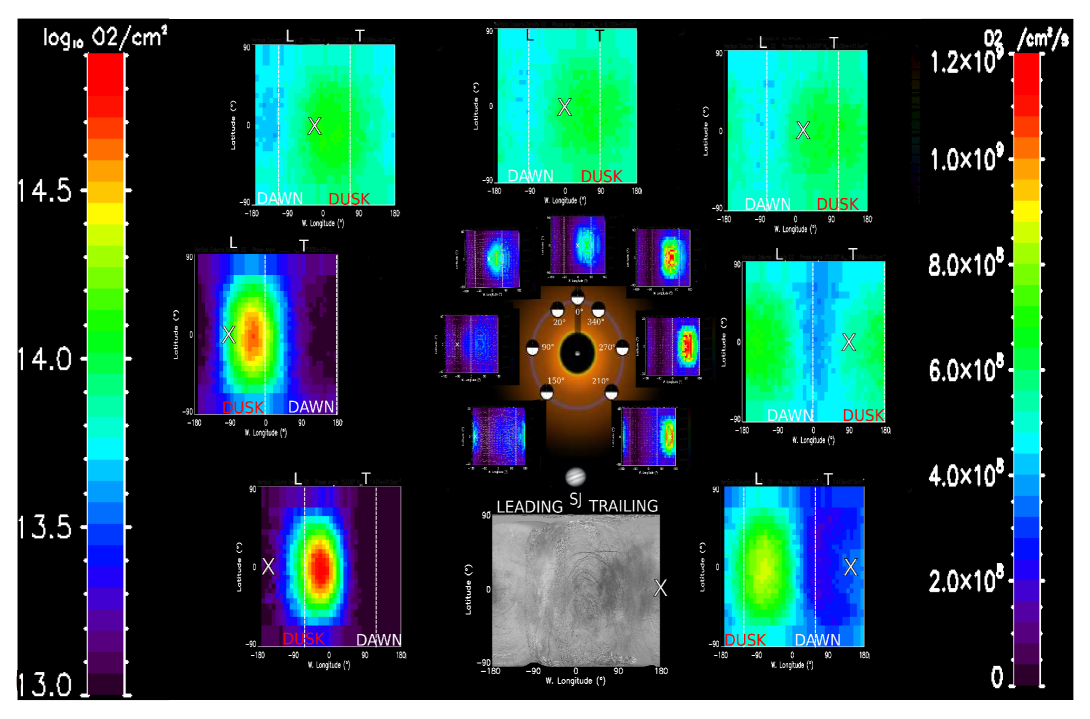
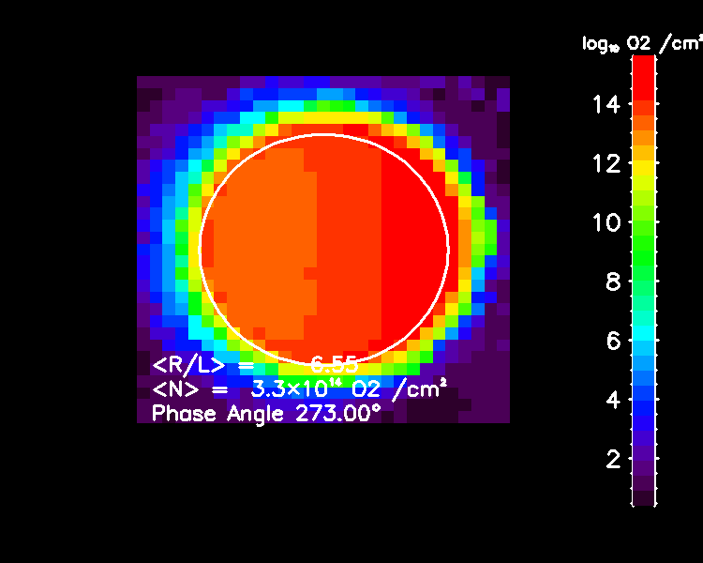
We illustrate this apparent surface-exosphere synergy occurring throughout the orbit by using two sets of simulated 2-D spatial morphology maps in Figure 4. The center image indicates the orbital longitudes of the seven simulated orbital positions. The inner and outer maps represent the orbital synergy between the O2 surface and O2 exosphere varying with rotation. The inner circle, maps the O2 source flux at the surface: radiolytically sputtered ejecta in cm-2 s-1 , and the outer circle maps the O2 exosphere: vertical column density in cm2 . On the outer maps, consistent with the inner maps, we have indicated dusk, dawn, and the subsolar position (X), along with the plasma leading (L) and trailing (T) hemispheres. The outer maps indicate O2 bulges consistently accumulating near the dusk terminator. The inner maps illustrate that the O2 source is also concentrated as bulges, suggesting that the atmospheric morphology is shaped by the surface ejecta.
3.2 Orbital Evolution of Europa’s O2 Europa’s Diurnal Cycle
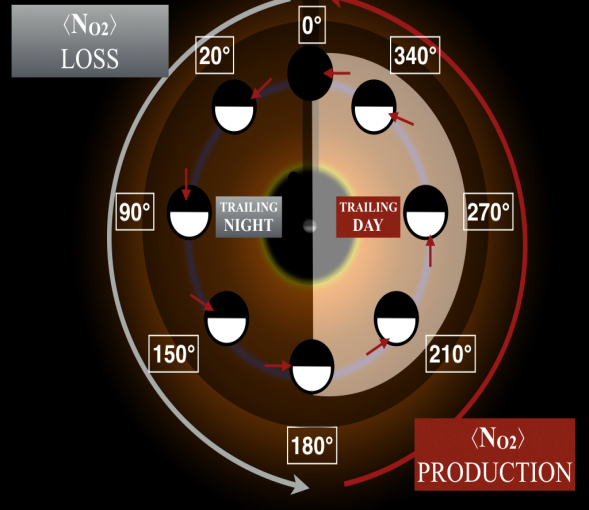
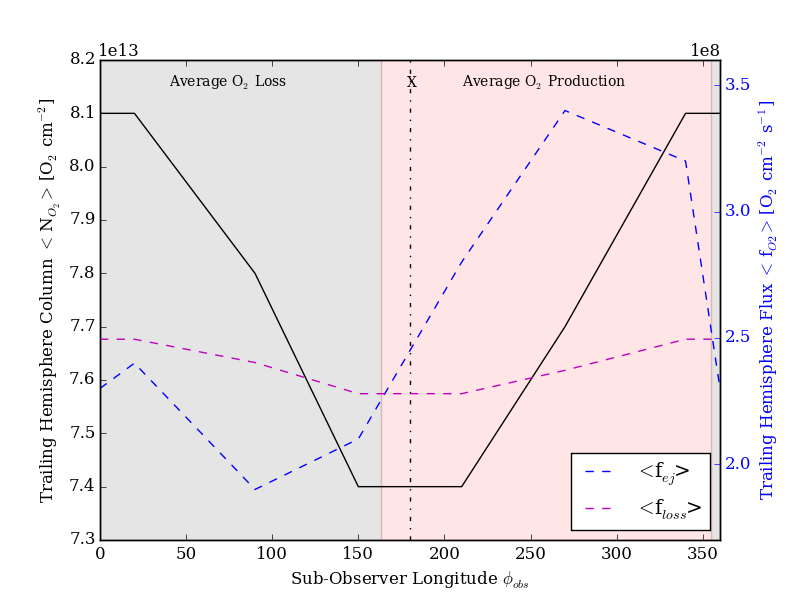
Ultimately, since our modeled trailing hemisphere O2 source exhibits a thermal dependence, the surface-exosphere synergies can be examined qualitatively based on Europa’s day & night phases illustrated in Figure 5 (red vector: trailing hemisphere). Our Monte Carlo simulations in Figure 5 show that the day & night phases for the trailing hemisphere correspond to two different orbital phases: a globally increasing O2 exosphere during the ”Trailing Day”(between 180 and 360∘ longitude, shaded in red) and a globally diminishing O2 exosphere during the ”Trailing Night”(shaded in gray). Altogether, Figures 5 & 5 illustrate Europa’s diurnal O2 cycle, for a thermally-dependent, trailing hemisphere O2 source. Unlike the static, non-rotating case simulated in Section 3.1.1 and previous works, this diurnal cycle is found to peak at dusk due to atmospheric O2 accumulation over time.
Second order effects, such as O2 migration or thermal effects during eclipse, treated in our simulations, may contribute to angular deviations from a 90∘ longitudinal offset derived analytically for a highly thermal-dependent O2 source. In our simulations, the O2 bulges are vastly more apparent post-eclipse, near the sunlit leading hemisphere phases (i.e. 90∘ & 150∘) during which the bulk O2 is being lost as described in figures 5 & 5.
Overall, the 2-D maps of Fig. 4 reveal that the local O2 column densities vary substantially, by more than an order of magnitude 90 %, due to the thermally-dependent O2 source fluxes also responsible for the shape of the atmospheric dusk bulges. These simulated maps provide a first attempt at a detailed picture of how Europa’s rotating O2 exosphere could be evolving throughout its orbit in latitude and longitude, due to the diurnal O2 production likely responsible for the observed dusk-over-dawn oxygen asymmetries.
4 Discussion
Observations of Europa’s O2 exosphere over the decades have been limited, in that the only evidence of gas phase O2 has been based on ratios of the far-ultraviolet atomic oxygen emission lines first observed by the Hubble Space Telescope (HST) as aurorae (Hall et al., 1995; Hall et al., 1998). The ratio of the auroral line intensities is suggestive of e- impact dissociation of O2: . The line-of-sight O2 column density then can be derived based on the electron density [cm-3]and electron-impact dissociation reaction rates [cm3/s] (e.g. Table 2 Turc et al. (2014)) from: . Remarkably, the first set of HST observations confirmed the predicted O2 column density within a factor of two, based on sputtering experiments and atmospheric escape estimates (Brown et al., 1982; Johnson et al., 1982). Based on a re-analysis of Voyager, Galileo, and Cassini data Bagenal et al. (2015) demonstrated that one can expect the O2 to vary by at least a factor of two. Nevertheless, our knowledge on the near-surface plasma conditions influencing the derived column densities is still severely limited—a point recently reviewed in detail by (Plainaki et al., 2018) along with previous models of Europa’s asymmetric O2 exosphere (Cassidy et al. 2007; Plainaki et al. 2013). Indeed, Plainaki et al. 2013 did reproduce asymmetries in the exosphere by modeling the uncertain temperature-dependence of O2, however without rotation the model did not reproduce consistent dusk-over-dawn asymmetries.
Despite the uncertainties Roth et al. (2016) (hereafter R16), equipped with the upgraded Space Telescope Imaging Spectrograph (STIS) with a spatial resolution of 71-95 km, altered the nominal paradigm of a globally-uniform exosphere. The STIS observations were able to distinguish a two-component atmosphere in altitude and oxygen mixing ratios: (1) near-surface O2 exosphere (km; 95 %-99 % O2) and (2) corona ( km; 85 % O2). Previous observations did however provide evidence of asymmetric oxygen emission at various longitudes, (McGrath et al. (2004, 2009)) and (Saur et al., 2011) influenced by various external mechanisms such as the plasma. R16 assessed the influence of Jupiter’s plasma torus on the oxygen aurorae, and found that the polar aurorae are periodically more intense depending on the magnetic tilt. Monitoring Europa’s oxygen aurorae at such high spatial resolutions throughout the orbit additionally discerned a longitudinal, diurnal asymmetry of unknown origin. The dusk hemisphere was observed to be consistently brighter on average than the dawn hemisphere by a factor of two.

In order to better understand the bulk physical processes regulating the dusk-over-dawn asymmetry we compare hemispherically averaged, dusk-over-dawn ratios for HST observations (black circles) with several EGM simulations assuming isotropic plasma conditions for a range of O2 adsorption conditions (squares, triangles, Xs) in Figure 6. The HST data is confined to the near-surface O2 region, and independent of photo-excitation as we uniquely evaluate the forbidden line ratios at 1356 Å. All simulated data in the shaded region, correspond to a dusk-over-dawn asymmetry, whereas points in the unshaded region represent a dawn enhancement. In our simulated O2 case with the least assumptions (no surface interactions; black squares) the dusk hemisphere is brighter than the dawn hemisphere throughout the entire orbit, in the same manner as the HST oxygen observations. Upon varying the initial conditions for our EGM simulations, our results appear to imply that the dusk-over-dawn asymmetry is thermal. That is, the surface temperature regulates the O2 production and the adsorption probability which when varied, strongly influence the diurnal asymmetry. The open squares are identical to the former, nominal case, except that a low temperature-dependence is applied to the O2 yield (qO2’ = in Eqn. 2). The reduced thermal dependence is seen to considerably reduce the dusk-over-dawn asymmetry. Conversely, increasing the O2 thermal dependence was found to increase the dusk-over-dawn asymmetry in the 1-D atmospheric evolution model by Oza et al. (2018). Including the thermal inertia of Europa’s ice on the other hand only increased the asymmetry by . Furthermore, simply turning on the non-inertial forces in our model (i.e. Coriolis, centripetal) without accounting for Europa’s rotation about Jupiter resulted in no dusk-over-dawn asymmetry. The result is shown in Figure 7(b).

Next, we evaluate how the dusk-over-dawn asymmetry varies with a variable heat of adsorption for O2.
4.1 O2 Adsorption on Grains in the Water Ice Regolith
As discussed in Section 3.1.1, O2 on Europa’s surface is thought to undergo a series of unimpeded ballistic hops due to its low sublimation temperature of . Recently, on the far colder Rhea and Dione, evidence of atmospheric evolution due to O2 adsorption was discussed by Teolis and Waite (2016). In this regard, we simulate two additional cases where we alter the surface heat of adsorption for the returning O2: (Xs) and (triangles).
The large heat of adsorption case (X) results in stronger interactions with the regolith (i.e. H2O molecules freezing), and in effect longer residence and migration times, which is seen to significantly reduce the dusk-over-dawn asymmetry. The atmospheric bulges described in section 3 then, will not have time to rotate to dusk as the longer timescales will permit destruction near the production region. Lastly, we consider a case where the heat of adsorption is non-uniform between the leading and trailing hemispheres (triangles). To test this effect globally we model the heat of adsorption with a simple function with latitude () and planetary longitude ( ):
| (8) |
Equation 8 is a simple surface adsorption relation modeled in the EphiO frame where treats as preferential adsorption on the leading hemisphere and as preferential adsorption on the trailing hemisphere. In Fig. 6 the triangles present a simulation where , , and . It can be seen that the non-uniform heats of adsorption also reduce the dusk-over-dawn asymmetry, and additionally mitigate the orbital asymmetries near the leading hemisphere phases. This could imply that the simulated region between possesses stronger O2 interactions with the regolith. Conversely, the trailing hemisphere could also adsorb more efficiently since the column of O2 driven towards leading hemisphere phases is due to the ejection roughly half of a rotation earlier. Thus we are currently unable to deduce whether the O2 adsorbs more efficiently at the leading or trailing surfaces.
The transient O2 adsorption simulated here may describe the trapped O2 observed at 5771 Åas a condensed frost (Spencer and Calvin (2002) ; Spencer & Grundy 2017). That is, the O2 could be trapped in bubbles before it is radiolytically ejected, should the temperature be sufficiently high to allow for vacancies produced by diffusion of the incoming ion (Johnson and Jesser, 1997). Recently, Johnson et al. 2018 (submitted) reviewed the origin and fate of the trapped O2 in ice. It was suggested that the observed O2 was trapped at dangling hydrogen bonds, from where it is thermally released.
5 Conclusion/Summary
Allowing Europa to rotate about Jupiter in our 3-D Monte Carlo simulations of Europa’s water product exosphere, results in a dusk-over-dawn O2 asymmetry at all orbital phases. The hemispherically-averaged asymmetry is roughly consistent with the near-surface dusk-over-dawn oxygen emission recently observed by HST. We suggest that the near-surface, dusk-over-dawn O2 asymmetry is more generally part of Europa’s diurnal cycle of O2, built and destroyed over one orbit. This O2 cycle appears to depend strongly on the (1) O2 production (therefore also the surface temperature), (2) O2 loss, and (3) Europa’s rotation rate, all of which lead to a peak in column density at dusk.
The diurnal cycle described in this work, can be summarized as follows :
-
1.
Trailing Day: The trailing hemisphere source is illuminated and rapidly builds an O2 column rotating with Europa’s surface, ejecting between O2 cm-2 s-1 throughout the day.
-
a)
After half of an orbit, the rotating O2 column has accumulated an atmospheric bulge of average density O2 cm-2 spread across a quarter of a hemisphere from dusk, local time.
-
a)
-
2.
Trailing Night: The trailing hemisphere source enters night, at which point the e--impact dissociation begins to slowly overwhelm the O2 production and acts to isotropically diminish the bulk O2 exosphere.
A similar dusk-over-dawn asymmetry is predicted at all sub-observer longitudes in Ganymede’s near-surface O2 atmosphere Leblanc et al. (2017). We note that these O2 bulges maintained near dusk, hinge on the timescales of tidally-locked atmospheres as described by Oza et al. (2018). The orbital timescale is comparable to the average atmospheric lifetime of the radiolytic O2, so that . In other words, the O2 exosphere survives long enough so that the O2 can accumulate towards dusk during the day, given its simulated thermal dependence. If the O2 exosphere survived for too long, for instance , the continued production would average out any asymmetries as the O2 loss would be negligible over the orbit.
If the O2 exosphere was destroyed too quickly on the other hand, , the diurnal asymmetries would not have time to build an O2 bulge. Overall, the comparable size of the satellite’s rotation rate and the rate at which the near-surface O2 is being lost results in a shift towards dusk. The relative sizes of the rotation rate and the estimated loss rate at Europa and Ganymede, result in a periodic O2 asymmetry, which can be probed in satellite local time.
While we have provided evidence for a dusk-over-dawn asymmetry at Europa, a global understanding of Europa’s exosphere is far from fulfilled. The O2 cycle depends on the O2 production and loss: source rates may require a largely thermal source (e.g. Oza et al. (2018), Johnson et al. 2018), and loss rates may need to include plasma interactions (e.g. Dols et al. (2016); Lucchetti et al. (2016)). A self-consistent exosphere model including the plasma interaction is therefore sorely needed. A stronger understanding of the spatial morphologies of O2 exospheres will be of particular interest for the spacecraft trajectories at the icy Galilean satellites (i.e. NASA’s Europa Clipper; ESA’s JUICE).
Acknowledgments: The authors express their gratitude to Lorenz Roth for insight on better comparing the HST observations and the EGM exosphere simulations, and to Ben Teolis for constructive discussions on O2-water ice interactions. AVO and FL acknowledge the support of LabEx/ ESEP . This work was also supported by CNES ”Systéme Solaire”program. REJ acknowledges support from NASA’s Planetary Data Systems Program. This work is also part of HELIOSARES Project supported by the ANR (ANR-09-BLAN-0223) and ANR MARMITE-CNRS (ANR-13-BS05-0012-02). Authors also acknowledge the support of the computational platform CICLAD hosted by the Institut Pierre Simon Laplace.
Referencias
- Abramov and Spencer (2008) Abramov, O., Spencer, J.R., 2008. Numerical modeling of endogenic thermal anomalies on Europa. Icarus 195, 378–385. doi:10.1016/j.icarus.2007.11.027.
- Bagenal et al. (2015) Bagenal, F., Sidrow, E., Wilson, R.J., Cassidy, T.A., Dols, V., Crary, F.J., Steffl, A.J., Delamere, P.A., Kurth, W.S., Paterson, W.R., 2015. Plasma conditions at Europa’s orbit. Icarus 261, 1–13. doi:10.1016/j.icarus.2015.07.036.
- Brown et al. (1982) Brown, W.L., Lanzerotti, L.J., Johnson, R.E., 1982. Fast Ion Bombardment of Ices and its Astrophysical Implications. Science 218, 525–531. doi:10.1126/science.218.4572.525.
- Carlson et al. (1999) Carlson, R.W., Johnson, R.E., Anderson, M.S., 1999. Sulfuric acid on Europa and the radiolytic sulfur cycle. Science 286, 97–99. doi:10.1126/science.286.5437.97.
- Cassidy (2016) Cassidy, T.A., 2016. Widespread confusion in the modeling of Europa’s magnetospheric interaction: what the potential modeler should consider before getting started. AGU Fall Meeting Abstracts , SM34A–05.
- Cassidy et al. (2007) Cassidy, T.A., Johnson, R.E., McGrath, M.A., Wong, M.C., Cooper, J.F., 2007. The spatial morphology of Europa’s near-surface O 2 atmosphere. Icarus 191, 755–764. doi:10.1016/j.icarus.2007.04.033.
- Cassidy et al. (2013) Cassidy, T.A., Paranicas, C.P., Shirley, J.H., Dalton, III, J.B., Teolis, B.D., Johnson, R.E., Kamp, L., Hendrix, A.R., 2013. Magnetospheric ion sputtering and water ice grain size at Europa. Planetary and Space Science 77, 64–73. doi:10.1016/j.pss.2012.07.008.
- Doggett et al. (2009) Doggett, T., Greeley, R., Figueredo, P., Tanaka, K., 2009. Geologic Stratigraphy and Evolution of Europa’s Surface.
- Dols et al. (2016) Dols, V.J., Bagenal, F., Cassidy, T.A., Crary, F.J., Delamere, P.A., 2016. Europa’s atmospheric neutral escape: Importance of symmetrical O2 charge exchange. Icarus 264, 387–397. doi:10.1016/j.icarus.2015.09.026.
- Fama et al. (2008) Fama, M., Shi, J., Baragiola, R., 2008. Sputtering of ice by low-energy ions. Surface Science 602, 156 – 161. URL: http://www.sciencedirect.com/science/article/pii/S0039602807009879, doi:http://dx.doi.org/10.1016/j.susc.2007.10.002.
- Greenberg (2010) Greenberg, R., 2010. Transport Rates of Radiolytic Substances into Europa’s Ocean: Implications for the Potential Origin and Maintenance of Life. Astrobiology 10, 275–283. doi:10.1089/ast.2009.0386.
- Hall et al. (1998) Hall, D.T., Feldman, P.D., McGrath, M.A., Strobel, D.F., 1998. The Far-Ultraviolet Oxygen Airglow of Europa and Ganymede. Astrophysical Journal 499, 475–481. doi:10.1086/305604.
- Hall et al. (1995) Hall, D.T., Strobel, D.F., Feldman, P.D., McGrath, M.A., Weaver, H.A., 1995. Detection of an oxygen atmosphere on Jupiter’s moon Europa. Nature 373, 677–679. doi:10.1038/373677a0.
- Hand et al. (2007) Hand, K.P., Carlson, R.W., Chyba, C.F., 2007. Energy, Chemical Disequilibrium, and Geological Constraints on Europa. Astrobiology 7, 1006–1022. doi:10.1089/ast.2007.0156.
- Hunten et al. (1988) Hunten, D.M., Shemansky, D.E., Morgan, T.H., 1988. The Mercury atmosphere, in: Vilas, F., Chapman, C.R., Matthews, M.S. (Eds.), Mercury, University of Arizona Press, pp. 562–612.
- Johnson (1990) Johnson, R.E., 1990. Energetic Charged-Particle Interactions with Atmospheres and Surfaces.
- Johnson et al. (2013) Johnson, R.E., Carlson, R.W., Cassidy, T.A., Fama, M., 2013. Sputtering of Ices, in: Gudipati, M.S., Castillo-Rogez, J. (Eds.), Astrophysics and Space Science Library, p. 551. doi:10.1007/978-1-4614-3076-6_17.
- Johnson et al. (2008) Johnson, R.E., Famá, M., Liu, M., Baragiola, R.A., Sittler, E.C., Smith, H.T., 2008. Sputtering of ice grains and icy satellites in Saturn’s inner magnetosphere. Planetary and Space Science 56, 1238–1243. doi:10.1016/j.pss.2008.04.003.
- Johnson and Jesser (1997) Johnson, R.E., Jesser, W.A., 1997. O2/O3 Microatmospheres in the Surface of Ganymede. Astrophysical Journal Letters 480, L79–L82. doi:10.1086/310614.
- Johnson et al. (1982) Johnson, R.E., Lanzerotti, L.J., Brown, W.L., 1982. Planetary applications of ion induced erosion of condensed-gas frosts. Nuclear Instruments and Methods 198, 147–157. doi:10.1016/0167-5087(82)90066-7.
- Johnson et al. (2003) Johnson, R.E., Quickenden, T.I., Cooper, P.D., McKinley, A.J., Freeman, C.G., 2003. The Production of Oxidants in Europa’s Surface. Astrobiology 3, 823–850. doi:10.1089/153110703322736123.
- Leblanc and Chaufray (2011) Leblanc, F., Chaufray, J.Y., 2011. Mercury and Moon He exospheres: Analysis and modeling. Icarus 216, 551–559. doi:10.1016/j.icarus.2011.09.028.
- Leblanc et al. (2002) Leblanc, F., Johnson, R.E., Brown, M.E., 2002. Europa’s Sodium Atmosphere: An Ocean Source? Icarus 159, 132–144. doi:10.1006/icar.2002.6934.
- Leblanc et al. (2017) Leblanc, F., Oza, A.V., Leclercq, L., Schmidt, C., Cassidy, T., Modolo, R., Chaufray, J.Y., Johnson, R.E., 2017. On the orbital variability of Ganymede’s atmosphere. Icarus 293, 185–198. doi:10.1016/j.icarus.2017.04.025.
- Leclercq (2015) Leclercq, L., 2015. From exosphere to magnetosphere of planetary objects : optimization of parallelized modelisations for an application to Ganymede. Theses. Université Paris-Saclay. URL: https://hal-insu.archives-ouvertes.fr/tel-01256191.
- Lucchetti et al. (2016) Lucchetti, A., Plainaki, C., Cremonese, G., Milillo, A., Cassidy, T., Jia, X., Shematovich, V., 2016. Loss rates of Europa’s tenuous atmosphere. Planetary and Space Science 130, 14–23. doi:10.1016/j.pss.2016.01.009.
- McGrath et al. (2009) McGrath, M.A., Hansen, C.J., Hendrix, A.R., 2009. Observations of Europa’s Tenuous Atmosphere, in: Pappalardo, R.T., McKinnon, W.B., Khurana, K.K. (Eds.), Europa, Edited by Robert T. Pappalardo, William B. McKinnon, Krishan K. Khurana ; with the assistance of René Dotson with 85 collaborating authors. University of Arizona Press, Tucson, 2009. The University of Arizona space science series ISBN: 9780816528448, p.485, p. 485.
- McGrath et al. (2004) McGrath, M.A., Lellouch, E., Strobel, D.F., Feldman, P.D., Johnson, R.E., 2004. Satellite atmospheres, in: Bagenal, F., Dowling, T.E., McKinnon, W.B. (Eds.), Jupiter. The Planet, Satellites and Magnetosphere, pp. 457–483.
- Oza et al. (2018) Oza, A.V., Johnson, R.E., Leblanc, F., 2018. Dusk/dawn atmospheric asymmetries on tidally-locked satellites: O2 at Europa. Icarus 305, 50–55. doi:10.1016/j.icarus.2017.12.032.
- Peale et al. (1979) Peale, S.J., Cassen, P., Reynolds, R.T., 1979. Melting of Io by tidal dissipation. Science 203, 892–894. doi:10.1126/science.203.4383.892.
- Plainaki et al. (2018) Plainaki, C., Cassidy, T.A., Shematovich, V.I., Milillo, A., Wurz, P., Vorburger, A., Roth, L., Galli, A., Rubin, M., Blöcker, A., Brandt, P.C., Crary, F., Dandouras, I., Jia, X., Grassi, D., Hartogh, P., Lucchetti, A., McGrath, M., Mangano, V., Mura, A., Orsini, S., Paranicas, C., Radioti, A., Retherford, K.D., Saur, J., Teolis, B., 2018. Towards a Global Unified Model of Europa’s Tenuous Atmosphere. Space Science Reviews 214, 40. doi:10.1007/s11214-018-0469-6.
- Plainaki et al. (2013) Plainaki, C., Milillo, A., Mura, A., Saur, J., Orsini, S., Massetti, S., 2013. Exospheric O2 densities at Europa during different orbital phases. Planetary and Space Science 88, 42–52. doi:10.1016/j.pss.2013.08.011.
- Rathbun et al. (2010) Rathbun, J.A., Rodriguez, N.J., Spencer, J.R., 2010. Galileo PPR observations of Europa: Hotspot detection limits and surface thermal properties. Icarus 210, 763–769. doi:10.1016/j.icarus.2010.07.017.
- Rathbun et al. (2014) Rathbun, J.A., Spencer, J.R., Howett, C.J.A., 2014. Galileo PPR Observations of Europa: Correlations of Thermophysical Properties with Exogenic and Endogenic Processes, in: Workshop on the Habitability of Icy Worlds, p. 4045.
- Roth et al. (2014a) Roth, L., Retherford, K.D., Saur, J., Strobel, D.F., Feldman, P.D., McGrath, M.A., Nimmo, F., 2014a. Orbital apocenter is not a sufficient condition for HST/STIS detection of Europa’s water vapor aurora. Proceedings of the National Academy of Science 111, E5123–E5132. doi:10.1073/pnas.1416671111.
- Roth et al. (2016) Roth, L., Saur, J., Retherford, K.D., Strobel, D.F., Feldman, P., McGrath, M., Spencer, J.R., Blocker, A., Ivchenko, N., 2016. Europa’s far ultraviolet oxygen aurora from a comprehensive set of HST observations. Journal of Geophysical Research 261, 1–13. doi:10.1016/j.icarus.2015.07.036.
- Roth et al. (2014b) Roth, L., Saur, J., Retherford, K.D., Strobel, D.F., Feldman, P.D., McGrath, M.A., Nimmo, F., 2014b. Transient Water Vapor at Europa’s South Pole. Science 343, 171–174. doi:10.1126/science.1247051.
- Saur et al. (2011) Saur, J., Feldman, P.D., Roth, L., Nimmo, F., Strobel, D.F., Retherford, K.D., McGrath, M.A., Schilling, N., Gérard, J.C., Grodent, D., 2011. Hubble Space Telescope/Advanced Camera for Surveys Observations of Europa’s Atmospheric Ultraviolet Emission at Eastern Elongation. Astrophysical Journal 738, 153. doi:10.1088/0004-637X/738/2/153.
- Sparks et al. (2016) Sparks, W.B., Hand, K.P., McGrath, M.A., Bergeron, E., Cracraft, M., Deustua, S.E., 2016. Probing for Evidence of Plumes on Europa with HST/STIS. Astrophysical Journal 829, 121. doi:10.3847/0004-637X/829/2/121, arXiv:1609.08215.
- Sparks et al. (2017) Sparks, W.B., Schmidt, B.E., McGrath, M.A., Hand, K.P., Spencer, J.R., Cracraft, M., E Deustua, S., 2017. Active Cryovolcanism on Europa? Astrophysical Journal Letters 839, L18. doi:10.3847/2041-8213/aa67f8, arXiv:1704.04283.
- Spencer and Calvin (2002) Spencer, J.R., Calvin, W.M., 2002. Condensed O2 on Europa and Callisto. Astronomical Journal 124, 3400--3403. doi:10.1086/344307.
- Spencer et al. (1989) Spencer, J.R., Lebofsky, L.A., Sykes, M.V., 1989. Systematic biases in radiometric diameter determinations. Icarus 78, 337--354. doi:10.1016/0019-1035(89)90182-6.
- Spencer et al. (1999) Spencer, J.R., Tamppari, L.K., Martin, T.Z., Travis, L.D., 1999. Nighttime Thermal Anomalies on Europa, in: Lunar and Planetary Science Conference.
- Teolis et al. (2010) Teolis, B.D., Jones, G.H., Miles, P.F., Tokar, R.L., Magee, B.A., Waite, J.H., Roussos, E., Young, D.T., Crary, F.J., Coates, A.J., Johnson, R.E., Tseng, W.L., Baragiola, R.A., 2010. Cassini Finds an Oxygen-Carbon Dioxide Atmosphere at Saturn’s Icy Moon Rhea. Science 330, 1813. doi:10.1126/science.1198366.
- Teolis et al. (2017) Teolis, B.D., Plainaki, C., Cassidy, T.A., Raut, U., 2017. Water Ice Radiolytic O2, H2, and H2O2 Yields for Any Projectile Species, Energy, or Temperature: A Model for Icy Astrophysical Bodies. Journal of Geophysical Research (Planets) 122, 1996--2012. doi:10.1002/2017JE005285.
- Teolis and Waite (2016) Teolis, B.D., Waite, J.H., 2016. Dione and Rhea seasonal exospheres revealed by Cassini CAPS and INMS. Icarus 272, 277--289. doi:10.1016/j.icarus.2016.02.031.
- Turc et al. (2014) Turc, L., Leclercq, L., Leblanc, F., Modolo, R., Chaufray, J.Y., 2014. Modelling Ganymede’s neutral environment: A 3D test-particle simulation. Icarus 229, 157--169. doi:10.1016/j.icarus.2013.11.005.
- Vance and Goodman (2009) Vance, S., Goodman, J., 2009. Oceanography of an Ice-Covered Moon, in: Pappalardo, R.T., McKinnon, W.B., Khurana, K.K. (Eds.), Europa, Edited by Robert T. Pappalardo, William B. McKinnon, Krishan K. Khurana ; with the assistance of René Dotson with 85 collaborating authors. University of Arizona Press, Tucson, 2009. The University of Arizona space science series ISBN: 9780816528448, p.459, p. 459.
- Vance et al. (2016) Vance, S.D., Hand, K.P., Pappalardo, R.T., 2016. Geophysical controls of chemical disequilibria in Europa. Geophysical Research Letters 43, 4871--4879. doi:10.1002/2016GL068547.
- Young (2017) Young, L.A., 2017. Volatile transport on inhomogeneous surfaces: II. Numerical calculations (VT3D). Icarus 284, 443--476. doi:10.1016/j.icarus.2016.07.021.