Effect of uniaxial stress on the magnetic phases of CeAuSb2
Abstract
We present results of measurements of resistivity of CeAuSb2 under the combination of -axis magnetic field and in-plane uniaxial stress. In unstressed CeAuSb2 there are two magnetic phases. The low-field A phase is a single-component spin-density wave (SDW), with , and the high-field B phase consists of microscopically coexisting and spin-density waves. Pressure along a lattice direction is a transverse field to both of these phases, and so initially has little effect, however eventually induces new low- and high-field phases in which the principal axes of the SDW components appear to have rotated to the directions. Under this strong compression, the field evolution of the resistivity is much smoother than at zero strain: In zero strain, there is a strong first-order transition, while under strong it becomes much broader. We hypothesize that this is a consequence of the uniaxial stress lifting the degeneracy between the (100) and (010) directions.
I Introduction
The magnetic order of CeAuSb2 offers a compelling example of how electronic order can cause a reduction in the point-group symmetry of the host lattice. CeAuSb2 is a layered, tetragonal compound in which a large-amplitude, incommensurate spin-density wave condenses at K (in zero applied field) Marcus18 . It is a heavy-fermion system, with a Kondo temperature of 14 K Seo12 . The magnetic order shows entropy balance with a Fermi liquid, showing that at the Ce spins are in fact incorporated into the Fermi sea through the Kondo effect Zhao16 . For -axis fields below 3 T, the in-plane wavevector of the spin-density wave (SDW) is, in reciprocal lattice units, either or , with Marcus18 , and in selecting locally which of these two possibilities condenses, the point-group symmetry of the system is locally reduced from tetragonal to orthorhombic.
However CeAuSb2 is highly polarizable under a -axis magnetic field Balicas05 ; Thamizhavel03 , and as field is applied the modulation amplitude of the SDW decreases. At 3 T there is a first-order transition, above which the two components coexist microscopically. If their amplitudes are equal tetragonal symmetry is restored. The modulation persists up to 6 T, beyond which, at another first-order transition, the system becomes uniformly polarized Balicas05 ; Lorenzer13 .
The association of weaker order with microscopic coexistence extends to other systems. The correlated-electron material Sr3Ru2O7 has a magnetically ordered phase with low-amplitude SDWs oriented along the and directions, which coexist microscopically Lester15 ; Brodsky17 . In at least some iron-based superconductors, single-component -symmetric magnetic order at low dopings gives way, as the order is suppressed through doping towards its quantum critical point, to two-component -symmetric order Avci14 ; Boehmer15 . In the rare-earth tritelluride compounds, which are weakly orthorhombic, charge density waves with perpendicular wavevectors can coexist microscopically, however only when the amplitude of the dominant component is suppressed through chemical pressure Ru08 ; Moore10 . An advantage of studying CeAuSb2 is that the strength of the density wave order, and, apparently, the strength of competition between the two possible density wave components, can be tuned externally with magnetic field.
The transition at 3 T in CeAuSb2 is a single- to multi-component transition, and probably also an orthorhombic to tetragonal transition. The above-listed systems may have similar transitions, driven by a tuning parameter such as doping or magnetic field. We hypothesize that the single- to multi-component transition in CeAuSb2 is first order because there is no natural pathway to tune between the two phases, and further that an externally-applied symmetry-breaking field such as in-plane uniaxial stress could provide such a pathway and change the transition into a continuous (i.e. second-order) transition. Under tetragonal lattice symmetry the two components are degenerate, and the two natural possibilities for well below are that strong competition allows only one component to condense, yielding spontaneous symmetry breaking, or that weaker competition allows them to coexist microscopically with equal amplitude. A transition between these states would be strongly discontinuous. However in-plane uniaxial stress would lift the degeneracy and may allow one component to dominate on both sides of a single- to multi-component transition, and the amplitude of the other to grow continuously from zero.
Here, we test this hypothesis in two stages. First, we test whether the high-field phase (between 3 and 6 T) is in fact tetragonal. In principle, it is possible to have states with, in the absence of any symmetry-breaking field, and both and [where and are respectively the amplitudes of the and density waves]. However this would require a more delicate tuning of interactions— more precisely, terms beyond fourth order in a two-component Ginzburg-Landau theory. We test for such symmetry breaking by ramping the applied uniaxial stress through zero (that is, between compressive and tensile). If there is spontaneous symmetry breaking, there should be a first-order transition at zero stress, where the favored direction of the symmetry breaking flips. In our earlier study of CeAuSb2 under uniaxial stress and at zero field Park18 , such a transition was observed, corresponding to the transition between and . However, here, to high sensitivity no such transition is observed for the high-field phase, indicating that it is most likely tetragonal (i.e. ).
Second, we apply strong uniaxial compression and observe the evolution of the field-temperature phase diagram. We focus mostly on stress along directions (that is, Ce-Ce bond directions). Although the density wave components in unstressed CeAuSb2 are oriented along directions and stress is a transverse field to this order, stress along directions has a much smaller quantitative effect than stress Park18 . Here, at the strongest applied compression the transition at 3 T broadens only slightly, and it is difficult to be confident that this observed change is intrinsic. In the previous study it was found that compression by 0.5% almost certainly rotates the principal axes of the low-field magnetic order from to . Therefore, we work primarily with stress, and compressions of % and higher.
II Summary of previous results
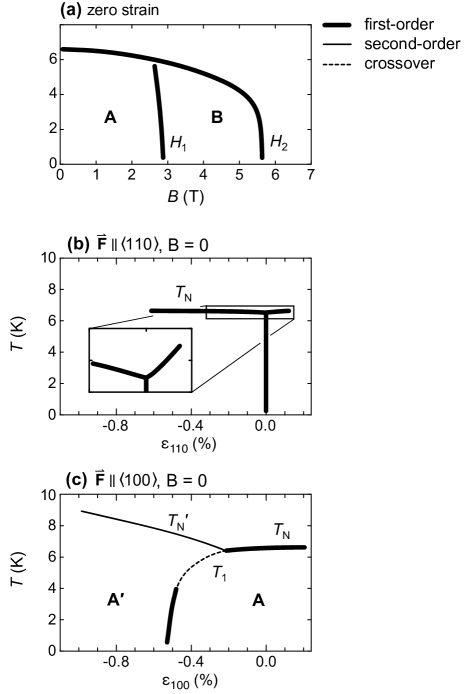
We begin by providing more detail, in Fig. 1, on previous results. The field-temperature phase diagram of unstressed CeAuSb2 is shown in panel (a) Zhao16 ; Balicas05 . The metamagnetic transitions occur at T and T. We label the low- and high-field phases the A and B phases.
The magnetic order of CeAuSb2 has been shown to be sensitive to hydrostatic pressure, with a modest pressure of 2 GPa inducing a new magnetic phase Seo12 . It is similarly sensitive to uniaxial stress applied along a , but not a , direction. In panel (b) we show the stress-temperature phase diagram at zero field for stress applied along a direction, inducing a longitudinal strain Park18 . (The sample is under conditions of uniaxial stress, so there will also be transverse strains of the opposite sign, following the sample’s own Poisson’s ratios) The line of first-order transitions along shows that the magnetic order spontaneously lifts the / symmetry of the lattice. However, despite this notable qualitative effect, the quantitative effect of stress on is small.
In panel (c) we show the stress-temperature phase diagram for stress. When CeAuSb2 is compressed by more than 0.25% along a direction, the transition at splits into two transitions, at temperatures and . The transition at is second order. at a compression of about 0.5%, and we label the new high-strain phase A′. strain is a transverse field with respect to the A phase, which has principal axes, so it is not surprising that varies only weakly with . The much stronger, linear dependence of on is strong evidence that strain is a longitudinal field with respect to the A′ phase, in other words that the principal axes have rotated to the directions. This would occur if, for example, the in-plane SDW wavevector rotated from to or .
The transition between the A and A′ phases is first order below 4 K, and in resistivity data appears to be a crossover above. However if different symmetries are broken in the A and A′ phases there must be a true transition line between them.
III Methods
CeAuSb2 crystals were grown according to the methods described elsewhere growth1 ; growth2 . They were oriented to a precision of 3∘ by Laue diffraction, then beams were cut from the crystals with the long axis along a 100 or 110 direction. The crystals naturally grow in a plate-like geometry, however they were further polished in order to obtain a uniform sample thickness. The samples were then mounted into a home-built uniaxial pressure apparatus Hicks14 (using Stycast 2850FT epoxy), in which force is applied along their long axis. The pressure apparatus is driven by piezoelectric actuators. It incorporates a displacement sensor placed in parallel with the sample. As in previous reports Brodsky17 ; Park18 , we estimate that 80 of the applied displacement is transferred to the central, exposed portion of the sample, with the rest going into deformation of the ends of the sample and the epoxy. In other words, the strains reported here are the applied displacement divided by the exposed length of the sample, multiplied by 0.8, and we estimate a 20% sample-to-sample error on this strain determination.
We measured a total of six samples, two cut along a 110 direction and four along a 100 direction. The first five samples were also studied in Ref. Park18 , and have the same numbering here.
For the 110 samples, zero strain was taken as the location of the first-order transition: This transition is expected to occur at zero strain, there is no other feature that could mark the neutral strain point, and, finally, taking it to mark zero implies a room temperature to 0 K thermal contraction for CeAuSb2 of 0.25, which is a typical value for a metal. For the 100 samples, there is no feature in the response at the neutral strain point, so we took zero strain to be at the same applied displacement as for the samples.
The resistivity of CeAuSb2 changes strongly at the Néel transition and also across the metamagnetic transitions. In principle, when measuring resistivity under uniaxial stress the results should be corrected for a geometric contribution, which is the change in resistance that would still be observed if the sample resistivity were held constant, due to the applied change in sample dimensions. However, the resistivity of CeAuSb2 varies strongly with strain and we neglect this correction.
IV Results: testing the symmetry of the high-field phase
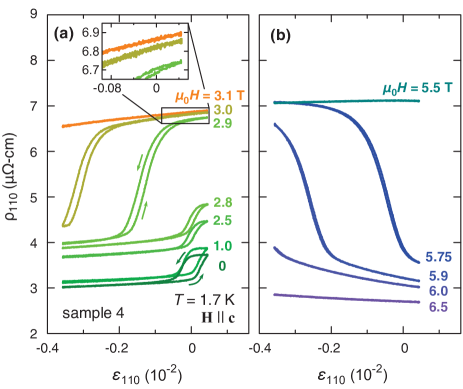
Fig. 2 shows the results of ramping the stress applied along a direction, at various fixed fields and K. Below (the transition field between the A and B phases), the resistivity shows a step-like response across = 0. There is clear hysteresis between the increasing- and decreasing-strain ramps. This is the first-order transition between and spin-density wave order, and the presence of this transition proves that the A phase is -symmetric. The hysteresis shrinks as the field is increased, implying a decreasing energy barrier for flipping domains.
At fields around and , there are first-order transitions at , which correspond respectively to strain-driven transitions between the A and B phases, and between the B phase and high-field paramagnetic phase. However, as shown in the inset of Fig. 2(a), to high precision there is no first-order transition across within the B phase. We conclude that it most likely preserves symmetry between the and directions.
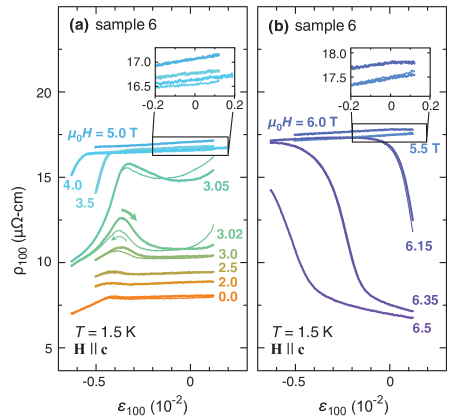
Equivalent data for stress ramps along a direction are shown in Fig. 3, with the temperature held constant at 1.5 K. For fields below 3 T, the transition between the A and A′ phases is visible as a sharp change in slope of , at %. The hysteresis that shows that this transition is first order is not visible in the figure, however it was resolved in Ref. Park18 . There also appears to be a similar transition for T, where, again, is nearly strain independent for % but depends much more sensitively on for %. We will discuss this further below. Finally, for fields right in the vicinity of , the resistivity is strongly hysteretic.
For our present purpose, the important feature in Fig. 3 is that there is no apparent transition at , either in the low-field or high-field phase. Our sensitivity to changes in was 10-4. We conclude that the magnetic order in both phases most likely preserves the symmetry between the and directions. Because the data in Fig. 2 indicate that the B phase also preserves / symmetry, we conclude that it is probably symmetric, i.e. tetragonal.
In Ref. Marcus18 , it was proposed that the B phase may possess a subtle symmetry-breaking between the and lattice directions. The neutron data are consistent both with a multi-component checkerboard order, which preserves / symmetry, and a “woven” order, which like the checkerboard order is a multi-component density wave, but in which the local pattern of magnetization lifts / symmetry. It was speculated that the woven order might be favored because it allows each component to have a larger amplitude while keeping the local maximum and minimum magnetizations within a narrower range. In principle, because the symmetry breaking in the proposed woven order is subtle, its effect on resistivity could yet be below our resolution. However we conclude that it is more likely that the phase is in fact the tetragonal, checkerboard order.
V Results: large strains
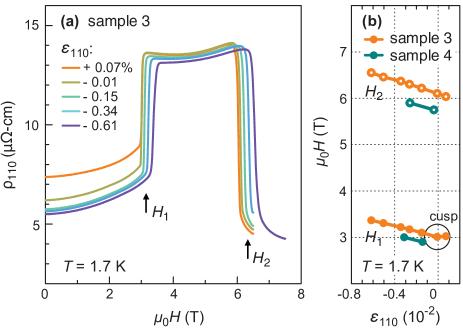
We start, in Fig. 4, with the results from large strain, which essentially confirm the finding of Ref. Park18 that the quantitative coupling of orthorhombicity to the magnetic order is weak. The figure shows results of measurement of at various fixed strains , and K. The form of , a first-order increase at and first-order decrease at , is familiar from previous studies Zhao16 ; Balicas05 ; Lorenzer13 . Field sweeps reported in previous studies confirmed that these are first-order transitions, with hysteresis. Both transitions move to modestly higher fields with compression. The transition at broadens slightly as the sample is compressed, and arguably, looking at the highest compression, slightly more than the transition at . This broadening could be an early sign of the hypothesized stress-driven evolution from a first-order to a continuous transition. However it could also be an extrinsic effect of stress gradients in the sample, due to minor bending of the sample as stress is applied.
As highlighted in Fig. 4(b), shows a cusp at zero strain, consistent with the above-described observations that the A phase lifts the (110)/(10) symmetry of the lattice. No such cusp is apparent in , consistent with our finding above that the high-field phase is probably -symmetric.
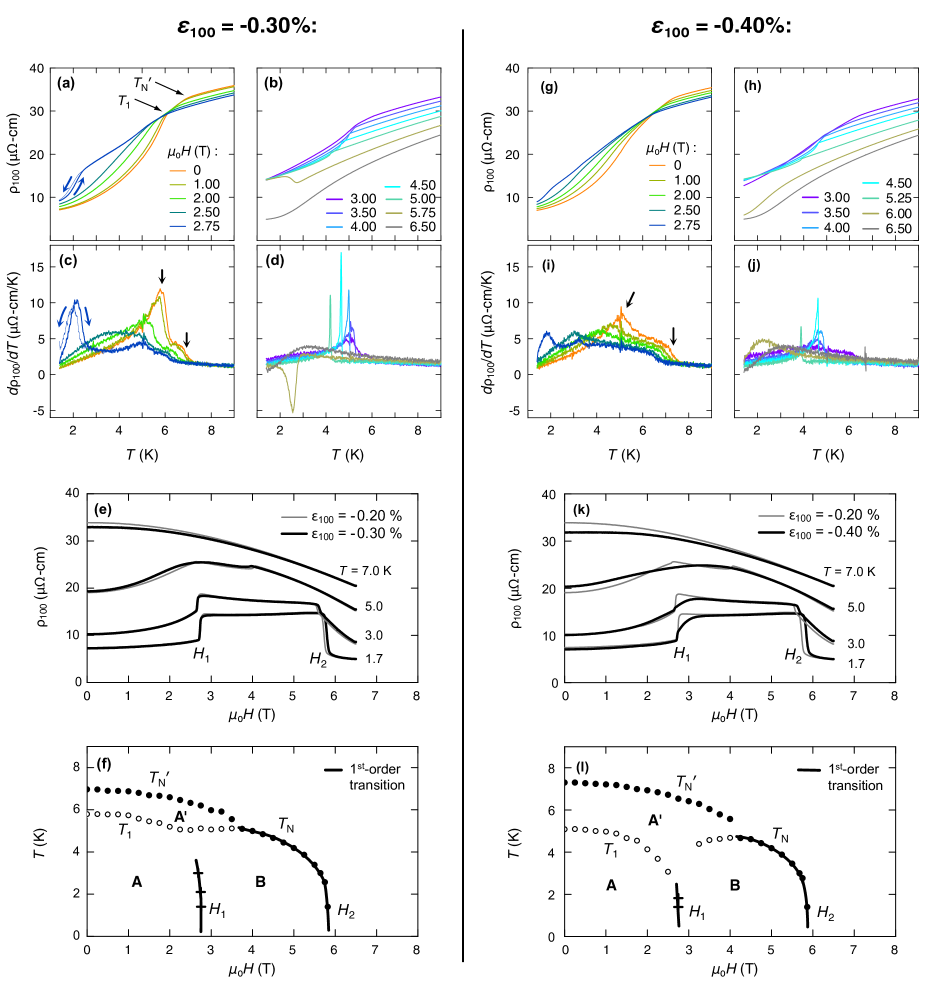
We move on to large stress, for which the response is considerably richer. To understand the evolution of the field-temperature phase diagram, we start in Fig. 5 with relatively low strains, and %, where there are observable changes in the phase diagram, but where the connections with the zero-strain phase diagram also remain clear. Results for % are shown in panels (a)-(f), and show that at this strain the field-temperature phase diagram is only minimally altered from that at zero strain. As was reported in Ref. Park18 , this is a large enough strain to split the Néel transition (into the transitions at temperatures and ). This splitting is observable as two breaks in slope in the curves shown in panel (a), and can also be seen as two step-like features in the derivative , shown in panel (c). The splitting persists, essentially unchanged, for all fields .
At 2.75 T, right in the vicinity of , a very prominent first-order transition appears at 2 K. This is the transition between the A and B phases, visible in a temperature ramp because the transition line is not perfectly vertical in field-temperature space.
Separate transitions at and remain visible at . As is further increased [see panels (b) and (d), which show the data for ], the splitting decreases and the transitions merge at T. At higher fields the transition into the B phase occurs, as at zero strain, through a single, first-order transition. The first-order nature of the transition is apparent in the very sharp peaks in , in panel (d).
To identify any changes in and , field ramps were performed at constant temperature, with the results shown in panel (e). They are shown together with data from field ramps at %, which match the zero-strain data very well Zhao16 . The increase in strain from -0.2 to -0.3% induces very little change; the only substantial qualitative change is that at K there is no longer an identifiable transition at .
Putting all this data together, we obtain a field-temperature phase diagram for %, shown in panel (f). It is qualitatively similar to the field-temperature phase diagram of the unstressed sample, except in a narrow band along the line where the A′ phase has appeared.
In panels (g)-(l) we show the equivalent data for a higher strain, %. The data are qualitatively similar to those at %, though they show stronger effects from the applied lattice orthorhombicity. Most obviously, the A′ phase now occupies a larger region of the phase diagram. Another prominent change is that the first-order transition between the A and B phases has become considerably weaker. In panel (e), where %, the first-order step in constitutes almost the entire transition, while in panel (k), where %, the first-order step is only a small feature in a transition that overall has become broad and rounded.
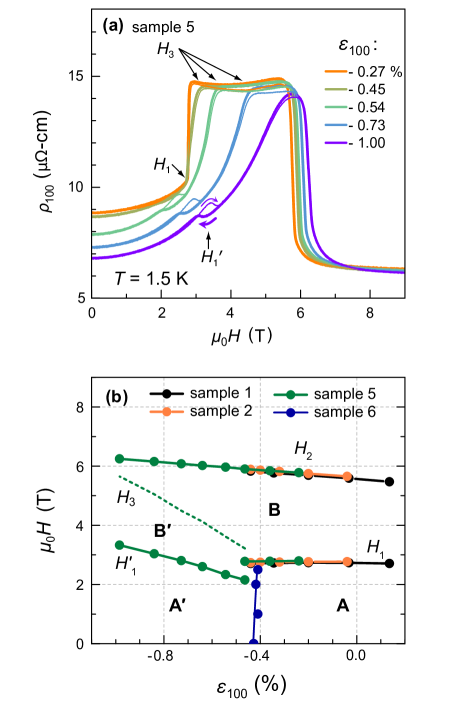
Fig. 6 presents data at stronger compressions. is shown for various fixed strains in panel (a). As the A phase is fully suppressed and replaced even at by the A′ phase, the transition at disappears completely. A new first-order transition appears, at a field that we label . The similarity of and indicate that the physical process driving these transitions is likely to be similar; we hypothesize that both are single- to multi-component transitions. However the form of the transition at is different from that at : the hysteresis is much wider, and the change in across the transition is much smaller. It is also apparent in Fig. 6(a) that whereas is nearly independent of , varies rapidly with . The strain dependence of and can also be seen in the strain-temperature phase diagram for K, shown in panel (b). It is a similar situation to and , where the former is nearly invariant with while the latter has a strong linear dependence, and constitutes further evidence that the principal axes have rotated to the directions in the A′ phase.
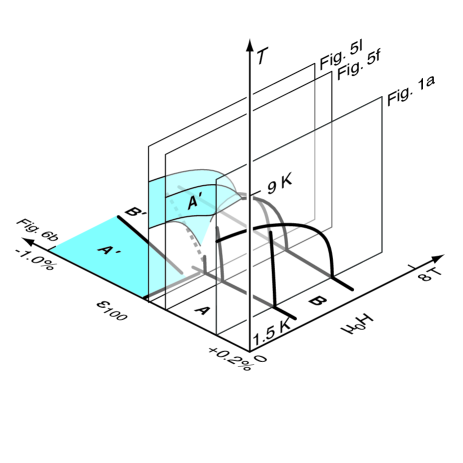
Two further features apparent in Fig. 6(a) should be noted. One is that the resistivity varies much more strongly with in the A′ than the A phase: for changes very little with for %, but varies much more rapidly at larger compressions. Another is that a set of transition fields that we label has appeared in the high-field phase. Below , varies strongly with both field and , while above it is nearly strain- and field-independent. In the phase diagram of Fig. 6(b), we identify as a transition line into a high-strain, high-field phase that we label B′. This transition is also visible in the data shown in Fig. 3(a). As a summary of our data, we present in Fig. 7 a three-dimensional field-strain-temperature phase diagram.
VI Discussion
We have presented evidence that the B phase, in contrast to the A phase, does not lift the symmetry of the lattice of CeAuSb2. We have also shown that the field-temperature phase diagram of CeAuSb2 has a rich dependence on applied orthorhombicity. At a minimum, we have identified the strains and fields where transitions in the magnetic order occur. Definitive identification of how the magnetic order changes under strain will require further measurements, for example neutron scattering on uniaxially stressed CeAuSb2. We proceed in our discussion with inferences that might be drawn based on the resistivity alone.
The - phase diagram of Fig. 6(b) is essentially a 22 grid, where the small- phases are A and B, and the large- phases are A′ and B′. Neutron scattering data Marcus18 have shown that the A and B phases are respectively single- and multi-component orders. From the quantitative similarity of and , the transition field between the A′ and B′ phases, we hypothesize that the A′ and B′ phases are also, respectively, single- and multi-component orders.
Both the A′ and B′ phases are marked by a much stronger sensitivity to applied lattice orthorhombicity than the A and B phases. The resistivity varies much more strongly with in both the A′ and B′ phases than in the A and B phases, and the transition fields that bound the A′ and B′ phases, and , vary more rapidly with than those bounding the A and B phases, and . We therefore conclude that orthorhombicity is a longitudinal field for both the A′ and B′ phases, where it is a transverse field for the A and B phases; in other words the density wave components comprising both the A′ and B′ phases have principal axes. The 22 grid therefore appears to comprise the possible combinations of single- and multi-component order, and and principal axes.
It is interesting that the B phase is, apparently, so insensitive to . In the neutron study Marcus18 , strong scattering peaks were observed at wavevectors and , which were interpreted as results of nonlinear mixing of the components. If we interpret the -independence of within the B phase as indicating that the magnetic order is similarly unaffected by , then our observations support this interpretation: the magnetic order, until the boundary with the B′ phase is reached, is essentially independent of because orthorhombicity is a transverse field to the two fundamental components, and the peaks at and are interference peaks, not independent components that couple directly to orthorhombicity.
We conclude by returning to our original hypothesis that applied lattice orthorhombicity, by selecting a preferred direction, would change the first-order transition at into a continuous transition. The high-strain data partially but not completely support this hypothesis. Instead of a dominant first-order step at , under large the field evolution of the resistivity, and by inference the magnetic order, is overall more gradual. However there is still a first-order transition, at . The change in across is small, suggesting that the change in magnetic order is minimal. It is possible that higher-order interactions still drive the single- to multi-component transition to be first-order, and the weaker component onsets with small but non-infinitesimal amplitude.
Acknowledgment
The authors thank O. Erten for the fruitful discussions and Paul Canfield and Veronika Fritsch for their assistance with sample growth. We acknowledge the financial support of the Max Planck Society. JP acknowledges the financial support of the National Research Fondation of Korea (NRF) funded by the Ministry of Science and ICT (Grant No. 2016K1A4A4A01922028). HS acknowledges the financial support of PRESTO, JST (Grant No. JPMJPR16R2) and Grant-in-Aid for Young Scientists (Grant No. 16H06015). Raw data for all figures in this paper are available at http://edmond.mpdl.mpg.de/imeji/collection/_n8DQUqmqC4qrw7x or https://dx.doi.org/10.17617/3.1o.
References
- (1) G. G. Marcus, D.-J. Kim, J. A. Tutmaher, J. A. Rodriguez-Rivera, J. O. Birk, C. Niedermeyer, H. Lee, Z. Fisk, and C. L. Broholm, Multi- Mesoscale Magnetism in CeAuSb2. Phys. Rev. Lett. 120, 097201 (2018).
- (2) S. Seo, V. A. Sidorov, H. Lee, D. Jang, Z. Fisk, J. D. Thompson, and T. Park, Pressure effects on the heavy-fermion antiferromagnet CeAuSb2. Phys. Rev. B 85, 205145 (2012).
- (3) L. Zhao, E. A. Yelland, J. A. N. Bruin, I. Sheikin, P. C. Canfield, V. Fritsch, H. Sakai, A. P. Mackenzie, and C. W. Hicks, Field-temperature phase diagram and entropy landscape of CeAuSb2. Phys. Rev. B 93, 195124 (2016).
- (4) L. Balicas, S. Nakatsuji, H. Lee, P. Schlottmann, T. P. Murphy, and Z. Fisk, Magnetic field-tuned quantum critical point in CeAuSb2. Phys. Rev. B 72, 064422 (2005).
- (5) A. Thamizhavel, T. Takeuchi, T. Okubo, M. Yamada, R. Asa, S. Kirita, A. Galatanu, E. Yamamoto, T. Ebihara, Y. Inada, R. Settai, and Y. nuki, Anisotropic electrical and magnetic properties of CeTSb2 (T = Cu, Au, and Ni) single crystals. Phys. Rev. B 68, 054427 (2003).
- (6) K.-A. Lorenzer, A. M. Strydom, A. Thamizhavel, and S. Paschen. Temperature–field phase diagram of quantum critical CeAuSb2. Phys. Status Solidi B 250, 464 (2013).
- (7) C. Lester, S. Ramos, R. S. Perry, T. P. Croft, R. I. Bewley, T. Guidi, P. Manuel, D. D. Khalyavin, E. M. Forgan, and S. M. Hayden, Field-tunable spin-density-wave phases in Sr3Ru2O7. Nat. Materials 14, 373 (2015).
- (8) D. O. Brodsky, M. E. Barber, J. A. N. Bruin, R. A. Borzi, S. A. Grigera, R. S. Perry, A. P. Mackenzie, and C. W. Hicks, Strain and vector magnetic field tuning of the anomalous phase in Sr3Ru2O7. Science Advances 3, 2, e1501804 (2017).
- (9) S. Avci et al, Magnetically driven suppression of nematic order in an iron-based superconductor. Nat. Communications 5 3845 (2014).
- (10) A. E. Böhmer, F. Hardy, L. Wang, T. Wolf, P. Schweiss, and C. Meingast, Superconductivity-induced re-entrance of the orthorhombic distortion in Ba1-xKxFe2As2. Nat. Communications 6 7911 (2015).
- (11) N. Ru, C. L. Condron, G. Y. Margulis, K. Y. Shin, J. Laverock, S. B. Dugdale, M. F. Toney, and I. R. Fisher, Effect of chemical pressure on the charge density wave transition in rare-earth tritellurides RTe3. Phys. Rev. B 77, 035114 (2008).
- (12) R. G. Moore, V. Brouet, R. He, D. H. Lu, N. Ru, J.-H. Chu, I. R. Fisher, and Z.-X. Shen, Fermi surface evolution across multiple charge density wave transitions in ErTe3. Phys. Rev. B 81, 073102 (2010).
- (13) J. Park, H. Sakai, O. Erten, A.P. Mackenzie, and C.W. Hicks, Effect of applied orthorhombic lattice distortion on the antiferromagnetic phase of CeAuSb2. Phys. Rev. B 97, 024411 (2018).
- (14) P. C. Canfield and Z. Fisk, Philos. Mag. B 65, 1117 (1992).
- (15) P. C. Canfield and I. R. Fisher, J. Cryst. Growth 225, 155 (2001).
- (16) C. W. Hicks, M. E. Barber, S. D. Edkins, D. O. Brodsky and A. P. Mackenzie, Piezoelectric-based apparatus for strain tuning. Rev. Sci. Instrum. 85, 065003 (2014).