Comparisons of MHD Propeller Model with Observations of Cataclysmic Variable AE Aqr
Abstract
We have developed a numerical MHD model of the propeller candidate star AE Aqr using axisymmetric magneto-hydrodynamic (MHD) simulations. We suggest that AE Aqr is an intermediate polar-type star, where the magnetic field is relatively weak and an accretion disc may form around the white dwarf. The star is in the propeller regime, and many of its observational properties are determined by the disc-magnetosphere interaction. Comparisons of the characteristics of the observed versus modelled AE Aqr star show that the model can explain many observational properties of AE Aqr. In a representative model, the magnetic field of the star is G and the time-averaged accretion rate in the disc is g/s. Most of this matter is ejected into conically-shaped winds. The numerical model explains the rapid spin-down of AE Aqr through the outflow of angular momentum from the surface of the star to the wind, corona and disc. The energy budget in the outflows, erg/s, is sufficient for explaining the observed flaring radiation in different wavebands. The time scale of ejections into the wind matches the short time scale variability in the light curves of AE Aqr.
1 Introduction
AE Aqr is a nova-like cataclysmic variable (CV). It consists of a magnetic white dwarf and a late-type companion star with a spectral type of K3 -K5. The binary has a relatively long period of 9.88 hours. It is widely believed that the companion star’s atmosphere fills its Roche lobe and matter flows out of the companion’s Roche lobe to the white dwarf (Casares et al., 1996). Pulsations with a period of 33.08 s were detected in optical (Patterson, 1979), UV (e.g., Eracleous et al. 1994), soft X-ray (Patterson et al., 1980), and hard X-ray (Kitaguchi et al., 2014) wavebands.
AE Aqr could be classified as a typical intermediate polar (DQ Her) type CV, except that it has a number of unusual properties: (1) It shows flaring radiation in optical, ultraviolet and X-ray bands, which are all correlated with each other (e.g., Patterson 1979; Mauche et al. 2012); (2) Flaring radiation in the radio band shows a non-thermal spectrum typical for electrons radiating in a magnetized plasma (Bastian et al., 1988). Authors compared the radio flares in AE Aqr with those of the micro-quasar Cyg X-3; (3) The star is spinning down rapidly, at a rate of s s-1, which corresponds to a high spin-down power of erg/s (where ) (De Jager et al., 1994); (4) The estimated accretion luminosity, erg/s (e.g., Mauche 2006), is much lower than the spin-down power; (5) The spectral lines are strongly variable and indicate the presence of outflows. The Doppler tomograms based on the analysis of these lines 111Note that Doppler tomography implicitly assumes that emission is optically thin and bound to the orbital plane of the binary (e.g., Schwope et al. 1999). Therefore, Doppler tomography is not the optimal tool for investigating the presence of winds. are different from the tomograms of other intermediate polars, which typically indicate the presence of an accretion disc (e.g., Marsh et al. 1990). No signatures of a disc were observed in the AE Aqr tomograms (see Fig. 10 from Welsh et al. 1998).
Different models were proposed to explain the observational properties of AE Aqr. In one type of models, it is suggested that the magnetic field of AE Aqr is very large, G, and the white dwarf spins down due to the magneto-dipole radiation, as in the case of pulsars (e.g., Ikhsanov 1998, 2006). In the second type of models, it is suggested that the magnetic field of the star is typical for that of intermediate polars, G (Warner, 1995), and the star spins down due to the interaction of the rapidly-rotating magnetosphere with the surrounding matter in the propeller regime (e.g., Eracleous & Horne 1996).
The apparent lack of an accretion disc in the Doppler tomograms led to the suggestion that an accretion disc does not form; instead, matter flows from the secondary star in a stream of blobs, which interact with the magnetosphere of the WD directly without forming a disc (e.g., King 1993; Wynn & King 1995; Wynn et al. 1997). In their model, blobs of matter interact with the WD ballistically, and a diffusive term has been added to the equations to describe the interaction of the blobs with the magnetosphere of the star. The flaring radiation in different wavebands is explained by the collisions of blobs during their exit path from the white dwarf (Welsh et al., 1998).
Meintjes & de Jager (2000) suggested that a stream of matter flowing from the secondary star interacts with the external layers of the magnetosphere, loses its angular momentum and forms a ring or a small disc around the white dwarf. The matter distribution in this ring is strongly inhomogeneous. Recent 3D MHD simulations of matter flow in AE Aqr have shown that a stream of matter flowing from the secondary star collides with itself after the 1st turn around the white dwarf, forming a ring around it that subsequently forms a turbulent disc (Isakova et al., 2016). Next, the matter of the disc is ejected by the magnetosphere of the WD due to the propeller mechanism. In their model, the magnetic field of the WD is large, 50MG, which leads to a rapid ejection of the inner disc matter by the large, rapidly-rotating magnetosphere.
Overall, it is reasonable to suggest that, in the cases of IP-scale magnetic fields, some kind of disc may form around the white dwarf in AE Aqr. The disc may have unusual properties compared with the discs around non-propelling stars: it may be much smaller than standard discs in IPs, which are thought to have sizes of Roche lobes. It may also be temporary due to the propeller action.
The propeller regime is expected in AE Aqr, and various observational properties may be connected with this regime. However, the disc-magnetosphere interaction in the propeller regime is a complex phenomenon, and has not been sufficiently studied. It has been investigated in a few theoretical works on spherical accretion (e.g., Illarionov & Sunyaev 1975) and disc accretion (Lovelace et al., 1999). However, only restricted numerical models of the propeller regime have been developed so far. Wang & Robertson (1985) studied the propeller regime in two-dimensional numerical simulations using polar coordinates, and thus studied the processes in the equatorial plane. They observed that the matter of the inner disc interacts with the magnetosphere of the star due to the magnetic interchange instability (see also Arons & Lea 1976). No outflows were observed due to the two-dimensional polar geometry of their coordinate system.
The propeller regime has also been studied in axisymmetric simulations (Ustyugova et al., 2006; Romanova et al., 2005, 2009, 2018; Lii et al., 2014). These simulations have shown that the disc-magnetosphere interaction is a strongly non-stationary process, where the inner disc oscillates and most of the matter is ejected into the outflows from the disc-magnetosphere boundary, while a smaller amount of matter accretes onto the star. The WD spins down due to the outflow of angular momentum into the matter- and magnetically-dominated winds. This model can potentially explain the different observational properties of CV AE Aqr. In this paper, we have developed a propeller model of a star with parameters corresponding to those of AE Aqr, calculated the properties of the modelled star and compared them with the observed properties of AE Aqr.
In Sec. 2, we describe our model of AE Aqr. In Sec. 3, we compare our model with the observations. In Sec. 4, we summarize our results. In Appendix A, we provide the details of our numerical model.
2 Propeller model of AE Aqr
2.1 Preliminary estimates
To model the propeller regime in AE Aqr, we take the mass and radius of the white dwarf to be and km, respectively (e.g., Mauche et al. 2012). The period of stellar rotation, s, corresponds to a corotation radius of
| (1) |
We suggest that a disc forms around the WD. The luminosity associated with accretion onto the stellar surface is low, and is estimated to be erg/s (e.g., Mauche 2006). It is connected with the matter flux onto the star as
| (2) |
where g/s and the coefficient takes into account the fact that matter may fall from the finite distance . For example, if matter falls from the distance of the corotation radius, , then . The corresponding accretion rate onto the star is:
| (3) |
where and .
The accretion disc is stopped by the magnetosphere of the star at the radius of , where the matter stress in the disc is equal to the magnetic stress in the magnetosphere. This condition can be approximately described by the formula for the Alfvén radius, obtained for non-rotating stars (e.g., Pringle & Rees 1972; Ghosh & Lamb 1978):
| (4) |
where is the magnetic moment of the WD and is the accretion rate in the disc (which, in the propeller regime, is larger than the accretion rate onto the star, ); is a dimensionless coefficient. is the normalized magnetic field of the WD, and is the normalized accretion rate in the disc.
To estimate the magnetospheric radius in AE Aqr, one needs to know the accretion rate , which is not well known 222For example, Pearson et al. (2003) estimated the mass transfer rate from the donor star as g/s.. We suggest that and the accretion rate in the disc is g/s to obtain the magnetospheric radius, . Taking two reference values for the magnetic field of IPs, G and G, we obtain and , respectively. In both cases, the magnetospheric radius is larger than the corotation radius, , and the star is in the propeller regime. However, the strengths of the propellers are different.
The strength of a propeller is often measured by the fastness parameter, (e.g. Ghosh 2007), which is the ratio of the angular velocity of the star, , to the angular velocity at the inner disc, : . In the case of a Keplerian disc, , and the fastness parameter can be re-written in the following form:
| (5) |
Using the reference values for the accretion rate, , and for the magnetic field, G and G, we obtain the values of the fastness parameter, and , respectively. These estimates are helpful in restricting the values of the fastness parameter in the modelling of AE Aqr.
| Model | |||||||
|---|---|---|---|---|---|---|---|
| 30 | 5.0 | 2.5 | 3.9 | 0.17 | 0.76 | 0.82 | |
| 60 | 5.9 | 3.0 | 5.1 | 0.22 | 1.24 | 0.85 |
2.2 Axisymmetric MHD Simulations of AE Aqr
As a base, we use the axisymmetric model of the propeller regime developed in our group (e.g., Lii et al. 2014; Romanova et al. 2018). We start with the initial conditions that are expected in disc-accreting propelling stars: the simulation region consists of (a) a star with mass , radius and magnetic field ; (b) an accretion disc that is cold and dense, and has an aspect ratio of ( is the initial half-thickness of the disc); (c) a low-density and high-temperature corona, which occupies the rest of the simulation region (i.e., the space above and below the disk and the star; see left panel of Fig. 1 from Romanova et al. 2018). Initially, the matter in the disc and in the corona are in rotational equilibrium, in which the density and pressure distributions are derived from the balance of the gravitational, pressure gradient and centrifugal forces (Romanova et al., 2002).
The disc is turbulent. The turbulence is driven by the magneto-rotational instability (MRI, e.g., Balbus & Hawley 1991; Stone et al. 1996; Armitage 1998; Hawley 2000), which is initiated by a weak poloidal magnetic field placed inside the disc. In our model, the accretion rate corresponds to an effective parameter of . A diffusivity term has been added to the code, with the coefficient of diffusivity constructed in analogy with viscosity (Shakura & Sunyaev, 1973): , where is the sound speed and is a dimensionless parameter.
In our models, we suggest that the 3D instabilities should provide high diffusivity, and we use at radii , where the disc typically interacts with the magnetosphere, and in the rest of the disc (to avoid suppressing the MRI-driven turbulence). The star rotates with an angular velocity of such that the magnetosphere rotates more rapidly than the inner disc, and the star is in the propeller regime.
The models are calculated in dimensionless variables. The conversion procedure for dimensionalization and other details of the model are provided in Appendix A.3.
To model AE Aqr, we take the corotation radius (see Eq. 1), or in dimensionless units (see Appendix A.3), and calculate all models for this corotation radius. Since the magnetic field of AE Aqr is not known, we model propellers of different magnetospheric radii . To do so, we vary the parameter , which we call the dimensionless magnetic moment of the star 333In our dimensionless model, the variation of parameter can be interpreted as either the variation of the stellar magnetic moment, , or the variation of the accretion rate in the disc, . A variation of both values leads to the variation in as . . We have developed numerical models for and and obtained different magnetospheric radii (and therefore different fastness values ).
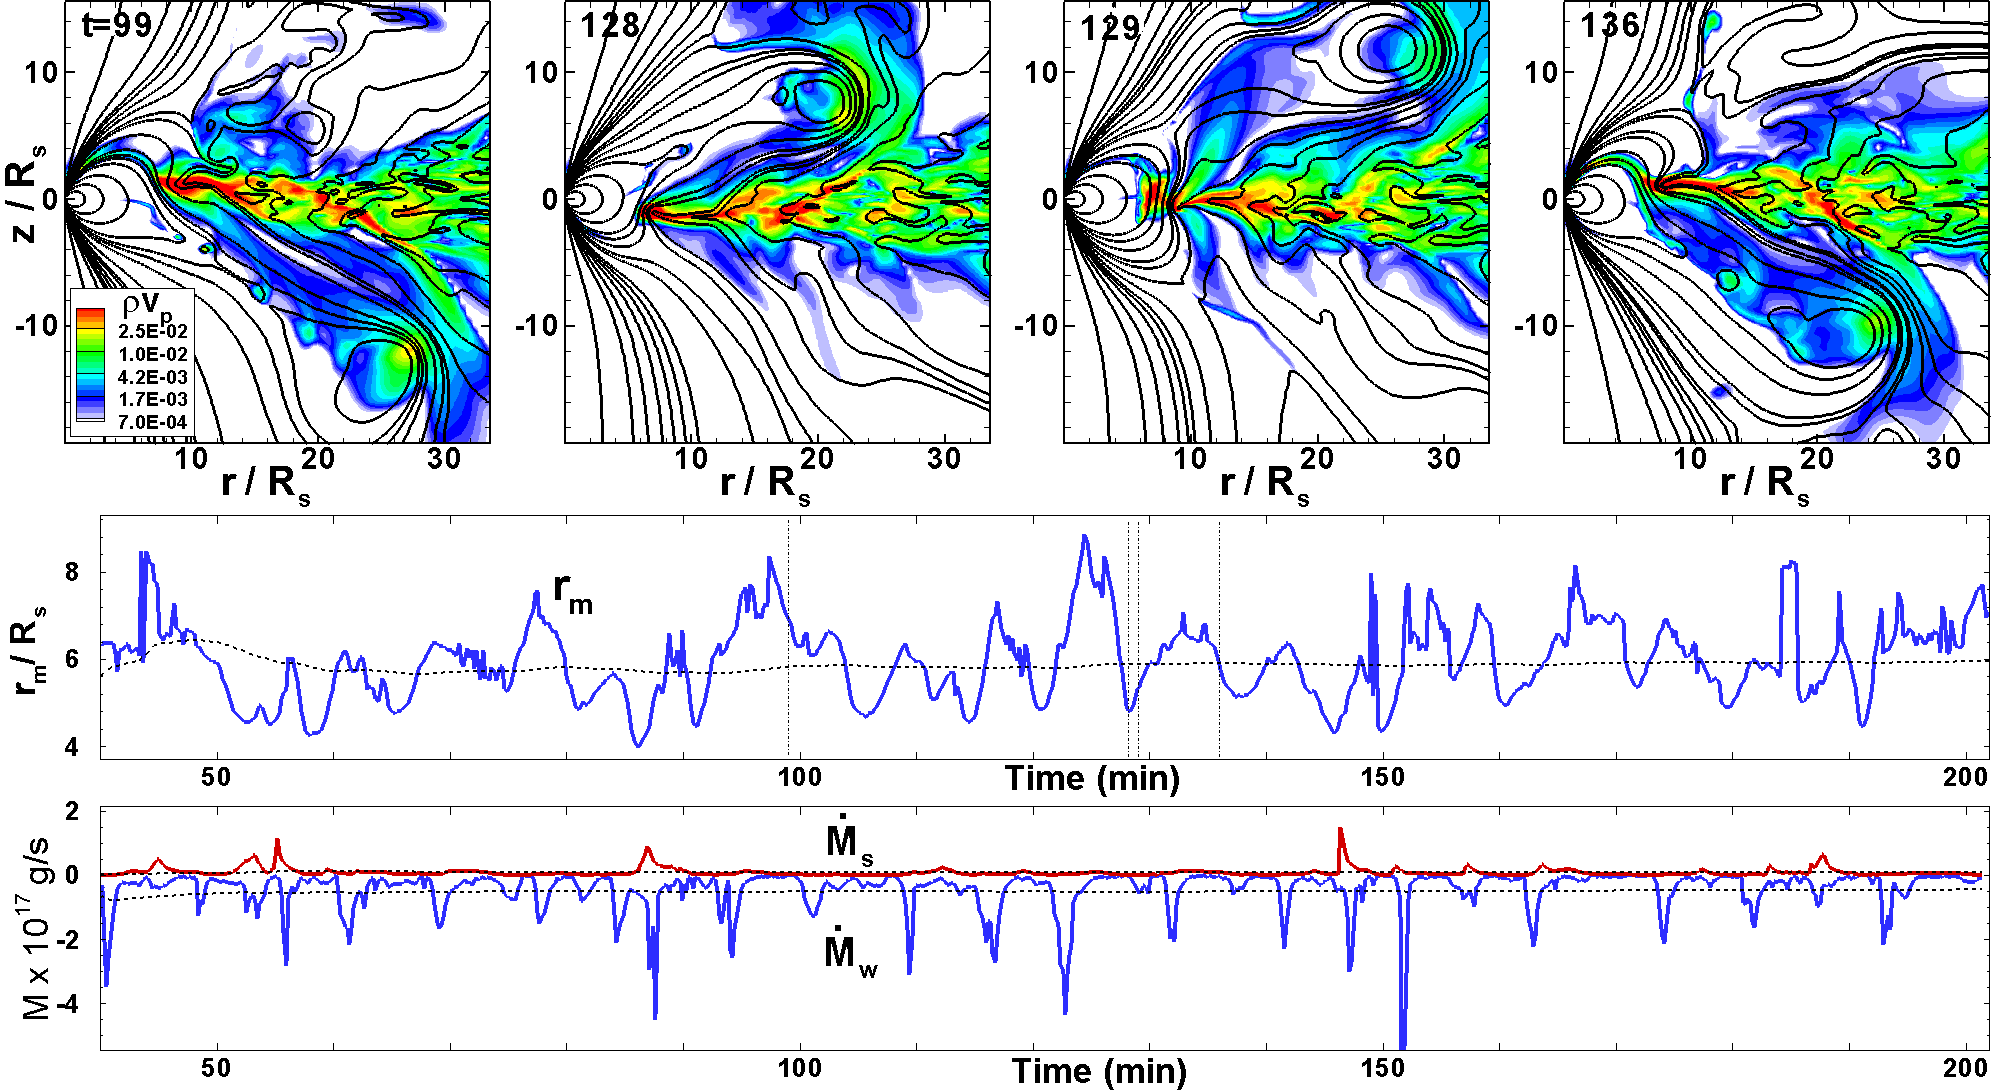
We observed that, in both models, the inner disc strongly oscillates and most of the inner disc matter is redirected into the outflows. The top panels of Fig. 1 show the matter flux density and sample field lines in the model . One can see that the magnetic field lines inflate and open, and some of the matter is ejected into conically-shaped outflows. Matter is ejected at approximately degrees relative to the rotational axis. Ejections above and below the equatorial plane alternate. 444In our axisymmetric simulations, matter is ejected into an azimuthally-symmetric cone. In a more realistic, three-dimensional world, we would expect non-axisymmetric ejections of blobs of matter, which would shoot out in different azimuthal directions.
The disc-magnetosphere interaction occurs in a cyclic manner, where episodes of matter accumulation in the inner disc are followed by events of matter ejection into the winds and simultaneous accretion of matter onto the star (see, e.g., Lii et al. 2014, see also Goodson et al. 1997).
We find the dimensionless magnetospheric radius from the simulations using the balance of magnetic and matter stresses, , where , and are the magnetic field, pressure and density of matter in the equatorial plane, respectively (Romanova et al., 2018). This formula provides the instantaneous value of . The middle row of Fig. 1 shows that the inner disc strongly oscillates and the magnetospheric radius varies with time, which is why we calculate the time-averaged magnetospheric radius,
| (6) |
The dashed line in the middle row of Fig. 1 shows the time-averaged value . We also calculated the time-averaged fastness parameter,
| (7) |
Tab. 1 shows the time-averaged magnetospheric radius, , the ratio and the fastness parameter for both models. We obtained that the time-averaged size of the magnetosphere increases with , and is for models , and , respectively. The fastness parameter also increases systematically: for the same models, respectively. Both values of are within the interval of fastnesses, , expected in IPs with magnetic fields in the range of G (see Eq. 7) 555Note that we currently cannot model propellers with magnetospheric radii , because in the cases of large magnetospheres, the density of the plasma inside the magnetosphere becomes very low, and the time-step in the simulations becomes too small. As a result, in the models with a corotation radius of , we can only model propellers with values of ..
Simulations performed in dimensionless form provide different values that can be used for the subsequent development of a dimensional model of AE Aqr, and for comparisons with observations. The bottom row of Fig. 1 shows the matter fluxes onto the star, , and into the wind, . One can see that the fluxes strongly oscillate. Matter accretes onto the star in rare bursts, because most of time accretion is blocked by the centrifugal barrier of the rapidly-rotating magnetosphere. Ejections into the wind (blue line) are more frequent than accretion events (red line). To characterize each model, we introduce the time-averaged matter fluxes, which are calculated using a formula similar to Eq. 6. The dashed lines show the time-averaged values of the matter fluxes to the star, , and to the wind, . Simulations show that most of the inner disc matter is ejected into the winds.
Tab. 3 also shows the efficiency of the propeller:
| (8) |
One can see that propeller efficiency is for , respectively. That is, per cent of the disc matter is ejected into the wind, while accretes onto the star 666We should note that our axisymmetric model may provide too high accretion rate onto a star, because we model the (unknown) rate of penetration of the disc matter through the magnetosphere by high diffusivity values in the region ..
Next, we use the data obtained in our dimensionless models to develop the dimensional models of AE Aqr. To obtain a dimensional value , we take the dimensionless value from the simulations, and multiply it by the reference value : . We derive the reference values using our standard procedure described in Appendix A.3.
3 Comparisons of model with observations of AE Aqr
Below, we compare the different values calculated in our model with the values observed in AE Aqr.
3.1 Magnetic field of AE Aqr derived from comparisons of modelled and observed spin-down rates
In this section, we compare the spin-down rates obtained in our numerical model with the observed spin-down rate of s/s, and derive the possible values of the magnetic field.
The angular momentum of the star is , where the value of the moment of inertia of the white dwarf is . The time-averaged spin-down rate can be estimated from the relation , and can be re-written in the following form:
To derive the magnetic field of AE Aqr, we equate the spin-down rates obtained in the simulations (see Eq. 9) with the observed spin-down rate. We obtain the magnetic field in the following form:
| (10) |
Tab. 2 shows the values of the magnetic field, , which are and G, for models , and , respectively. One can see that the strength of the magnetic field increases slightly with . It does depend on the moment of inertia coefficient, , which can vary by a factor of 2 (depending on the model of the white dwarf). Overall, these values are in the range of the magnetic field values estimated for IPs. Note that (Choi & Yi, 2000) estimated a magnetic field of the white dwarf of G on basis of the quiescent X-ray and UV emission. This value is very close to values obtained in our models. Note that this field is much lower than the field G used in other type of models (e.g., Ikhsanov et al. 2004, and references therein).
The time-averaged spin-down power of the star:
| (11) |
corresponds to the spin-down rate erg/s erg/s, derived from observations (see Tab. 2).
These comparisons show that the propeller model offers a good explanation for the observed spin-down properties of the star. However, we cannot yet select one specific model over another, because both models can explain the observations, although at slightly different values of the stellar magnetic field.
| Model | (s/s) | (G) | (erg/s) | |
|---|---|---|---|---|
| 7.06E-15 | 2.83E5 | 1.68 | 9.69E33 | |
| 5.20E-15 | 3.29E5 | 4.95 | 9.64E33 |
3.2 Matter fluxes to the star and to the wind
We can now calculate the dimensional values of the matter fluxes onto the star and into the wind. We take the reference value, , from Eq. 14 and take the dimensionless values from Tab. 1 to obtain the time-averaged matter fluxes to the star (subscript ‘s’) and to the wind (subscript ‘w’):
| (12) |
Substituting in the values of the magnetic field from Tab. 2, we obtain the values of the matter fluxes (see Tab. 3). The table also shows the time-averaged total matter flux through the disc: . One can see that the matter flux in the disc decreases when parameter increases.
The matter flux in the disc obtained in our models, , is comparable to the mass transfer rates expected in nova-like CVs with orbital periods of hours: g/s (e.g., Dhillon 1996).
We use Eq. 2 and our values of to estimate the luminosity associated with accretion onto the star, . Tab. 3 shows the values of luminosity. The luminosity is more than 10 times larger than the accretion luminosity deduced from the observations: erg/s. The last column of Tab. 3 shows the ratio between the accretion luminosity obtained in our models and the observed luminosity of . One can see that the accretion luminosity obtained in our models is times higher than the observed one.
The relatively high accretion rate onto the star may be connected with the axisymmetry of our model and our high diffusivity value () taken at the disc-magnetosphere boundary. At lower values of , the accretion rate is expected to be lower. We also should note that to support MHD simulations, a small amount of matter (floor density matter) is added to the parts of the magnetosphere with the largest values of the magnetic-to-matter pressure density. This matter may also contribute to the accretion rate onto a star.
| Model | () | (g/s) | (g/s) | (erg/s) | ||
|---|---|---|---|---|---|---|
| 1.89E16 | 8.41E16 | 1.03E17 | 0.82 | 2.88E33 | ||
| 8.24E15 | 4.65E16 | 5.47E16 | 0.85 | 1.25E33 |
3.3 Velocities of matter in the wind
Welsh et al. (1998) performed high-speed spectrophotometric observations of AE Aqr in the spectral line and found that the spectral line varies rapidly in both red and blue wings. Doppler signatures from variable lines show that the red and blue wings span from km/s to km/s, with a significant amount of radiation which comes from the matter that flows at radial velocities of km/s, and a smaller amount of matter flowing at higher velocities (see Figures 8-10 from Welsh et al. 1998). Below, we analyze the distribution of velocities in our model, and discuss the possible locations where this flaring radiation may originate.
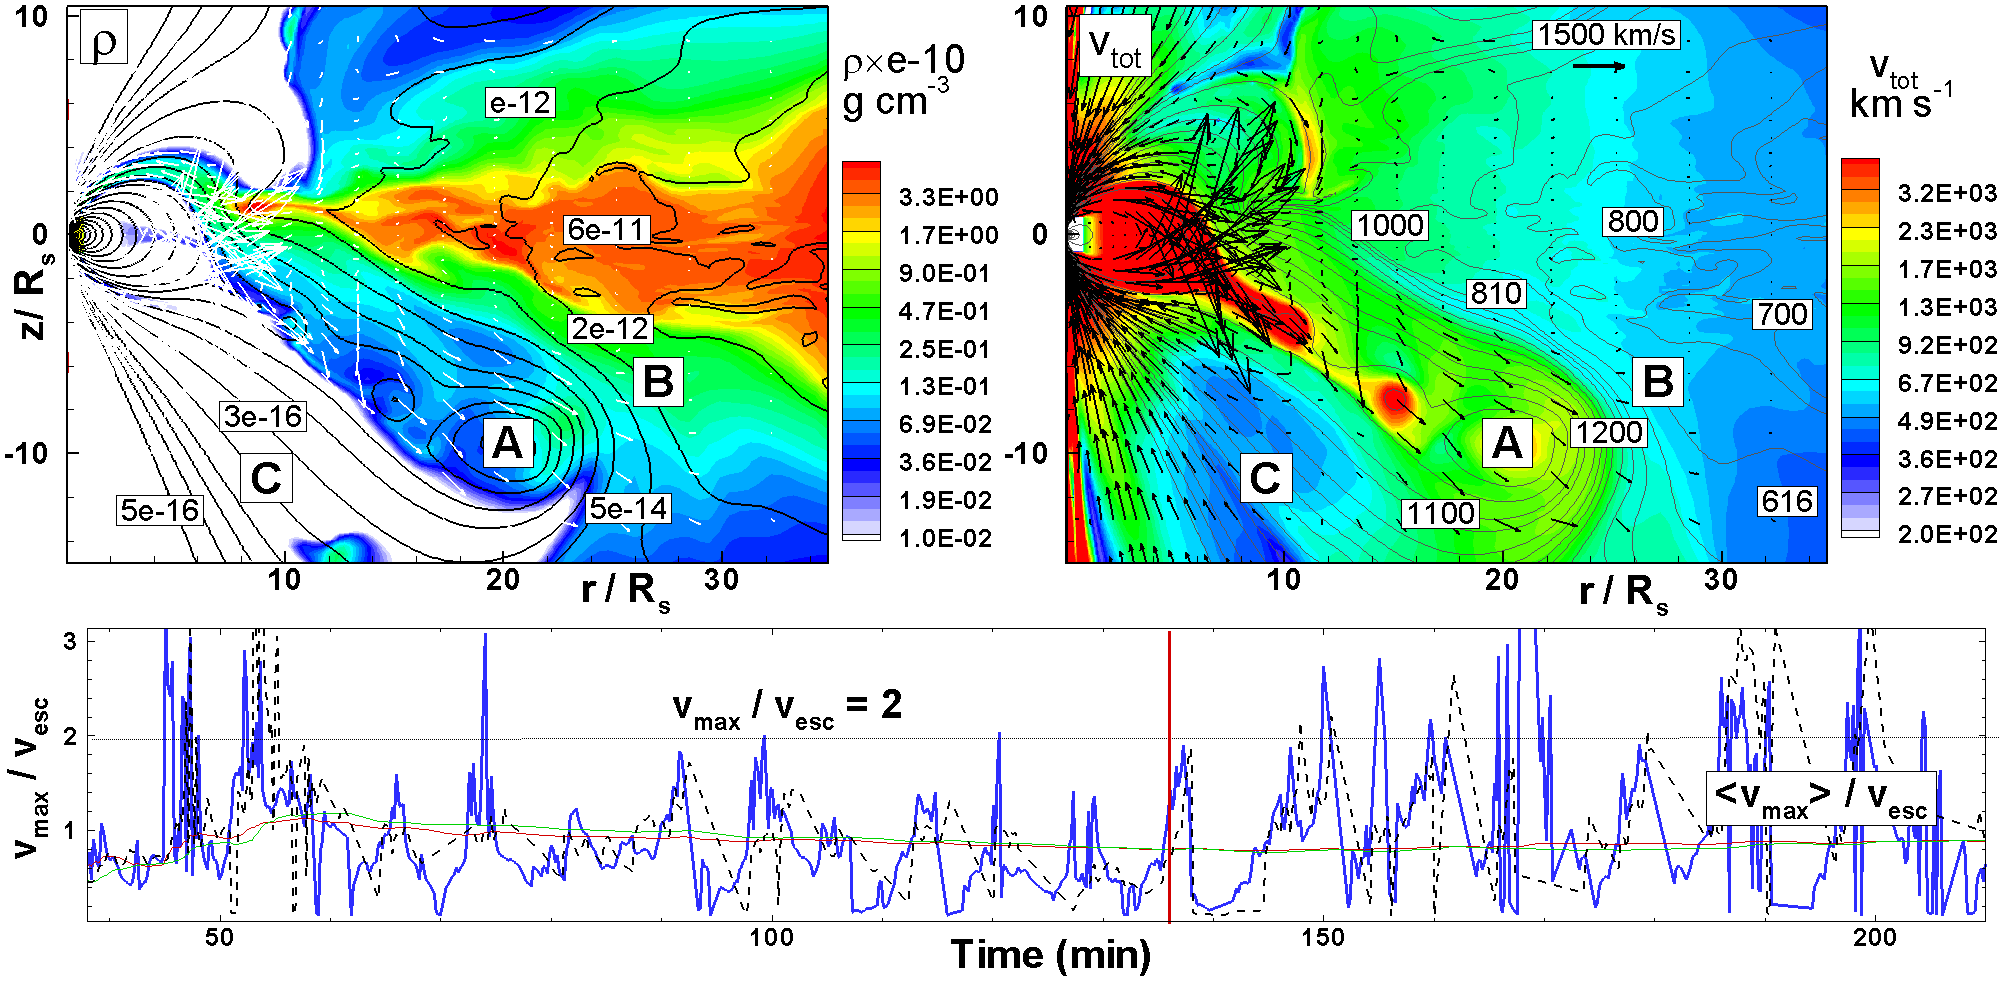
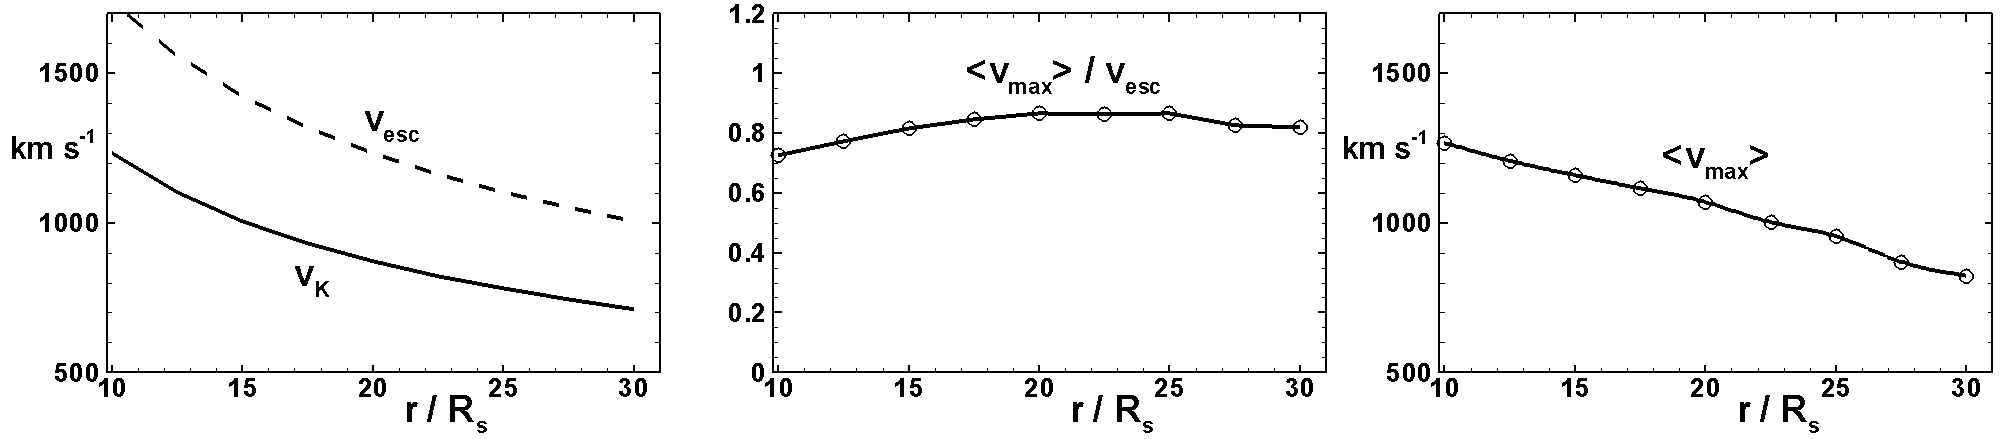
First, we calculate the total velocity of matter flow in different parts of our simulation region, , where , and are the components of velocity in and directions, respectively. Fig. 2 (top right panel) shows the distribution of total velocity during a typical propeller ejection. One can see that the total velocity is high in the area of propeller ejecta, (see region A in the plot), and is lower in region B, between the disc and the ejecta. Velocity is lowest in the disc, with a minimum value of . These velocities are too high to explain the low-velocity component observed in the Doppler shifts of the spectral line. The lowest velocity is associated with Keplerian velocity of the disc matter. This velocity decreases with distance from the star as (see also left panel of Fig. 3), and reaches the value of at the distance of , which is approximately twice as large as our simulation region in the radial direction.
Next, we investigate the poloidal velocities, . Fig. 2 shows that the poloidal velocities (vectors in the plot) are largest in the area of the propeller ejecta (region A in the plot). They are smaller in the disc wind (region B). There is also region C (closer to the axis), where velocities may be very high. However, the density in this region is very low (see distribution of densities in the top left panel of the same figure), and this region does not contribute much to the matter flux. Analysis of the poloidal matter fluxes, , shows that most of the matter flows in the regions A (higher velocities) and B (lower velocities).
The question arises whether the ejected matter moves with super-escape velocities. For this analysis, we study the distribution of poloidal velocities with distance from the star. We surround a star with cylindrical boxes of radii and heights , and search for the maximum poloidal velocity, , at the cylindrical boxes 777We de-selected regions of very high velocity with low matter flux, by placing condition that the matter flux should be larger some small value, (in dimensionless units) (see details in Romanova et al. (2018) and Fig. 7 from this paper, which shows the position of the maximum poloidal velocity.. The bottom panel of Fig. 2 shows variation of the maximum poloidal velocity with time at the cylindrical boxes with radii (solid blue line) and (long-dashed line). One can see that the maximum velocity varies between small values, much smaller than the escape velocity, and large values, which are 2-3 times larger than the escape velocity. This analysis shows that the ejected matter is not gravitationally bound, and will continue to move further away to larger distances from the star.
Another question is whether matter moves from the star with acceleration or deceleration. To analyze the variation of poloidal velocity with distance from the star, we calculate the time-averaged maximum poloidal velocity, (see details in Romanova et al. 2018). The bottom panel of Fig. 2 shows that the normalized time-averaged velocities, , are approximately the same in the cases of smaller and larger boxes. We also calculated and at different cylindrical boxes and observed that the ratio stays approximately constant (see middle panel of Fig. 3). The escape velocity decreases with distance, and therefore the poloidal velocity also decreases with distance. The right panel of Fig. 3 shows that the poloidal velocity decreases with distance approximately linearly. Approximating this dependence to larger distances from the star, we obtain km/s at the distance of . Overall, both the azimuthal and poloidal velocities decrease with distance and are expected to have lower values at larger distances from the star.
Propeller ejections are non-stationary and shock waves may form, where new ejecta interacts with a slower-moving matter of the earlier ejected matter. We suggest that the flares observed in optical, UV and X-ray spectral bands may be associated with radiation in these shocks and in the surrounding medium. To explain the relatively low velocities in radiating matter, one should consider distances that are two times (or more) greater than compared with our simulation region.
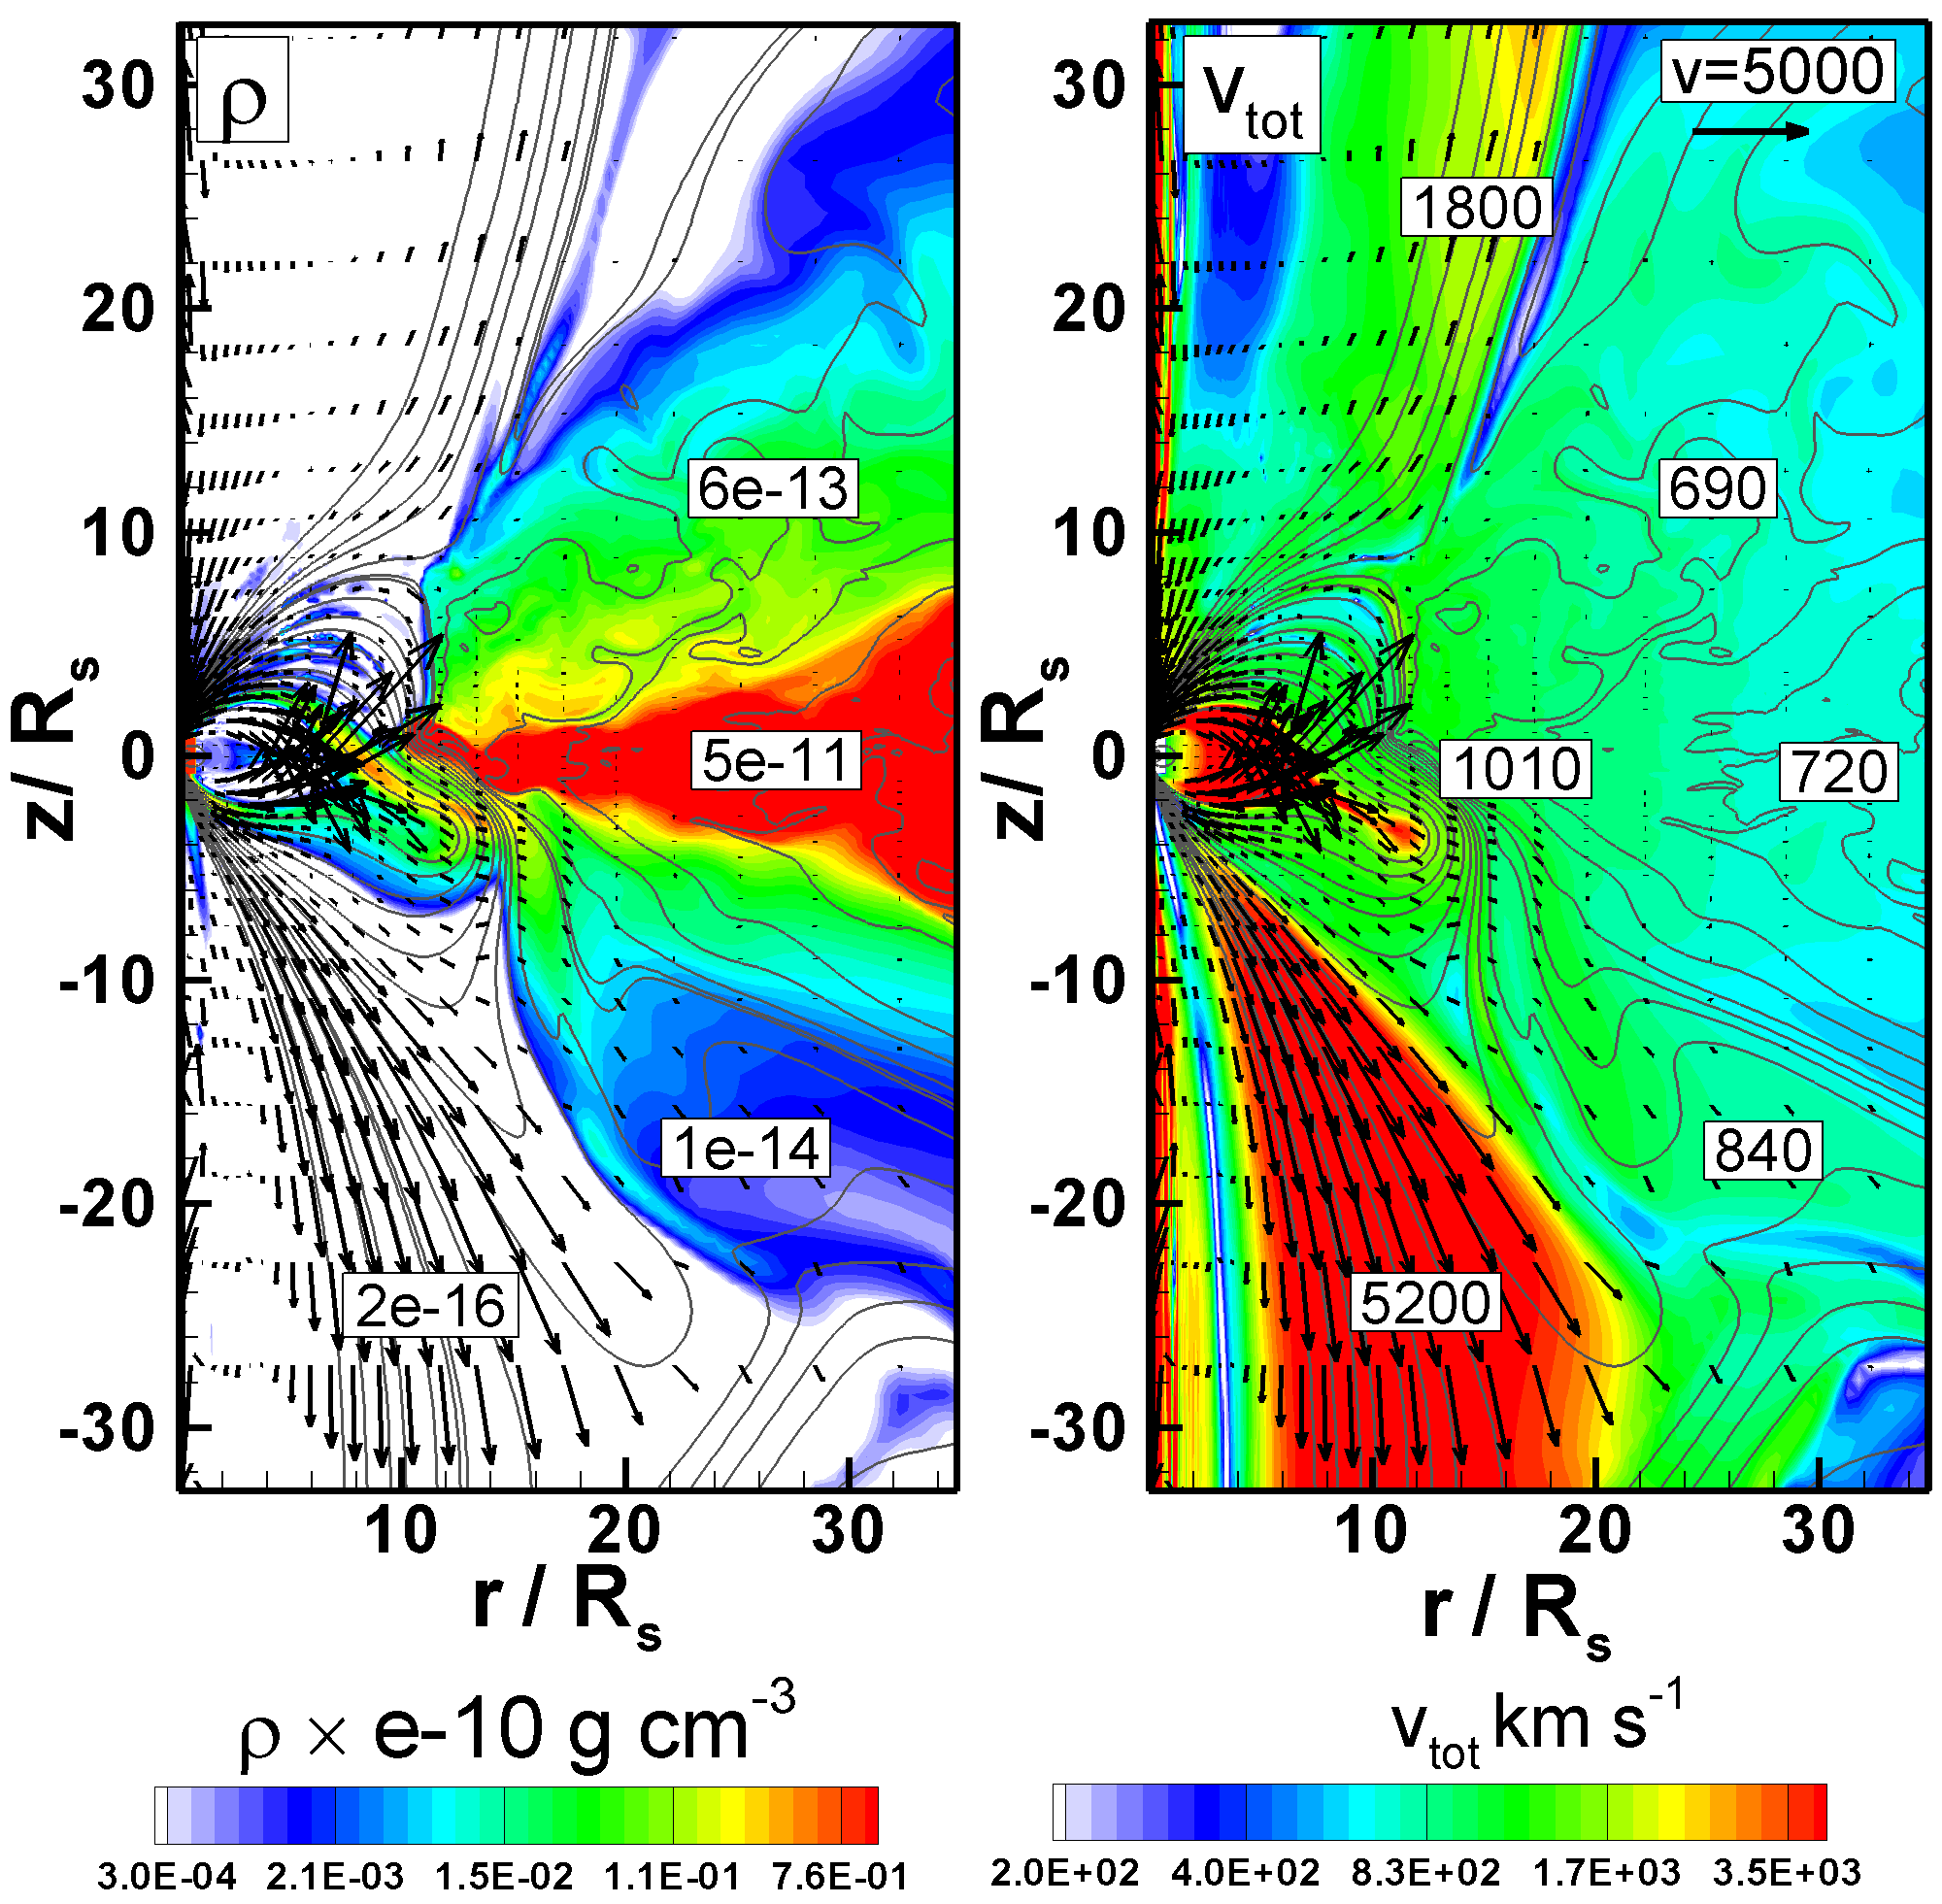
We should note that a small amount of matter is rapidly accelerated by the magnetic pressure force in regions, closer to the axis (see Fig. 4). These magnetic (Poynting flux) ejections do not correlate directly with the matter ejections. They occur during episodes of strong inflation of the magnetic loops. Ejections are non-stationary, and formation of shock waves is also expected. In shocks, the magnetic energy can be converted into the particle energy due to reconnection or other processes (e.g., Romanova & Lovelace 1992, Romanova & Lovelace 1997). These shocks may be responsible for radio flares and for the high-energy radiation. These magnetic outflows are magnetically-collimated and are expected to form the jet-like flow at larger distances from the star. They are similar to magnetic jets studied in compact stars and quasars (e.g., Ustyugova et al. 2000; Tchekhovskoy et al. 2012). We suggest that flaring radiation in radio band may originate in the shock waves of this jet. The similarity between the radio spectra of AE Aqr and that of microquasar Cyg X-3 is in favour of this hypothesis. Some part of the magnetic energy can be converted to the high-energy radiation. However, it can be a small, and therefore there is no contradiction with recent luck in finding TeV radiation from AE Aqr (e.g., Aleksić et al. 2004).
| Model | () | ||
|---|---|---|---|
| 0.59 | 0.07 | 1.0E34 | |
| 1.59 | 0.09 | 9.1E33 |
3.4 Time intervals between flares
Next, we compare the variability time scales obtained in our numerical models with the time scales observed in the light curves of AE Aqr. Fig. 3 from Mauche et al. (2012) shows that there are two types of flares: some flares occur rarely, with a time interval of a 1-3 hours between each flare (see individual large flares marked by vertical dashed lines); other flares occur more frequently, on time intervals of 10-30 minutes (see multiple flares on the left-hand side of Fig. 3 from Mauche et al. 2012, and also the sub-flares that occur on other time intervals). We can compare the observed time scales with the time scales obtained in our models.
Fig. 1 shows the variability obtained in model . The bottom panel shows the matter fluxes onto the star, , and into the wind, . The blue line in the top panel shows that the strongest ejections into the wind occur every 10-20 minutes. This time scale is similar to the time scales of the frequent flares in the observed light curve. Ejections into the wind are slightly more frequent ( min) in the model with the smaller magnetosphere, . Overall, the variability time scales match the short time scale oscillations in the observed light curve.
In our simulations, ejections into the wind occur in brief bursts, because outflows are only possible if the field lines connecting the star with the inner disc inflate and open. Inflation becomes possible when a sufficient amount of matter accumulates at the inner disc and diffuses through the field lines of the outer magnetosphere. Most of the time, matter is accumulated at the inner disc, while the outflow events are relatively brief. This is why the variability curve looks spiky (see bottom panel of Fig. 1). However, the small scale oscillations observed in AE Aqr are not spiky. We suggest that a proper inclusion of radiation in our model may change the shape of the variability curve, possibly making the oscillations less spiky.
On the other hand, the variability curve associated with the variation of the inner disc radius, (see middle row of Fig. 1), is not spiky. It strongly resembles the observed light curve for short time scale flares. In some theoretical models, it is suggested that the flaring radiation is connected with the processes at the disc-magnetosphere boundary and in the inner disc, such as the heating in the turbulent layer of the boundary (Papitto & Torres, 2015), or the acceleration of particles in the magnetized plasma of the inner disc (Meintjes & de Jager, 2000). If the radiation really does originate at the inner disc, then the oscillations of the inner disc (observed in our model) will lead to the variations in the observed light curves.
The origin of the less frequent flares in the light curves of AE Aqr may be connected with the non-stationary accretion expected in the propeller regime. On the other hand, non-stationary ejections can be due to the non-stationary accretion of matter from the secondary star, which may have the form of inhomogeneous streams, or blobs (e.g., Wynn & King 1995). More detailed analysis of these processes is beyond the scope of this paper.
3.5 Energy in Flares
A star loses its rotational energy. A part of this energy is transferred to the energy of the inner disc winds, while another part flows from polar regions of the star in the form of magnetic, Poynting flux jets. The time-averaged energy fluxes carried by matter (m) and by the magnetic field (f) through some surface ) are:
| (13) |
where are corresponding dimensionless values. Table 4 shows energy fluxes calculated at the stellar surface. One can see that almost all energy is carried by the magnetic field. A smaller amount of energy is carried by the matter, which accretes onto the star.
Observations of AE Aqr show aperiodic flares in optical, UV, X-ray and radio bands (e.g., Patterson 1979). Similar flares are observed in the UV spectrum (Eracleous & Horne, 1996). The luminosity of flares in the high state in the Balmer continuum reaches the value of erg/s, and values a few times smaller in the low state in the Balmer continuum, and in the UV and Blamer spectral lines (see Tab. 3 from Eracleous & Horne 1996). The X-ray luminosity is lower, while the radio luminosity is much lower. 888Energetic flares in -rays were reported Meintjes et al. (1994), however were not confirmed by other groups.
In our model, matter is ejected from the inner disc into the wind in non-stationary bursts (see bottom panel of Fig. 1). The ejected matter is accelerated by the magnetic pressure force from zero velocity (near the disc) up to hundreds of km/s at larger distances (see Sec. 3.3). Accelerated chunks of matter, wile interacting with earlier ejected matter, may form shock waves, and a significant part of the kinetic energy can be radiated in the shock waves and observed as flares999In our code, the energy equation is written in the entropy form, and the shocks cannot be modelled..
Matter is ejected from the inner disc in chunks of different mass. Using a plot in the bottom panel of Fig. 1, we can estimate the mass ejected in individual bursts. For example, at time min, the large ejection lasted for sec and the total integrated ejected mass is estimated as g. Smaller ejections have mass of g.
The kinetic energy, carried by individual chunks is
A typical duration of strong ejections is min, and the rate of energy release during ejection is
This rate of energy release is sufficient to explain the observed flares.
Our model can be compared with the model of colliding blobs (e.g., Wynn et al. 1997). In this model, it is suggested that matter accretes onto the magnetosphere in blobs, which are subsequently ejected by the propelling magnetosphere in clumps, which collide with each other and radiate (e.g., Pearson et al. 2003; Zamanov et al. 2012). To explain the observed flares, they estimate the mass involved in collisions as g and the total energy, released during collisions, as erg/s. It is interesting, that the mass of our largest ejections is similar to the mass in their model. However, they considered longer-lasting flares, while our flares are relatively brief.
In our model, energy also flows in the form of invisible magnetic energy. Some energy is associated with the magnetic field lines expanding together with matter into the inner disc wind. On the other hand, a significant amount of magnetic energy flows from the surface of the star along the inflated field lines in the form of a Poynting flux jet, where a small amount of matter is accelerated rapidly by the magnetic force. The Poynting flux outflows are non-stationary, and particles may be accelerated at the magnetic shocks (e.g., Romanova & Lovelace 1997), possibly up to very high energies. However, it is not clear which part of the energy will propagate in the form of an invisible, magnetic jet and which part will be converted to accelerated particles and radiation 101010Recent observations of the very high-energy radiation from AE Aqr, performed by MAGIC at the energies of GeV (Aleksić et al., 2004) and by Fermi-LAT in the 100 MeV-300 GeV energy range, have shown that this radiation, if present, should be weak, much weaker than that of erg/s reported in the earlier observations in the TeV band (e.g., De Jager et al. 1986). In our model, individual ejections into the Poynting flux jet may have the sufficiently high energy flux of erg/s. However, only a small part of this energy can be converted into the very high-energy radiation..
4 Summary
In this work, we have developed a propeller model of AE Aqr using axisymmetric simulations. We suggested that some type of an accretion disc forms around the white dwarf and interacts with the magnetosphere of the star in the propeller regime. We compared the results of our models, and , with the observations. In these models, the time-averaged magnetospheric radii are and , and the fastness parameter values are and , respectively. Our conclusions are the following:
1. Both models can explain the rapid spin-down of AE Aqr, although at slightly-different values of the magnetic field of the white dwarf: G for and , respectively.
2. In both models, the disc-magnetosphere interaction is a strongly non-stationary process, where the inner disc oscillates. The total time-averaged accretion rate in the disc is g/s in the above two models, respectively.
3. Most of the inner disc matter is ejected into conically-shaped winds, and a much smaller part accretes onto the star. Our axisymmetric model is not precise in providing the accretion rate onto the star, due to unknown diffusivity rate.
4. The main flaring variability can be explained through the processes in the non-stationary outflows (possibly by the radiation in shocks). The time-averaged total energy budget in the outflows, erg/s, is sufficient for explaining the flares observed in different wavebands.
5. The predicted accretion rate onto a star is higher than that obtained from the observations of accretion luminosity of AE Aqr ( erg/s). The relatively high accretion rate in our models can be explained by the high diffusivity at the disc-magnetosphere boundary, taken in our axisymmetric models.
6. Velocities of matter in the simulation region km/s, are high and cannot explain the low velocity component of the flaring radiation observed in the spectral line. Matter responsible for this flaring radiation should be located at least at twice as large distance from the star, compared with our simulation region.
7. Both accretion and ejections are non-stationary and occur in brief episodes. The ejections of matter into the outflows and the oscillations of the inner disc occur on a time scale of minutes. This variability matches the short time scale variability observed in the light curves of AE Aqr. The longer time scale variability may be connected with the non-stationary accretion from the disc.
Overall, the developed models of AE Aqr are in reasonable agreement with the observational data. One of the inconsistencies is the presence of an accretion disc in our model and no observational evidence of an accretion disc in the Doppler tomograms (e.g., Wynn et al. 1997). We should note that, in our models of the strong propeller regime, the inner disc strongly oscillates. This may lead to a variable, non-ordered disc, which can be difficult to detect using the Doppler tomography technique (which suggested a steady flow of matter in the equatorial plane of the binary, e.g., Echevarría 2012). Our propeller models work even in the cases where the disc is variable, relatively small, or when it forms as a temporary feature. Additionally, in our model, most of the disc matter is ejected into the outflows, which can distort information about the accretion disc in the Doppler tomograms.
Another important inconsistency of the model is the fact that the model provides a higher accretion rate onto the surface of a star compared with that derived from the observations. We should point out that our axisymmetric model we suggested a high diffusivity in the inner part of the simulation region (to mimic the 3D instabilities), which may lead to a higher accretion rate. On the other hand, in more realistic 3D simulations, the magnetic axis can be tilted about the rotational axis, which may lead to lower accretion rate onto the surface of the star in the propeller regime.
Acknowledgments
The authors thank the anonymous referee for valuable comments and corrections, and Gagik Tovmassian for helpful discussion.
Resources supporting this work were provided by the NASA High-End Computing (HEC) Program through the NASA Advanced Supercomputing (NAS) Division at the NASA Ames Research Center and the NASA Center for Computational Sciences (NCCS) at Goddard Space Flight Center. The research was supported by NASA grant NNX14AP30G. AVK was supported by the RFBR grant 18-02-00907.
References
- Aleksić et al. (2004) Alexić, J., et al. 2014, A&A, 568, A109, pp. 1-8
- Armitage (1998) Armitage, P., 1998, ApJ, 501, L189
- Arons & Lea (1976) Arons, J. & Lea, S.M. 1976, ApJ, 207, 914
- Balbus & Hawley (1991) Balbus, S.A., & Hawley, J.F. 1991, ApJ, 376, 214
- Bastian et al. (1988) Bastian, T. S., Dulk, G. A., & Chanmugam, G. 1988, ApJ, 324, 431
- Blinova et al. (2016) Blinova, A. A., Romanova, M. M., Lovelace, R. V. E. 2016, MNRAS, 459, 2354
- Casares et al. (1996) Casares, J., Mouchet, M., Martínez-Pais, I.G.,, Harlaftis, E.T. 1996, MNRAS, 282, 182
- Choi et al. (1999) Choi, C.-S., Dotani, T., Agrawal, P. C. 1999, ApJ, 525, 399
- Choi & Yi (2000) Choi, C.-S. and Yi, I. 2000, ApJ, 538, 862
- Cowling (1934) Cowling, T. G. 1934, MNRAS, 194, 39
- De Jager et al. (1986) de Jager, H.I., de Jager, O. C., North, A. R., Raubenheimer, B. C., van der Walt, D. J., van Urk, G., 1986, South African Journal of Physics, Vol. 9, No. 3, p. 107
- De Jager (1994) de Jager, O.C., 1994, ApJS, 90, 775
- De Jager et al. (1994) de Jager, O.C., Meintjes, P.J., O’Donghue, D., Robinson, E.L., 1994, MNRAS, 267, 577
- de Martino et al (2013) de Martino, D., Belloni, T., Falanga, M., Papitto, A., Motta, S., Pellizzoni, A., Evangelista, Y., Piano, G., Masetti, N., Bonnet-Bidaud, J.-M., Mouchet, M., Mukai, K., Possenti, A. 2013, A&A, 550, A89, 16
- Dhillon (1996) Dhillon V., 1996, in Evans A., Wood J. H., eds, Cataclysmic variables and related objects. Kluwer, Dordrecht, p. 3
- Echevarría et al. (2008) Echevarría, J., Smith, R. C. Costero, R., Zharikov, S. & Michel, R. 2008, MNRAS, 387, 1563
- Echevarría (2012) Echevarría, J. 2012, Mem. S.A.It., Vol. 83, 570 897
- Eracleous et al. (1994) Eracleous, M., Horne, K., Robinson, E. L., et al. 1994, ApJ, 433, 313
- Eracleous & Horne (1996) Eracleous, M., & Horne, K. 1996, ApJ, 471, 427
- Gardiner & Stone (2005) Gardiner, T. A., Stone, J. M. 2005, Journal of Computational Physics, 205, 509
- Ghosh (2007) Ghosh, P. 2007, Rotation and Accretion Powered Pulsars: World Scientific Series in Astronomy and Astrophysics – Vol. 10. Edited by Pranab Ghosh. Published by World Scientific Publishing Co., Pte. Ltd., Singapore
- Ghosh & Lamb (1978) Ghosh, P., Lamb, F. K. 1978, ApJ, 223, L83
- Goodson et al. (1997) Goodson, A. P., Winglee, R. M., & Böhm, K.-H. 1997, ApJ, 489, 1099
- Hawley (2000) Hawley, J. F. 2000, ApJ, 528, 462
- Hellier (1996) Hellier, C., 1996, ApJ, 471, 949
- Horne (1999) Horne, K. 1999, Annapolis Workshop on Magnetic Cataclysmic Variables, ASP Conference Series, Volume 157, edited by Coel Hellier and Koji Mukai, 1999, p. 349
- Illarionov & Sunyaev (1975) Illarionov, A. F., & Sunyaev, R. A. 1975, A&A, 39, 185
- Ikhsanov (1998) Ikhsanov, N.R. 1998, A&A, 338, 521
- Ikhsanov (1999) Ikhsanov, N.R. 1999, A&A, 347, 915
- Ikhsanov et al. (2004) Ikhsanov, N.R., Neustroev, V. V., Beskrovnaya, N. G. 2004, A&A, 421, 1131
- Ikhsanov (2006) Ikhsanov, N.R. 2006, 1975, ApJ, 640, L59
- Isakova et al. (2016) Isakova, P. B., Ikhsanov, N. R., Zhilkin, A. G., Bisikalo, D. V., Beskrovnaya, N. G. 2016, Astronomy Reports, Volume 60, Issue 5, 498
- Itoh et al. (2006) Itoh, K., Okada, S., Ishida, M., Kunieda, H. 2006, 2006, ApJ, 639, 397
- King (1993) King, A. R. 1993, MNRAS, 261,144
- Kitaguchi et al. (2014) Kitaguchi, T., et al. 2014, ApJ, 782:3 (7pp)
- Koldoba et al. (2016) Koldoba, A. V., Ustyugova, G. V., Lii, P. S., Comins, M. L., Dyda, S., Romanova, M. M., Lovelace, R. V. E. 2016, New Astronomy, 45, 60
- Kuijpers et al. (1997) Kuijpers, J., Fletcher, L., Abada-Simon, M., Horne, K.D., Raadu, M.A., Ramsay, G., Steeghs, D. 1997, A&A, 322, 242
- Kulkarni & Romanova (2008) Kulkarni, A., & Romanova, M.M. 2008, MNRAS, 386, 673
- Lii et al. (2014) Lii, P.S., Romanova, M.M., Ustyugova, G.V., Koldoba, A.V., Lovelace, R.V.E. 2014, MNRAS, 441, 86
- Lovelace et al. (1999) Lovelace, R.V.E., Romanova, M.M., & Bisnovatyi-Kogan, G.S. 1999, ApJ, 514, 368
- Mauche (2006) Mauche, C.W. 2006, MNRAS, 369, 1983
- Mauche (2009) Mauche, C.W. 2009, ApJ, 706, 130
- Mauche et al. (2012) Mauche, C. W., Abada-Simon, M., Desmurs, J.-F., Dulude, M. J., Ioannou, Z., Neill, J. D., Price, A., Sidro, N., Welsh, W. F., AAVSO CBA, 2012, Memorie della Societa Astronomica Italiana, v.83, p.651
- Marsh et al. (1990) Marsh T. R., Home K, Schlegel E. M., Honeycutt R. K, Kaitchuk R. H., 1990, ApJ, 364, 637
- Meintjes et al. (1994) Meintjes, P.J., de Jager, O. C., Raubenheimer, B. C., Nel, H. I., North, A. R., Buckley, D. A. H., Koen, C. 1994, ApJ, 434, 292
- Meintjes & de Jager (2000) Meintjes, P.J., & de Jager, O.C. 2000, MNRAS, 311, 611
- Papitto & Torres (2015) Papitto, A., & Torres, D.E. 2015, ApJ, 807, article id. 33, 10 pp.
- Patterson (1979) Patterson, J. 1979, ApJ, 234, 978
- Patterson et al. (1980) Patterson, J., Branch, D., Chingarini, G., & Robinson, E. L. 1980, ApJ, 240, L133
- Pearson et al. (2003) Pearson, K.J., Horne, K., Skidmore, W. 2003, MNRAS, 338, 1067
- Pringle & Rees (1972) Pringle, J.E., & Rees, M.J. 1972, A&A, 21, 1
- Rodrigues et al. (2017) Rodrigues, C., da Silva, K., Luna, G., Coelho, J., Lima, I., Costa, J., de Araujo, J. 2017, “The X-ray Universe 2017”, Proceedings of the conference held 6-9 June, 2017 in Rome, Italy. Edited by J.-U. Ness and S. Migliari.
- Romanova & Lovelace (1992) Romanova, M.M. & Lovelace, R.V.E. 1997, A&A, 262, 26
- Romanova & Lovelace (1992) Romanova, M.M. & Lovelace, R.V.E. 1997, ApJ, 475, 97
- Romanova et al. (2008) Romanova, M.M., Kulkarni, A.K., Lovelace, R.V.E. 2008, ApJ, 673, L171
- Romanova & Kulkarni (2009) Romanova, M.M. & Kulkarni, A.K. 2009, MNRAS, 398, 701
- Romanova & Lovelace (1997) Romanova, M.M. & Lovelace, R.V.E. 1997, ApJ, 475, 97
- Romanova & Owocki (2015) Romanova, M.M. & Owocki, S.P. 2015, Space Sciences Reviews, Vol. 191, Issue 1-4, 339
- Romanova et al. (2002) Romanova, M. M., Ustyugova, G. V., Koldoba, A. V., Lovelace, R. V. E., 2002, ApJ, 578, 420
- Romanova et al. (2004b) Romanova, M. M., Ustyugova, G. V., Koldoba, A. V., Lovelace, R. V. E., 2004, ApJ, 616, L151
- Romanova et al. (2005) Romanova, M. M., Ustyugova, G. V., Koldoba, A. V., Lovelace, R. V. E., 2005, ApJ, 635, 165L
- Romanova et al. (2009) Romanova, M. M., Ustyugova, G. V., Koldoba, A. V., Lovelace, R. V. E., 2009, MNRAS, 399, 1802
- Romanova et al. (2011) ————- 2011, MNRAS, 416, 416
- Romanova et al. (2012) ————- 2012, MNRAS, 421, 63
- Romanova et al. (2018) Romanova, M. M., Blinova, A.A., Ustyugova, G. V., Koldoba, A. V., Lovelace, R. V. E., 2018, New Astronomy, 62, 94
- Schmidtobreick (2015) Schmidtobreick, L. 2015, Proceedings of The Golden Age of Cataclysmic Variables and Related Objects - III (Golden2015), e-print: arXiv:1705.09332
- Schwope et al. (1999) Schwope, A. D., Schwarz, R., Staude, A., Heerlein, C., Horne, K., Steeghs, D. 1999, ASP Conference Series, Volume 157, edited by Coel Hellier and Koji Mukai, p. 71
- Seaquist (1993) Seaquist, E.R. 1993, Rep. Prog. Phys., 56, 1145
- Schwope et al. (1999) Schwope, A. D., Schwarz, R., Staude, A., Heerlein, C., Horne, K., Steeghs, D. 1999, Annapolis Workshop on Magnetic Cataclysmic Variables, ASP Conference Series, Volume 157, edited by Coel Hellier and Koji Mukai, 1999, p. 71
- Shakura & Sunyaev (1973) Shakura, N.I., & Sunyaev, R.A. 1973, A&A, 24, 337
- Stone et al. (1996) Stone, J. M., Hawley, J. F., Gammie, C. F., Balbus, S. A. 1996, ApJ, 463, 656
- Sunyaev & Shakura (1977) Sunyaev, R.A., & Shakura, N.I. 1977, Pisma Astron. Zh., 3, 262
- Tchekhovskoy et al. (2012) Tchekhovskoy, A., McKinney, J. C., Narayan, R. 2012, Journal of Physics: Conference Series, Volume 372, Issue 1, id. 012040
- Thorstensen et al. (1991) Thorstensen, J. R., Ringwald, F. A., Wade, R. A., Schmidt, G. D., Norsworthy, J. E. 1991, AJ, 102, 272 381
- Ustyugova et al. (2006) Ustyugova, G.V., Koldoba, A.V., Romanova, M.M., Lovelace, R.V.E. 2006, ApJ, 646, 304
- Ustyugova et al. (2000) Ustyugova, G.V., Lovelace, R.V.E., Romanova, M.M., Li, H., S.A. Colgate 2000, ApJ, 541, L21
- Wang & Robertson (1985) Wang, Y.-M.; Robertson, J. A. 1985, A&A, 151, 361
- Warner (1995) Warner, B. 1995, “Cataclysmic Variable Stars”. Cambridge Astrophysics Series, Cambridge, New York: Cambridge University Press
- Welsh et al. (1993) Welsh, W.F., Horne, K., and Gomer, R. 1993, ApJ, 410, L39
- Welsh et al. (1998) Welsh, W.F., Horne, K., and Gomer, R. 1998, MNRAS, 298, 285
- Wynn & King (1995) Wynn, G. A., & King, A. R., 1995, MNRAS, 275, 9
- Wynn et al. (1997) Wynn, G. A., King, A. R., & Horne, K. 1997, MNRAS, 286, 436
- Zamanov et al. (2012) Zamanov , R. K., Latev, G. Y., Stoyanov, K. A., Boeva, S., Spassov, B., Tsvetkova, S. V. 2012, Astronomische Nachrichten, Vol.333, Issue 8, p.736
Appendix A Description of Numerical Model
A.1 Initial and boundary conditions
The initial conditions are similar to those used in our previous work (Romanova et al., 2018), where the initial density and entropy distributions were calculated by balancing the gravitational, centrifugal and pressure forces. The disc is initially cold and dense, with temperature and density . The corona is hot and rarified, with temperature and density . In the beginning of the simulations, the inner edge of the disc is placed at = 10, and the star rotates with = 0.032 (corresponding to = 10), so that the magnetosphere and the inner disc initially corotate. This condition helps to ensure that the magnetosphere and the disc are initially in near-equilibrium at the disc-magnetosphere boundary. The star is gradually spun up from to the final state with angular velocity , which corresponds to .
Initially, the disc is threaded by the dipole magnetic field of the star. We also add a small “tapered” poloidal field inside the disc. This tapered field helps initialize the MRI in the disc and has the same polarity as the stellar field at the disc-magnetosphere boundary. To initialize the MRI, 5% velocity perturbations are added to inside the disc.
he boundary conditions are identical to those described by Lii et al. (2014).
A.2 Grid and code description
We use a Godunov-type code to solve the MHD equations in cylindrical coordinates (Koldoba et al., 2016). The axisymmetric grid is in cylindrical (, ) coordinates with mesh compression towards the equatorial plane and the -axis, so that there is a larger number of cells in the disc plane and near the star. In the models presented here, we use a non-uniform grid with grid cells, corresponding to a grid that is 36 by 66 stellar radii in size.
A.3 Reference values
We find the reference pressure from the relationship , where is the reference magnetic field ( is the magnetic field of the star and is the dimensionless magnetic moment of the star). The reference density is , and the reference temperature is , where is the Rydberg constant. Table 5 shows different reference values and their dependencies on and .
Using the main reference values, we can calculate the reference values for the fluxes: matter flux, , angular momentum flux, , and energy flux, . Taking into account the fact that , we obtain the reference fluxes in the following form:
| (14) |
| (15) |
| (16) |
| Parameters | Reference Values |
|---|---|
| [] | 0.8 |
| [cm] | |
| [km s-1] | |
| [s] | 11.26 |
| [G] | |
| [g cm-3] | |
| [1 cm-3] | |
| [K] | |
| [K] |