New places and phases of CO-poor/Ci-rich molecular gas in the Universe
Abstract
In this work we extend the work on the recently discovered role of Cosmic Rays (CRs) in regulating the average CO/ abundance ratio in molecular clouds (and thus their CO line visibility) in starburst galaxies, and find that it can lead to a CO-poor/Ci-rich gas phase even in environments with Galactic or in only modestly enhanced CR backgrounds expected in ordinary star-forming galaxies. Furthermore, the same CR-driven astro-chemistry raises the possibility of a widespread phase transition of molecular gas towards a CO-poor/Ci-rich phase in: a) molecular gas outflows found in star-forming galaxies, b) active galactic nuclei (AGNs), and c) near synchrotron-emitting radio jets and the radio-loud cores of powerful radio galaxies. For main sequence galaxies we find that CRs can render some of their molecular gas mass CO-invisible, compounding the effects of low metallicities. Imaging the two fine structure lines of atomic carbon with resolution high enough to search beyond the Ci/CO-bright line regions associated with central starbursts can reveal such a CO-poor/Ci-rich molecular gas phase, provided that relative brightness sensitivity levels of (Ci )/(CO )0.15 are reached. The capability to search for such gas in the Galaxy is now at hand with the new high-frequency survey telescope HEAT deployed in Antarctica and future ones to be deployed in Dome A. ALMA can search for such gas in star-forming spiral disks, galactic molecular gas outflows and the CR-intense galactic and circumgalactic gas-rich environments of radio-loud objects.
keywords:
(ISM:) cosmic rays, (ISM:) photodissociation regions (PDR), methods: numerical, astrochemistry, radiative transfer, galaxies: ISM1 Introduction
The utility of CO and its low- rotational transitions as effective tracers of gas mass is now well established observationally (e.g. Young & Scoville, 1991; Solomon et al., 1992, 1997) and theoretically (e.g. Dickman et al., 1986; Maloney & Black, 1988; Bryant & Scoville, 1996), provided: a) the so-called factor is used only for (so that its statistical notion remains valid) and b) the abundance ratio does not fall much below its average Galactic value of . The latter can happen in low-metallicity interstellar medium (ISM) with strong ambient far-ultraviolet (FUV) radiation fields (Bolatto et al., 1999; Pak et al., 1998), such as those expected in metal-poor dwarf galaxies, leaving large amounts of gas as CO-invisible (Madden et al., 1997; Shi et al., 2017). In the Milky Way and other ordinary spirals, this is expected also for molecular gas at large galactocentric distances where metallicity falls to and much of the gas can be rendered (CO line)-invisible by the FUV-induced destruction of CO (Papadopoulos et al., 2002; Wolfire et al., 2010).
It was only recently that Cosmic Rays (CRs) have been identified as a potentially more effective CO-destruction agent in molecular clouds compared to FUV photons (Bisbas et al., 2015, 2017; Bialy & Sternberg, 2015). Unlike the latter whose propagation (and thus CO-dissociation capability) is blunted by the strong dust absorption of FUV light taking place in the dust-rich Hi phase and in outer cloud envelopes, CR-induced chemistry destroys CO volumetrically throughout a molecular cloud irrespective of dust column. Other observational signatures of CR-controlled versus FUV-controlled chemistry of H2 clouds in galaxies, (even when CO remains abundant) have been discussed thoroughly in the literature (e.g. Papadopoulos, 2010; Meijerink et al., 2011), and will not concern us here. We should, nevertheless, mention that it is CRs that make the Ci distribution concomitant with that of CO in H2 gas clouds, rather existing only in a thin transition layer between Cii-rich outer and CO-rich inner H2 cloud regions (as the traditional PDR view would have it, e.g. Hollenbach & Tielens, 1999). This makes Ci lines equally good and more straightforward H2 gas mass tracers as low-J CO lines, even under conditions where CO remains abundant in H2 gas clouds.
A last theoretical effort to retain the PDR picture against the failure of its basic prediction of a Cii/Ci/CO stratification of species on the surface of FUV-illuminated H2 clouds was made by introducing density inhomogeneities on the classic PDR picture (Meixner & Tielens, 1993; Spaans & van Dishoeck, 1997). There, the Cii/Ci/CO species stratification remained but only on small H2 clumps while Ci appeared spatially extended deeper into FUV-illuminated CO-rich inhomogeneous H2 clouds. However, while CO-rich H2 clumps of low filling factor, each with a Ci “coating", could reproduce the astonishing spatial correspondence between Ci and 12CO, 13CO line emission observed in GMCs across a wide range of conditions, they could not account for the tight intensity correlation between 12CO, 13CO (1-0), (2-1) and Ci 1-0 line intensities, unless one postulates also a very standard H2 clump making up all H2 clouds, with characteristics that remain invariant across the wide range of ISM conditions (see Papadopoulos et al., 2004, for details). CRs are the simplest and most likely culprits in creating a volumetric rather than surface-like Ci distribution in H2 clouds, and therein lies the most notable difference between FUV-driven chemistry and gas thermal state, and a CR-driven one.
Another key difference between the two mechanisms besides their spatially distinct ways to destroy CO is that FUV-induced CO destruction leaves behind Ci and Cii, while CR-induced destruction yields mostly Ci, provided that , otherwise CO abundance increases via the OH channel (Bisbas et al., 2017). This makes CR-induced CO-poor gas more accessible to observations via the two fine structures of atomic carbon at rest frequencies 492 GHz (hereafter 1-0) and 809 GHz (hereafter 2-1) than FUV-irradiated clouds. These [Ci] lines can be observed over a large redshift range, starting from 0 to 5 for [Ci] 1-0, and from 0 to 8 for [Ci] 2-1, using ground-based telescopes, such as ALMA on the Atacama Desert Plateau, while the [Cii] fine structure line, even if typically much brighter than the [Ci] lines for warm gas, will be faint for cold gas (, while Cii92 K) away from star-forming (SF) sites. Moreover Cii has a rest frequency of 1900 GHz, making it accessible to ground-based observations only once , still extremely challenging until . This leaves most of the star-formation history of the Universe (and its gas-fueling) outside the reach of [Cii].
In this paper we study the effects of a CR-regulated [CO/Ci] average abundance in low-density molecular gas in the Galaxy, the outer regions of local spirals, and distant main sequence (MS) galaxies. We conclude this work by examining the possibility of CO-poor/Ci-rich molecular gas in the CR-intense environments of molecular gas outflows from starbursts, and the environments of radio-loud objects.
2 Low-density molecular gas in the Universe: the effects of CRs
The CR effects on the relatively low density molecular gas (50-500 ) have not been studied in detail, but early hints that CO can be effectively destroyed in such gas even at Galactic levels of CR energy densities exist (Bisbas et al., 2015). A low density molecular gas phase can be found in a variety of places in the Universe, the nearest ones being the envelopes of ordinary GMCs in the Galaxy. Should their CO-marker molecule be wiped out by CRs, it would leave the corresponding H2 gas mass CO-invisible, yielding a systematic underestimate of H2 gas mass even in places where CO was considered an effective tracer. This is of particular importance since a typical log-normal distribution of (H2)-() expected in turbulent GMCs would place most of their total mass at densities of (Padoan & Nordlund, 2002). Moreover, CRs can act on the chemistry of H2 gas as fast as the photon-driven processes driven by FUV radiation fields.
2.1 The Milky Way
Studies of the HiH2 phase transition in the metallicity and radiation environment of the Milky Way showed that it can commence from densities as low as 5–20 , depending on the formation rate on grains and ambient dust shielding (Papadopoulos et al., 2002), while for density enhancements reaching above 50 this transition is complete (Jura, 1975a; van Dishoeck & Black, 1986; Jura, 1975b; Shaya & Federman, 1987; Andersson & Wannier, 1993; Shull et al., 2000; Offner et al., 2013; Bialy et al., 2017). However CO (and HCN) multi- observations of Molecular Clouds (MCs) in the Galaxy, typically yield densities of 500– (Sakamoto et al., 1997; Heyer & Dame, 2015; Bialy & Sternberg, 2016). Thus, there is a significant range of gas densities 50–500 where Cold Neutral Medium (CNM) gas can be molecular but perhaps not (CO-line)-bright, reminiscent of the translucent clouds (van Dishoeck & Black, 1986).
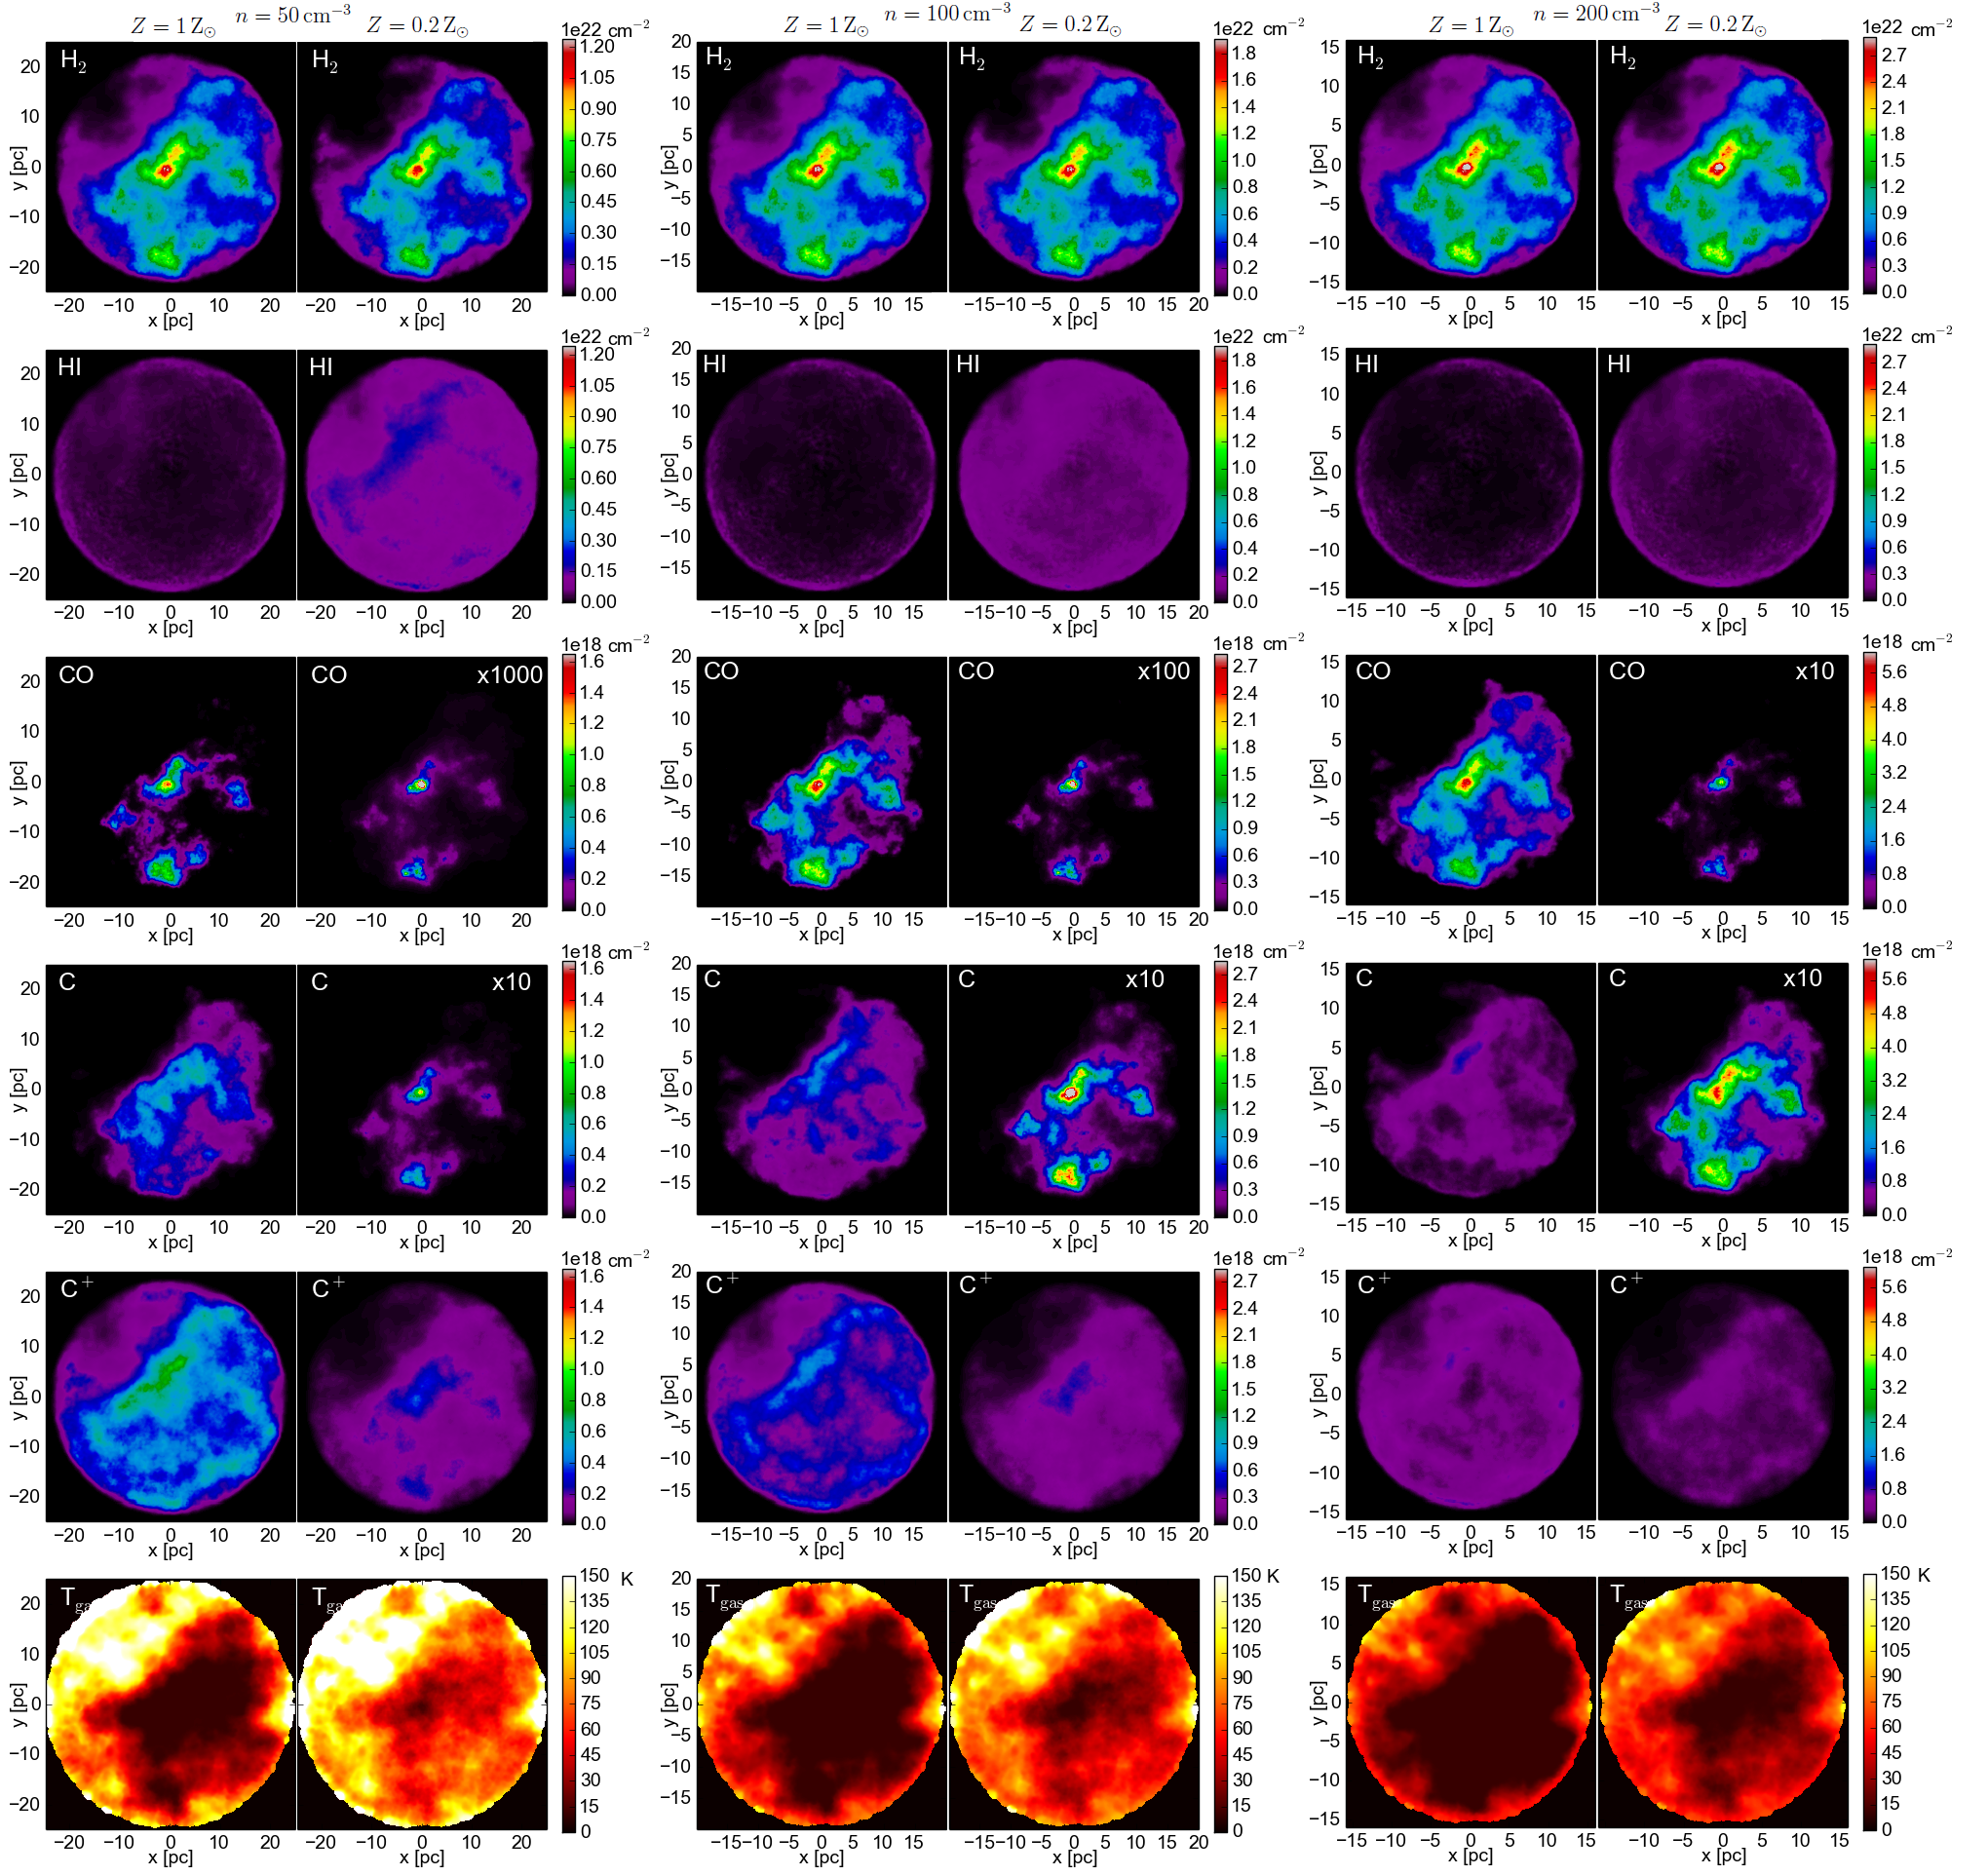
Figure 1 shows the column density maps of Hi, CO, Ci, Cii, and distributions within inhomogeneous low-density gas clouds using the fractal rendering and thermo-chemical calculations presented by Bisbas et al. (2017) and using the 3d-pdr code111https://uclchem.github.io/ (Bisbas et al., 2012), but now subjected only to Galactic levels of interstellar radiation field and CR energy density (i.e. , where and normalized according to Draine, 1978). The GMCs were constructed using the method described in Walch et al. (2015) for a fractal dimension of and assuming a mass of but with different radial extent corresponding to three average number densities i.e. . We find that the maximum visual extinction, , along the line-of-sight of these clouds is , respectively. These GMCs have much smaller average number densities than the GMC studied in Bisbas et al. (2017) (). Furthermore, our computations are made for metallicities of both and representing the ISM for inner and the outer parts of the Milky Way.
From the maps in Figure 1 it can be readily seen that for the gas can be rendered very CO-poor, even at Galactic levels of CR energy density, while for low metallicities this remains so up to (the highest average density in our computations). Atomic Carbon on the other hand remains abundant throughout the H2-rich parts of the cloud, except for the low-metallicity gas where its abundance drops, but nevertheless remains generally higher than that of CO. The cloud mass fractions for which the [CO]/[H2] abundance drops below (i.e. 10 times below the average [CO]/[H2] abundance in the Galaxy, making hard to use CO lines as gas mass tracers) are: 80%, 55%, 30% for , respectively, for , K222With a value of signifies self-gravitating clouds, see (Papadopoulos et al., 2014) for details and . For the metal-poor case, the CO-poor cloud mass fraction becomes .
Nevertheless, unlike in our past higher-density cloud models where most of Cii recombines into Ci (Bisbas et al., 2017), Cii now remains abundant for much of the mass of our low-density clouds (Figure 1). Furthermore, classical photolectric FUV heating, and the much lower average cooling of low density gas () allows the gas to maintain higher temperatures for , where the [Cii] fine structure line is expected to be luminous.
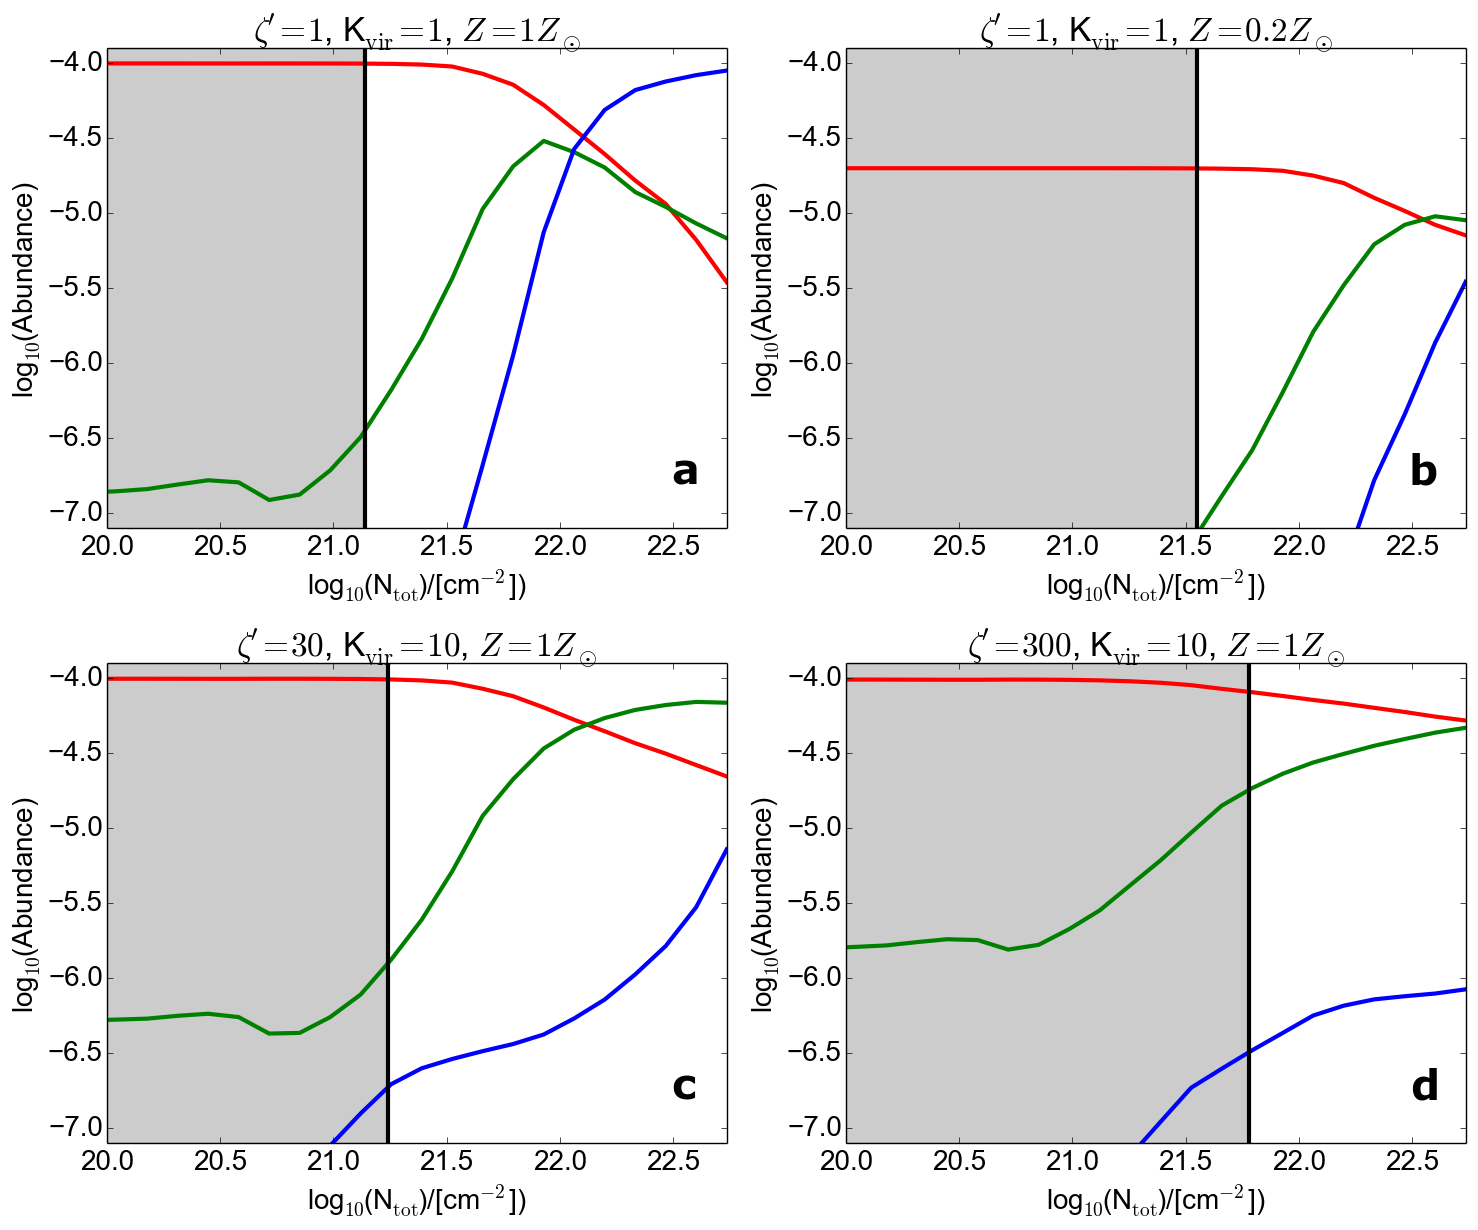
Figure 2 shows how the carbon cycle abundances change as a function of the total H column density for the four different ISM models. Here, we plot the average value of all three different clouds simultaneously. It can be seen that for the Galactic conditions (panel a), the molecular gas is CO-dominated for high column densities, as expected, while C remains abundant enough () as to continue serving as a capable gas tracer along with CO (e.g. Papadopoulos et al., 2004). However, the molecular gas phase switches to a Ci-dominated one in the lower-metallicity case (panel b) and for and case (panel c). For even higher , panel (d) shows a gas phase that becomes Cii-dominated even at higher column densities (i.e. ) more typical for inner regions of molecular clouds.
Thus it may well be that, besides FUV photons, CRs also contribute in the making of (Cii-line)-bright gas envelopes of (CO line)-invisible gas found around (CO line)-marked GMCs in the Galaxy (e.g., Pineda et al., 2013; Langer et al., 2014). Then these envelopes can be bright in both Cii and Ci lines, a possibility that should be investigated by sensitively imaging the latter in the Cii-bright envelope regions of GMCs in the metal-rich inner parts of the Galaxy. The conditions for a widespread phase transition of gas from a CO-rich to a CO-poor/CI-rich phase can exist also for outer Galactic regions. Indeed as the star formation rate density becomes lower in the outer Galaxy, along with the intervening interstellar absorption, they reduce the average FUV radiation field at large Galactocentric distances. CRs however can stream further out in the disk, and keep Ci abundant in low-density molecular clouds.
There is already evidence for CO-poor gas in the Galaxy at large galactocentric radii from studies of otherwise CO-bright clouds selected in the Goddard-Columbia 12CO survey. In these places an factor systematically larger by a factor of with respect to its standard value at the inner Galaxy is found (Sodroski, 1991). Other work using also CO-marked clouds finds that the diffuse H2 clouds contain increasingly more mass at larger Galactocentric radii (Roman-Duval et al., 2016). These are the type of clouds that could contain a significant CI-rich/CO-poor phase according to our current study. Perhaps more significantly, the only search for the so so-called CO-dark gas in our Galaxy which is not using CO-selected clouds but dust extinction maps instead indicates that up to 55% of the gas at large Galactocentric radii may be CO-dark (Chen et al., 2015). The same study finds that in certain regions the inferred CO-dark gas mass can reach up to four times the CO-luminous one.
We must note here that all our current arguments about CO-poor/CI-rich gas, as well as those that follow in the next sections, are phase-transition type of arguments. By this we mean that we are simply investigating the ISM conditions controlling the phase transition from a typically CO-rich to a CO-poor (and CI-rich) gas phase (with emphasis on the role of CRs, gas density, and metallicity), and the places where the conditions for such a phase transition can be fullfiled. In order to find how much mass is actually in such a gas phase, observations are indispensible. To this purpose we conclude this section by urging sensitive imaging of the two Ci lines for the molecular gas in the Galaxy, and especially of its CO-poor yet CII-luminous phase.
2.1.1 The promise of ground-based high-frequency single dish telescope surveys
The High Elevation Antarctic Terahertz Telescope (HEAT), with a diameter of 60 cm, is a new high-frequency telescope now operating at Ridge A of the Antarctic plateau, with capabilities to observe both [Ci] lines333http://soral.as.arizona.edu/HEAT/instrument/. Its wide beam of at 492 GHz ([Ci] 1-0) and at 809 GHz ([Ci] 2-1) makes it appropriate for searching for low-brightness temperature (Tb) Ci-rich molecular clouds in the Galaxy, where ([Ci] 1-0)/(CO 1-0) (hereafter (Ci)/(CO)) drops to in SF-quiescent regions (Papadopoulos et al., 2004, and references therein). An inventory of molecular gas in the Galaxy obtained using both [Ci] lines and its comparison to the CO-rich and Cii-rich gas can reveal whether a low-density Ci-rich/CO-poor gas phase exists in the Milky Way, its spatial distribution, and temperature.
Other single dish submm telescopes from excellent sites at the Atacama Plateau in North Chile (APEX, NANTEN-2, ASTE) can be used to sensitively map Ci (1-0) and/or (2-1) in a more targeted fashion e.g. along a continuous strip starting from the inner parts of a given Galactic molecular cloud and continuing well beyond its (CO/CI-line)-luminous regions, searching for Ci-rich/CO-poor envelopes. The upcoming 5-m Dome A Terahertz Explorer (DATE5 Yang et al., 2013) in Dome-A of the Antarctic plateau will be able to perform a systematic survey across the Galactic plane with both good angular resolution and sensitivity, given its excellent condition for high-frequency observations(Shi et al., 2016). In Figure 3, we show (Ci)/(CO) ratio maps for our low-density (50 ) inhomogeneous cloud model. These could be used to guide such an observational campaign in the Galaxy indicating the necessary CI/CO line relative brightness sensitivity levels.
2.2 Molecular gas outflows from galaxies
The discovery of strong H2 outflows from galaxies, induced by AGN and/or starburst activity (Feruglio et al., 2010; Cicone et al., 2012, 2014; Dasyra & Combes, 2012), shows that large amounts of molecular gas can be expelled from galaxies. It followed much earlier discoveries of huge cm-emitting synchrotron haloes around starburst galaxies (e.g. Seaquist & Odegard, 1991; Colbert et al., 1996), indicating CRs outflows swept out from the star-formation (SF) galaxy at bulk speeds km s-1. This could have significant effects since powerful molecular outflows are often discovered in those same starbursts where extended synchrotron haloes are found (e.g. Salak et al., 2013). Thus, the CO-destroying CRs could be swept along the molecular gas outflow itself. Moreover, by exerting large pressures on the molecular gas of starburst galaxies (even small gas ionization fractions can allow CR-gas coupling and momentum transfer from CRs to gas), CRs could even be driving these fast molecular outflows (Hanasz et al., 2013; Girichidis et al., 2016).
Low-density and gravitationally unbound molecular gas is to be expected in such galactic outflows, a result of Kelvin-Helmholtz instabilities and shear acting on the envelopes of denser clouds in the outflow. Such a gas phase could carry a significant mass fraction of the outflow, while remaining CO-invisible, because of large scale CO destruction induced by the CRs carried within the same outflow. Large masses of low-density molecular gas could be present in galactic molecular gas outflows given the trend of progressively larger amounts of molecular gas mass discovered in them, the lower the critical density of the line tracer used to reveal them is (Cicone et al., 2012). A CR-irradiation of the outflowing molecular gas by the relativistic plasma carried along with it thus points to the possibility of CO-poor/Ci-rich molecular gas in powerful galactic outflows.
Using the magnetic field value found for the outflow in M 82 of G (Adebahr et al., 2013), and the equipartition assumption between magnetic field and CR energy densities, yields a CR energy density boost expected in such an outflow of (for G). Stronger magnetic fields of m have been found in extended synchrotron haloes around galaxies (Laine & Beck, 2008), corresponding to for any concomitant gas phase outflowing along with the CRs. For our computations, we adopt and corresponding to strongly unbound gas states expected in such galactic outflows.
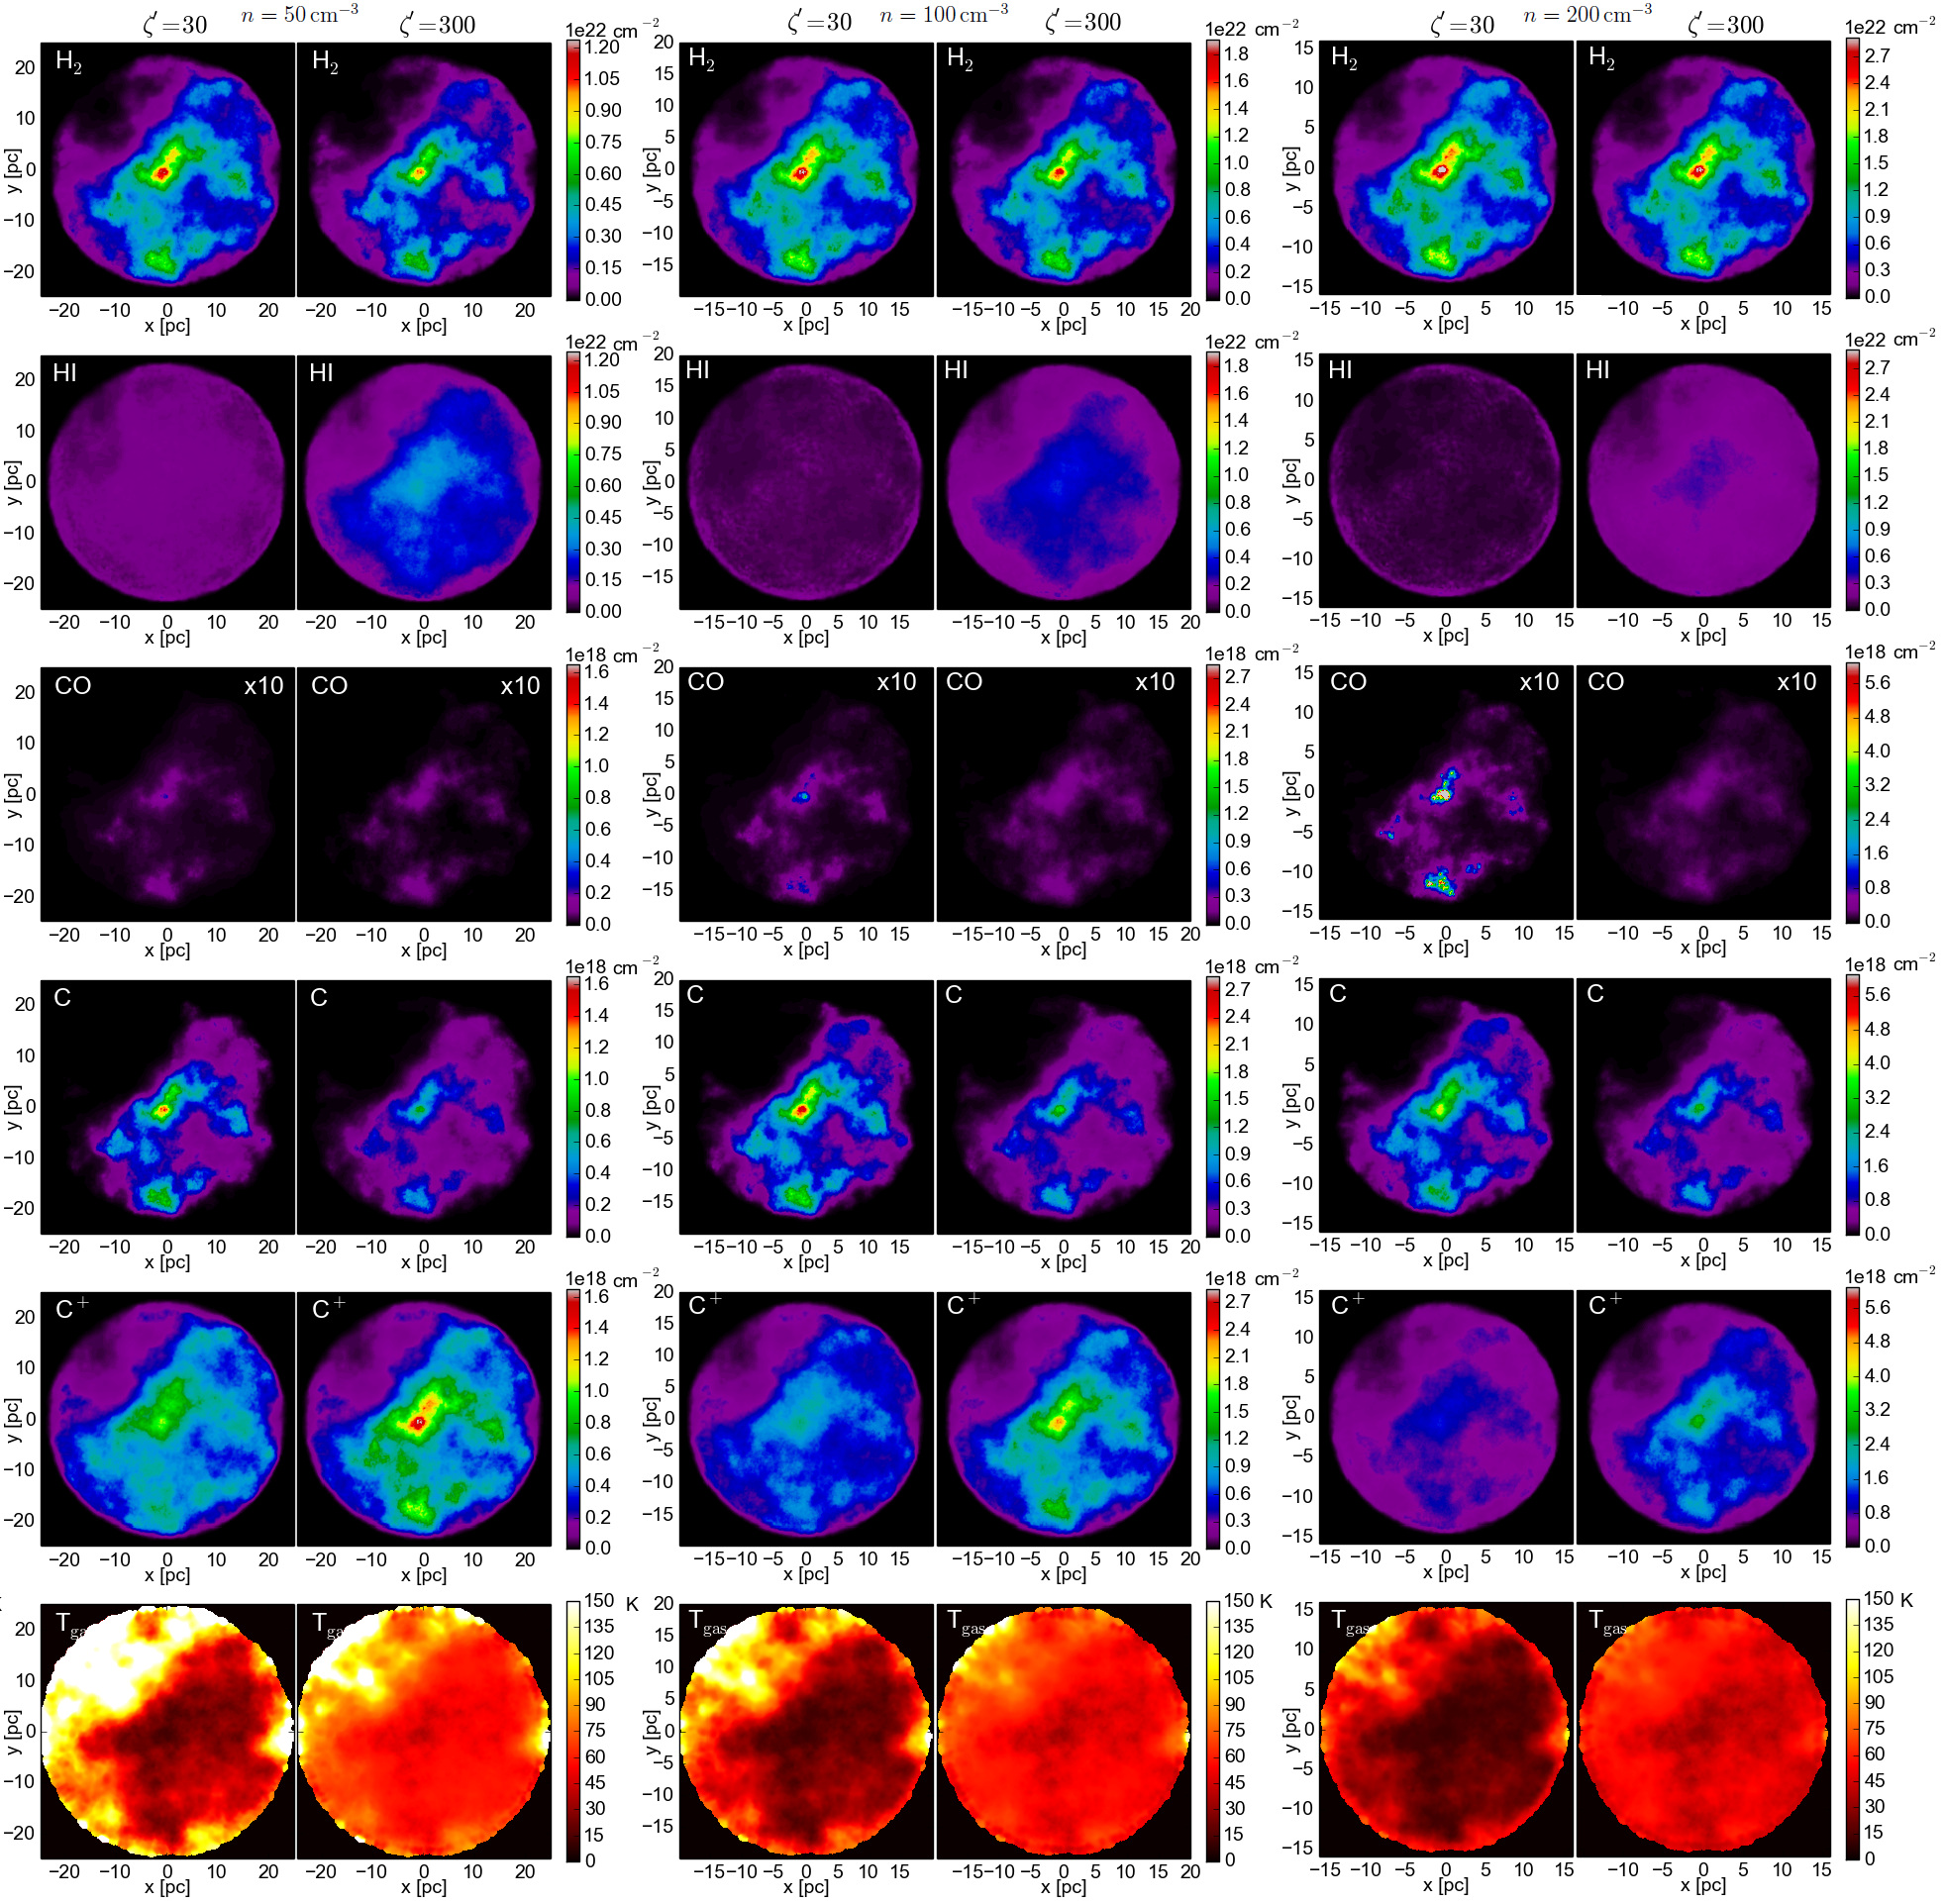
Our results are shown in Figure 4, from where it can be seen that CO is destroyed very effectively over the whole density range we consider in this work, while Ci remains abundant. Thus sensitive Ci 1-0, 2-1 imaging observations of galactic gas outflows could reveal significantly more gas mass than CO lines currently find. Cii also remains abundant but starts strongly recombining to Ci at the high density end of , as expected from our previous work (Bisbas et al., 2017).
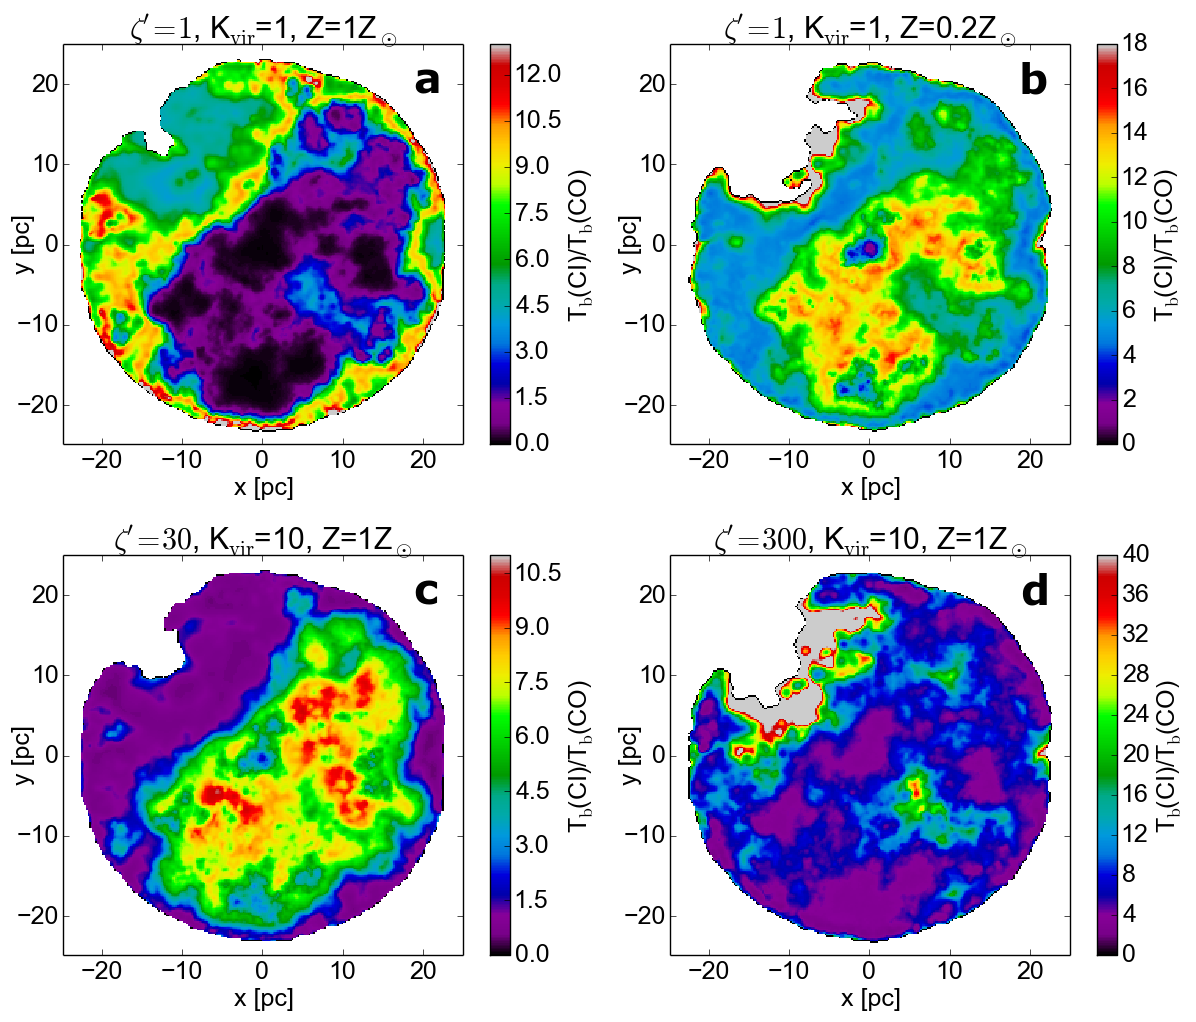
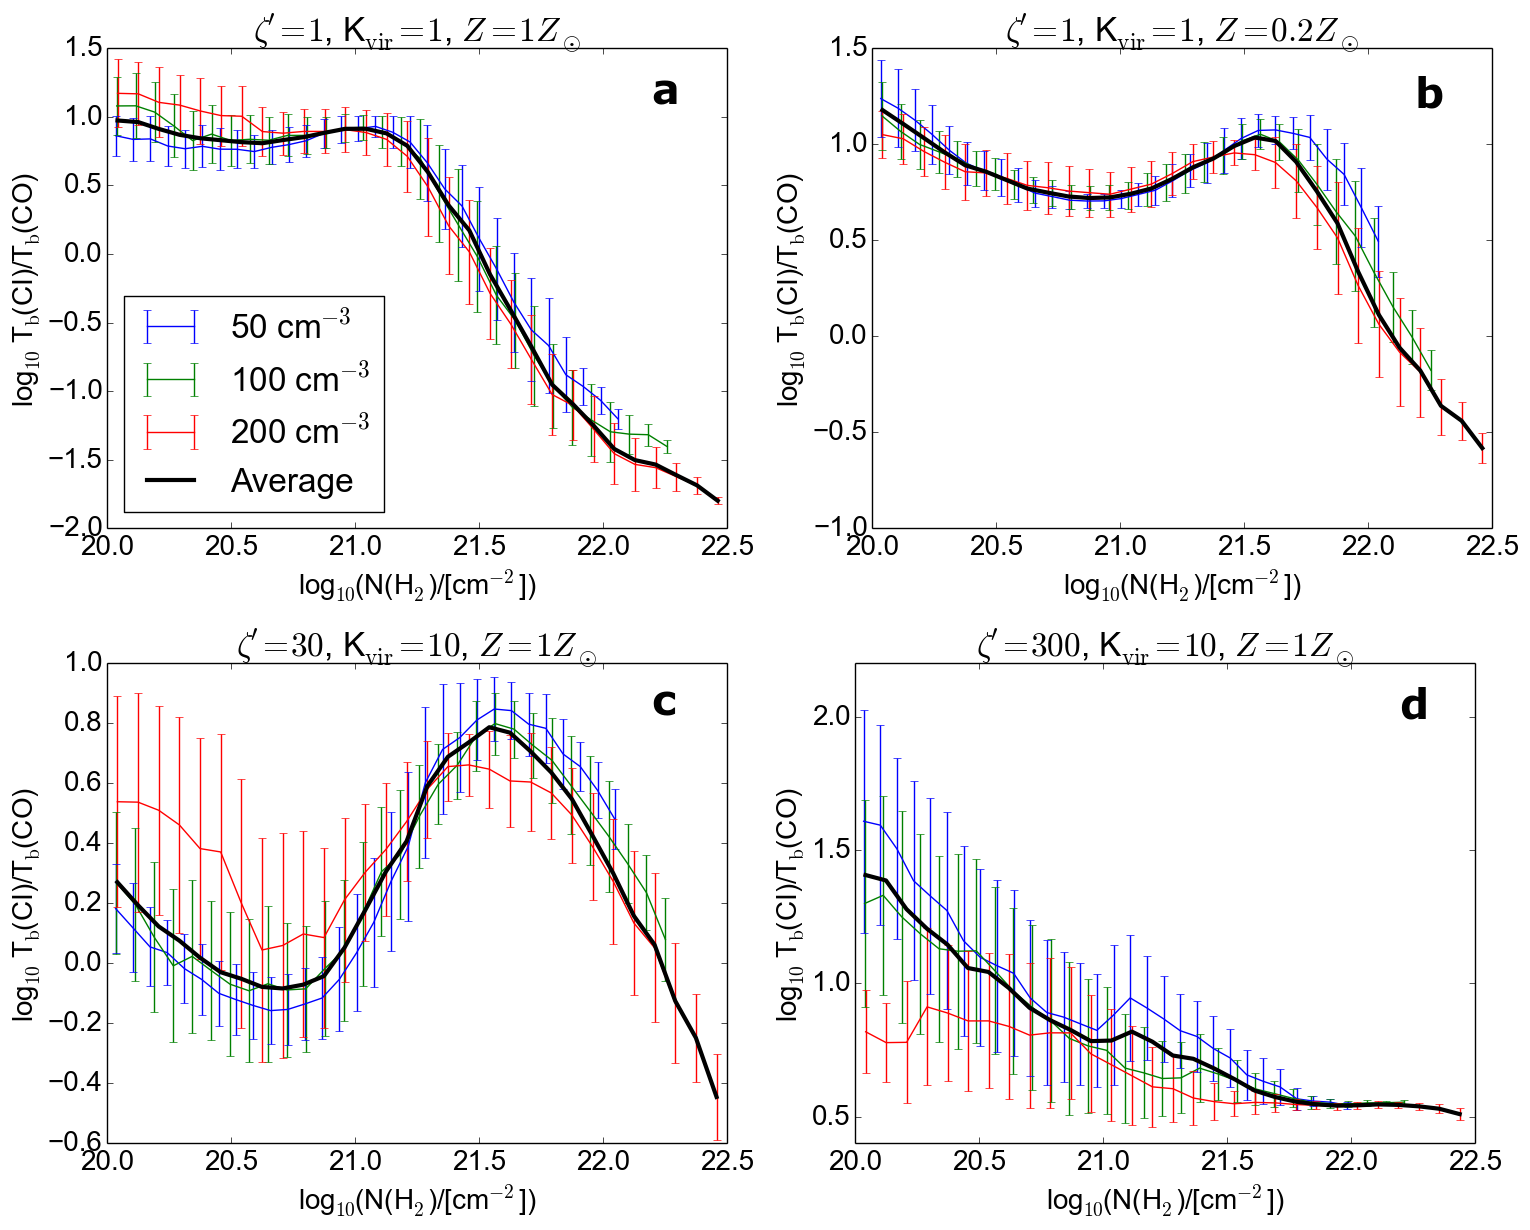
In Figure 5, we correlate the H2 column density with the Tb(Ci)/Tb(CO) brightness ratio for the four different ISM environments we considered. As expected, high H2 column densities (i.e. ) correspond to a small Tb(Ci)/Tb(CO) brightness ratio, implying that CO (1-0) is brighter than Ci (1-0). From Figures 1 and 4, it can be seen that low (H2) corresponds to gas temperatures that may exceed , particularly when the CR ionization rate is elevated (i.e. ). This may result in a local formation of CO via the OH channel (see Bisbas et al., 2017, for further details), which then increases Tb(CO) and decreases Tb(Ci). This in turn, lowers their brightness ratio that we examine, resulting in a local minimum at (H2) where FUV radiation is also important, as it can be seen from panels b and c of Figure 5. For still higher CR energy densities (i.e. ), all simulated GMCs become brighter in Ci (1-0) than in CO (1-0).
3 Radio galaxies: Molecular gas and AGN-injected Cosmic rays
The powerful jets of radio galaxies can carry CRs to great distances outside the galaxy where the radio-loud AGN resides, with the CRs also diffusing around the immediate confines of the jet to form magnetized bubbles (Guo & Mathews, 2012). It is possible that such powerful jets can also entrain molecular gas from the ambient ISM and drive molecular gas outflows, an effect already shown in the low-powered jets found in AGN-harbouring spirals like NGC 1068 (Lamastra et al., 2016), and NGC 4258 (Krause et al., 2007). This is not so difficult to imagine, given that such jets are often launched from within gas-rich galaxies where the radio-loud AGN resides. Moreover, the heavily flared star-forming gas disks expected around AGN (Wada et al., 2009) can act as a constant source of molecular gas to be entrained by jets ‘firing’ from the AGN, given that the spins of disk and BH rotation will not necessarily be aligned.
The interaction of cold gas with radio jets has already been studied theoretically and invoked to explain the Hi outflows found in some powerful radio galaxies (Morganti et al., 2005; Krause, 2007), which have been since augmented by fast molecular gas outflows observed via the traditional method of CO lines (Morganti et al., 2015, 2016). Finally, significant amounts of molecular gas, the fuel of SF, driven out of radio-galaxies via jet-powered outflows provides a natural explanation for the so-called ‘alignment effect’ observed in many gas-rich high-redshift radio-galaxies (e.g. McCarthy et al., 1987; Pentericci et al., 2001).
Should molecular gas be ‘caught’ in a radio-jet driven outflow, it will be subjected to its withering CR-intense environment, which could quickly render it CO-poor/invisible. Moreover, a great deal of low-density gas (i.e. the phase where CR-induced and far-UV induced CO destruction are most effective), is to be expected in such environments for the same reasons mentioned in §2.2 (to which perhaps MHD-driven shear should also be added).
Magnetic fields in radio-jets can be strong with G (Stawarz et al., 2005; Ostrowski, 1998). Assuming equipartition between CR and magnetic field energy, yields CR energy densities within radio-jet environments of . Thus, the CR energy density boost expected within jets and the areas near them approaches those expected in vigorously SF galaxies, even as the source of CRs is different. In Figure 4, we show images of the relative Hi, , CO, Ci and Cii distributions for low-density clouds subjected to CR-irradiation environments of , and in a strongly unbound state (), that are plausible for gas found in radio-jets and radio-loud AGNs. CO is very effectively destroyed while both Ci and Cii remain abundant for such molecular gas (see Fig. 5d).
Nearby radio galaxies, such as Cen A and Minkowski’s object, are excellent targets for detecting CO-poor/Ci-rich molecular gas in jets and their vicinity. In Cen A, such gas may have already been detected, even if its bright Ci emission has been attributed to PDRs rather than CRDRs (Israel et al., 2017)444Relative molecular line ratios can always be fitted with PDRs (e.g. van der Werf et al., 2010), yet the decisive test whether PDRs or CRDRs/XDRs are responsible for any observed extragalactic lines must use the relative gas mass fractions of warm/dense gas and warm dust (see Bradford et al., 2003; Papadopoulos et al., 2014; van der Werf et al., 2010). No such tests have been done for the Ci-bright molecular gas in Cen A.
In the case of Minkowski’s object, sensitive CO observations detected only a small CO-marked gas reservoir fueling the star formation observed along its jet, making this object an outlier of the Schmidt-Kennicutt (S-K) relation (Salomé et al., 2015; Lacy et al., 2017). Sensitive [Ci] (1-0) imaging of this galaxy is particularly promising for detecting molecular gas that may have been rendered CO-invisible by the high expected in its radio jet. Similar observations of radio galaxies at high redshifts are even more promising, because in the early Universe these galaxies reside in very H2-rich hosts with plenty of gas to be entrained/impacted by their powerful jets. Finally, [Ci] (1-0) and even (2-1) line imaging observations can be conducted in the distant Universe with modest since their frequencies will be redshifted to more transparent parts of the Earth’s atmosphere.
4 Main Sequence galaxies: CRs and low-metallicity gas
A mostly CR-regulated average [CO]/[H2] abundance in the ISM of Main Sequence galaxies and the possibility of large fractions of their molecular gas mass having their CO destroyed (with adverse effects on the calibration attempts of their XCO-factor (e.g. Genzel et al., 2012; Carleton et al., 2017)) have been described by Bisbas et al. (2015, 2017). Our current models of lower density gas clouds, reinforce this view by demonstrating that the conditions for a phase transition towards very CO-poor gas remain favorable for low densities even for Galactic or only modestly elevated levels of CR energy densities. For low-metallicity gas, the effects of CO destruction are dramatic (Figure 1), and could explain the lack of total CO emission seen in some metal-poor MS galaxies (Genzel et al., 2012). Such CO-dark molecular gas may also exist in the outer regions of MS galaxies, which otherwise show CO-bright and metal-rich molecular gas in their inner SF regions.
One may ask whether significant amounts of lower-density molecular gas can indeed exist in such vigorously SF disks. Given that star formation is a low-efficiency process, both on the mass scale of individual molecular clouds and that of galaxy-sized reservoirs, we can expect that large amounts of non-SF molecular gas will always be present in SF galaxies, either in their disk, or expelled out by SF feedback (e.g. the massive non-SF gas reservoir in the outer regions of M 82). With CRs able to ‘leak’ out of the SF areas along molecular gas outflows and beyond the SF disk, they can subject non-SF low density gas to significant levels of CR irradiation, destroying its CO and replacing with Ci and Cii. Sensitive Ci line imaging of such systems can show whether this is so. Nevertheless at redshifts of , Cii line imaging will be the most effective in revealing such gas.
4.1 Ci line imaging and a critical brightness limit
There are now several PdBI and ALMA Ci (1-0), (2-1) line observations of galaxies in the distant Universe (Walter et al., 2011; Zhang et al., 2014; Gullberg et al., 2016; Popping et al., 2017; Bothwell et al., 2017; Emonts, 2017) as well as local ones using Herschel (Jiao et al., 2017). In all cases, the galaxies are either unresolved or only marginally resolved in [Ci] line emission. Such observations do not yet allow a detailed study of relative distributions of Ci vs CO 1-0 emission in galaxies, since unresolved or marginally resolved emission will always be dominated by the warm and dense star-forming gas (where both CO and Ci are abundant). However, Krips et al. (2016) recently provided a 3′′ resolution of CO(1-0) and [Ci] (1-0) for the SF galaxy NGC 253. Intriguingly, recent high-resolution ALMA imaging of [Ci] (1-0) lines in a local LIRG shows significant differences between the CO and Ci-bright gas distribution (Zhang et al. in prep.).
High-resolution imaging of CO and [Ci] (1-0), (2-1) lines of local LIRGS is necessary to compare their emission distribution in detail and deduce the corresponding mass distributions. The resolution however must be high enough to separate the more compact SF molecular gas distributions from the more extended SF-quiescent, and perhaps lower density gas reservoirs. The strongest requirement for such imaging is then placed by the conditions in latter where observations yield brightness temperature ratios Tb(Ci)/Tb(CO) (Papadopoulos et al., 2004, and references therein). From Figure 5 we can see that a Ci/CO (J=1-0) relative brightness cutoff of Tb(Ci)/Tb(CO) is adequate to encompass all the gas in the clouds, irrespective of its thermal/chemical state and their intrinsic average [CO]/[Ci] ratio. Predictably, it is the denser/colder inner regions of our low density cloud models (and where the average (H2) is the highest), where this ratio drops to its lowest values, as is indeed found by simulations and observations of cold/low-density non-SF molecular cloud regions in the Galaxy Papadopoulos et al. (2004); Offner et al. (2014); Lo et al. (2014); Glover & Clark (2016).
It is perhaps more beneficial to conduct such high brightness sensitivity Ci (and CO) line imaging for SF disks in the more distant Universe (e.g in the disks of MS and submm galaxies, radio galaxy environments) as to take advantage of the lower ALMA values for the Ci redshifted frequencies. Even at , the Ci (1-0) frequency already shifts to GHz, where the atmosphere becomes much more transparent and detectors less noisy. Furthermore, it is during earlier cosmic epochs (and thus distances) when galaxies become more -rich, while the CRs generated by their elevated SFR can induce large scale CO destruction leaving behind Ci-rich gas.
5 Conclusions
The astrochemistry that demonstrated the critical role of CRs in regulating the average abundance for the bulk of the molecular gas in SF galaxies (except in localised surface PDRs near O,B stars) indicates that CO-poor/Ci-rich can exist not only in the highly CR-irradiated ISM environments of starbursts but also in environments with much lower levels of CR-irradiation, if the average molecular gas density is low. A low-density molecular gas phase with CR irradiation levels high enough to render it very CO-poor and Ci/Cii-rich can be found in a number of places in the Universe, namely:
-
•
Low-density envelopes around the CO-rich parts of ordinary molecular clouds in the Milky Way,
-
•
Molecular gas outflows from galaxies, induced by starburst and/or AGNs,
-
•
In main sequence galaxies both in their metal-rich and metal-poor regions (in the latter ones CR and far-UV irradiation penetrate deep in destroying the CO tracer molecule).
-
•
In regions inside and around radio-jets and perhaps even near the cores of powerful radio galaxies.
Sensitive Ci line observations of such environments can perhaps find more molecular gas mass than the standard low-J CO line observations, provided a relative brightness temperature ratio of Tb(Ci)/Tb(CO) (for ) is reached in well-resolved images. GMCs in the Galaxy, distant Main Sequence and submm galaxies, as well as areas around radio galaxies and their jets are all excellent targets for this kind of imaging. In the later case, Minkowski’s object as well as Cygnus A are some of the most prominent radio-loud objects for such observations in the local Universe.
Acknowledgements
The authors thank Ewine van Dishoeck for the useful comments and discussion on several aspects of this work. PPP would like to thank Ocean Divers at Sithonia, Halkidiki, Christos Douros and Sokratis Vagiannis for providing a most useful distraction during the last stages of this project. Z-Y.Z. and PPP acknowledge support from ERC in the form of the Advanced Investigator Programme, 321302, COSMICISM.
References
- Ackermann et al. (2012) Ackermann, M., Ajello, M., Atwood, W. B., et al. 2012, ApJ, 750, 3
- Adebahr et al. (2013) Adebahr, B., Krause, M., Klein, U., et al. 2013, A&A, 555, A23
- Andersson & Wannier (1993) Andersson, B.-G., & Wannier, P. G. 1993, ApJ, 402, 585
- Bialy & Sternberg (2015) Bialy, S., & Sternberg, A. 2015, MNRAS, 450, 4424
- Bialy & Sternberg (2016) Bialy, S., & Sternberg, A. 2016, ApJ, 822, 83
- Bialy et al. (2017) Bialy, S., Burkhart, B., & Sternberg, A. 2017, ApJ, 843, 92
- Bisbas et al. (2012) Bisbas, T. G., Bell, T. A., Viti, S., Yates, J., & Barlow, M. J. 2012, MNRAS, 427, 2100
- Bisbas et al. (2015) Bisbas, T. G., Papadopoulos, P. P., & Viti, S. 2015, ApJ, 803, 37
- Bisbas et al. (2017) Bisbas, T. G., van Dishoeck, E. F., Papadopoulos, P. P., et al. 2017, ApJ, 839, 90
- Bolatto et al. (1999) Bolatto, A. D., Jackson, J. M., & Ingalls, J. G. 1999, ApJ, 513, 275
- Bolatto et al. (2013) Bolatto, A. D., Wolfire, M., & Leroy, A. K. 2013, ARA&A, 51, 207
- Bothwell et al. (2017) Bothwell, M. S., Aguirre, J. E., Aravena, M., et al. 2017, MNRAS, 466, 2825
- Bradford et al. (2003) Bradford, C. M., Nikola, T., Stacey, G. J., et al. 2003, ApJ, 586, 891
- Bryant & Scoville (1996) Bryant, P. M., & Scoville, N. Z. 1996, ApJ, 457, 678
- Dasyra & Combes (2012) Dasyra, K. M., & Combes, F. 2012, A&A, 541, L7
- Dickman et al. (1986) Dickman, R. L., Snell, R. L., & Schloerb, F. P. 1986, ApJ, 309, 326
- Carleton et al. (2017) Carleton, T., Cooper, M. C., Bolatto, A. D., et al. 2017, MNRAS, 467, 4886
- Chen et al. (2015) Chen, B.-Q., Liu, X.-W., Yuan, H.-B., Huang, Y., & Xiang, M.-S. 2015, MNRAS, 448, 2187
- Cicone et al. (2012) Cicone, C., Feruglio, C., Maiolino, R., et al. 2012, A&A, 543, A99
- Cicone et al. (2014) Cicone, C., Maiolino, R., Sturm, E., et al. 2014, A&A, 562, A21
- Colbert et al. (1996) Colbert, E. J. M., Baum, S. A., Gallimore, J. F., et al. 1996, ApJS, 105, 75
- Draine (1978) Draine, B. T. 1978, ApJS, 36, 595
- Emonts (2017) Emonts, B. 2017, Formation and Evolution of Galaxy Outskirts, 321, 348
- Feruglio et al. (2010) Feruglio, C., Maiolino, R., Piconcelli, E., et al. 2010, A&A, 518, L155
- Genzel et al. (2012) Genzel, R., Tacconi, L. J., Combes, F., et al. 2012, ApJ, 746, 69
- Girichidis et al. (2016) Girichidis, P., Naab, T., Walch, S., et al. 2016, ApJ, 816, L19
- Glover & Clark (2016) Glover, S. C. O., & Clark, P. C. 2016, MNRAS, 456, 3596
- Gullberg et al. (2016) Gullberg, B., Lehnert, M. D., De Breuck, C., et al. 2016, A&A, 591, A73
- Guo & Mathews (2012) Guo, F., & Mathews, W. G. 2012, ApJ, 756, 181
- Hanasz et al. (2013) Hanasz, M., Lesch, H., Naab, T., et al. 2013, ApJ, 777, L38
- Heyer & Dame (2015) Heyer, M., & Dame, T. M. 2015, ARA&A, 53, 583
- Hollenbach & Tielens (1999) Hollenbach, D. J., & Tielens, A. G. G. M. 1999, Reviews of Modern Physics, 71, 173
- Israel et al. (2017) Israel, F. P., Güsten, R., Meijerink, R., Requena-Torres, M. A., & Stutzki, J. 2017, A&A, 599, A53
- Jiao et al. (2017) Jiao, Q., Zhao, Y., Zhu, M., et al. 2017, ApJ, 840, L18
- Jura (1975a) Jura, M. 1975a, ApJ, 197, 575
- Jura (1975b) Jura, M. 1975b, ApJ, 197, 581
- Krause (2007) Krause, M. 2007, New Astron. Rev., 51, 174
- Krause et al. (2007) Krause, M., Fendt, C., & Neininger, N. 2007, A&A, 467, 1037
- Krips et al. (2016) Krips, M., Martín, S., Sakamoto, K., et al. 2016, A&A, 592, L3
- Lacy et al. (2017) Lacy, M, Croft, S., Fragile, C., Wood, S., Nyland, K. 2017, ApJ, 838, 146
- Laine & Beck (2008) Laine, S., & Beck, R. 2008, ApJ, 673, 128-142
- Lamastra et al. (2016) Lamastra, A., Fiore, F., Guetta, D., et al. 2016, A&A, 596, A68
- Langer et al. (2014) Langer, W. D., Velusamy, T., Pineda, J. L., Willacy, K., & Goldsmith, P. F. 2014, A&A, 561, A122
- Lo et al. (2014) Lo, N., Cunningham, M. R., Jones, P. A., et al. 2014, ApJ, 797, L17
- Madden et al. (1997) Madden, S. C., Poglitsch, A., Geis, N., Stacey, G. J., & Townes, C. H. 1997, ApJ, 483, 200
- Maloney & Black (1988) Maloney, P., & Black, J. H. 1988, ApJ, 325, 389
- McCarthy et al. (1987) McCarthy, P. J., van Breugel, W., Spinrad, H., & Djorgovski, S. 1987, ApJ, 321, L29
- Meijerink et al. (2011) Meijerink, R., Spaans, M., Loenen, A. F., & van der Werf, P. P. 2011, A&A, 525, A119
- Meixner & Tielens (1993) Meixner, M., & Tielens, A. G. G. M. 1993, ApJ, 405, 216
- Morganti et al. (2005) Morganti, R., Tadhunter, C. N., & Oosterloo, T. A. 2005, A&A, 444, L9
- Morganti et al. (2015) Morganti, R., Oosterloo, T., Oonk, J. B. R., Frieswijk, W., & Tadhunter, C. 2015, A&A, 580, A1
- Morganti et al. (2016) Morganti, R., Oosterloo, T., Oonk, J. B. R., Santoro, F., & Tadhunter, C. 2016, A&A, 592, L9
- Offner et al. (2013) Offner, S. S. R., Bisbas, T. G., Viti, S., & Bell, T. A. 2013, ApJ, 770, 49
- Offner et al. (2014) Offner, S. S. R., Bisbas, T. G., Bell, T. A., & Viti, S. 2014, MNRAS, 440, L81
- Ostrowski (1998) Ostrowski, M. 1998, A&A, 335, 134
- Padoan & Nordlund (2002) Padoan, P., & Nordlund, Å. 2002, ApJ, 576, 870
- Pak et al. (1998) Pak, S., Jaffe, D. T., van Dishoeck, E. F., Johansson, L. E. B., & Booth, R. S. 1998, ApJ, 498, 735
- Papadopoulos et al. (2002) Papadopoulos, P. P., Thi, W.-F., & Viti, S. 2002, ApJ, 579, 270
- Papadopoulos et al. (2004) Papadopoulos, P. P., Thi, W.-F., & Viti, S. 2004, MNRAS, 351, 147
- Papadopoulos (2010) Papadopoulos, P. P. 2010, ApJ, 720, 226
- Papadopoulos et al. (2012) Papadopoulos, P. P., van der Werf, P. P., Xilouris, E. M., et al. 2012, MNRAS, 426, 2601
- Papadopoulos et al. (2014) Papadopoulos, P. P., Zhang, Z.-Y., Xilouris, E. M., et al. 2014, ApJ, 788, 153
- Pentericci et al. (2001) Pentericci, L., McCarthy, P. J., Röttgering, H. J. A., et al. 2001, ApJS, 135, 63
- Pineda et al. (2013) Pineda, J. L., Langer, W. D., Velusamy, T., & Goldsmith, P. F. 2013, A&A, 554, A103
- Popping et al. (2017) Popping, G., Decarli, R., Man, A. W. S., et al. 2017, A&A, 602, A11
- Remy et al. (2017) Remy, Q., Grenier, I. A., Marshall, D. J., & Casandjian, J. M. 2017, A&A, 601, A78
- Roman-Duval et al. (2016) Roman-Duval, J., Heyer, M., Brunt, C. M., et al. 2016, ApJ, 818, 144
- Sakamoto et al. (1997) Sakamoto, S., Hasegawa, T., Handa, T., Hayashi, M., & Oka, T. 1997, ApJ, 486, 276
- Salak et al. (2013) Salak, D., Nakai, N., Miyamoto, Y., Yamauchi, A., & Tsuru, T. G. 2013, PASJ, 65, 66
- Salomé et al. (2015) Salomé, Q., Salomé, P., & Combes, F. 2015, A&A, 574, A34
- Sandstrom et al. (2013) Sandstrom, K. M., Leroy, A. K., Walter, F., et al. 2013, ApJ, 777, 5
- Seaquist & Odegard (1991) Seaquist, E. R., & Odegard, N. 1991, ApJ, 369, 320
- Shi et al. (2017) Shi, Y., Wang, J., Zhang, Z.-Y., Gao, Y., Hao, C.-N., Xia, X.-Y., Gu, Q. 2017, NatCo, 713789
- Shi et al. (2016) Shi, S.-C.., Paine, S., Yao, Q.-J. Lin, Z.-H., Duan, W.-Y., Matsou, H., Zhang Q., Yang, J., Ashley, M.C.B., Shang Z., Hu, Z.-W., 2016, NatAs,1,1
- Shaya & Federman (1987) Shaya, E. J., & Federman, S. R. 1987, ApJ, 319, 76
- Shull et al. (2000) Shull, J. M., Tumlinson, J., Jenkins, E. B., et al. 2000, ApJ, 538, L73
- Sodroski (1991) Sodroski, T. J. 1991, ApJ, 366, 95
- Solomon et al. (1992) Solomon, P. M., Downes, D., & Radford, S. J. E. 1992, ApJ, 387, L55
- Solomon et al. (1997) Solomon, P. M., Downes, D., Radford, S. J. E., & Barrett, J. W. 1997, ApJ, 478, 144
- Spaans & van Dishoeck (1997) Spaans, M., & van Dishoeck, E. F. 1997, A&A, 323, 953
- Stawarz et al. (2005) Stawarz, Ł., Siemiginowska, A., Ostrowski, M., & Sikora, M. 2005, ApJ, 626, 120
- van der Werf et al. (2010) van der Werf, P. P., Isaak, K. G., Meijerink, R., et al. 2010, A&A, 518, L42
- van Dishoeck & Black (1986) van Dishoeck, E. F., & Black, J. H. 1986, ApJS, 62, 109
- Wada et al. (2009) Wada, K., Papadopoulos, P. P., & Spaans, M. 2009, ApJ, 702, 63
- Walch et al. (2015) Walch, S., Whitworth, A. P., Bisbas, T. G., Hubber, D. A., & Wünsch, R. 2015, MNRAS, 452, 2794
- Walter et al. (2011) Walter, F., Weiß, A., Downes, D., Decarli, R., & Henkel, C. 2011, ApJ, 730, 18
- Wolfire et al. (2010) Wolfire, M. G., Hollenbach, D., & McKee, C. F. 2010, ApJ, 716, 1191
- Yang et al. (2013) Yang, J., Zuo, Y.-X., Lou, Z., Cheng, J.-Q.; Zhang, Q.-Z.; Shi, S.-C.; Huang, J.-S.; Yao, Q.; Wang, Z., 2013, RAA, 13, 1493
- Young & Scoville (1991) Young, J. S., & Scoville, N. Z. 1991, ARA&A, 29, 581
- Zhang et al. (2014) Zhang, Z.-Y., Henkel, C., Gao, Y., et al. 2014, A&A, 568, A122