Evidence of differential tidal effects in the old globular cluster population of the Large Magellanic Cloud
Abstract
We present for the first time extended stellar density and/or surface brightness radial profiles for almost all the known Large Magellanic Cloud (LMC) old globular clusters (GCs). These were built from DECam images and reach out to 4 times the GCs’ tidal radii. The background subtracted radial profiles reveal that the GCs located closer than 5 kpc from the LMC centre contain an excess of stars in their outermost regions with respect to the stellar density expected from a King profile. Such a residual amount of stars - not seen in GCs located farther than 5 kpc from the LMC centre-, as well as the GCs’ dimensions, show a clear dependence with the GCs’ positions in the galaxy, in the sense that, the farther the GC from the centre of the LMC, the larger both the excess of stars in its outskirts and size. Although the masses of GCs located inside and outside 5 kpc are commensurate, the outermost regions of GCs located closer than 5 kpc from the LMC centre appear to have dynamically evolved more quickly. These outcomes can be fully interpreted in the light of the known GC radial velocity disc-like kinematics, from which GCs have been somehow mostly experiencing the influence of the LMC gravitational field at their respective mean distances from the LMC centre.
keywords:
techniques: photometric – galaxies: individual: LMC – galaxies: star clusters: general1 Introduction
Recently Wagner-Kaiser et al. (2017, hereafter WK17) used HST data to show that metal-poor old globular clusters (GCs) in the inner halo of the Milky Way (MW) and in the Large Magellanic Cloud (LMC) are highly synchronized, in the sense that they seem to be coeval to 0.2 0.4 Gyr. Because their masses are also similar (Sollima & Baumgardt, 2017; Mackey & Gilmore, 2003, hereafter MG03), it becomes interesting to investigate whether such a synchronization has reached other astrophysical properties linked to them, such as structural parameters, relaxation times, etc.
Within the Galactic globular cluster (GGC) population, the presence of extra-tidal features is frequently seen, either as tidal tails, or extra-tidal stellar populations, or extent diffuse halo-like structures (e.g. Odenkirchen et al., 2003; Correnti et al., 2011; Carballo-Bello et al., 2012; Kuzma et al., 2017; Myeong et al., 2017; Navarrete et al., 2017; Piatti, 2017c). Nevertheless, as pointed out by Piatti (2017a), a renewed overall study of the external regions of GGCs is needed to reliably characterize them, and hence to investigate whether there is any connection between detected extra-tidal features with the GGCs’ dynamical histories in the Galaxy. If ages and metallicities led WK17 to conclude on the synchronicity of GC formation in the MW and the LMC, the comparison of their structural parameters (e.g. core and tidal radii) could shed light about any synchronicity of their dynamical histories as a result of their internal dynamics and tidal interactions with their host galaxies.
MG03 derived accurate King (1962)’s core radii () for five out of the six LMC GCs analysed by WK17, namely, NGC 1466, 1841, 2210, 2257 and Hodge 11. They could not estimate tidal radii () because of the limited field-of-view of the HST camera. The sixth GC in the WK17 sample, Reticulum, has and values estimated from photographic plates by Peterson & Kunkel (1977). As far as we are aware, there is no other study on the external regions of these LMC GCs located farther than 5 kpc from the LMC centre. For this reason, we took advantage of DECam images (3 square degree field-of-view, pixel size=0.263; Flaugher et al., 2015) to perform a sound analysis of their outskirts and to compare their structural properties with those of GGCs.
The LMC harbours an additional nine GCs located inside 5 kpc from its centre, namely: NGC 1754, 1786, 1835, 1898, 1916, 1928, 1939, 2005 and 2019. Because of their closer proximity to the LMC main body, they could have experienced a different tidal influence from their host galaxy, resulting in a distinctive behaviour of their structural properties. Similarly to the above subsample of LMC GCs, we did not find any other study on their external regions, so that we added them to this study by constructing accurate surface brightness radial profiles out to 4 times their tidal radii, using DECam images as well.
The paper is organized as follows: Section 2 introduces the data sets used and describes their processing. In Section 3 we explain how we constructed the stellar density and surface brightness radial profiles. It also presents estimates of a wide variety of dynamical and structural parameters from the constructed profiles that results in an homogeneous compilation for almost all ancient GCs in the LMC. Section 4 deals with the analysis of the resultant structural parameters and compares them with those of the GGCs, in order to establish any connection between them, as WK17 did for their ages and metallicities. While searching for a possible relationship between these dynamical and structural properties, we discovered that the existence of extra-tidal structures is dependent on the distance of a cluster from the LMC centre: those GCs closer than 5 kpc to the galaxy centre do exhibit such extended features. We summarise our results in Section 5.
2 Data handling
2.1 Resolved GCs
By searching the National Optical Astronomy Observatory (NOAO) Science Data Management (SDM) Archives111http://www.noao.edu/sdm/archives.php. we found DECam images taken in the field of NGC 1841, 2210 and Hodge 11 by the Survey of the Magellanic Stellar History (SMASH; Nidever et al., 2017), and in the field of Reticulum by the Dark Energy Survey (DES; Abbott et al., 2016). The images were taken using the filters, which are similar, but not identical to, the comparable SDSS filters. We downloaded the deepest publicly available images containing the aforementioned GCs, discarding those in which the clusters fall in gaps or are close to their margins. We preferred resampled images, because they have been corrected for distortion and have better astrometric coordinate solutions (Valdes et al., 2014). They consist of 120 s co-added images (90 s for Reticulum) with typical FWHMs of 0.95.
We obtained point-spread-function (PSF) photometry using the stand-alone DAOPHOT package (Stetson et al., 1990). A series of tasks comprising star finding and aperture photometry, PSF modelling with functions quadratically varying, and the use of the resulting PSFs to obtain instrumental magnitudes were performed iteratively three times on previously created subtracted images to find and measure magnitudes of additional fainter stars (see, e.g., Piatti, 2017c, b; Piatti et al., 2017). Bona fide stellar objects were successfully isolated by using roundness values between -0.5 and 0.5 and sharpness values between 0.2 and 1.0.
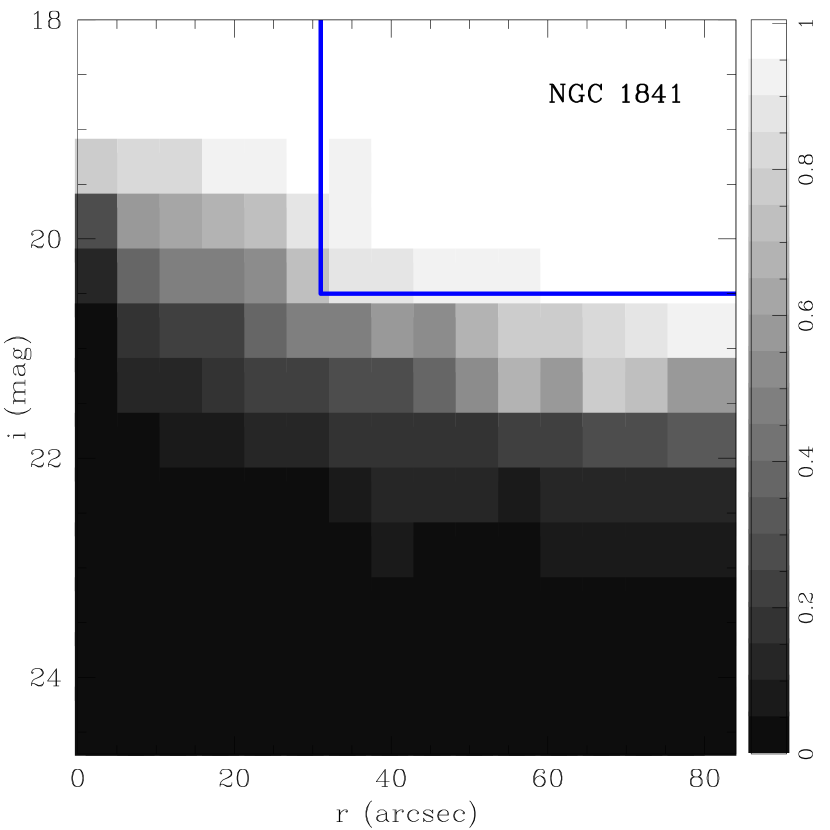
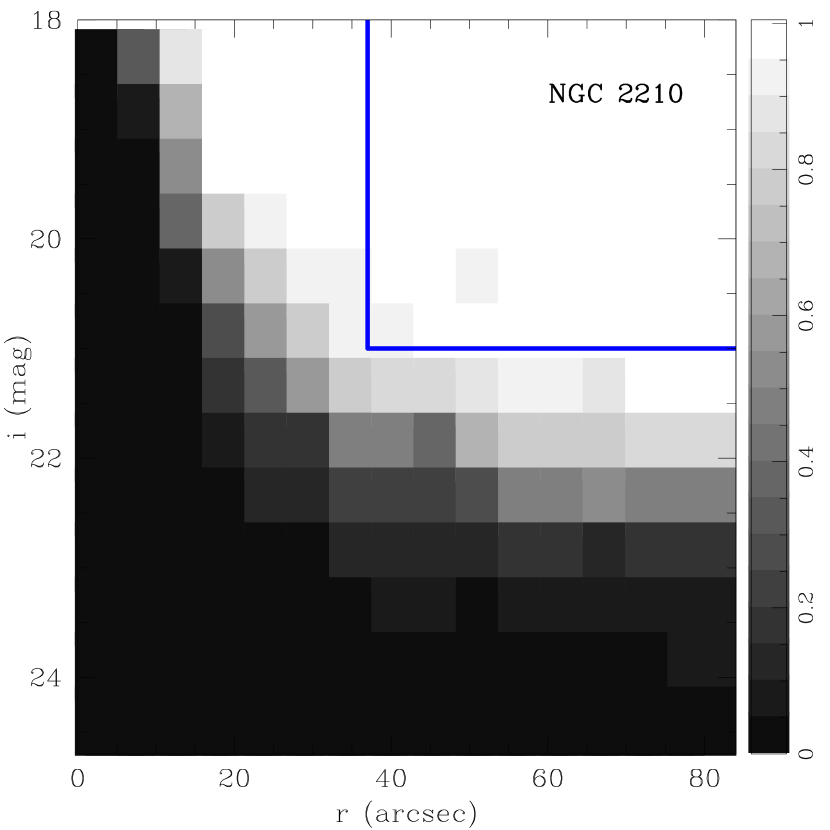
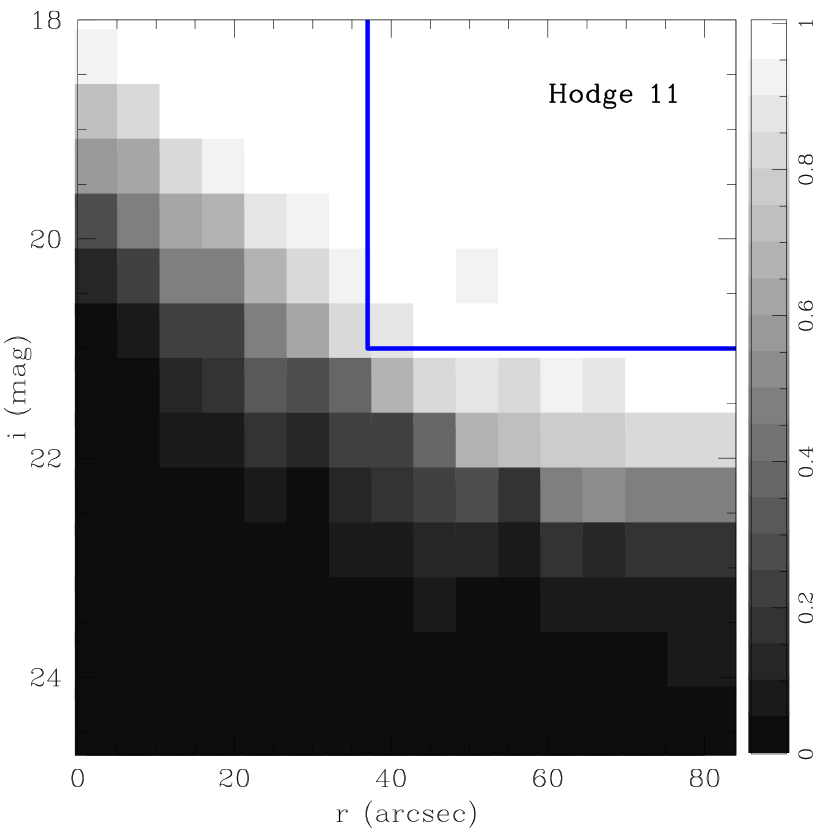
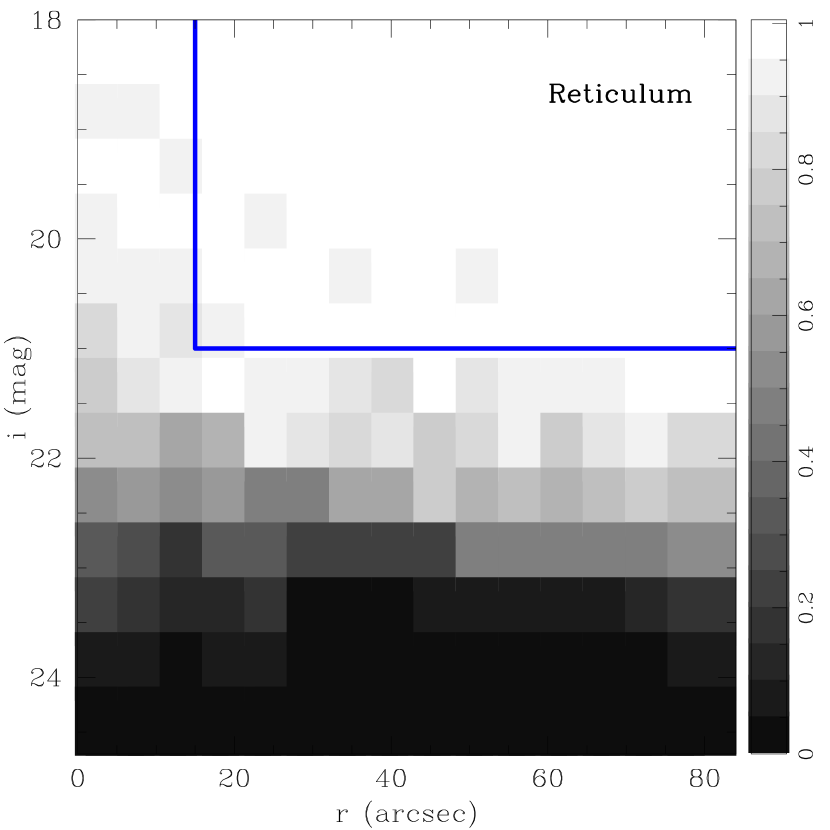
We also performed extensive artificial star tests around the cluster regions in order to accurately map the completeness of our photometry in terms of photometric depth and spatial dependence with the distance from the cluster centre. In doing this we repeated the PSF photometry recipes referred above – including the three passes to measure fainter stars – on a thousand created images per cluster with nearly 5 per cent added stars distributed appropriately according to the cluster stellar density profile and covered magnitude range (see, e.g. Piatti, 2015; Piatti & Bastian, 2016; Piatti & Cole, 2017). The resultant completeness functions are depicted in Fig. 1.
2.2 Unresolved GCs
We also made use of DECam images downloaded from the NOAO SDM Archives taken by SMASH in the field of NGC 1754, 1786, 1835, 1898, 1916, 1928, 1939, 2005 and 2019. From the whole collection of retrieved resampled images, we discarded those that have surpassed the detector saturation limits or show proccesing defects (e.g., image damaged by unsuccessful CCD reading or charge transfer), in addition to the constrains used for resolved GCs. We finally selected images taken using the filters. All these nine GCs are unresolved extended objects in the DECam images (GC typical size of 30-80 arcsec in radius), so that we built surface brightness radial profiles from integrated aperture photometry, as described in Section 3.2.
3 Data analysis
3.1 Stellar density radial profiles
We built stellar density radial profiles for the four resolved LMC GCs. We first determined the cluster photometric centres by using stars with magnitudes at 100 per cent completeness level, from which we applied a kernel density estimator (KDE) technique. Particularly, we employed the KDE routine within AstroML (Vanderplas et al., 2012), which has the advantage of not depending on the bin size and starting point to build a stellar density map, as it is the case whenever star counts and histograms are produced. The only free parameter is the so-called bandwidth, which refers to the FWHM of the Gaussians used to build the stellar density map. Bandwidths were varied from 2 up to 10 times the images’ FWHMs without noticing any changes in the photometric centres larger than the estimated uncertainties (typical 1.0). In the case of NGC 2210 we used the IRAF222IRAF is distributed by the National Optical Astronomy Observatories, which is operated by the Association of Universities for Research in Astronomy, Inc., under contract with the National Science Foundation. n2gaussfit task instead, because the central cluster region is not resolved by the DECam images.
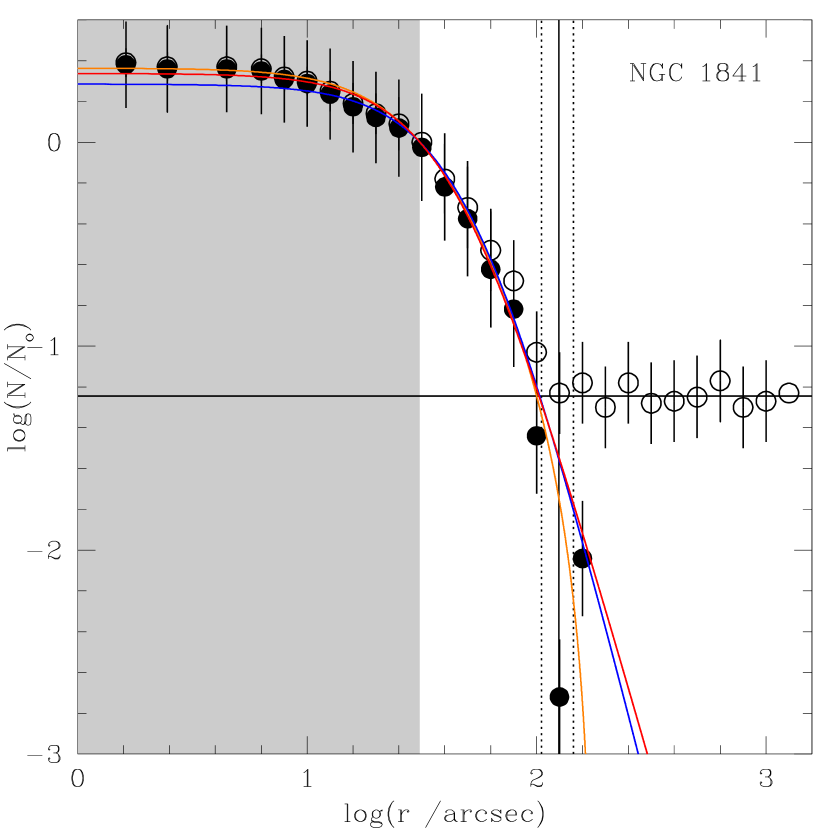
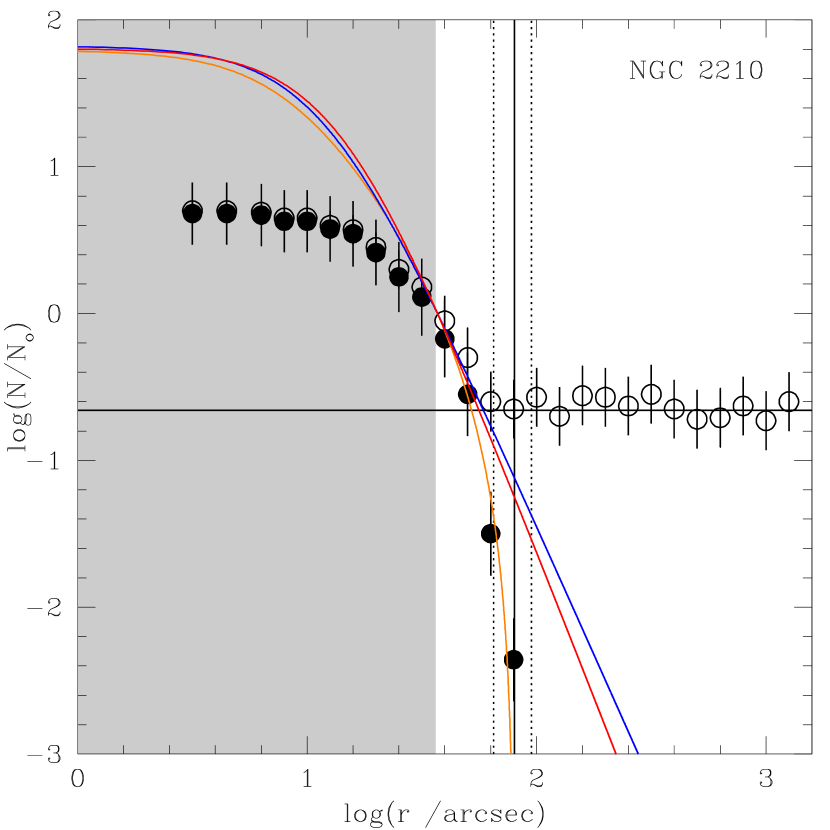
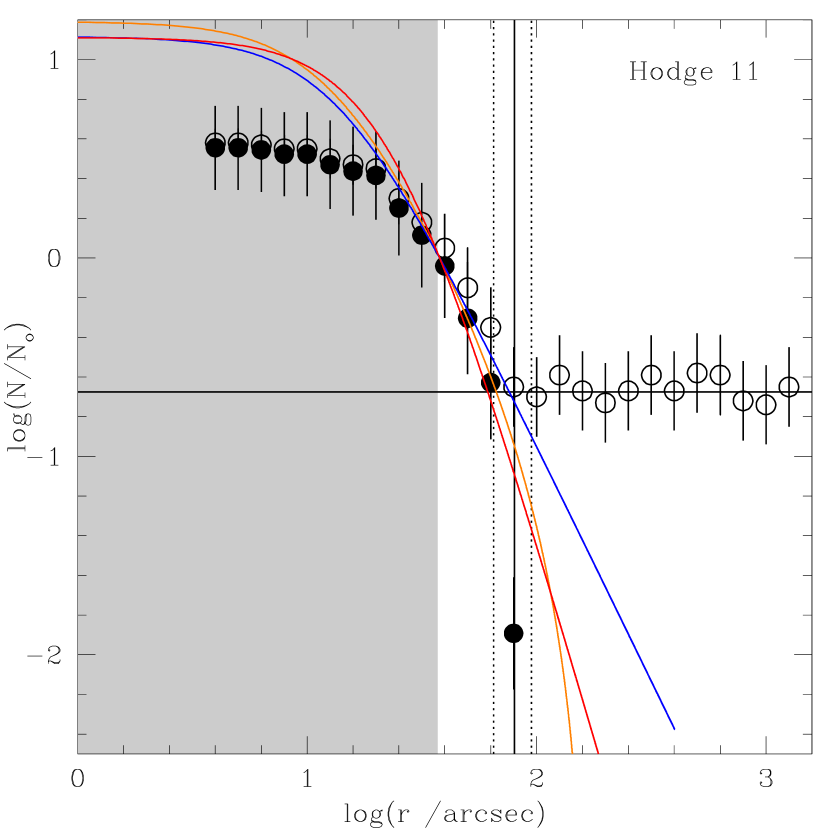
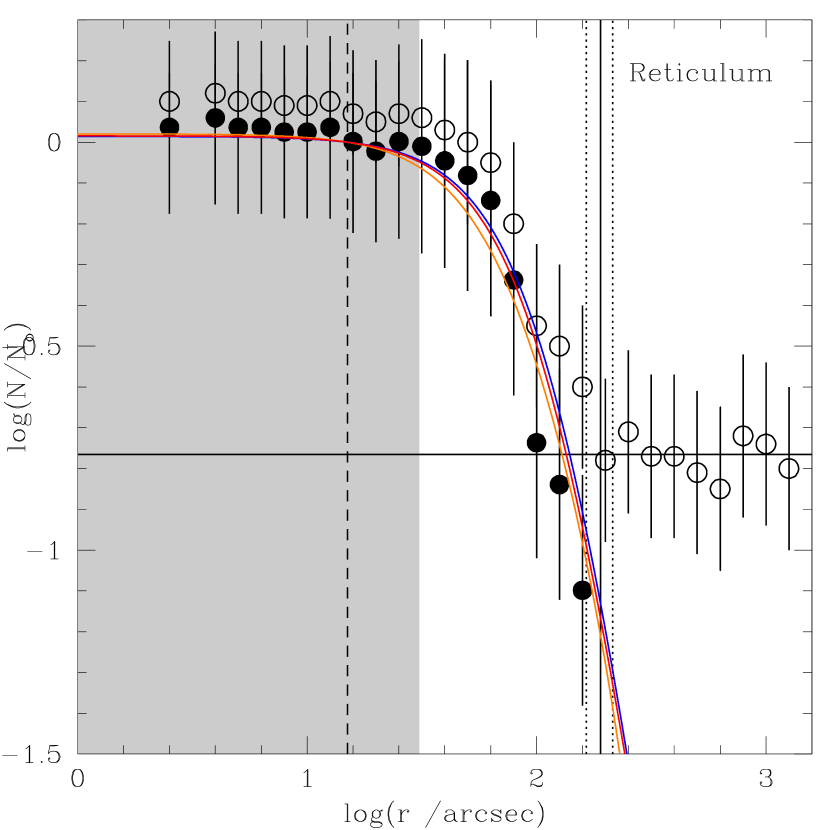
Stellar density maps were constructed by employing the KDE routine over a subsample of stars with magnitudes brighter than those for the 90 per cent completeness level. Since this is a compromise between desirable photometric depth and distance from the cluster centre, we chose radii and magnitude limits that allowed us to reach relatively faint stars located reasonably inside the cluster main bodies. Fig. 1 shows those chosen limits in magnitude and radius represented by the horizontal and vertical blue lines, respectively. From the resultant stellar density maps, we built the cluster stellar density profiles using the above photometric centres and averaging the generated stellar density values for annular regions of log(r /arcsec)= 0.1 wide. These measured stellar density profiles are shown in Fig. 2 with open circles with the respective errorbars. From them, the mean background levels were estimated by averaging those values for log(r /arcsec) 2.6 (horizontal lines in Fig. 2) and subtracted from the measured stellar density profiles. Although clusters have quite different profiles we chose that value because is readily visible from Fig. 2 that a meaningful mean background can be obtained from values outwards that limit. The background subtracted profiles are depicted with filled circles in Fig. 2. In this case, the errorbars come from considering in quadrature the uncertainties of the measured density profiles and the dispersion of the background levels. Additionally, from the intersection of the mean background level and the GC stellar density profile we derived the observed cluster radii (). The mean values and errors are illustrated with solid and dotted vertical lines in Fig. 2.
MG03 fitted the surface brightness profiles of NGC 1841, 2210 and Hodge 11 - obtained from HST data that reach 76 arcsec out of the cluster centres - with Elson et al. (1987, hereafter EFF)’s models through the expression:
| (1) |
where , and are the central surface brightness, a measure of the core radius and the the power-law slope at large radii, respectively. We used their and values to overplot EFF models onto the background subtracted stellar density profiles, which very well match the outer cluster regions as well, as can be seen in Fig. 2 (blue lines). For Reticulum, we performed here our own fit ( = 29.11.7 pc, = 4.20.3) by using a grid of (, ) values to fit its stellar radial profile by minimization. Notice that the stellar density profiles are affected by photometry completeness less than 90 per cent across the shaded areas of Fig. 2. In the cases of NGC 2210 and Hodge 11 such an incompleteness is more severe than for NGC 1841 and Reticulum.
We also used King (1962)’s profiles with the values derived by MG03 to find the ones that best reproduce the stellar density cluster profiles. Because of the limitation of this method to derive values, we constrained their use in the subsequent analysis only to estimate concentration parameters ( log(/)), allowing relatively larger uncertainties (see Table 1). For Reticulum, we also derived . In order to have independent estimates of the cluster half-light radii (), we fitted Plummer (1911)’s models using the relation 1.3; being the only free parameter to adjust. Both, King and Plummer resultant curves are illustrated in Fig. 2 with orange and red lines, respectively. From the resulting values and the asymptotic masses () derived by MG03 (by Suntzeff et al. (1992) for Reticulum), we calculated half-mass relaxation times using the equation of Spitzer & Hart (1971)
| (2) |
where is the average mass of the cluster stars. For simplicity we assumed a constant average stellar mass of 0.75 M⊙, which corresponds to a star at the main sequence turnoff of these LMC GCs (Bressan et al., 2012). Finally, we computed the values of Jacobi radii from the expression (Chernoff & Weinberg, 1990)
| (3) |
where is the LMC mass contained in a volume of radius equals to the cluster deprojected galactocentric distance (). The latter were calculated by assuming that the GCs are part of a disc having an inclination = 35.14 and a position angle of the line of nodes of = 129.51 (Balbinot et al., 2015). For we used three available values of 0.5, 1.7 and 18 1010 contained inside = 4, 9 and 20 kpc, respectively (Besla et al., 2012) and derived the fitted equation = 0.023 /kpc)3 (109 ), which we used to interpolate the respective LMC mass values. Table 1 lists all the relevant astrophysical properties estimated with their respective uncertainties.
| ID | a | ageb | log( /)c | ||||||
|---|---|---|---|---|---|---|---|---|---|
| (kpc) | (pc) | (pc) | (pc) | (pc) | (pc) | (Gyr) | (Gyr) | ||
| NGC 1841 | 15.55 | 7.770.17 | 14.751.26 | 31.515.04 | 50.4212.61 | 109.722.69 | 4.81.1 | 13.771.70 | 5.120.20 |
| NGC 2210 | 4.37 | 1.990.06 | 4.460.49 | 19.623.68 | 19.624.91 | 119.29.81 | 1.20.2 | 11.631.50 | 5.480.10 |
| Hodge 11 | 4.53 | 2.950.16 | 7.650.25 | 20.083.76 | 42.662.51 | 138.532.62 | 2.90.8 | 13.922.10 | 5.630.24 |
| Reticulum | 10.62 | 18.821.26 | 36.393.76 | 47.686.27 | 112.9012.55 | 76.040.15 | 19.013.0 | 13.092.10 | 5.150.25 |
a Taken from MG03, except Reticulum’s value which is derived in this work; b taken from WK17; c taken from MG03, and from Suntzeff et al. (1992) for Reticulum. Note: to convert 1 arcsec to pc, we use the following expression,1010sin(1/3600) where is the true distance modulus taken from WK17.
3.2 Surface brightness radial profiles
We produced surface brightness radial profiles for the nine unresolved LMC GCs, as well as for the resolved ones for completeness purposes. We first determined the centres of gravity by using the n2gaussfit task within IRAF. We started with initial guesses for the background level, the cluster centre, the amplitude (brightness above background), the full-width-half-maximum, the position angle and the ellipticity, and run the routine using square boxes of 10 (2.63) up to 40 (10.52) pixels a side, in steps of 5 (1.32) pixels. Then, we averaged all the output central coordinates with typical resulting uncertainties of 0.5 (0.13) pixels.
We measured instrumental integrated magnitudes around the cluster centres in concentric circles with radii from 5 (1.32) up to 1000 (4.38) pixels, increasing the circle radius in steps of 5 (1.32) pixels. Therefore, we obtained 200 different integrated magnitude values per filter across the cluster fields. Because of the high S/N ratio (measured flux to background level) photometric errors resulted always smaller than 0.005 mag and decreased as the circle radius increased. In order to obtain mean integrated magnitudes per unit area as a function of the distance from the cluster centres, we computed the difference of measured fluxes between two adjacent circles, then divided the resulting flux by the respective annular area and computed its integrated magnitude. The errors were calculated using the expression 2()/( -1), where (), and represent the photometric error of the integrated magnitude for the -th circle, and the measured fluxes at the and -th circles, respectively. The adopted equation comes from error propagation of the difference between two magnitudes, assuming () = (). We finally averaged all the available values in intervals of log( /arcsec) = 0.1.
The resulting surface brightness radial profiles are depicted in Figs. 3-15 with open circles. From them, we estimated the mean background levels by averaging those values for log(r /arcsec) 2.2 (horizontal line in the figures) that we subtracted from the constructed surface brightness profiles. The background region was chosen following the same criterion as in Section 3.1. Thus, we obtained the intrinsic cluster profiles that we used in the subsequent analysis to estimate their structural parameters. They are represented in Figs. 3-15 with filled circles, while their errors were calculated by adding in quadrature both the uncertainties of the individual points and the mean error of the background level. We also estimated the cluster radii () as the distance from the cluster centre where the mean background level intersects the cluster profile. These are represented by a vertical line in Figs. 3-15, while their values and uncertainties are shown in Table 2. As far as we are aware, this is the first time that surface brightness (or stellar density) profiles are built for these GCs from their centres out to 4 times their tidal radii.
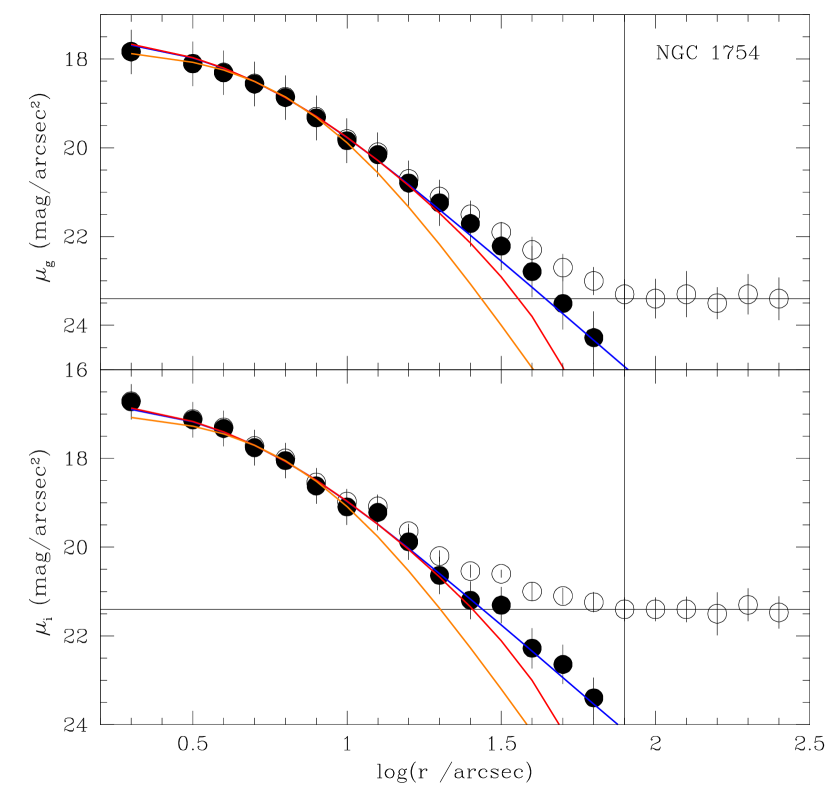
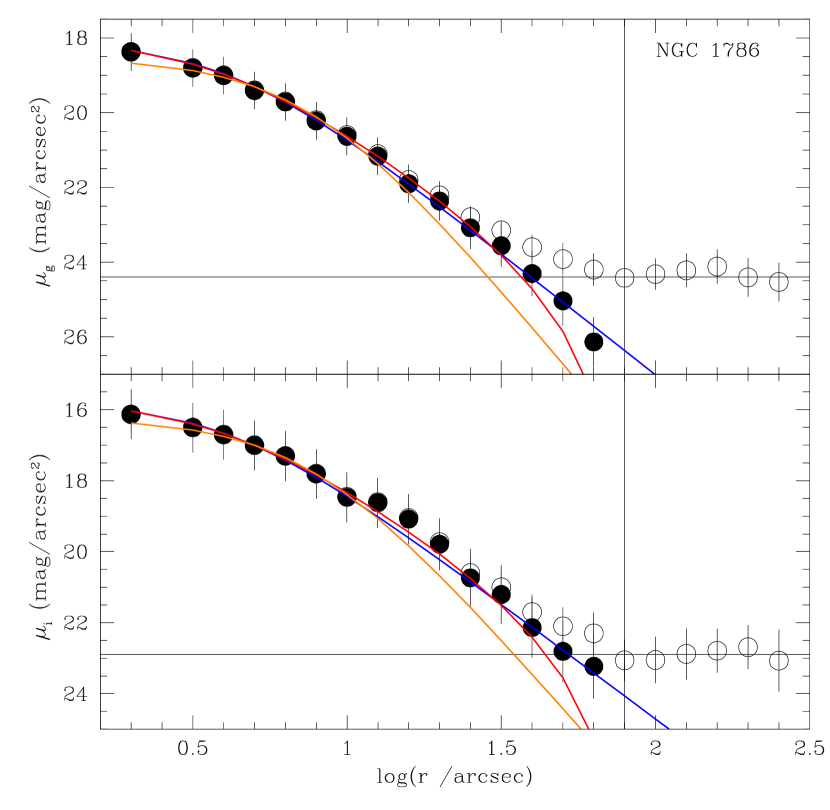
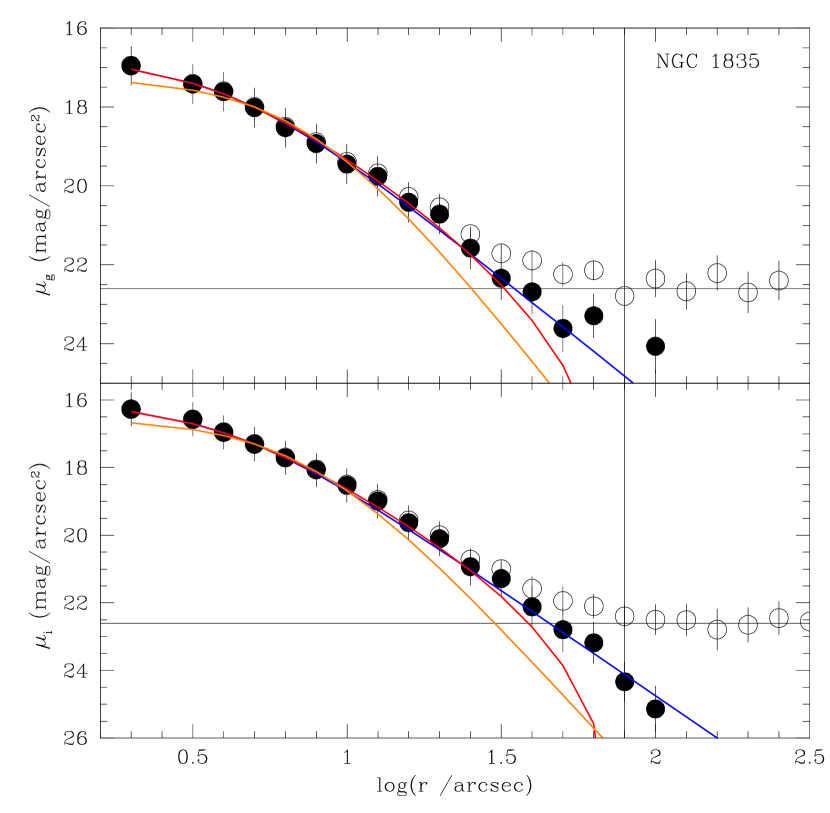
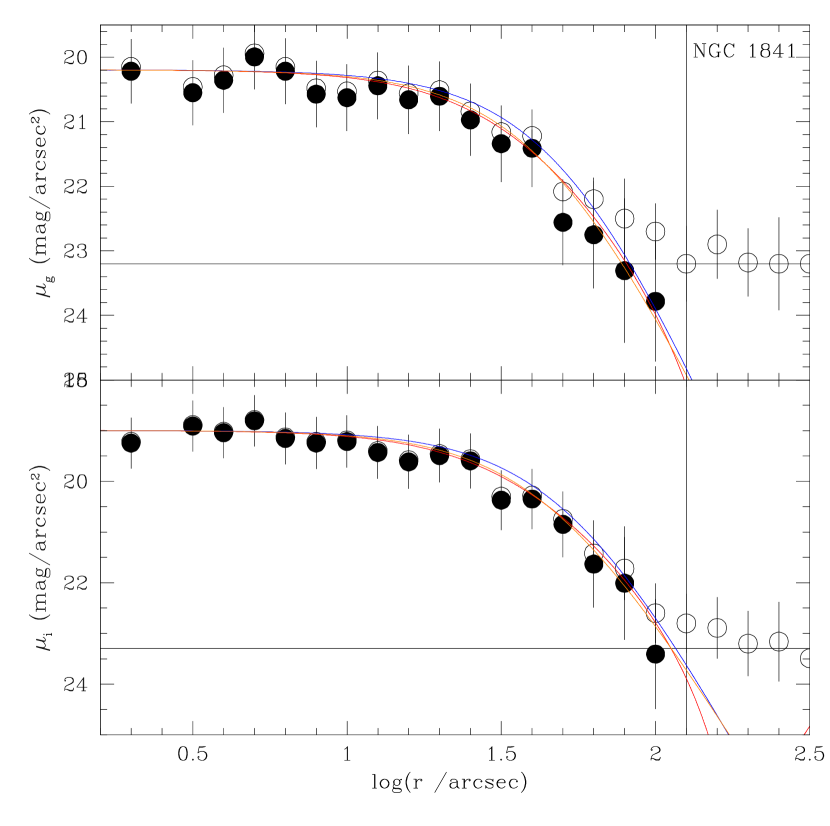
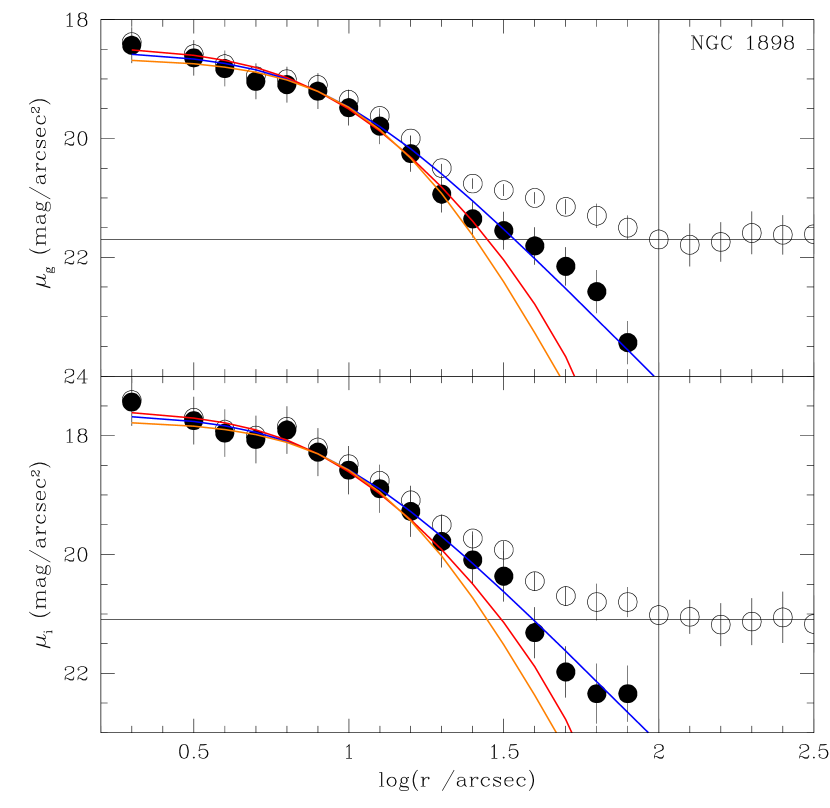
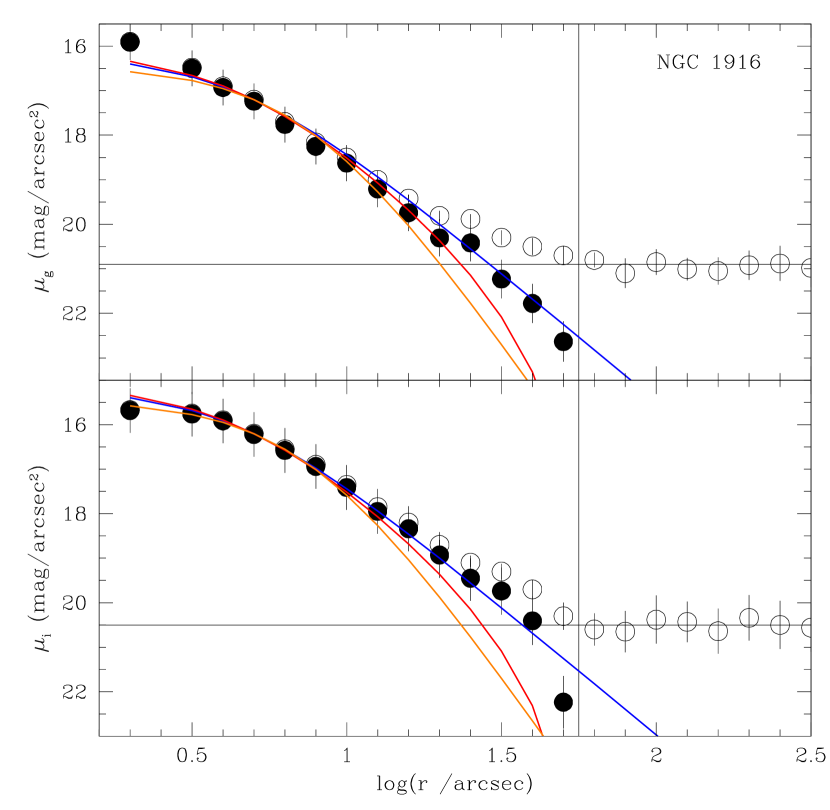
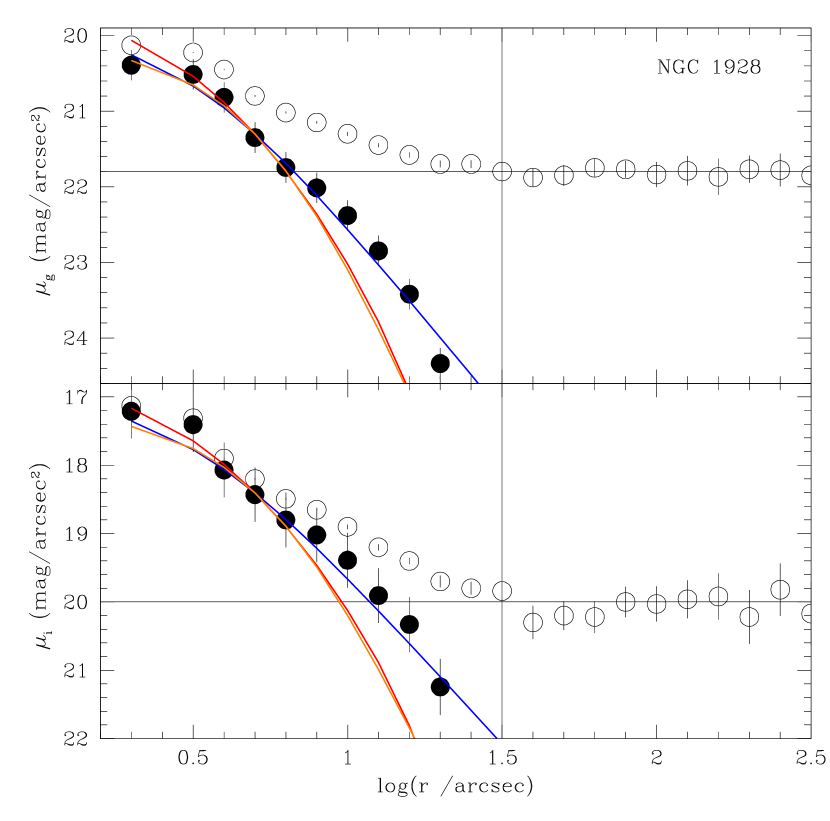
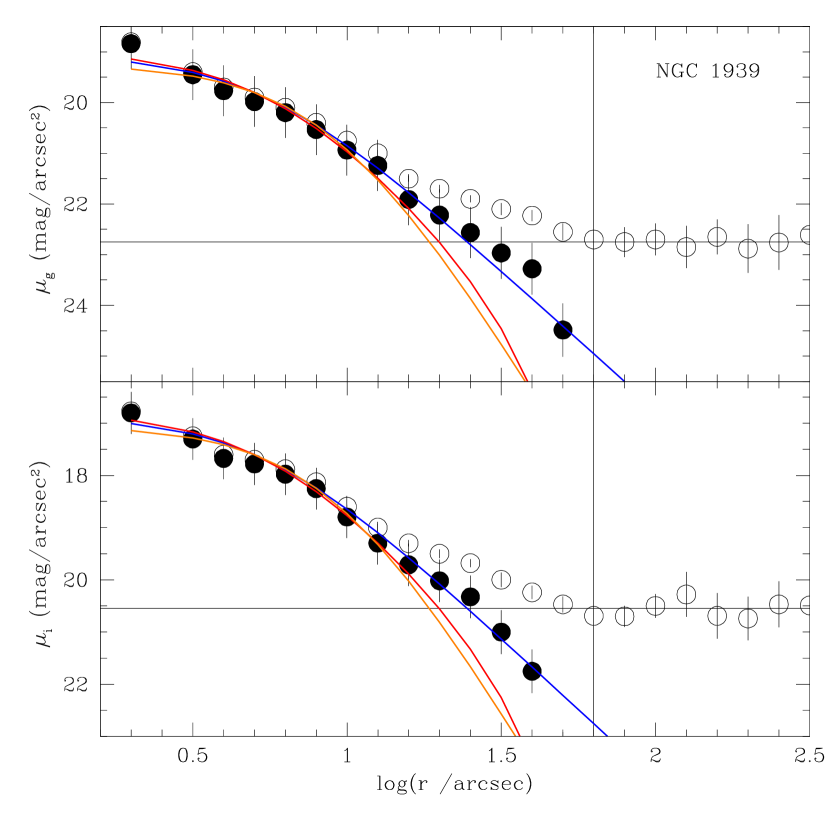
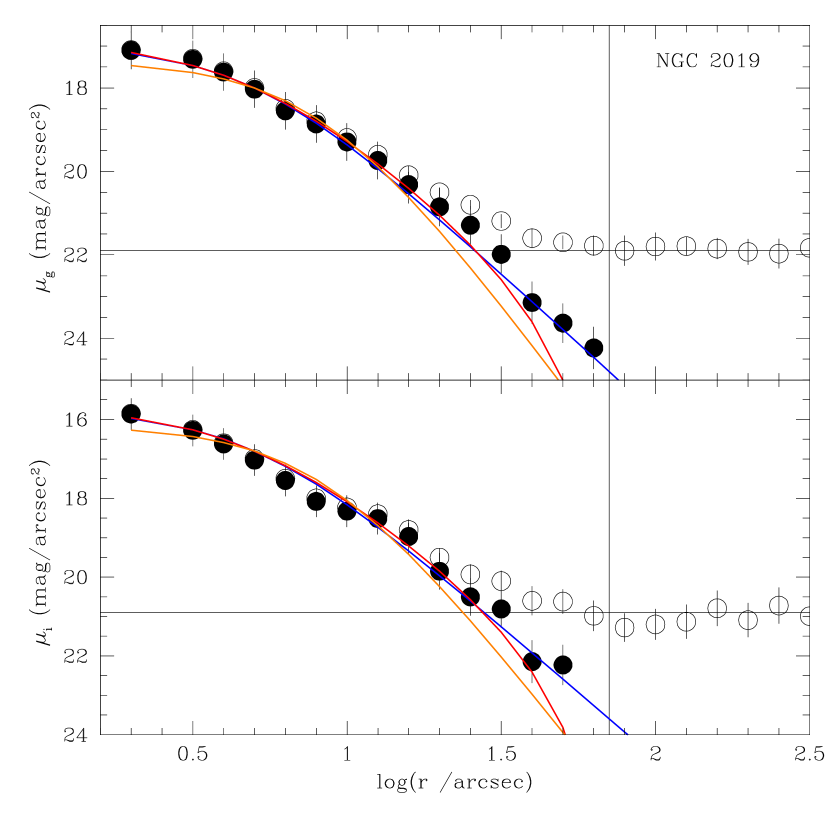
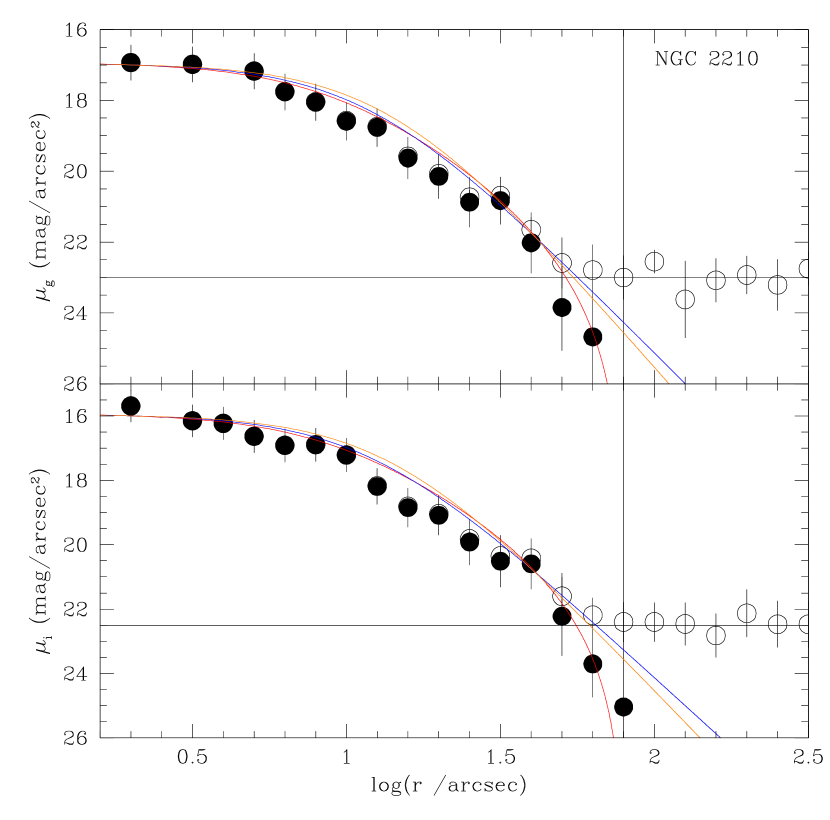
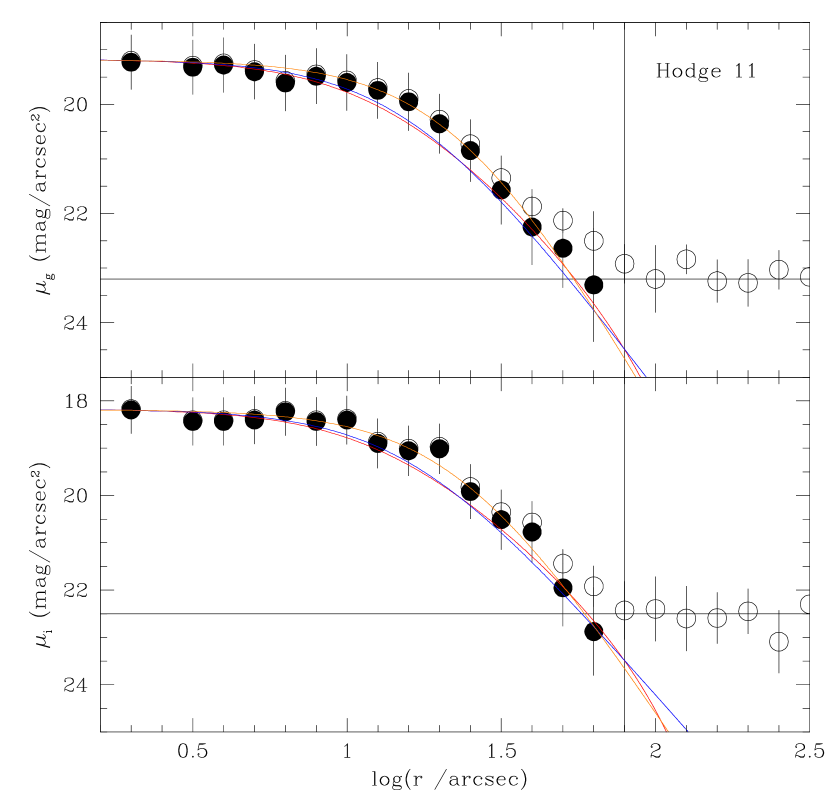
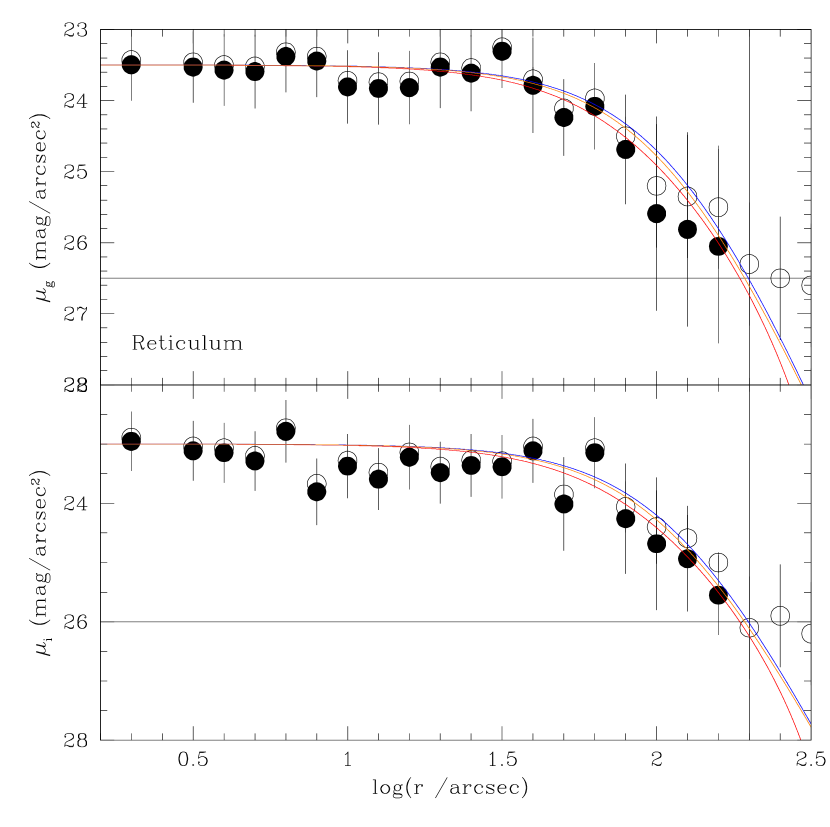
We fitted EFF, King (1962) and Plummer (1911) models to the , background subtracted surface brightness profiles in order to derive , and radii. While provides us with information about the innermost cluster structure, (King) and (EFF) tell us about their outermost regions. Notice that both King and EFF models depend on , so that we used two independent approaches to derive .
We used a grid of , . and values to fit independently the three different models to the and surface brightness profiles, separately. The values for which the models best resemble independently the and profiles were obtained by minimisation and then averaged. These are shown in Table 2, while Figs. 3-15 depict the EFF, King and Plummer curves with blue, red and orange lines, respectively. For the resolved LMC GCs we superimposed the EFF, King (1962) and Plummer (1911) curves drawn in Fig. 2. The present values of and are in a general good agreement with those derived by Mackey & Gilmore (2003) from surface density profiles using F555W images. They did not obtain values because they barely reached 76 arcsec out of the cluster centres due to the small HST field-of-view. For this reason, some of their values - that govern the outermost part of the profiles - could also be systematically different. Additionally, they did not use the innermost points of the surface density profiles of some GCs (e.g. NGC 1754, 1786, 1916) that could explain the more different values.
From available GC ages (Piatti et al., 2009; Carretta et al., 2010) and masses (Mackey & Gilmore, 2003), we also computed half-mass relaxation times using eq. (2). For the sake of the reader, the resulting values are listed in Table 2 along with the GC ages and masses. For completeness purposes, we finally included in Table 2 the deprojected GC distances to the LMC centre (). We did not compute Jacobi radii for clusters within 5 kpc from the LMC centre because, as far as we are aware, the variation of the LMC mass with distance is not known for this inner distance range. Adopting a unique LMC mass value for all the clusters lead to useless values.
| ID | agea | log( /)b | |||||||
|---|---|---|---|---|---|---|---|---|---|
| (kpc) | (pc) | (pc) | (pc) | (pc) | (100Myr) | (Gyr) | |||
| NGC 1754 | 2.62 | 0.970.12 | 2.430.12 | 19.294.49 | 19.432.43 | 2.40.3 | 4.40.6 | 13.0 | 5.390.30 |
| NGC 1786 | 2.27 | 0.850.12 | 2.430.12 | 19.294.49 | 19.432.43 | 2.60.2 | 5.20.6 | 12.3 | 5.570.20 |
| NGC 1835 | 1.40 | 0.850.12 | 2.430.12 | 19.294.49 | 19.432.43 | 2.50.2 | 6.60.5 | 13.4 | 5.830.13 |
| NGC 1898 | 0.43 | 2.070.12 | 4.620.24 | 24.295.64 | 24.292.43 | 2.10.2 | 18.52.8 | 13.5 | 5.880.30 |
| NGC 1916 | 0.17 | 0.970.12 | 2.430.12 | 13.653.13 | 14.572.43 | 2.30.2 | 6.40.6 | 13.5 | 5.790.15 |
| NGC 1928 | 0.00 | 0.730.12 | 1.820.12 | 7.681.77 | 7.291.21 | 2.00.2 | 1.70.2 | 12.3 | 4.870.20 |
| NGC 1939 | 0.43 | 1.210.12 | 2.920.12 | 15.333.55 | 14.572.43 | 2.20.2 | 4.30.4 | 12.3 | 5.080.20 |
| NGC 2005 | 0.79 | 0.970.12 | 2.670.12 | 10.862.50 | 12.141.21 | 2.60.2 | 5.50.5 | 13.5 | 5.490.16 |
| NGC 2019 | 1.05 | 0.970.12 | 2.670.12 | 17.203.96 | 17.002.43 | 2.70.2 | 6.60.7 | 13.5 | 5.680.19 |
4 Analysis and discussion
We started by considering the four GCs studied by WK17 (Hodge 11, NGC 1841, NGC 2210 and Reticulum) with the aim of exploring whether the synchronicity between their ages and those of GGCs also reaches their structural parameters. Fig. 2 reveals that beyond the King’s profiles none of the studied LMC GCs exhibit any sort of extra-tidal structures like those seen in a non-negligible number of GGCs (Carballo-Bello et al., 2012). Although the origin of such extended stellar structures around them is not well-known (Piatti, 2017a), some theoretical developments have shown that they could be due to potential escapers (Küpper et al., 2010) or potential observational biases (Balbinot & Gieles, 2017). According to Gnedin & Ostriker (1997) and Dinescu et al. (1999) some GGCs have experienced disruption by tidal shocks more important than by internal relaxation and evaporation, so that tidal tails should be expected as debris from those interactions with the MW. Multiple tidal tails from the interaction with the MW potential have also been recently predicted from numerical simulations (Hozumi & Burkert, 2015). Therefore, in broad terms, we could conclude that the GGC stars located in the outermost regions are experiencing, in some way, gravitational effects due to the MW gravitational field.
Bearing in mind the above results, we added to our analysis the nine unresolved GCs located inside a circle of 5 kpc from the LMC centre. At first glance, every fitted curve (see Figs. 3-15) matches very similarly the two independent surface brightness profiles built per GC, which represent their present-day structural shapes as driven mainly by internal dynamical relaxation and LMC tidal forces. By inspecting Figs.3-15 more closely, all the GCs do have outermost excesses of stars that are reproduced by the EFF models; neither King nor Plummer profiles are able to account for such a significant number of stars in the GC outskirts. This is a feature not seen in the outermost LMC GCs studied above, whose extended stellar density radial profiles are satisfactorily reproduced by King’s models. We speculate on the possibility that these observed stellar excesses might have reached the outskirts of the GCs under the effects of the LMC tidal field, since two-body relaxation would have led GCs to be simply tidally filled.
The orbital motions of LMC GCs are satisfactorily described by a disc-like rotation with no GCs appearing to have halo kinematics (Schommer et al., 1992; Grocholski et al., 2006; Sharma et al., 2010), so that it is expected that they do not cross the LMC disc as many GGCs do in the MW. Hence, they have not had chances to be subjected to tidal shocks which could cause the appearance of extra-tidal structures, or in a more general context, that the LMC potential has not been efficient in stripping stars off its GCs. The studied LMC GCs have .
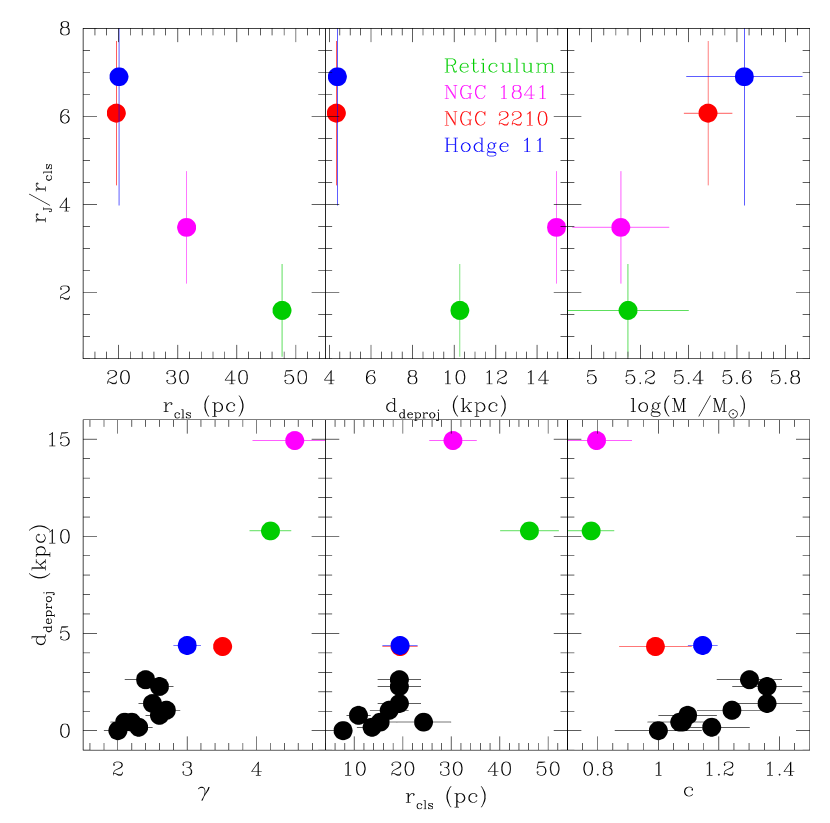
Since indicates where stars are gravitationally unbounded from the GC, we measured the degree of tidal filling by comparing the derived values with the ones (see top-left panel of Fig. 16). As can be seen, GCs have not filled their respective Jacobi volumes, which explains the negative detection of extended stellar structures. Curiously, the more massive the GC the less filled the Jacobi volume, which, at a first glance, results contrary to the expected higher tidal filling in more massive GCs. We found that such an apparent opposite behaviour could be due to the differential LMC gravitational field, i.e, GCs located in the galaxy outskirts have been allowed to expand more than those in inner regions, provided that they were placed in disc-like orbits during their lifetimes (Miholics et al., 2014). Precisely, the top-middle panel of Fig. 16 (see also Table 1) shows that Reticulum and NGC 1841, located at of 10.62 and 15.55 kpc, respectively, are relatively more expanded within their Jacobi volumes than NGC 2210 and Hodge 11 ( 4.5 kpc), despite the latter are more massive GCs.
This result interestingly suggests that, even though the LMC potential has been relatively inefficient in carving extra-tidal structures, it has differentially affected the GC expansion due to the internal dynamics (e.g., two-body relaxation). Indeed, the bottom panels of Fig. 16 would seem to suggest that - the power-law index at large radii, i.e., the slope in a log-log plot -, the cluster radius () and the concentration parameter () show a trend with the position of the GCs in the galaxy. These trends are confirmed when the LMC GCs located within 5 kpc from the galaxy centre are included (see black circles in Fig. 16). As can be seen, the smaller the value, the stronger the LMC tidal field (see botom-left panel of Fig. 16), suggesting that the LMC gravitational field has been acting differently on the GCs. Although the result could be somehow expected, it is now confirmed by the observations. Similarly, the innermost GCs are smaller than the outermost ones (see middle-panel of Fig. 16). The variation in cluster size is not due to systematically different masses: GCs with smaller or larger than 5 kpc clearly span comparable mass ranges (see Tables 1 and 2). Furthermore, even having similar masses, they have dynamically evolved differently: the innermost ones have lived for many more median relaxation times than their more remote counterparts (see bottom-left panel of Fig. 17). This finding suggests that the LMC gravitational field has played an important role in accelerating the dynamical evolution of the innermost GCs.
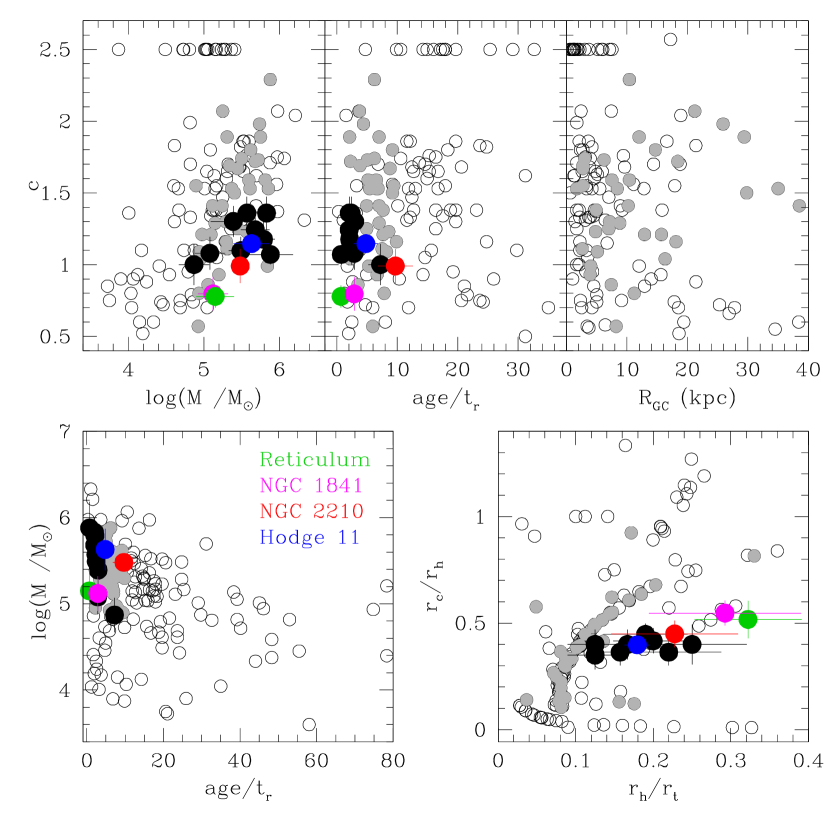
We compared the derived LMC GC structural parameters with those of GGCs using the values of , , , and the Galactocentric distances compiled by Harris (1996, December 2010 edition). As for the GGC masses, we used masses of 35 GGCs published by Sollima & Baumgardt (2017) and the integrated absolute magnitudes of Harris (1996) to fit the expression log( /M⊙) = -0.42 + 2.02, which we used to estimate homogeneously the masses of the 157 GGCs included in the Harris (1996)’ catalogue. Fig. 17 depicts the results of the comparison carried out for different relationships. GGCs are represented with open circles, while grey filled circles represent GGCs with age/ ratios and masses similar to those of the LMC GCs (see bottom-left panel). Notice that, since Harris (1996) used the best measurements available in the literature to compile the GGCs’ parameters, their errors result smaller than the symbol size. Thus, we can straightforwardly draw conclusions about any connection between these astrophysical properties in the GC populations of these two galaxies.
The concentration parameter is a measure of the dynamical evolutionary stage of a cluster following two-body relaxation, mass segregation and finally core-collapse (Heggie & Hut, 2003). Consequently, the larger the value the more dynamically evolved a cluster. As can be seen in the top-left panel of Fig. 17, more massive GGCs have dynamically evolved faster; while the LMC GCs have the lowest concentrations, thus implying that they are the least evolved, in comparison to their counterpart GGCs. This is an unexpected result because both GC populations have lived similar number of times their (similar age/ ratios), as is shown in the top-middle panel of Fig. 17, and are highly synchronized (WK17). Under the assumption that isolated GCs of similar masses should dynamically evolve similarly, the present outcome poses the idea that other conditions, for instance, the gravitational potential of the host galaxy, the features of the GC orbital motions (halo- or disc- like orbits), could also affect differentially the relationships between different structural parameters.
Indeed, in the vs plane (see see bottom-right panel of Fig. 17), where a cluster moves approximately in the top-right-bottom-left direction (Heggie & Hut, 2003, see, e.g., their figure 33.2) while relaxing toward a core-collapse stage, LMC GCs evolved differently than GGCs with similar masses and age/ ratios. The figure shows that all the GCs are in the region corresponding to tidally filled star clusters, in very good agreement with the above results. However, the innermost GCs (black filled circles) have in average values relative to slightly larger than the outermost GCs (NGC 1841, 2210, Hodge 11 and Reticulum), because of the excess of stars in their outskirts that make the ratio smaller. At the same time, the / ratios of all the GCs are distributed nearly in a narrow range, which suggests that there is no distinction of the dynamical evolution in the innermost regions of the LMC GCs. Interestingly, there is a group of six GGCs (NGC 6352, 6749, 6838, Terzan 4, 10 and 2MS-GC01) that follow approximately the distribution of the LMC GCs. These GGCs have lived much more times their relaxation times ((age/) 15 - 50) and have smaller masses ((log(M /M⊙) 3.8 - 4.8) than the LMC GCs; all of them are located at 7 kpc. On the other hand, values of GGCs do not seem to be linked with their positions in the MW (see top-right panel of Fig. 17), like LMC GCs appear to show respect to their own host galaxy (see bottom-right panel of Fig. 16). Nevertheless, some precaution in this suggested trend is needed, since some GGCs change significantly their because of their orbital motions, which could blur any real relationship.
5 Conclusions
We have made use of publicly available DECam images to build for the first time stellar density and/or surface brightness radial profiles for almost all known old LMC GCs. These are the most extended stellar radial profiles built for these GCs so far. The resulting radial profiles, which reach out to 4 times the GC tidal radii, allowed us to accurately estimate the respective mean background levels to be subtracted from the observed radial profiles.
We then matched the background subtracted radial profiles with EFF, King, and Plummer models. In doing this, we chose core, half-mass and tidal radii which made the fitted models best resembled the traced radial profiles. From the analysis of the relationships between different estimated dynamical and structural properties, we conclude:
The studied GCs located farther than 5 kpc from the LMC centre would not seem to present any hint of extended stellar structures, like the family of different characteristics (e.g., extra-tidal structures, tidal tails, extent halo-like features) seen in an important number of GGCs. The apparent negative detection of such outer region structural tracers could suggest, contrarily to what is predicted for some GGCs, that the LMC potential has not been efficient in stripping stars off its GCs.
Those GCs located closer than 5 kpc from the LMC centre show an excess of stars distributed in the outermost regions with respect to the nominal amount of stars predicted by the best-fitting empirical King models. Such an excess of stars tightly depends on the position of the GCs in the galaxy, in such a way that the closer the GC to the LMC centre, the larger the excess of stars. In addition, the GC radii also show a remarkable trend with the position of the GC in the LMC disc, namely: the farther the GC, the larger the GC radius.
These results can be interpreted in the light of their very well-known radial velocity disc-like kinematics. GCs rotate around the LMC centre keeping their mean distances from the LMC centre, so that they have mostly experienced the influence of the local gravitational field, which decreases as the distance from the LMC centre increases. Since the LMC tidal field is relatively more intense towards the inner parts of the galaxy, GCs placed in orbits closer to the core of the galaxy have suffered relatively more severe effects, for instance, that more GC stars moved outwards reaching the GC outskirts. Furthermore, the gradual decrease of the LMC gravitational field with the distance from its centre has also allowed GC to expand more as they occupy increasingly remote positions in the galaxy.
Moreover, we showed that outer LMC GCs ( 5 kpc ) have not filled their respective Jacobi volumes and that the more massive the GC the less filled the Jacobi volume. This result could be explained if their deprojected galactocentric distances are considered, because more distant GCs are allowed to expand differentially more, provided that the LMC GCs have spent their lifetimes in disc- like orbital motions.
The different dimensions of the 13 analysed GCs do not seem to be related to any systematic difference in their masses. Indeed, all the studied GCs have masses within the same mass range independently of whether they are located inside or outside the 5 kpc circle. Despite this, GCs with deprojected distances smaller than 5 kpc have lived for many more median relaxation times. This behaviour might also be a result of the stronger tidal fields, which have made the GCs dynamically evolved faster by bringing stars towards the outermost GC regions sooner than what would have been expected in an scenario of isolated two-body relaxation. However, we did not find any evidence that the GC regions inside their half-mass radii have been affected by the LMC tidal field.
Acknowledgements
This research draws upon data provided by David Nidever (SMASH, NOAO program ID 2013B-0440) as distributed by the Science Data Archive at NOAO. NOAO is operated by the Association of Universities for Research in Astronomy (AURA) under a cooperative agreement with the National Science Foundation.
This project used public archival data from the Dark Energy Survey (DES). Funding for the DES Projects has been provided by the U.S. Department of Energy, the U.S. National Science Foundation, the Ministry of Science and Education of Spain, the Science and Technology Facilities Council of the United Kingdom, the Higher Education Funding Council for England, the National Center for Supercomputing Applications at the University of Illinois at Urbana–Champaign, the Kavli Institute of Cosmological Physics at the University of Chicago, the Center for Cosmology and Astro-Particle Physics at the Ohio State University, the Mitchell Institute for Fundamental Physics and Astronomy at Texas A&M University, Financiadora de Estudos e Projetos, Fundação Carlos Chagas Filho de Amparo à Pesquisa do Estado do Rio de Janeiro, Conselho Nacional de Desenvolvimento Científico e Tecnológico and the Ministério da Ciència, Tecnologia e Inovação, the Deutsche Forschungsgemeinschaft and the Collaborating Institutions in the Dark Energy Survey. The Collaborating Institutions are Argonne National Laboratory, the University of California at Santa Cruz, the University of Cambridge, Centro de Investigaciones Energéticas, Medioambientales y Tecnológicas-Madrid, the University of Chicago, University College London, the DES-Brazil Consortium, the University of Edinburgh, the Eidgenössische Technische Hochschule (ETH) Zürich, Fermi National Accelerator Laboratory, the University of Illinois at Urbana-Champaign, the Institut de Ciències de l’Espai (IEEC/CSIC), the Institut de Física d’Altes Energies, Lawrence Berkeley National Laboratory, the Ludwig-Maximilians Universität München and the associated Excellence Cluster Universe, the University of Michigan, the National Optical Astronomy Observatory, the University of Nottingham, the Ohio State University, the University of Pennsylvania, the University of Portsmouth, SLAC National Accelerator Laboratory, Stanford University, the University of Sussex, and Texas A&M University. We thank the referee for his/her thorough reading of the manuscript and timely suggestions to improve it.
References
- Abbott et al. (2016) Abbott T. M. C., et al., 2016, in Ground-based and Airborne Telescopes VI. p. 99064D, doi:10.1117/12.2232723
- Balbinot & Gieles (2017) Balbinot E., Gieles M., 2017, preprint, (arXiv:1702.02543)
- Balbinot et al. (2015) Balbinot E., et al., 2015, MNRAS, 449, 1129
- Besla et al. (2012) Besla G., Kallivayalil N., Hernquist L., van der Marel R. P., Cox T. J., Kereš D., 2012, MNRAS, 421, 2109
- Bressan et al. (2012) Bressan A., Marigo P., Girardi L., Salasnich B., Dal Cero C., Rubele S., Nanni A., 2012, MNRAS, 427, 127
- Carballo-Bello et al. (2012) Carballo-Bello J. A., Gieles M., Sollima A., Koposov S., Martínez-Delgado D., Peñarrubia J., 2012, MNRAS, 419, 14
- Carretta et al. (2010) Carretta E., Bragaglia A., Gratton R. G., Recio-Blanco A., Lucatello S., D’Orazi V., Cassisi S., 2010, A&A, 516, A55
- Chernoff & Weinberg (1990) Chernoff D. F., Weinberg M. D., 1990, ApJ, 351, 121
- Correnti et al. (2011) Correnti M., Bellazzini M., Dalessandro E., Mucciarelli A., Monaco L., Catelan M., 2011, MNRAS, 417, 2411
- Dinescu et al. (1999) Dinescu D. I., Girard T. M., van Altena W. F., 1999, AJ, 117, 1792
- Elson et al. (1987) Elson R. A. W., Fall S. M., Freeman K. C., 1987, ApJ, 323, 54
- Flaugher et al. (2015) Flaugher B., et al., 2015, AJ, 150, 150
- Gnedin & Ostriker (1997) Gnedin O. Y., Ostriker J. P., 1997, ApJ, 474, 223
- Grocholski et al. (2006) Grocholski A. J., Cole A. A., Sarajedini A., Geisler D., Smith V. V., 2006, AJ, 132, 1630
- Harris (1996) Harris W. E., 1996, AJ, 112, 1487
- Heggie & Hut (2003) Heggie D., Hut P., 2003, The Gravitational Million-Body Problem: A Multidisciplinary Approach to Star Cluster Dynamics
- Hozumi & Burkert (2015) Hozumi S., Burkert A., 2015, MNRAS, 446, 3100
- King (1962) King I., 1962, AJ, 67, 471
- Küpper et al. (2010) Küpper A. H. W., Kroupa P., Baumgardt H., Heggie D. C., 2010, MNRAS, 401, 105
- Kuzma et al. (2017) Kuzma P. B., Da Costa G. S., Mackey A. D., 2017, preprint, (arXiv:1709.02915)
- Mackey & Gilmore (2003) Mackey A. D., Gilmore G. F., 2003, MNRAS, 338, 85
- Miholics et al. (2014) Miholics M., Webb J. J., Sills A., 2014, MNRAS, 445, 2872
- Myeong et al. (2017) Myeong G. C., Jerjen H., Mackey D., Da Costa G. S., 2017, ApJ, 840, L25
- Navarrete et al. (2017) Navarrete C., Belokurov V., Koposov S. E., 2017, ApJ, 841, L23
- Nidever et al. (2017) Nidever D. L., et al., 2017, preprint, (arXiv:1701.00502)
- Odenkirchen et al. (2003) Odenkirchen M., et al., 2003, AJ, 126, 2385
- Peterson & Kunkel (1977) Peterson C. J., Kunkel W. E., 1977, PASP, 89, 634
- Piatti (2015) Piatti A. E., 2015, MNRAS, 451, 3219
- Piatti (2017a) Piatti A. E., 2017a, preprint, (arXiv:1709.07284)
- Piatti (2017b) Piatti A. E., 2017b, A&A, 606, A21
- Piatti (2017c) Piatti A. E., 2017c, ApJ, 846, L10
- Piatti & Bastian (2016) Piatti A. E., Bastian N., 2016, A&A, 590, A50
- Piatti & Cole (2017) Piatti A. E., Cole A., 2017, MNRAS, 470, L77
- Piatti et al. (2009) Piatti A. E., Geisler D., Sarajedini A., Gallart C., 2009, A&A, 501, 585
- Piatti et al. (2017) Piatti A. E., Dias W. S., Sampedro L. M., 2017, MNRAS, 466, 392
- Plummer (1911) Plummer H. C., 1911, MNRAS, 71, 460
- Schommer et al. (1992) Schommer R. A., Suntzeff N. B., Olszewski E. W., Harris H. C., 1992, AJ, 103, 447
- Sharma et al. (2010) Sharma S., Borissova J., Kurtev R., Ivanov V. D., Geisler D., 2010, AJ, 139, 878
- Sollima & Baumgardt (2017) Sollima A., Baumgardt H., 2017, MNRAS, 471, 3668
- Spitzer & Hart (1971) Spitzer Jr. L., Hart M. H., 1971, ApJ, 164, 399
- Stetson et al. (1990) Stetson P. B., Davis L. E., Crabtree D. R., 1990, in Jacoby G. H., ed., Astronomical Society of the Pacific Conference Series Vol. 8, CCDs in astronomy. pp 289–304
- Suntzeff et al. (1992) Suntzeff N. B., Schommer R. A., Olszewski E. W., Walker A. R., 1992, AJ, 104, 1743
- Valdes et al. (2014) Valdes F., Gruendl R., DES Project 2014, in Manset N., Forshay P., eds, Astronomical Society of the Pacific Conference Series Vol. 485, Astronomical Data Analysis Software and Systems XXIII. p. 379
- Vanderplas et al. (2012) Vanderplas J., Connolly A., Ivezić Ž., Gray A., 2012, in Conference on Intelligent Data Understanding (CIDU). pp 47 –54, doi:10.1109/CIDU.2012.6382200
- Wagner-Kaiser et al. (2017) Wagner-Kaiser R., et al., 2017, MNRAS, 471, 3347
- de Grijs et al. (2014) de Grijs R., Wicker J. E., Bono G., 2014, AJ, 147, 122