A massive core for a cluster of galaxies at a redshift of 4.3
Massive galaxy clusters are now found as early as 3 billion years after the Big Bang, containing stars that formed at even earlier epochs [1, 2, 3]. The high-redshift progenitors of these galaxy clusters, termed ‘protoclusters’, are identified in cosmological simulations with the highest dark matter overdensities.[4, 5, 6] While their observational signatures are less well defined compared to virialized clusters with a substantial hot intra-cluster medium (ICM), protoclusters are expected to contain extremely massive galaxies that can be observed as luminous starbursts[7]. Recent claimed detections of protoclusters hosting such starbursts[8, 9, 10, 11] do not support the kind of rapid cluster core formation expected in simulations[12] because these structures contain only a handful of starbursting galaxies spread throughout a broad structure, with poor evidence for eventual collapse into a protocluster. Here we report that the source SPT2349-56 consists of at least 14 gas-rich galaxies all lying at z = 4.31 based on sensitive observations of carbon monoxide and ionized carbon. We demonstrate that each of these galaxies is forming stars between 50 and 1000 times faster than our own Milky Way, and all are located within a projected region only 130 kiloparsecs in diameter. This galaxy surface density is more than 10 times the average blank field value (integrated over all redshifts) and 1000 times the average field volume density. The velocity dispersion ( 410 km s-1) of these galaxies and enormous gas and star formation densities suggest that this system represents a galaxy cluster core at an advanced stage of formation when the Universe was only 1.4 billion years old. A comparison with other known protoclusters at high redshifts shows that SPT2349-56 is a uniquely massive and dense system that could be building one of the most massive structures in the Universe today.
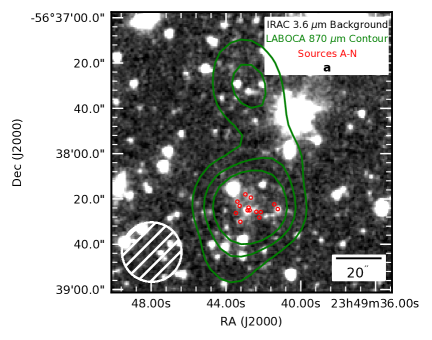
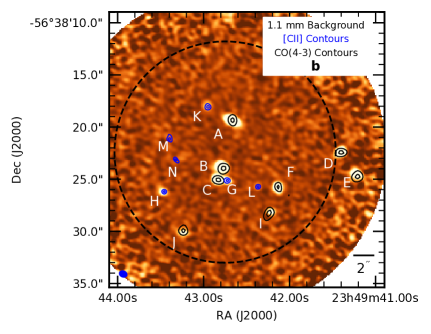
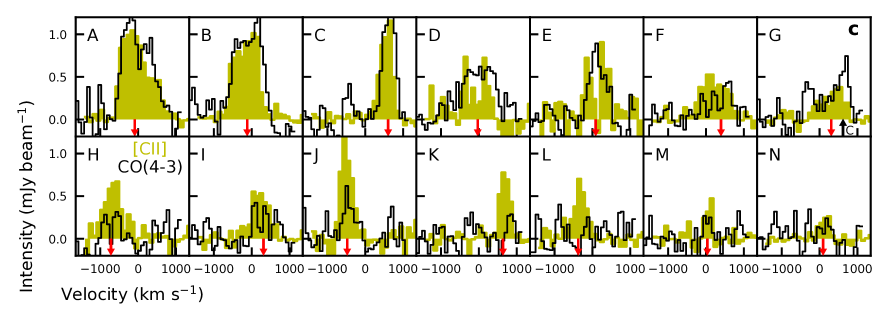
In a multi-band survey over 2500 deg2 of sky, the South Pole Telescope (SPT) discovered a population of rare ( deg-2), extremely bright ( mJy) millimeter-selected sources [13, 14]. The Atacama Large Millimeter Array (ALMA) 870-m imaging showed that more than of these SPT-selected sources are single high-redshift submillimeter galaxies (SMGs)[15] with intrinsic flux densities of mJy, but gravitationally lensed by factors of [16], with a median redshift [17]. However, % of these sources show no evidence for lensing and may instead be intrinsically very luminous galaxies or even groups of multiple rapidly star-forming galaxies. The brightest such source in the SPT 2500 deg2 survey, SPT2349-56 (=23.3 mJy), is revealed by LABOCA (a low resolution bolometer camera on the APEX telescope) observations at 870 m to consist of two elongated sources with a combined flux density mJy (Fig. 1), with the brighter southern source comprising mJy of this flux density. An ALMA redshift survey[17] further resolved SPT2349-56 into a pair of bright 3-mm sources associated with the southern LABOCA source, with both lying at . To better understand the nature of this structure, deep ALMA spectral imaging of the brighter southern peak of the extended LABOCA source was undertaken. A 358-GHz map containing the redshifted [CII] line was used to search for line-emitting galaxies. A blind spectral line survey (described in the Methods) was performed on the data cube, revealing 14 line emitters at high significance (SNR 7). Twelve of these emitters are individually detected in the 1.1-mm continuum map at , with 1.1-mm flux densities ranging from 0.2-5 mJy (Fig. 1). The remaining two line emitters (M,N) are both detected at lower significance in the 1.1-mm continuum map but have robust IRAC infrared counterparts (Extended Data Table 1, Extended Data Fig. 4). Eight of these sources are also detected () in the CO(4-3) line. The ALMA spectra are shown in Fig. 1.
The measurements of both the continuum and spectral lines of the 14 galaxies allow us to estimate their star formation rates (SFRs) and gas masses (Tables 1 & Extended Data Table 1). The physical properties of these sources indicate that this protocluster already harbors massive galaxies that are rapidly forming stars from an abundant gas supply. The two brightest sources, A & B, have SFRs in excess of 1000 solar masses per year (M⊙ yr-1) within their resolved -kpc radii. The total SFR of the 14 sources is M⊙ yr-1. Multi-colour imaging with Herschel-SPIRE (250, 350, 500-m), in addition to the 870-m LABOCA map, show that the northern LABOCA structure is also consistent with lying at (see Methods). The sources detected in the ALMA 870-m imaging therefore comprise just 50% of the total flux density of the southern LABOCA source and 36% of the total LABOCA flux density, suggesting that the kpc extent of the protocluster contains 16,500 M⊙ yr-1of star formation. Modelling the spectral energy distribution based on this combined submillimeter photometry yields an IR luminosity (from 8-1100 m) of times the solar luminosity (L⊙). The gas masses of the 14 protocluster galaxies, estimated from CO(4-3), or [CII] if undetected in CO(4-3) (see Methods), range from to M⊙, with a total gas mass of M⊙. A follow-up survey of colder molecular gas in CO(2-1) with the ATCA radio telescope detects the bulk of this large gas repository, especially in the central region near sources B, C, & G, and confirms that the assumed line intensity ratio, CO(4-3) to CO(1-0), used in the Methods when calculating the total gas mass is consistent with the average measurements from ATCA.
The detected ALMA sources also enables an initial estimate of the mass of the protocluster. We determine the mean redshift using the biweight estimator[18] as . The velocity dispersion of the galaxy distribution is according to the biweight method[18], which is the standard approach for galaxy samples of this size. Other common methods (gapper[18], Gaussian fit) agree to within 3% and provide similar errors. Under the assumption that SPT2349-56 is approximately virialized, the mass-dispersion relation for galaxy clusters[19] indicates a dynamical mass of M⊙, which is an upper limit if the system has not yet virialized. Given the possible selection effect of requiring a bright source (S1.4mm 15 mJy) within the 1′ SPT beam for detection, we also further consider the possibility that our structure may represent an end-on filament being projected into a compact but unbound configuration, rather than a single bound halo. Our analysis in the Methods suggests this is not as likely as a relatively bound system in a massive halo, given the velocity dispersion measured as a function of position, and other supporting arguments. However we cannot rule this possibility out completely, and further analysis and observations of the larger angular scale of the structure will be required to more fully understand the nature of this system.
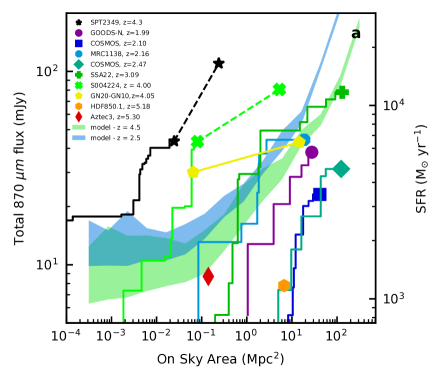
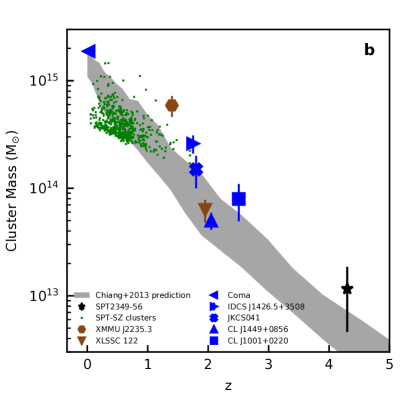
If the total halo mass represented by these 14 SMGs is indeed M⊙, then the protocluster is a viable progenitor of a M⊙ galaxy cluster comparable to the Coma cluster at (Fig. 2), which we deduce by comparison to simulations that track the hierarchical halo growth of a M⊙ galaxy cluster from early epochs[12]. The location of SPT2349-56 in this plane suggests a very massive descendant, but we caution that N-body simulations indicate that it is difficult to reliably predict halo mass from the halo mass at a given epoch due to the large halo-to-halo variation in dark matter halo growth histories [20].
To study the relative overdensity and concentration of SPT2349-56, it is desirable to compare with other active protoclusters at high redshift. SPT2349-56 is highly overdense, as it harbors 10 SMGs with (a level at which we are complete, with uniform sensitivity across our search area) located within a circle of diameter 19′′ (130 kpc), corresponding to a number density of . By comparison, the average number of field sources with mJy within this area across all redshifts is less than one [21]; thus, this field is overdense by more than a factor of 10. When we account for the fact that all sources are at the same redshift, the volume density is the field density, assuming a redshift binning of =0.1 and the redshift distribution for SMGs[22]. In Fig. 2, we plot ‘curves of growth’ of the total 870-m flux density versus on-sky area for SPT2349-56 and other SMG-rich protoclusters (see Methods for the details of the comparison sample). For SPT2349-56, we plot both the total flux density of the 14 confirmed protocluster members detected with ALMA and the total flux density of the extended LABOCA structure. The curve of growth for SPT2349-56 rises much more steeply than those of the other high-redshift protoclusters, demonstrating its extreme density. For SPT2349-56 the on-sky area encompassing the accumulated 870-m flux density (and thus approximately the total SFR) is as much as 3 orders of magnitude less than for other protoclusters at . SPT2349-56 clearly stands out as the densest collection of SMGs: although some other protoclusters contain as many SMGs, they extend over much larger areas on the sky, with separations often exceeding arcmin (22co-moving Mpc (cMpc) to 15 cMpc at to ). This comparison demonstrates that SPT2349-56 is likely observed during a significantly more advanced stage of cluster formation than other high-redshift protoclusters, a cluster core in the process of assembly rather than an extended structure that may not even collapse to form a cluster by the present day [12].
Also shown in Fig. 2 is the maximal curve of growth predicted by a theoretical model for submm-luminous protocluster regions at (see Methods for details). Except for SPT2349-56 and the recent Herschel discovery SMM J004224[23], the comparison high- protoclusters exhibit curves of growth fairly consistent with the model expectations. The model prediction for the region spanned by SPT2349-56 is % of the observed total flux density of the 14 ALMA sources. The under-prediction is more severe if we consider the extended LABOCA source: only % of the observed flux density is recovered. This discrepancy may suggest that environmental effects (such as enhanced galaxy interactions or gas accretion in high-density environments) that are not included in the theoretical model employed are responsible for the extremely high SFR density exhibited by SPT2349-56. An alternative theoretical approach, ‘zoom’ hydrodynamical simulations of protoclusters[24], can potentially capture such environmental effects, but to date, such simulations have been unable to reproduce the extremely high SFR inferred for SPT2349-56: of the 24 protocluster simulations presented by these authors, the maximum total SFR attained was M⊙ yr-1, an order of magnitude less than that of SPT2349-56. However, the volume of the N-body simulation from which the 24 halos were selected was 1 cGpc3, which may be too small to contain an object as rare as SPT2349-56. Nevertheless, the existence of SPT2349-56, which contains an unprecedented concentration of rapidly star-forming SMGs when the Universe was only 1.4 Gyr old, poses a formidable challenge to theoretical models seeking to explain the origin and evolution of galaxy (proto)clusters.
SPT2349-56 may represent a significantly more advanced stage of cluster formation than the typical protoclusters identified to date, as outlined above. Since the cores of present-day galaxy clusters are characterized by massive elliptical galaxies with old-to-intermediate-age stellar populations [25] and SMGs are thought to be the high-redshift progenitors of present-day ellipticals [22], it is likely that at least some of the 14 SMGs located at the same redshift within a region kpc in diameter will soon merge to form a massive elliptical galaxy at the core of a lower-redshift galaxy cluster.
Theoretical studies have shown that at , the progenitors of galaxy clusters should span comoving Mpc [12, 26], corresponding to an angular scale of as much as a degree; we are thus possibly observing only a small part of a much larger structure. For SPT2349-56, it is unknown whether the overdensity extends over such a large scale, as more detailed observations are required to characterize the field surrounding SPT2349-56. We have demonstrated that the extended LABOCA-detected complex has submm colours similar to the core region identified by our ALMA observations and is thus likely all at . We have also identified five additional bright SPIRE sources in the surrounding cMpc field with similar red colours lying several arcmin from the core structure (see Methods). These are candidates for additional protocluster members located in an extended, collapsing structure, similar to the comparison SMG overdensities shown in Fig. 2. If all these sources are confirmed to lie at , this would approximately double the far-IR luminosity of the cluster, making it by far the most active system known in the Universe. Since SPT2349-56 was selected from a blind mm survey of 2500 deg2 (approximately 1/16th of the sky), it is unlikely there are more than approximately 16 such structures across the entire sky. A full analysis of other unlensed sources from the SPT survey to identify possible systems similar to SPT2349-56 will place stronger constraints on early structure formation in the Universe.
Acknowledgments
This paper makes use of the following ALMA data: ADS/JAO.ALMA#2016.0.00236.T
and ADS/JAO.ALMA#2015.1.01543.T. ALMA is a partnership of ESO (representing its member states),
NSF (USA) and NINS (Japan), together with NRC (Canada) and NSC and ASIAA (Taiwan), in cooperation
with the Republic of Chile. The Joint ALMA Observatory is operated by ESO, AUI/NRAO and NAOJ.
This work is also based in part on observations
made with the Spitzer Space Telescope, which is operated by the Jet Propulsion Laboratory, California Institute
of Technology under a contract with NASA. The SPT is supported by the National Science Foundation
through grant PLR-1248097, with partial support through PHY-1125897, the Kavli Foundation and the Gordon
and Betty Moore Foundation grant GBMF 947.
This publication is based on data acquired with the Atacama Pathfinder
Experiment (APEX) under programme IDs E-299.A-5045A-2017 and ID M-091.F-0031-2013. APEX
is a collaboration between the Max-Planck-Institut fur Radioastronomie, the European Southern Observatory, and the Onsala Space Observatory.
Supporting observations were obtained at the Gemini
Observatory, which is operated by the Association of Universities for Research in Astronomy, Inc., under
a cooperative agreement with the NSF on behalf of the Gemini partnership: the National Science Foundation
(United States), the National Research Council (Canada), CONICYT (Chile), Ministerio de Ciencia,
Tecnologa e Innovacion Productiva (Argentina), and Ministerio da Ciencia, Tecnologia e Inovacao (Brazil).
The Australia Telescope Compact Array (ATCA) is part of the Australia Telescope National Facility which is funded by the Australian Government for operation as a National Facility managed by CSIRO.
D.P.M., J.S.S., J.D.V., K.C.L., and S.J. acknowledge support from the U.S. National Science Foundation
under grant AST-1312950.
S.C.C., T.B.M., and A.B. acknowledge support from NSERC. S.C.C. and T.B.M. acknowledge CFI and the Killam trust.
M.A. acknowledges partial support from FONDECYT through grant 114009.
The Flatiron Institute is supported by the Simons Foundation.
J.D.V. acknowledges support from an A.P. Sloan Foundation Fellowship.
Author Contributions T.B.M. led the data analysis, and assembled the paper. S.C.C. designed the study, proposed the ALMA observations, reimaged the data, and analyzed the data products. C.C.H. developed the theoretical model and advised on the literature comparison. M.A. led the ATCA follow-up and the blind emission line studies. A.W. procured and analyzed the deep LABOCA imaging. M.B. provided the cluster mass and evolution context and discussion. J.S. reimaged the calibrated data. K.A.P. preform the SED fitting. T.B.M, S.C.C., M.A., K.A.P. and A.W. made the figures. S.C.C., T.B.M., M.A., C.C.H., J.D.V., and A.W. wrote the manuscript. All authors discussed the results and provided comments on the paper. The authors are ordered alphabetically after A.W.
Author Information The authors declare no competing financial interests. Correspondence and requests for materials should be addressed to T.B.M. at tim.miller@yale.edu
Methods
1 Observations
1.1 SPT, LABOCA, and Herschel discovery and ALMA follow-up
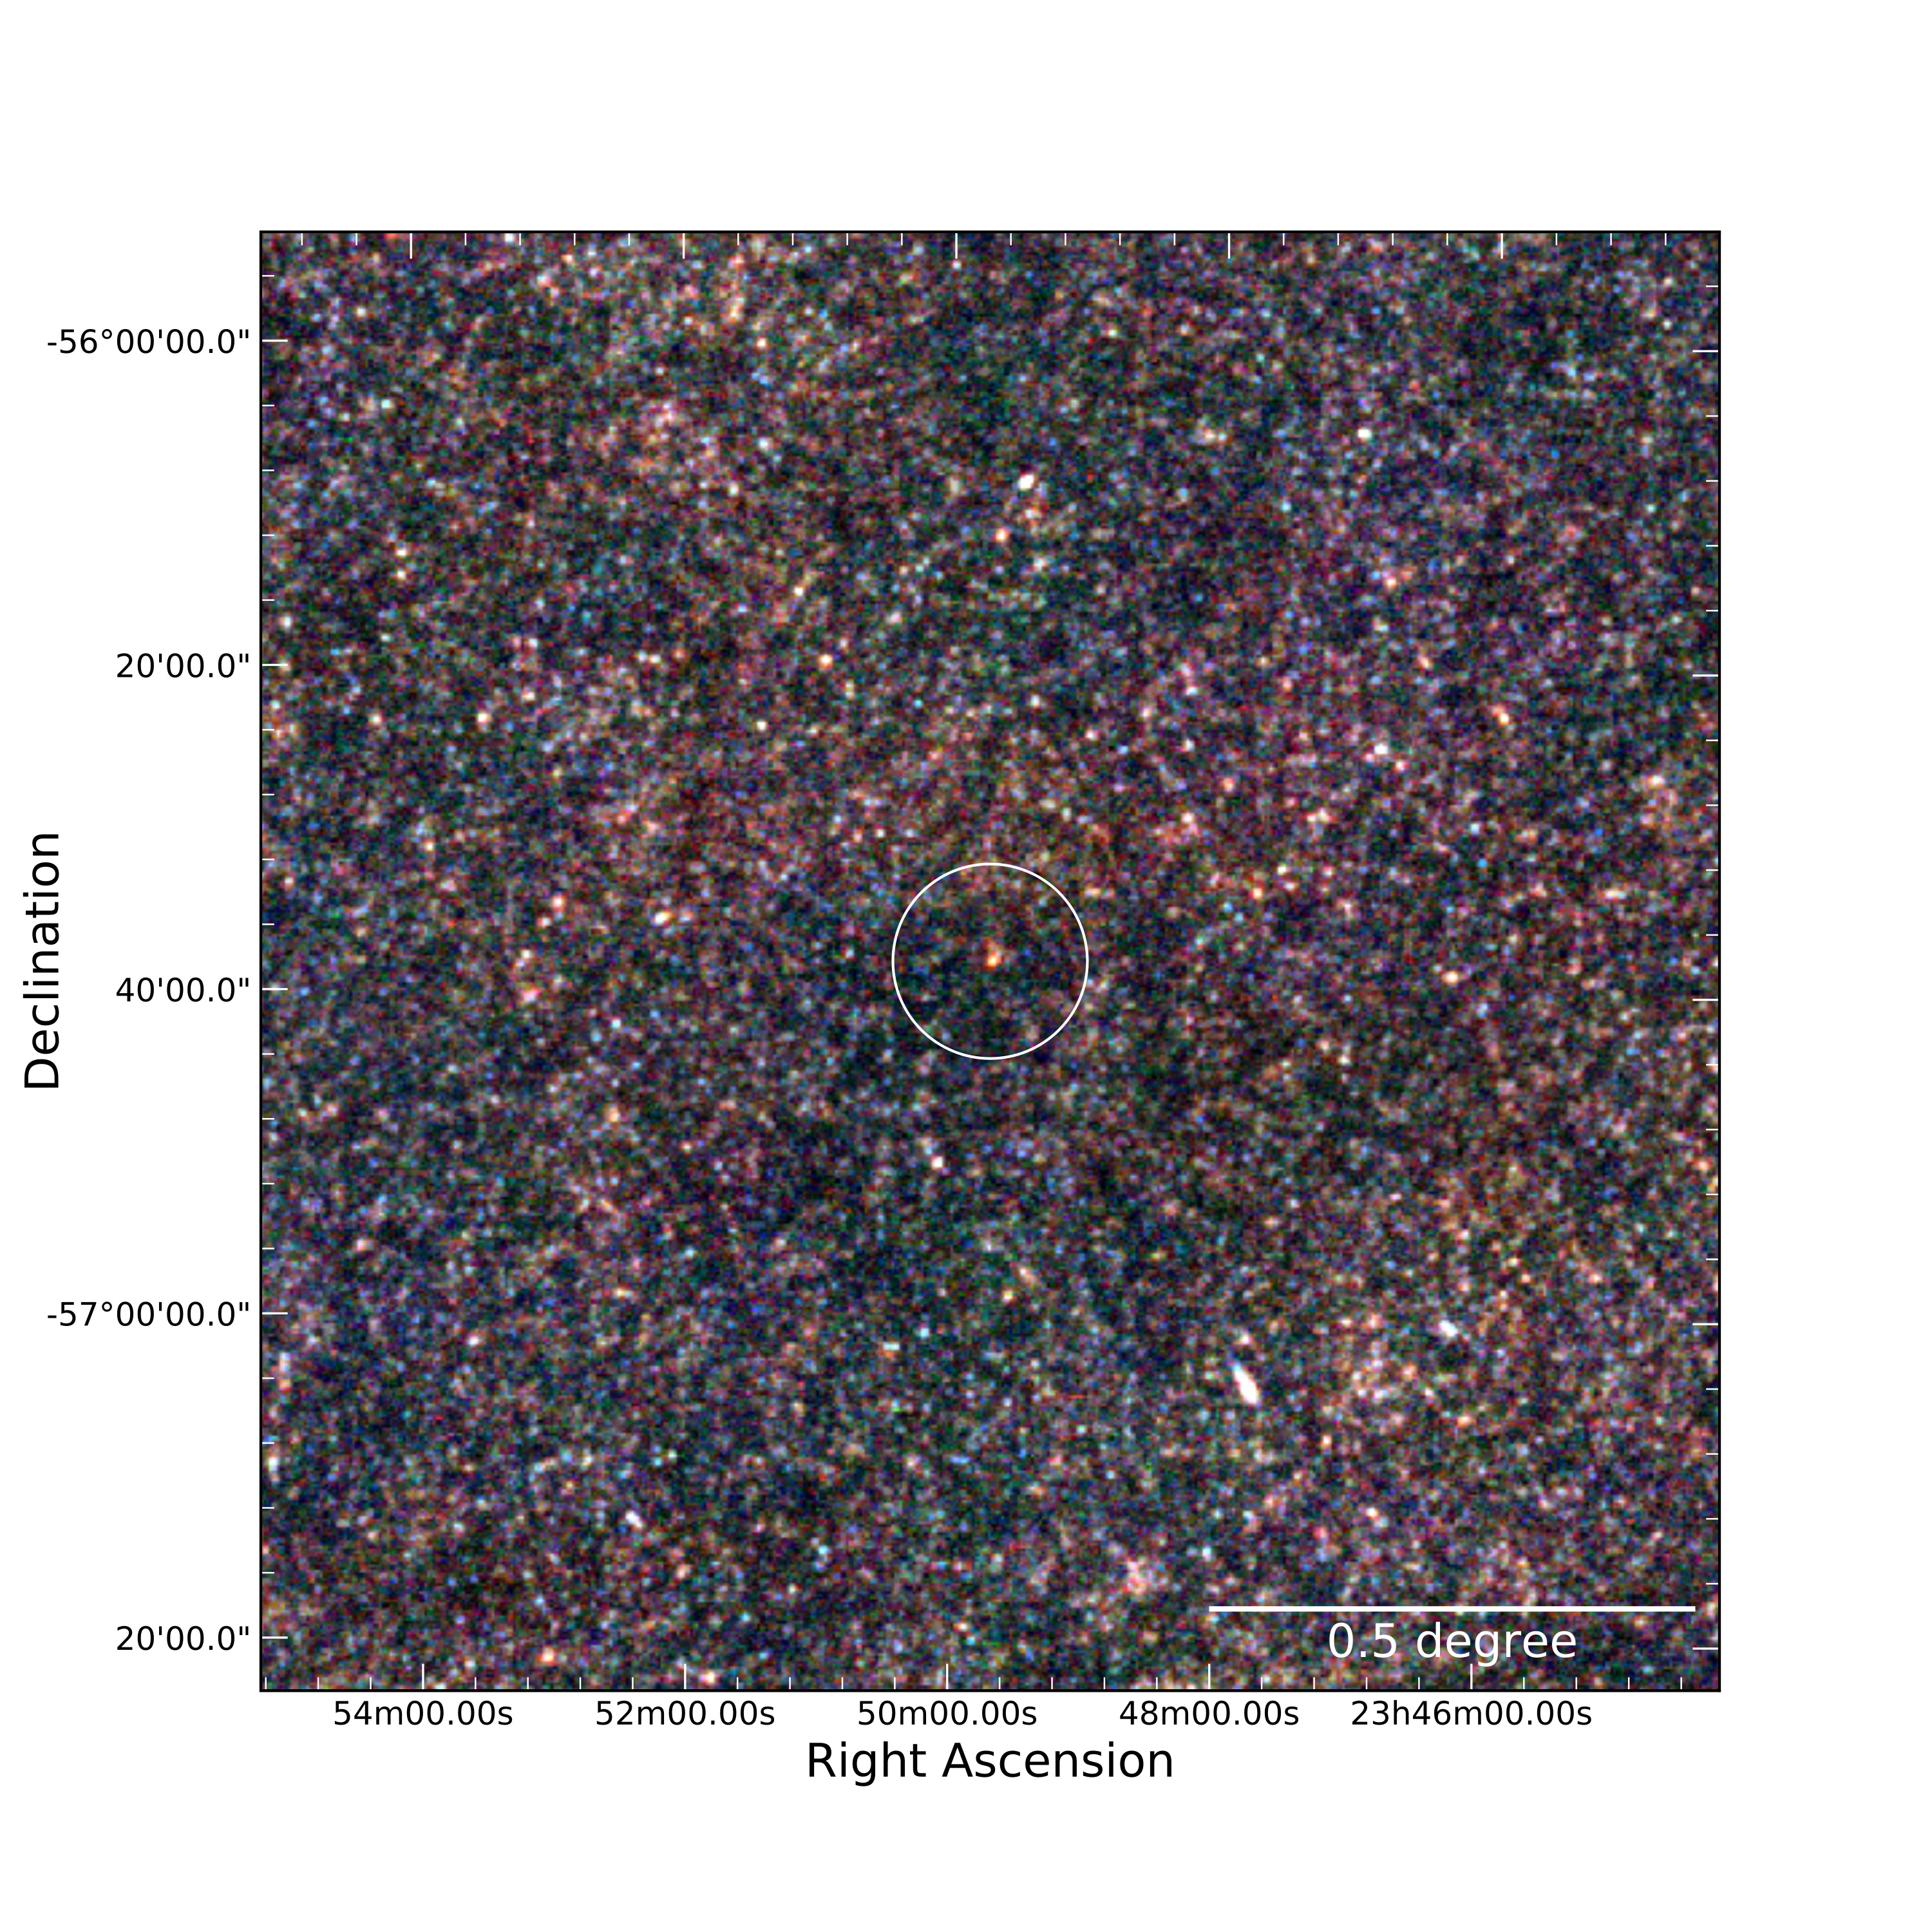
The South Pole Telescope[27] (SPT) possesses a unique combination of sensitivity, selection wavelengths (3, 2, and 1.4 mm), and beam size that potentially make it ideal for finding the active core regions of galaxy clusters forming at the earliest epochs. Finding very distant (), gravitationally lensed millimetre sources in the SPT survey is relatively straightforward, where the contrast to such distant bright sources is high relative to the weak (generally undetected) galactic foregrounds (Extended Data Figure 1). However searching for the rare SMGs in the SPT 2500 deg2 survey that are unlensed, and therefore candidates for active groups and protoclusters like SPT2349-56, involves sifting through the many gravitationally lensed sources, and typically involves multi-stage follow-up efforts using various facilities: a single dish mapping instrument like APEX-LABOCA to better localize the emission within the SPT beam, deep optical imaging to search for bright lensing galaxies, and high resolution ALMA mapping. The spatially extended sources in SPT2349-56 found with LABOCA span more than an arcmin. With deep upcoming surveys using the next generation SPT-3G receiver, this ‘extended-beam’ thermal source structure may present a unique signature of many early forming protoclusters, affording the first complete census in the early epochs of structure formation.
A shallow, wide field SPIRE image over a 100 deg2 subregion of SPT-SZ[28] reveals the red colours of SPT2349-56, and that SPT2349-56 appears to reside in something of a void in the foreground that dominates the SPIRE galaxy population. However the high redshift of SPT2349-56 means that it is not significantly brighter than many other SPIRE sources in this field, and aside from its colours, SPT2349-56 does not stand out substantially from the field despite its extreme properties. SPT2349-56 is not detected in the all sky Planck survey[29], the lower sensitivity of Planck compared with SPT being exacerbated by beam dilution in the 3′ Planck beam.
Obtaining the redshift for SPT2349-56 was beyond the scope of the original SPT-SMG redshift survey, due to the faintness of the unlensed components relative to the typical bright, gravitationally lensed SMGs found in the bulk of the SPT-SMG sample. In ALMA Cy 0 & 1, SPT2349-56 was included in the 3-mm spectral scan redshift survey[15, 30], but no lines were detected in the short min integrations with 16 ALMA antennae. In Cy 3, a deeper follow-up 3-mm spectral scan was able to tentatively identify two CO lines and a double source structure with a likely redshift , confirmed by APEX/FLASH C+ detection[17].
1.1.1 APEX - LABOCA
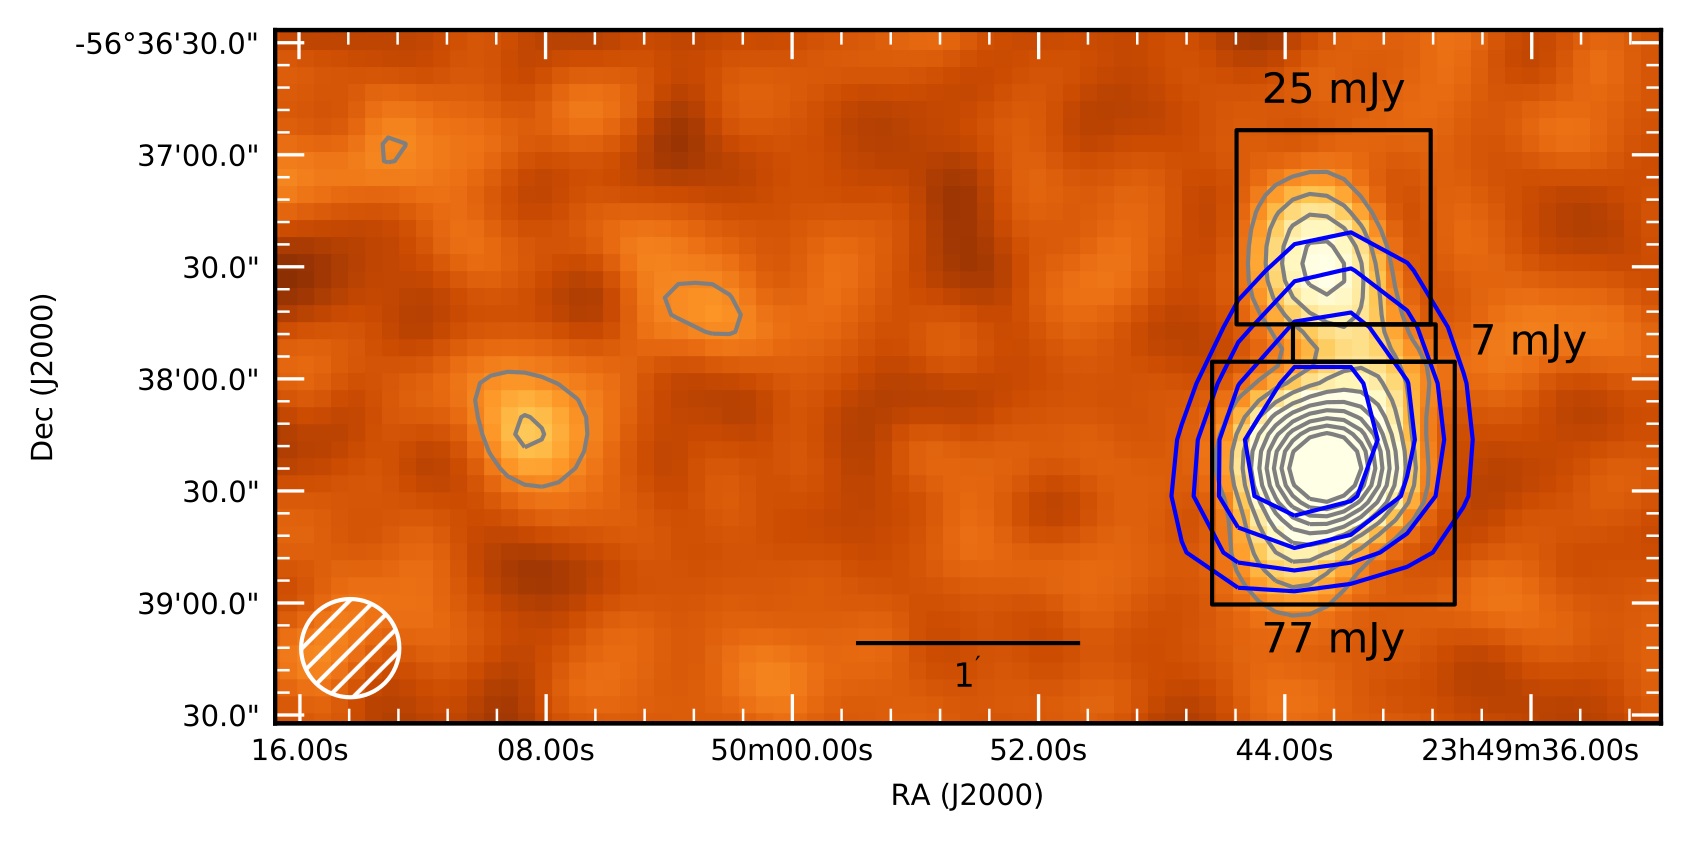
We obtained 870-m imaging of SPT2349-56 using LABOCA on the APEX telescope. A shallow image with 1.6hr integration time was observed on 27 Sep 2010 reaching mJy/beam rms. In August 2017 we obtained a deeper image (18.8h integration time, Project ID: E-299.A-5045A-2017, PI: Chapman) reaching a reaching a minimum noise level of 1.3 mJy/beam and and mJy/beam rms for 75.3 and 32.4 sq arcmin, respectively (shown in Figure 1 & Extended Data Figure 2). All observations were carried out using standard raster-spiral observations [31] under good weather conditions (PWV of 0.6 mm and 0.8 mm for the 2010 and 2017 observing campaigns, respectively). Calibration was achieved through observations of Uranus, Neptune and secondary calibrators and was found to be accurate within 8.5% rms. The atmospheric attenuation was determined via skydips every 2hr as well as from independent data from the APEX radiometer which measures the line of sight water vapor column every minute. The data was reduced and imaged using the BoA reduction package [32]. LABOCA’s central frequency and beam size are 345 GHz and 19.2′′, resolving the SPT 1.4-mm elongated source into two bright LABOCA sources.
Both LABOCA observations yield consistent calibration results with peak intensity at 21′′ resolution of 50 mJy/beam for the brighter, southern component (RA 23:49:42.70, DEC -56:38:23.4). In addition the LABOCA map reveals a second source to the north at RA: 23:49:42.86, DEC: -56:37:31.02 with a peak flux density at 21′′ resolution of 17 mJy/beam. Both sources are clearly extended even at LABOCA’s relatively coarse spatial resolution with observed source size of 28′′25′′ and 31′′24′′ for the sourthern and northern source, respectively. These components are connected by a faint bridge emission. The total 870-m flux density of the SPT2349-56 system is 110.09.5 mJy, of which 77 mJy are associated with the southern component, 25 mJy with the northern component, and 7 mJy with the connection between the components (using the sub apertures shown in Extended Data Figure 2). One additional submm source is detected at in the LABOCA image to the east of the primary source, but having blue colours inconsistent with , and not likely being a member of the extended protocluster.
1.2 ALMA
Observations using ALMA Band-3 targeted the CO(4-3) line in SPT2349-56 centred in the lowest frequency of the spectral windows adopted (86-88 GHz), taken under a Cycle 3 program 2015.1.01543.T (PI: K. Lacaille). Data was taken on June 24th, 2016 with a 47 min integration time. The array used 36 antennas with baselines ranging from 15 to 704 m, and provided a naturally weighted synthesized beam size of . Pallas and J2343-5626 were used to calibrate the flux and phase respectively. Data was processed using the standard ALMA pipeline using natural beam weighting.
ALMA Band-7 imaging (276 GHz) were obtained under a Cycle 4 program (2016.0.00236.T; PI: S. Chapman) targeting the peak of the brightest LABOCA source. Observations were obtained on December 14th, 2016 in a 40-2 array configuration with baseline lengths of 15-459 m, giving a naturally weighted synthesized beam size of . There were 40 antennas available, with total on source integration time of 22 minutes. Ceres and J2357-5311 were used as flux and phase calibrators respectively. The [CII] line ( GHz) was observed at as part of the same ALMA project on March 23rd, 2017, tuning in Band 7 to the redshifted line at GHz in the upper sideband covering 356 to 360 GHz. These observations used the 40-2 array configuration with baselines of 16-459 m, giving a naturally weighted synthesized beam size of . An on-source integration time of 14 min was obtained, and J2357-5311 was used as both the flux and phase calibrator. The data were re-processed using CASA and the standard ALMA-supplied calibration using natural beam weighting to maximize sensitivity.
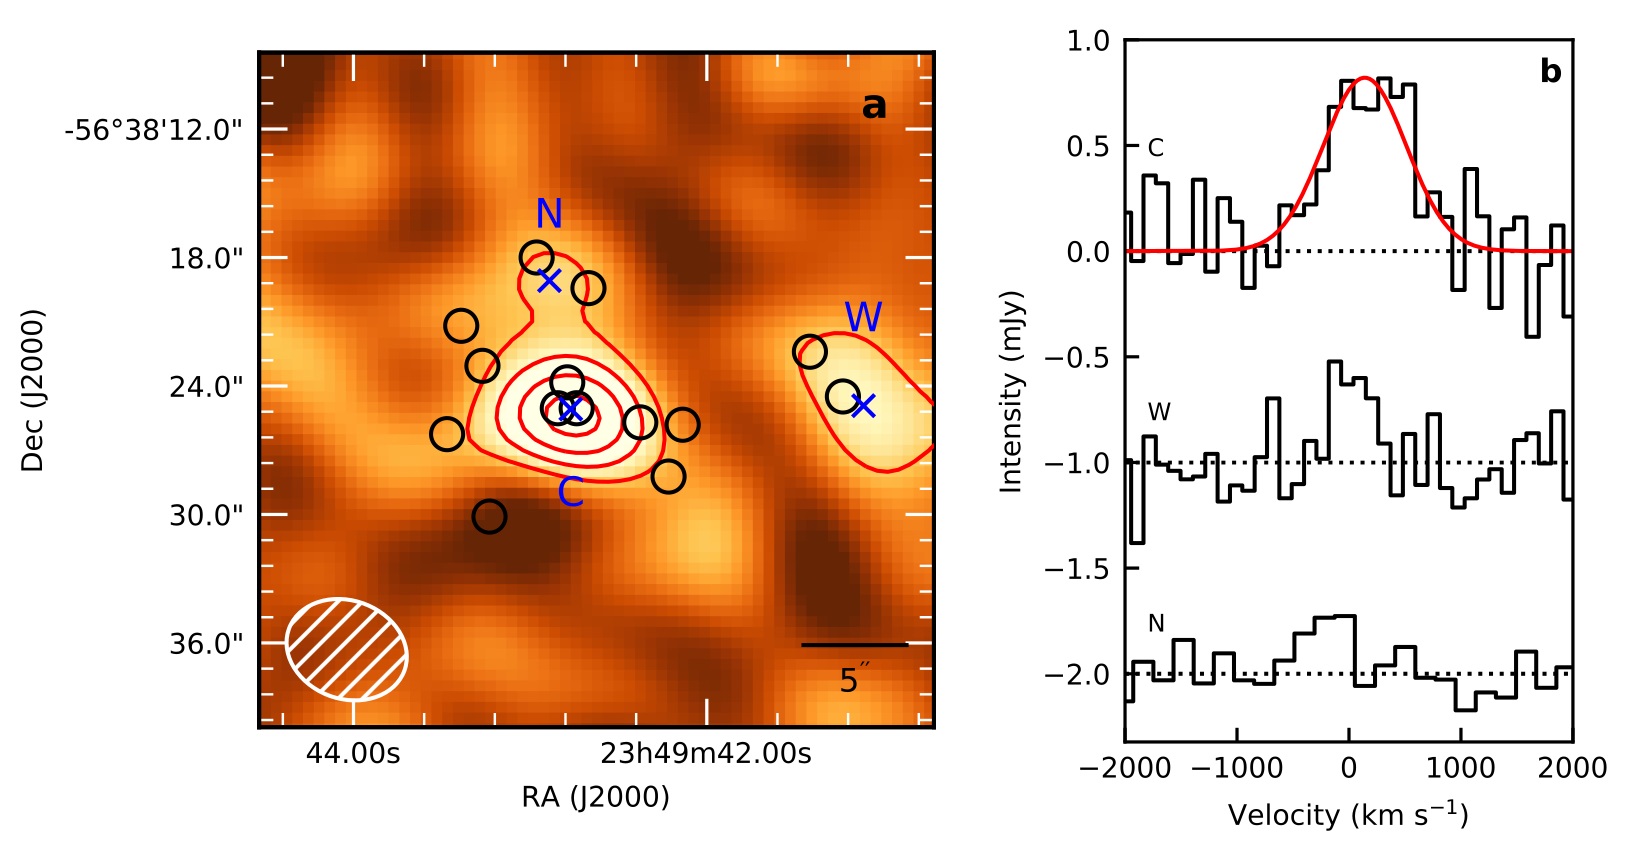
One dimensional spectra are extracted from the centroid of the line emission for each source and binned into 75 km s-1 channels. Spectra are presented in Figure 1, and are smoothed using a Gaussian filter with FWHM = 100 km s-1 for presentation. A Gaussian line profile is fit using a least-squares method, providing errors to the velocity offsets from in Table 1 and line widths in Extended Data Table 2. The continuum level is left as a free parameter in the fitting function which is then subtracted to derive line fluxes and for presentation.
1.2.1 Blind search for [CII]
We performed a blind search for [CII] line emission in the ALMA band 7 data cube toward SPT2349-56. For this, we follow the procedure used to detect line emitters in the ASPECS survey[33]. We use a data cube channelized at 100 km/s, without primary beam correction and continuum subtraction. We used the Astronomical Image Processing System (AIPS) task SERCH. This task convolves the data cube along the frequency axis with a Gaussian kernel defined by different input linewidths, subtracts surrounding continuum, and reports all channels and pixels that have a signal-to-noise ratio (SNR) over a specified limit. The SNR is defined as the maximum significance level achieved after convolving over the Gaussian kernels. We used a set of different Gaussian kernels, from 200 to 600 km/s and searched for all line peaks with SNR4.0.
Once all peaks were identified, we used the IDL routine CLUMPFIND[34] to isolate individual candidates. A full list of 68 positive line peaks with SNR4.0 were thus obtained. We quantified the reliability of our line search based on the number of negative peaks in our ALMA cube, using the same line procedure. We find 43 negative peaks with SNR5.8 and none at a higher SNR. This means that all positive line candidates with SNR6.0 are likely real (100% purity). Out of the 14 [CII] line candidates detected, all have SNR6.3 and 12 are associated with continuum detections in the ALMA data.
1.3 ATCA CO(2-1)
1.3.1 Observations
We used the Australia Telescope Compact Array (ATCA) in its H168 hybrid array configuration to observe the CO(2-1) emission line ( GHz) toward SPT2349-56 (with a primary beam size of 53′′). The observations were performed as part of project ID C2818 during 2016 October 2,3 and 11 under good weather conditions (atmospheric seeing values 90-400 m) with five working antennas.
We used the ATCA 7-mm receivers, with the Compact Array Broadband Backend configured in the wide bandwidth mode [35]. This leads to a total bandwidth of 2 GHz per correlator window and a spectral resolution of 1 MHz per channel (6.9 km/s per channel). The spectral windows were centred at observing frequencies of 43.5 and 45.0 GHz, and aimed at observing the CO line and continuum emission, respectively.
Gain and pointing calibration were performed every 10 min and 1 h, respectively.The bright sources 1921-293, 1934-638 and 2355-534 were used as bandpass, flux and gain calibrators, respectively. We expect the flux calibration to be accurate to within 15 per cent, based on the comparison of the Uranus and 1934-638 fluxes. The software package MIRIAD [36] and the Common Astronomy Software Applications (CASA [37]) were used for editing, calibration and imaging.
The calibrated visibilities were inverted using the CASA task CLEAN using natural weighting. No cleaning was applied given the relatively low significance of the CO line detection in individual channels. The final data cube, averaged along the spectral axis, yields an rms of 0.23 mJy beam-1 per 100 km/s channel with a synthesized beam size of 5.6′′ 4.5 ′′ (PA=70.4 deg) at 43.5 GHz.
1.3.2 Results
One source formally detected at the centre, which corresponds to CII/continuum sources B+C+G. This central CO source (C) is unresolved at the resolution of the ATCA observations. Other two sources are marginally detected to the West (w) and North (N) of the central source, coinciding with the location of CII/continuum sources D+E and A+K, respectively. We extracted spectra at these locations and obtained integrated line intensities, by fitting Gaussian profiles to the identified line emission.
We compute CO luminosities using the integrated line intensities and compute gas masses by assuming a ULIRG XCO factor of 0.8 (M⊙ (K km/s pc2)-1) and that the CO gas is in local thermodynamic equilibrium thus LL [38]. The results of the CO line observations are summarized in Extended Data Table 2. Collapsing the line-free spectral window along the spectral axis over the 2-GHz bandwidth, leads to a non-detection of the continuum emission down to 80 Jy/beam (3).
These results confirm the finding from CO(4-3) line that that the main reservoir (72%) of molecular gas resides in the B+C+G system, with a smaller fraction hosted at the West and North locations.
1.4 Spitzer imaging
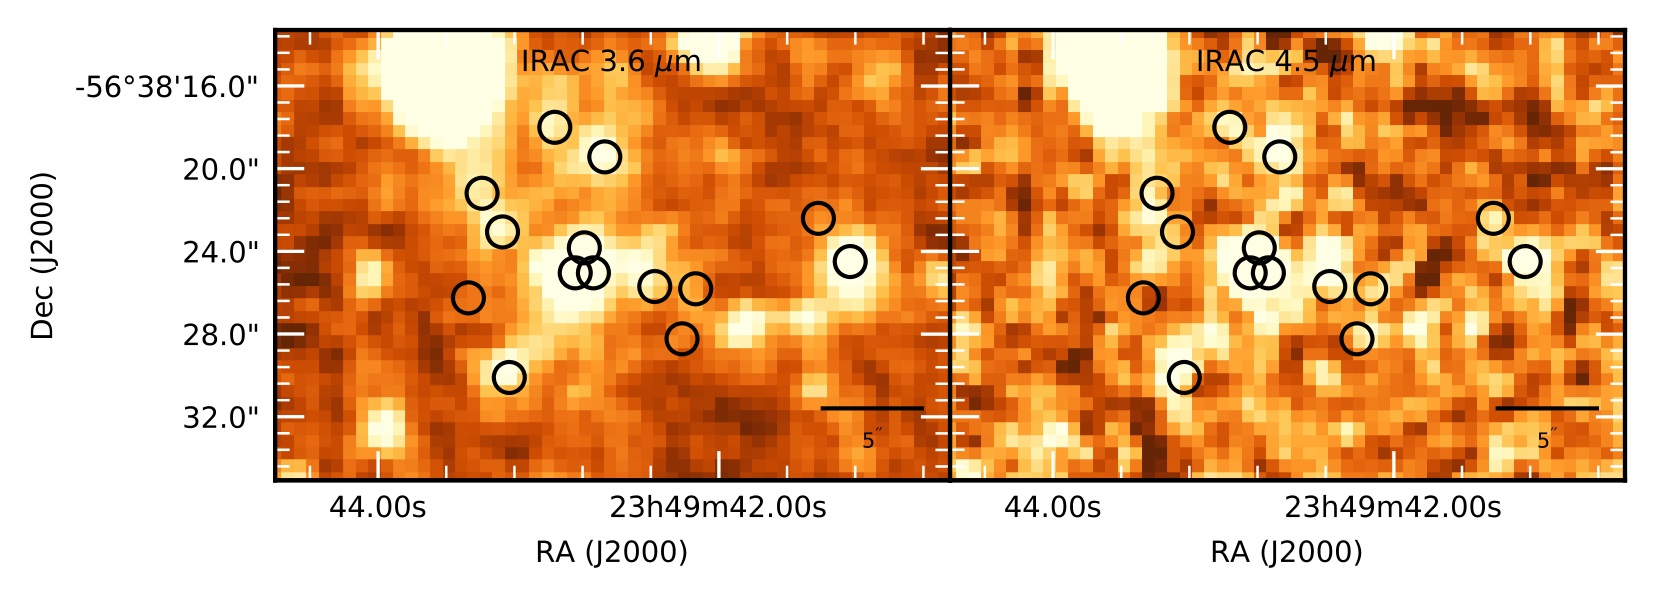
This field was twice observed at 3.6 and 4.5 m with the Infrared Array Camera (IRAC[39]) on board the Spitzer Space Telescope[40]. It was first observed in 2009 August as part of a large program to obtain follow-up imaging of a large sample of SPT-selected SMGs sources (PID 60194, PI Vieira). The observing scheme used for PID 60194 was to obtain 36 dithered 100 sec integrations at 3.6 m and, separately, a much shallower sec integration at 4.5 m. Later, in Cycle 8, the field was covered serendipitously as part of the Spitzer-SPT Deep Field survey (PID 80032, PI Stanford; Ashby et al. 2013). PID 80032 surveyed 92 deg2 uniformly in both IRAC passbands to a depth of sec. Using established techniques, we combined all exposures covering the SPT target from PID 60194 and 80032 at 3.6 and 4.6 m to obtain the best possible S/N in our final mosaics, which were pixellated to 0.5′′. Nine of the 14 sources identified by ALMA are detected in the IRAC bands at in at least one of the 3.6 or 4.5 m channels, as shown in Extended Data Figure 4.
1.5 Analysis of the surrounding field with SPIRE and LABOCA imaging
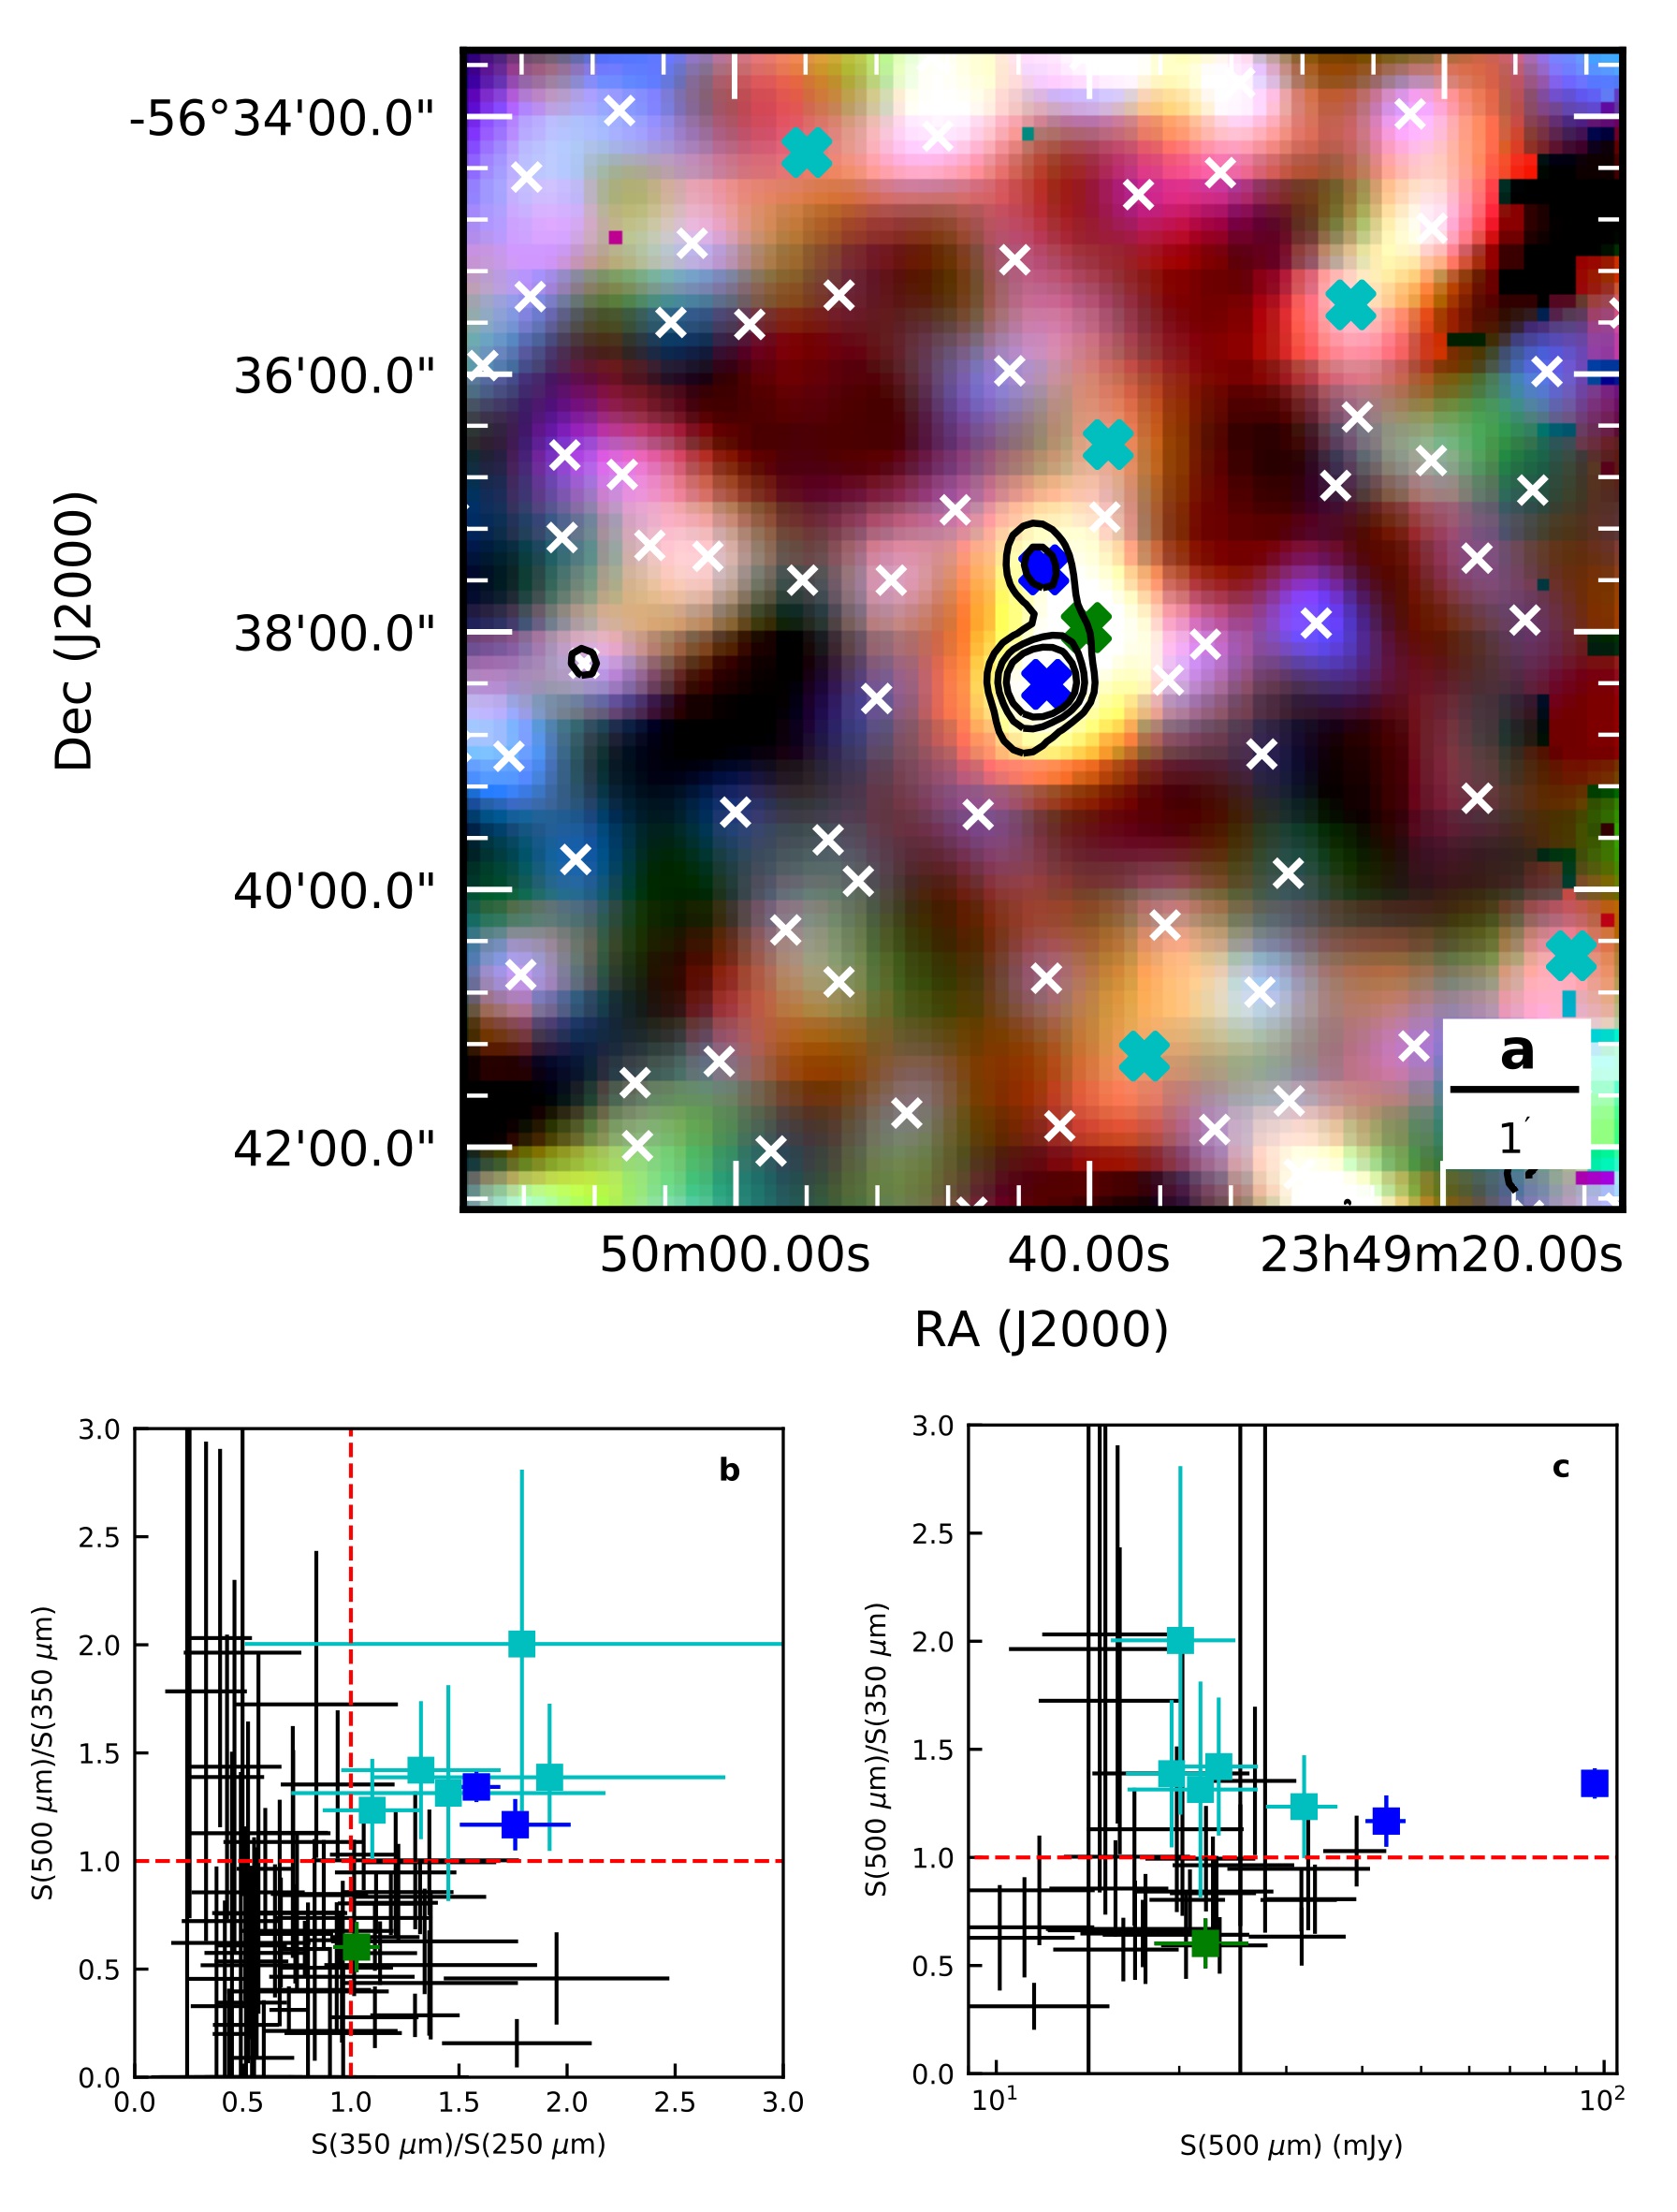
In Extended Data Figure 5, our deep SPIRE RGB image is shown with LABOCA contours overlaid. A source sample is culled from the 250 m-selected catalog (135 sources with SNR(250 m)3 in an area of 52 arcmin2), where the source peaks are best defined. To account for the large beam size difference with SPIRE (ranging from 36′′ at 500 m to 18′′ at 250 m), we employed a deblending code, using the 250 m positions as spatial priors, which provides the standard parameters as well as the covariance matrices highlighting the degeneracies (almost none at 250 m, but significant at 500 m). The code, FASTPHOT[41], takes into account these degeneracies to estimate the flux measurement errors.
Colour-colour (CC) and colour-flux (CF) diagrams are shown in Extended Data Figure 5. The CC diagram shows a 250 m-selected sample with SNR(250 m)3 and is dominated by the cosmic infrared background (blue, green colours) in the foreground of SPT2349-56. The CF diagram shows an additional SNR(500 m)3 cut to highlight just the well detected 500 m source sub-sample. These diagrams highlight the extreme and red properties of SPT2349-56, but make clear that one of the three 250 m-peaks within the SPT2349-56 LABOCA structure is very likely a foreground galaxy (green symbol highlighted in the figure shows very blue colours). Nevertheless, a full ALMA mapping of the structure is warranted given the uncertainties involved in the SPIRE deconvolution procedure.
Five red sources consistent with () are found in the surrounding ′10′ field and are candidates for additional protocluster members in an extended, collapsing structure. If all these sources were bona fide sources, this would significantly increase the total 870-m flux density (and thus the far-IR luminosity) of the cluster beyond the 110 mJy found in the central structure, making it by far the most active system known in the Universe (see Figure 2).The deep LABOCA map marginally detects the closest of the five red SPIRE sources at , consistent with expectations given the SPIRE flux densities. Full analysis of these surrounding SMGs will require additional follow-up efforts.
2 Properties, Comparisons, Simulations
2.1 Derivation of physical properties
We briefly describe our procedures for calculating various physical quantities from observables below. To derive SFR, we measure 870-m flux density directly in the lower sideband (line-free bands) of our ALMA Band-7 observations from Cycle 4, finding consistent measurements with those found in previous shallower observations[16]. We adopt an SFR-to- ratio of 150 50 M⊙ yr-1/mJy, which is typical for SMGs [42]. The uncertainty in this ratio owes to variations in the dust temperature distribution amongst the SMG population, which are primarily driven by differences in the ratio of the luminosity absorbed by dust to the total dust mass[43]. This combined with the measurement error dictates the error on the SFR shown in Table 1
Gas mass is calculated from the CO(4-3) line luminosity, which is converted to CO(1-0) luminosity using a ratio between the brightness temperatures of these lines found from the average of a sample of unlensed SMGs with multiple CO line transitions detected[44]. We use a conservative conversion factor and multiply by 1.36 to account for the addition of helium. When CO(4-3) is not significantly detected, we use our [CII] line luminosity and the average CO(4-3)/[CII] ratio for our detected sample; we denote these sources with asterisks in Table 1.
2.2 Spectral energy distribution of SPT2349-56
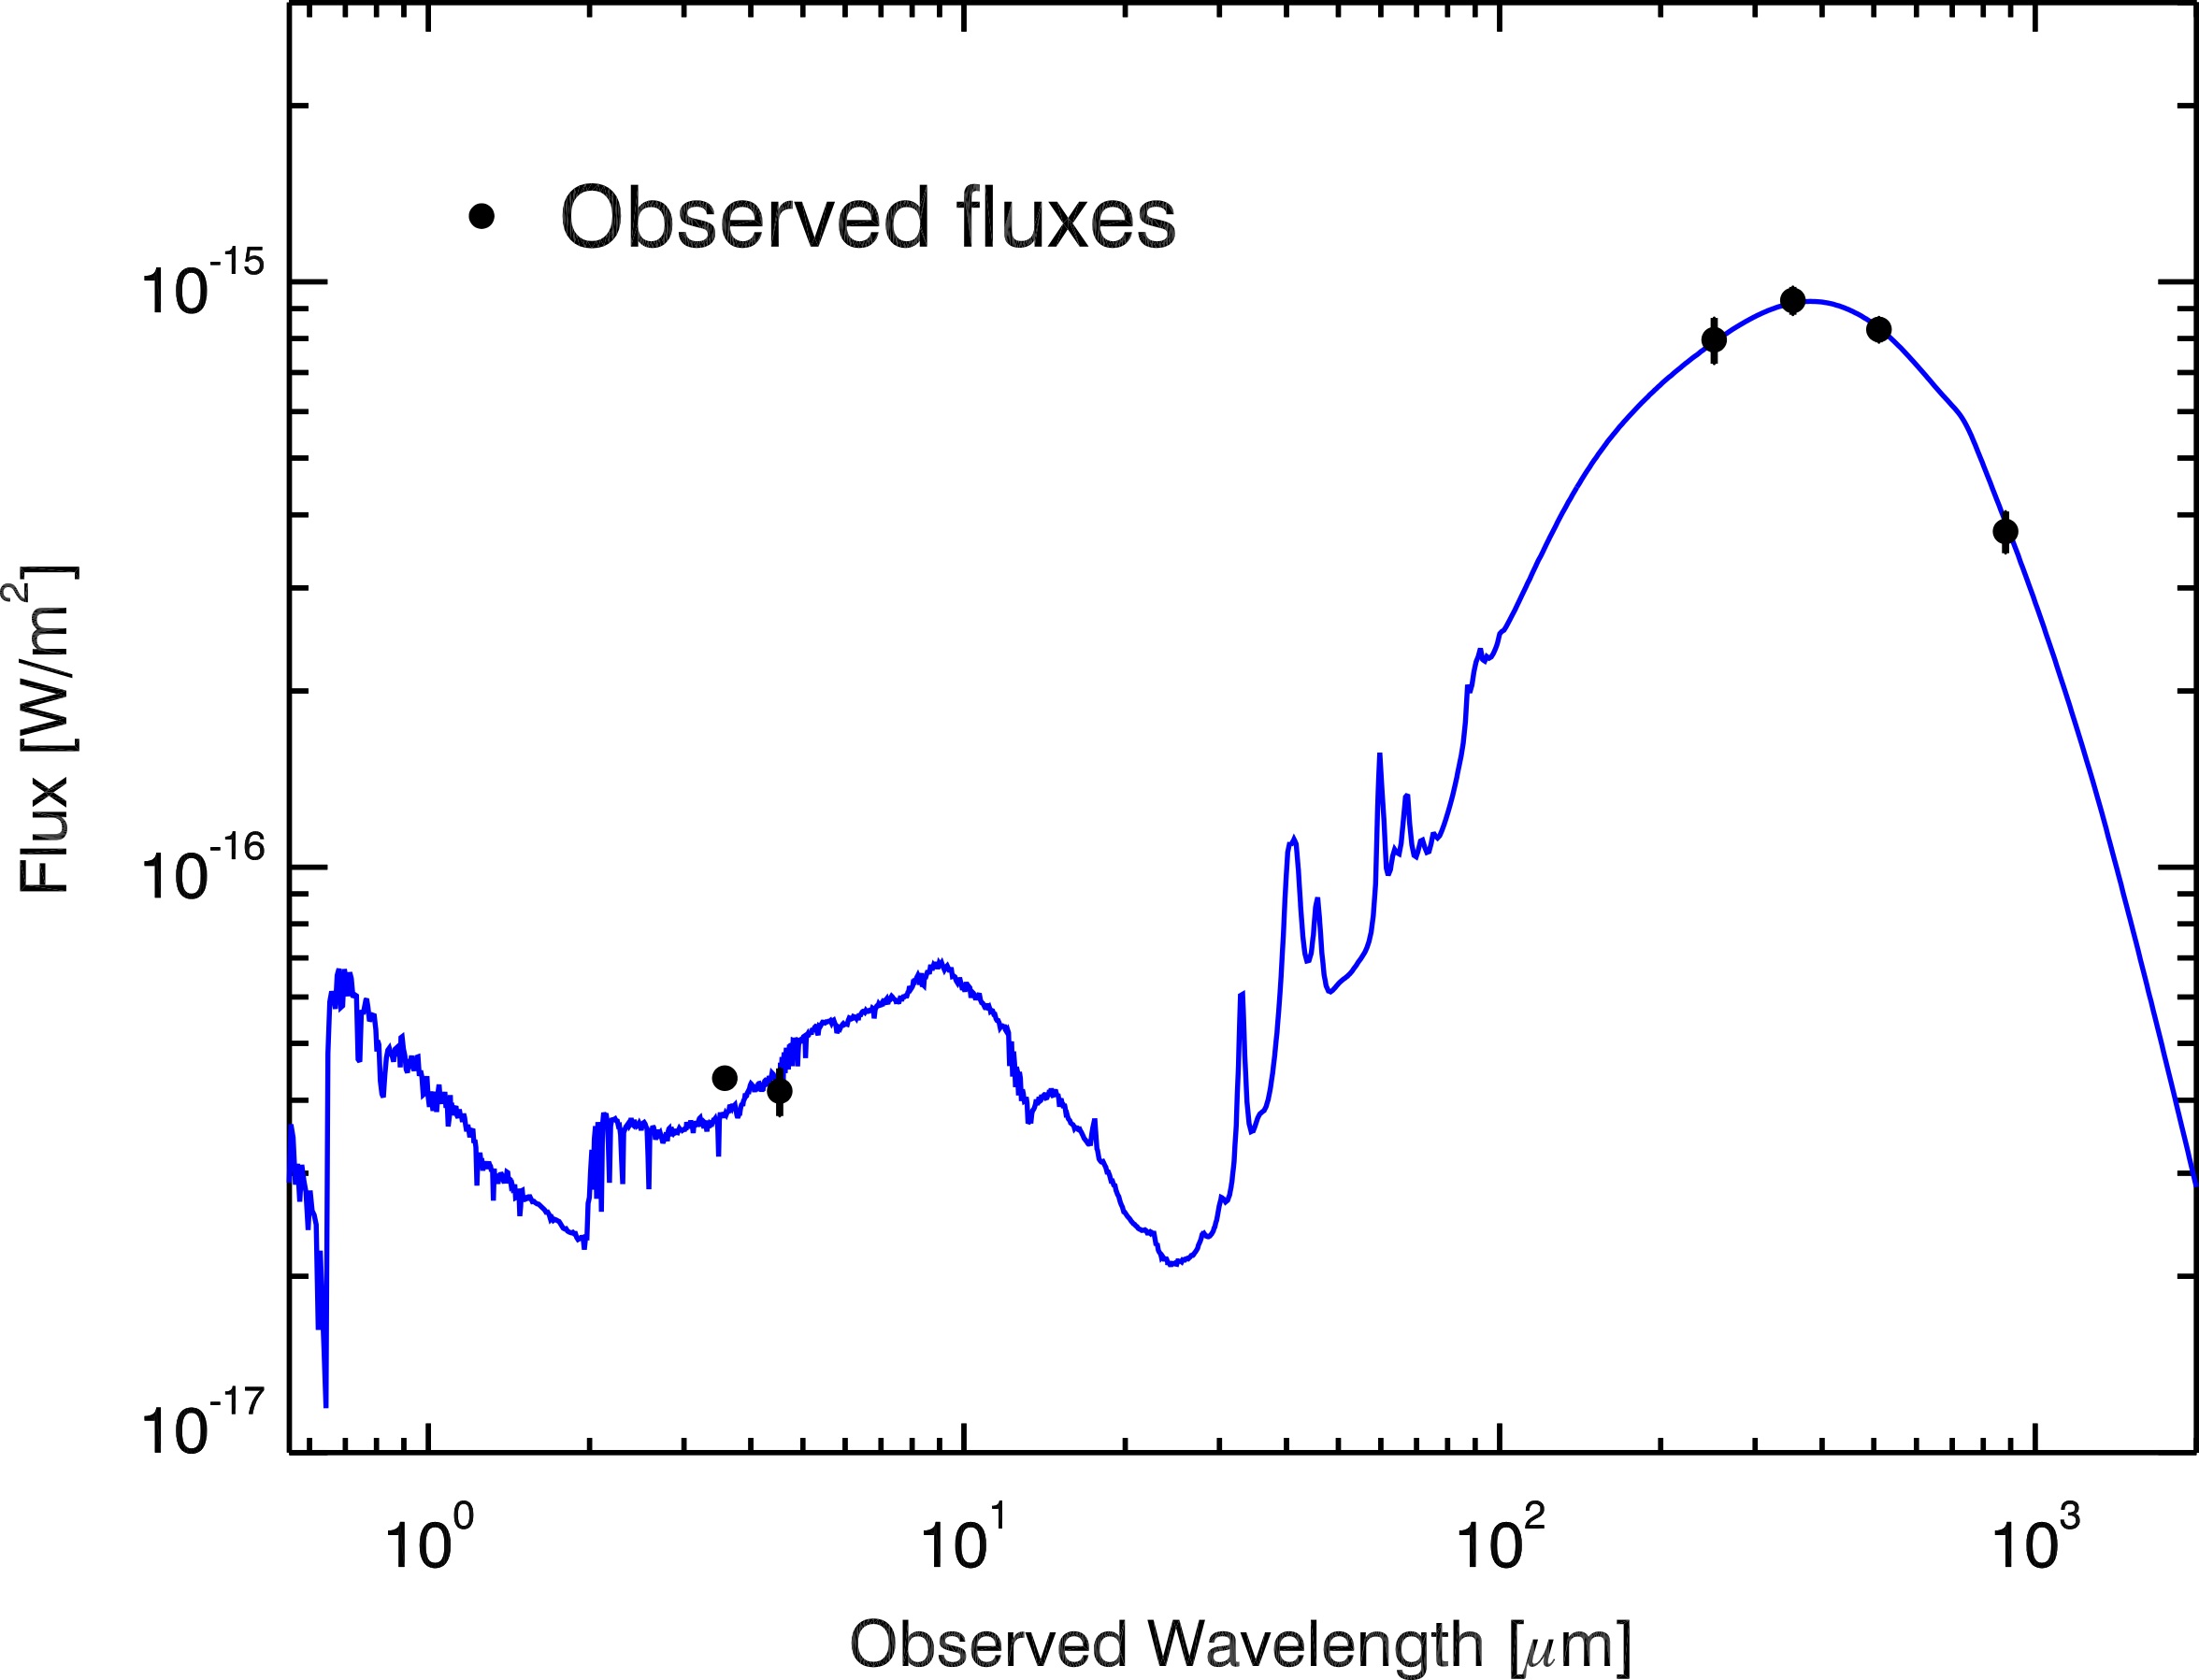
The SPT, LABOCA and SPIRE measurements resolve the SPT2349-56 structure to varying degrees, but none can isolate the core region resolved by our current ALMA observations with any confidence. We thus assemble a photometric catalog of the total SPT2349-56 flux density from 250 m to 850 mm and model the resulting total SED to estimate some global properties of the system. Although SPT does measure the flux at 1.4, 2.0 and 3.0 mm (27.9 4.6 mJy, 5.2 1.1 mJy and 0.5 0.1 mJy, respectively), we do not include these points in the SED fit since the measurements are uncertain due to the elongated structure of SPT2349-56 and difficulty with the filtering used to make the map. At IRAC wavelengths in the mid-infrared, we identify 9 SMGs detected at , and include the sum in the SED fit. We defer further analysis to followup work with forthcoming deeper Spitzer-IRAC data and follow up optical and NIR photometry.
We have used Code Investigating GALaxy Emission (CIGALE) [45, 46] for the SED fitting of the combined photometry of the source. The SED modelling assumes a single-component star formation history and solar metallicity [47]. A Chabrier [48] IMF is assumed. The resulting best-fitting SED is shown in Extended Data Figure 6. The IR luminosity (from 8–1100 m) is L⊙.
2.3 Protocluster comparison sample
To place SPT2349-56 in context and compare to other systems claimed to be protoclusters, we assemble from the literature various SMG-rich overdensities at . Although a direct comparison of the number counts (number/deg2) of SMG-overdense systems can be performed, it involves making somewhat arbitrary choices of enclosed areas and redshift boundaries. We have opted in Figure 2 to instead show a curve of growth analysis of the 870-m flux density. Only galaxies confirmed to be protocluster members via spectroscopic redshifts are considered. The data are drawn from a recent compilation[49] and original references therein.
The GOODS-N overdensity at [50, 9, 51] spans a 10′ by 10′ field in the Hubble Deep Field North containing 9 SMGs in z = 0.008. The probably of finding this large of an overdensity being drawn from the field distribution by chance is . Interestingly, only a modest overdensity of Lyman-break galaxies is found in this GOODS-N structure.
The COSMOS SMG overdensity [8] is similar to the GOODS-N structure in terms of the numbers and luminosities of the component SMGs, the angular size of the system, and the modest overdensity of LBGs associated with it.
The MRC1138 overdensity was originally discovered as an overdensity of Ly and H emitters[52]. Follow-up observations[53, 54] revealed the presence of 5 SMGs, in addition to an AGN known as the ‘Spiderweb galaxy’. This is a radio-loud AGN that resides in a large Ly- halo.
The SSA22 protocluster was one of the first discovered by observing an overdensity of LBGs[55]. It is an extremely extended structure located at , with LAEs spanning greater than 50 comoving Mpc (cMpc)[56]. Submm observations of the field have revealed a population of at least eight SMGs [57, 50, 58, 10, 59] .
The COSMOS protocluster[60] lacks sufficiently deep 850-m data to characterize the Herschel-SPIRE sources identified in the structure. We estimate 870-m flux densities by taking their published (integrated over 3–1100 m) and use the SED of Arp 220 to estimate , finding that L⊙corresponds to = 1 mJy at . For the SSA22 protocluster, we use the measured 870-m flux density when available and otherwise estimate it from the 1.1-mm flux using a standard conversion at of S = 2 S. To create the curves of growth for Figure 2, the centre of each protocluster is defined by computing the median RA and DEC of all submm sources. We checked that adjusting the centres of the curve of growth tracks randomly by did not boost the curves by more than 10%, demonstrating that the curves of growth for the literature SMG overdensities are insensitive to the adopted centre.
Recently, there have also been detections of SMG overdensities at . The first, GN20, at , was discovered through the serendipitous detection of CO(4-3) from two SMGs[61], with two further SMGs detected subsequently[62]. An excess of -band dropouts is also observed in this structure, several of which are spectroscopically confirmed to lie at . HDF850.1 contains a single SMG, a QSO, and 11 spectroscopically confirmed galaxies. The SMG has a confirmed redshift of [63]. The AzTEC-3 overdensity is centred on a single SMG at , with 12 spectroscopically confirmed optical galaxies at the same redshift. This is a relatively dense structure, with most of the galaxies residing within a circle 1′ in diameter. The most luminous example at , SMM J004224, was recently found from the Herschel surveys[23], with several additional 870m sources in the surrounding field. In Fig. 2 we plot, as an extension, the flux from the satellites which have observed SPIRE colors consistent with [64].
Overdensities of SMGs and optical galaxies have also been found around high-redshift radio galaxies (HzRGs)[65], continuing to confirm HzRGs as useful beacons of structure forming in the early Universe. However none of these systems come close to the level of overdensity found in SPT2349-56, and furthermore, they suffer from the bias inherent in targeting these sources, namely, that one or more protocluster members have to be radio-luminous.
There have also been discoveries of compact binary HyLIRG systems, the most luminous of which is the source HATLAS J084933 [66], with others approaching this luminosity[67, 68]. In each of these systems, the dynamics and SFRs are dominated by two SMGs, but there is no strong evidence of any surrounding protocluster in the form of an excess of galaxies selected optically or in the submm. In one case[68], there is evidence for a relative void around the structure. These systems may simply be instances of very rare events in fairly typical (but still massive) halos[69], analogous to hyper-luminous quasars[70].
Theoretical studies of N-body simulations have shown that the progenitors of dark matter halos with masses M⊙ should extend to effective radii of cMpc at .[12, 26] Since the overdensities listed above are mostly concentrated in small areas, it is difficult to asses their exact evolution or compare them easily to simulated structures. Interpreting a small overdense region at high-redshift as a ‘protocluster core’ is certainly prone to misinterpretation, and small overdense regions at high redshift can evolve into halos spanning a range of masses at the current epoch[12]. These authors suggest investigating if an overdensity extends to larger scales ( cMpc) to better determine whether it will form an M⊙cluster. However this is difficult at high redshift because the excess of galaxies will be less pronounced on larger scales, and it is challenging to detect high-redshift, low-luminosity galaxies.
To assess the evolution of SPT2349-56 we also compare to a selection of the highest mass galaxy clusters at lower redshift (z ). XMMU J2235.3[71] and XLSSC 122[2] were both discovered in x-ray surveys with masses derived from the x-ray light profile.IDCS J1426.5+3508[3, 72], JKCS5041[73], CL J1449+0856[74, 75] and CL J1001+0220[1] were discovered as overdensities of massive red galaxies and have corresponding x-ray detections. Masses for all are estimated using these x-ray detections and consistent with dynamical masses estimated using the velocity dispersion. We also show the sample of clusters discovered in the 2500 square degree SPT survey using the Sunyaev-Zel’dovich effect, with mass estimate based on the velocity dispersions[76].
2.4 Geometry and Dynamics
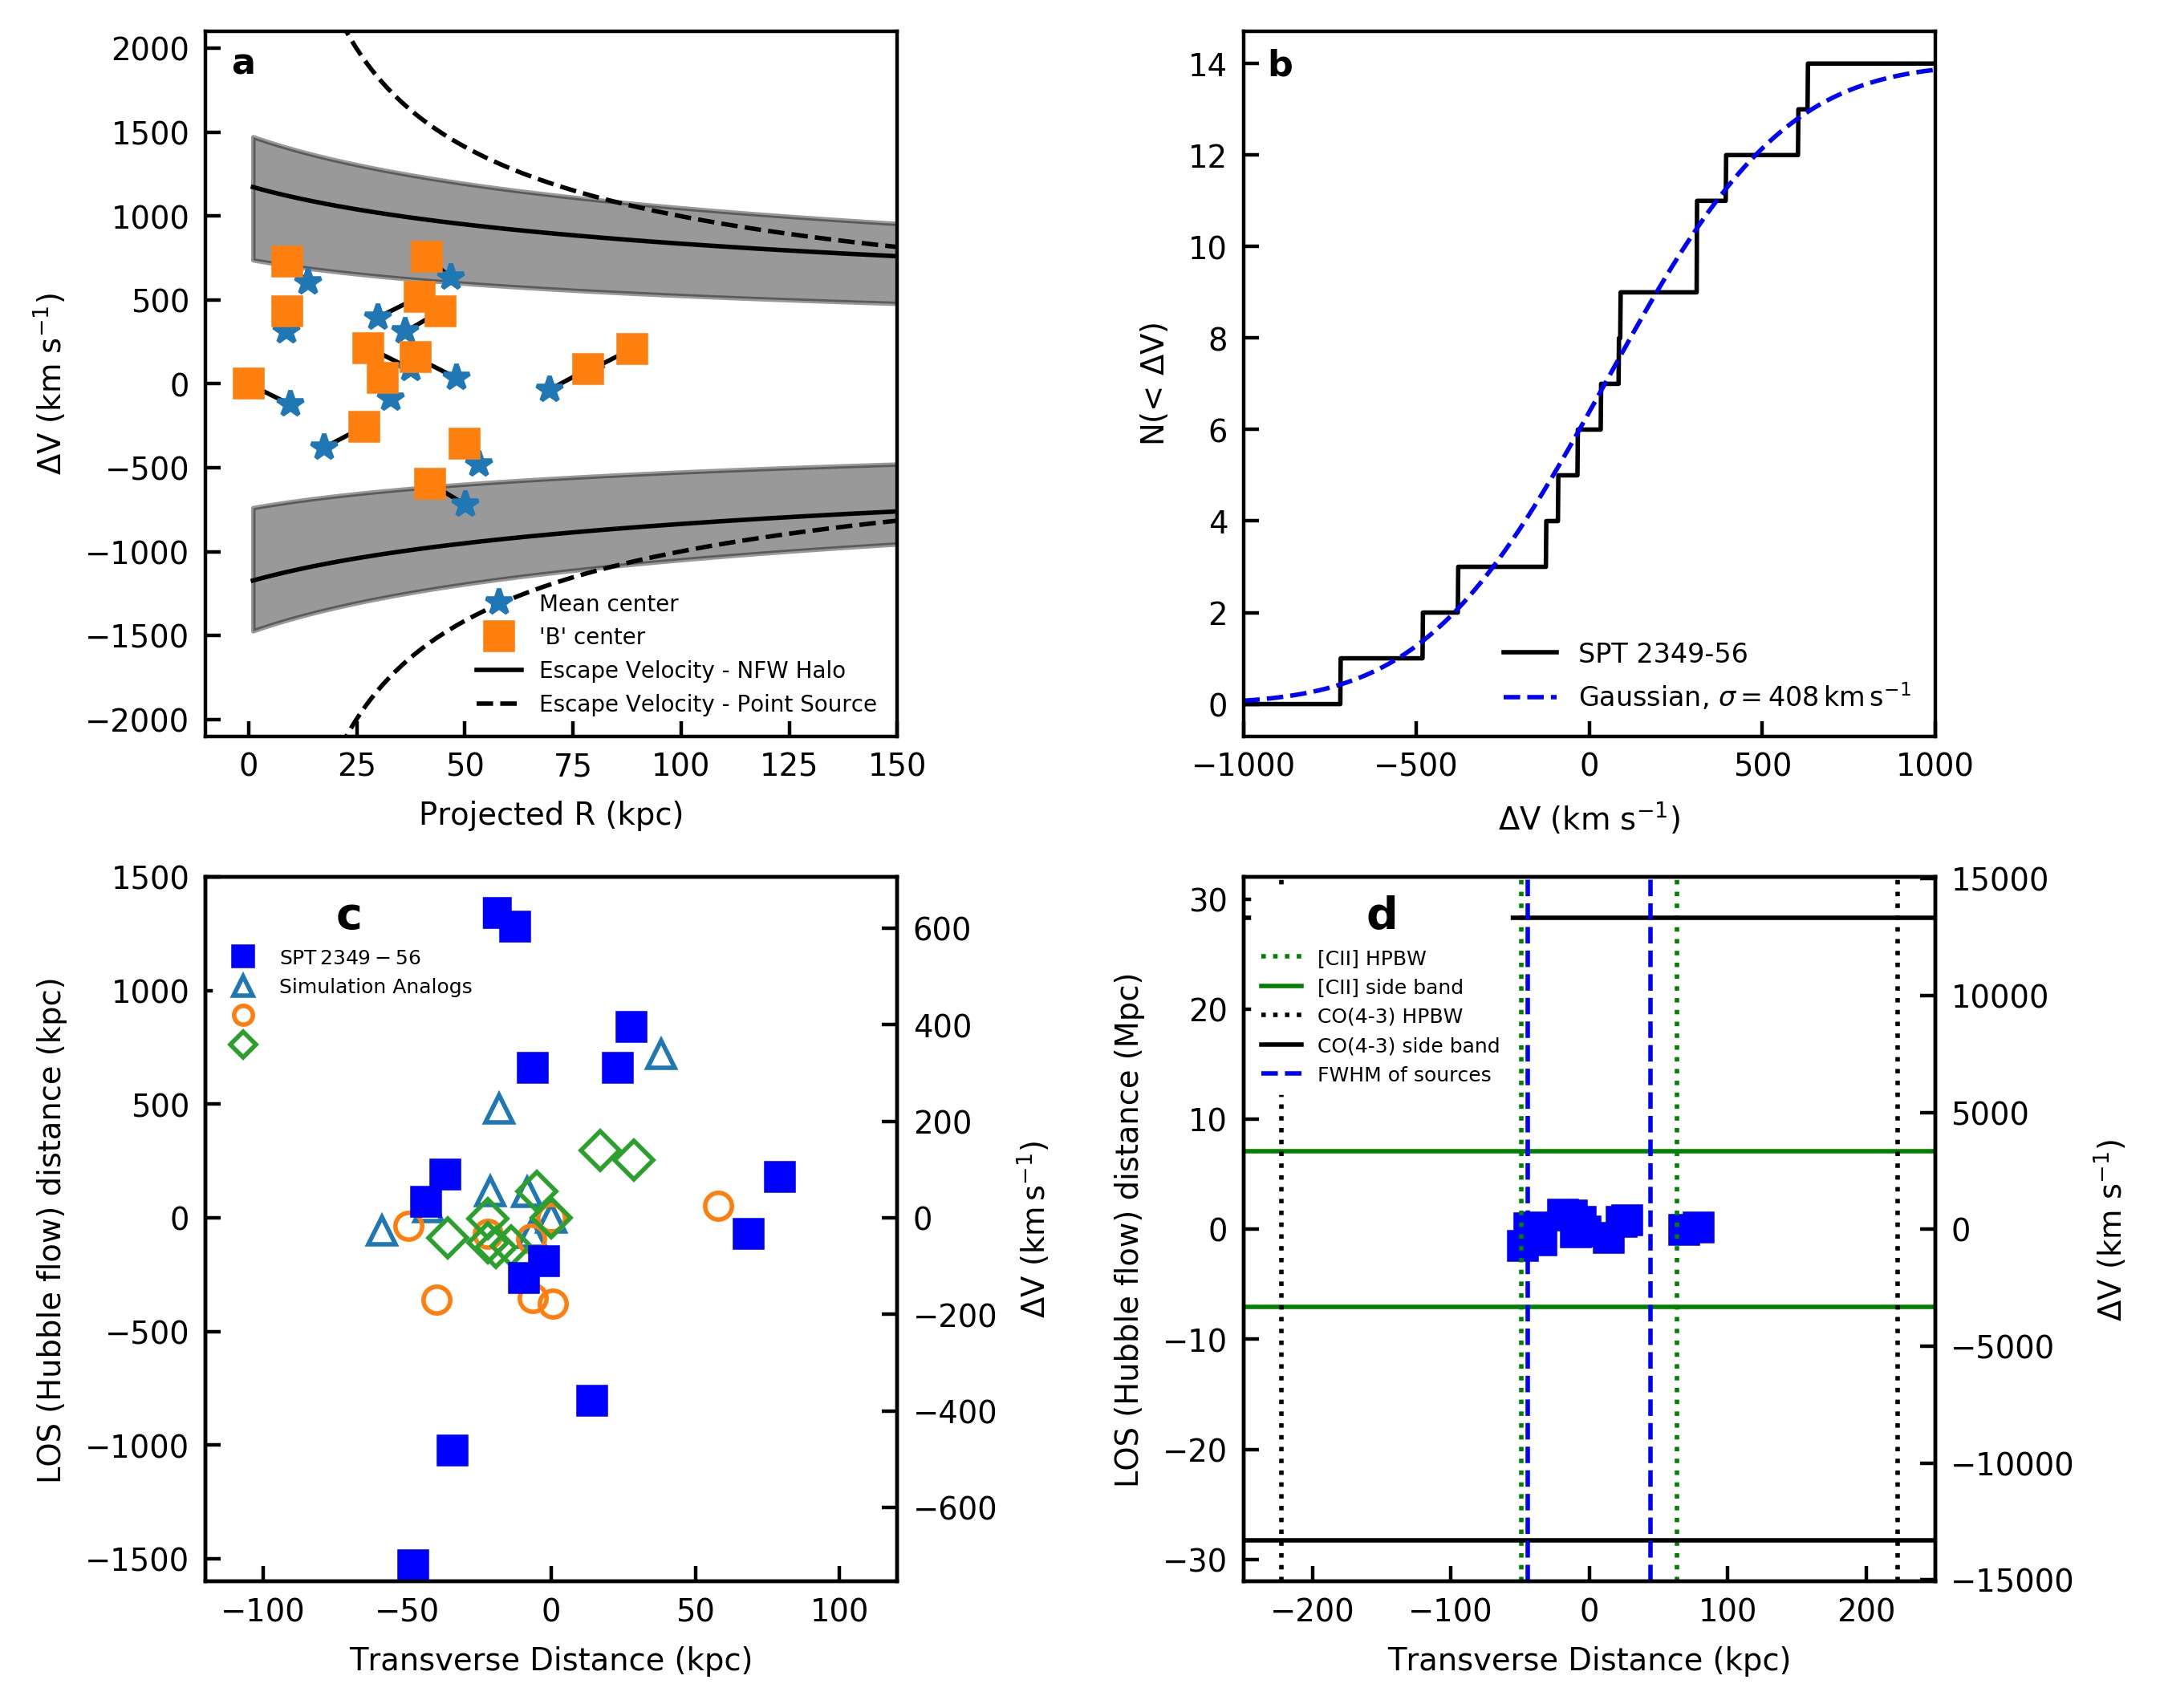
In Extended Data Figure 7 we investigate the geometry and kinematics of the SPT2349-56 system. By analysing vs. projected radius for our sample of 14 galaxies it is clear that, even with our most conservative mass estimate, at least 12 of the 14 galaxies appear bound. We show the escape velocity as a function of radius for a point source and NFW profile with a mass of . The NFW profile assumes a virial radius of 200 kpc and concentration of 5, typical values of massive halos at this epoch, found in N-body simulations described in § 2.5. Even if the projected radius only accounts for a fraction of the true physical distance (i.e. separated along the line of sight) it is likely that most of the galaxies with low relative velocity () will still be bound and eventually collapse into a single galaxy. The cumulative distribution of relative velocities is also shown, alongside that of a Gaussian distribution with .The observed distribution is smooth and well fit by a Gaussian. The relative kinematics of the 14 galaxies is consistent with most, if not all, members being mutually bound with SPT2349-56 following a Gaussian distribution characteristic of a virialized system.
An alternative interpretation of this system is that we are observing individual galaxies, or separate less massive halos along a filament aligned with our line of sight. The probability of this occurring is potentially boosted by our selection technique, since the beam size of SPT is approximately 1′. We are preferentially sensitive to structure on this scale, and require several of the most luminous galaxies found in the Universe together in the SPT beam to exceed our detection threshold.
To explore this possibility, we also show in Extended Data Figure 7 the most extreme interpretation of SPT2349-56 where none of the velocity offsets are peculiar, and the physical distribution of the SPT2349-56 galaxies is represented by the relative velocities being entirely due to cosmic expansion rather than peculiar motions. In this case the galaxies of course are maximally separated along a (proper distance) 3Mpc filament compared to their 130kpc maximum tangential extent. However, this cannot be the true distribution, and a more realistic interpretation would entail some 20-30% of velocities being Hubble flow (600-900pc extent), and the remainder representing peculiar motions. (Note that this would be true for any massive halo at this epoch given the expected velocity dispersion of and Hubble constant at this epoch of .) This explanation, if substantiated, would alter our interpretation of the system, specifically decreasing the mass estimate as the velocity offsets are not due to peculiar motions and the system is not virialized.
However, given the observed kinematics and spatial configuration of the galaxies discussed above, we argue that SPT2349-56 is less likely to consist of multiple groups, widely separated on a line of sight filament. To further back up this claim, we perform a systemic search for similar filamentary structures in the N-body simulations described in § 2.5. We first search for groups at with more than 8 galaxies that have a projected radius of kpc but can be extended up to Mpc along the line of sight. There are three such systems found in our 1 cGpc3 simulation, and they are also displayed in E.D. Fig. 7 showing their geometry. All three of these analogous systems in the simulation have total halo masses of . None are extended significantly past 500 kpc, implying that at , there are no substantially extended filaments hosting massive galaxies comparable to even the gas masses our SPT2349-56 ALMA galaxies in the simulation. These simulated structures that we have found are not filaments – they are close to collapsed structures which are slightly cigar-shaped, and while SPT2349-56 could in principle be distributed like this, it does not fundamentally change our discussion in the paper. (We also note that we are plotting 2 different things in E.D. Fig. 7 velocity offsets for 2349 and actual geometry for the simulation galaxies.) These results further suggest that most of the velocity offsets in SPT2349-56 galaxies are truly mostly due to peculiar motion rather than line of sight projection. At least one of the simulation systems found appears to be chance projections of multiple groups, but it has a characteristically different distribution. The system is found to have multiple smaller groups with , reflecting their smaller masses, separated in velocity space by .
We also note that a filamentary structure feeding a halo should have a characteristic width of 200 kpc - 400 kpc [77, 78] compared to the 80 kpc (FWHM) width we find for our 14 ALMA galaxies. This is suggestive that even with a direct line-of-sight view down a filament, the configuration is far more concentrated than one would infer based on the typical size of filament. We then ask what sort of environment a kpc wide filament (consistent with our SPT2349-56 galaxies) would connect, and infer a typical halo mass of halo [77] . Given that the SPT2349-56 galaxies contain at least this much mass entirely in their cold gas (as we have adopted the lowest plausible conversion factor), and are likely hosted by haloes at least twice as large as this, it becomes somewhat contradictory that they could be found along a filament that is connecting a significantly less massive halo.
A further important piece of evidence against these 14 galaxies being a filament is that we find no additional sources in the surrounding spectral windows in either side band, both in the band 7 and band 3 ALMA data (Extended Data Figure 7 - d). While all 14 sources are clustered within 1500 km s-1 of each other, our full frequency coverage extends over relative velocities of 6500 km s-1 (for [CII]) and 27,000 km s-1 (for CO(4-3)), or many tens of Mpc line of sight distance. If SPT2349-56 was actually an elongated filament, one might expect to see a distribution of sources over a much larger fraction of our observed frequency bandwidth. Although we can not rule out the possibility that we are observing multiple galaxies along our line of sight, the observed geometry and kinematics suggest SPT2349-56 consists of a single group of mutually gravitationally bound galaxies.
Another way to assess the configuration of this system is by employing the Millennium Simulation [4] database, using the implementation of the [79] galaxy-formation recipe. We search the model output at for galaxies with a total baryonic mass in excess of M⊙, consistent with the combined mass of gas and stars estimated for the brightest ALMA-resolved galaxies in SPT2349-56. We use this total baryonic mass cut as it means we are less sensitive to the details of the early star-formation histories of galaxies in the model. We find only one galaxy in the comoving-Mpc3 simulation volume at with a total baryonic mass above M⊙. Half of the baryonic mass in this model galaxy is in stars and it has a M⊙ black hole. Moreover this galaxy is the central galaxy of a M⊙ halo, the optimal environment to find merging galaxies according to simulations[80]. Searching the environment of this system we find another four massive galaxies are distributed across a 0.5-comoving-Mpc-diameter region around the central galaxy, with baryonic masses of M⊙ (% of the primary). By redshift zero these galaxies are all predicted to reside in a M⊙ halo, consistent with our other assessments of the outcome of this system.
2.5 Simulations
To further place SPT2349-56 in context, we compare with the predictions of a theoretical model for SMG overdensities.[81, 69] We employ the MultiDark[82] N-body simulation, which is one of the largest (2.91 Gpc3) available N-body simulations that still resolves SMG-like halos ( M⊙). The and snapshots, which are the available snapshots closest in redshift to SPT2349-56, are analyzed. Halo catalogs were created using the Rockstar halo finder[83], and stellar masses are assigned to dark matter halos using a relation derived based on sub-halo abundance matching relation[84]. To assign SFRs, it is assumed that the distribution of specific SFR (SFR per unit stellar mass, hereafter SSFR) is the sum of two Gaussians, corresponding to quiescently star-forming and starburst galaxies [85]. The median SSFR value is based on the abundance-matching-derived relation[84], and the starburst fraction and the widths of the Gaussian distributions are set based on observations of massive, high-redshift star-forming galaxies similar to the members of SPT2349-56[85]. is estimated from stellar mass using empirical gas fraction and metallicity relations[86]. Once SFR, , and values are assigned to each halo, is calculated using the following fitting function, which was derived based on the results of performing dust radiative transfer on hydrodynamical simulations of both isolated and interacting galaxies[87, 81]:
| (1) |
where is the 870-m flux density, SFR is the star formation rate, and is the dust mass. Scatter of 0.13 dex is included when applying the relation.
Once has been assigned to each halo, we search the entire simulation volume for the most luminous regions. We begin at each independent halo and calculate the total of all halos within a given projected radius and LOS distance along a given axis of this halo. We use a line of sight distance of 1 Mpc for the snapshot and 2 Mpc for the snapshot reflecting the Hubble constant at each epoch and the expected velocity dispersion of . For each value of , we record the largest total obtained (across all halos). One hundred Monte Carlo iterations are performed for each snapshot; in each iteration, galaxy properties are re-assigned, drawing from the distributions described above. The shaded region in Figure 2 shows the entire region spanned by the 100 realizations of the maximum vs. area curves. To compare to SPT2349-56 to lower redshift proto-clusters we preform a similar analysis on a snapshot at with 20 Monte Carlo iterations.
| Source | SFR | ||
|---|---|---|---|
| [km s-1] | [M⊙ yr-1] | [ M⊙] | |
| A | 90 35 | 1170 390 | 12.0 2.1 |
| B | 124 31 | 1227 409 | 11.2 2.0 |
| C | 603 12 | 907 302 | 6.7 1.2 |
| D | 33 40 | 530 182 | 8.4 1.5 |
| E | 84 21 | 497 179 | 4.8 0.9 |
| F | 395 82 | 505 169 | 3.4 0.7 |
| G | 308 42 | 409 137 | 2.9 1.3† |
| H | 719 28 | 310 105 | 4.4 2.0† |
| I | 310 78 | 268 91 | 2.2 0.5 |
| J | 481 35 | 243 85 | 2.2 0.5 |
| K | 631 12 | 208 71 | 3.1 1.4† |
| L | 379 18 | 122 43 | 3.3 1.5† |
| M | 34 21 | 75 34 | 1.2 0.6† |
| N | 90 25 | 64 29 | 1.0 0.5† |
‡ Velocity offsets relative to the mean redshift, z = 4.304
† [CII] line used to derive Mgasas CO(4-3) is not detected
| Source | RA (J2000) | Dec (J2000) | CO(4-3) S dv | CO(4-3) | [CII] S dv | [CII] | ||
|---|---|---|---|---|---|---|---|---|
| [h:m:s] | [d:m:s] | [mJy] | [mJy] | [Jy km s-1] | [km s-1] | [Jy km s-1] | [km s-1] | |
| A | 23:49:42.67 | 56:38:19.3 | 4.63 0.04 | 7.8 0.1 | 0.99 0.03 | 376 46 | 8.81 0.26 | 354 30 |
| B | 23:49:42.79 | 56:38:24.0 | 4.35 0.04 | 8.2 0.1 | 0.92 0.03 | 341 38 | 7.53 0.22 | 314 28 |
| C | 23:49:42.84 | 56:38:25.1 | 2.69 0.04 | 6.0 0.1 | 0.55 0.02 | 154 13 | 4.43 0.17 | 160 10 |
| D | 23:49:41.42 | 56:38:22.6 | 2.20 0.08 | 3.5 0.3 | 0.69 0.04 | 485 64 | 3.62 0.78 | 346 129 |
| E | 23:49:41.23 | 56:38:24.4 | 2.12 0.11 | 3.3 0.4 | 0.39 0.02 | 199 23 | 3.47 1.24 | 310 137 |
| F | 23:49:42.14 | 56:38:25.8 | 1.69 0.05 | 3.4 0.1 | 0.28 0.03 | 396 103 | 4.28 0.35 | 353 35 |
| G | 23:49:42.74 | 56:38:25.1 | 1.11 0.04 | 2.7 0.1 | - | - | 2.45 0.23 | 305 50 |
| H | 23:49:43.46 | 56:38:26.2 | 0.85 0.05 | 2.1 0.1 | - | - | 3.63 0.30 | 236 31 |
| I | 23:49:42.22 | 56:38:28.3 | 0.78 0.05 | 1.8 0.1 | 0.18 0.03 | 277 90 | 3.18 0.32 | 236 24 |
| J | 23:49:43.22 | 56:38:30.1 | 0.61 0.06 | 1.6 0.2 | 0.19 0.02 | 151 38 | 3.79 0.29 | 138 15 |
| K | 23:49:42.96 | 56:38:17.9 | 0.34 0.04 | 1.4 0.1 | - | - | 2.54 0.17 | 129 12 |
| L | 23:49:42.38 | 56:38:25.8 | 0.23 0.04 | 0.8 0.1 | - | - | 2.78 0.20 | 176 20 |
| M | 23:49:43.39 | 56:38:21.1 | 0.21 0.05 | 0.5 0.2 | - | - | 1.04 0.14 | 87 23 |
| N | 23:49:43.27 | 56:38:22.9 | 0.18 0.04 | 0.4 0.1 | - | - | 0.86 0.16 | 128 26 |
| ATCA source | ALMA ID | S dv | L′(CO 2-1) | ||
|---|---|---|---|---|---|
| [Jy km s-1] | [km s-1] | [K km s-1 pc2] | [ M⊙] | ||
| Central (C) | B, C, G | 0.69 0.076 | 372 47 | 1.22 0.12 | 1.33 0.15 |
| West (W) | D, E | 0.16 0.04 | 166 47 | 0.29 0.07 | 0.32 0.08 |
| North (N) | A, K | 0.085 0.0028 | 175 68 | 0.15 0.05 | 0.16 0.05 |
| RA (J2000) | Dec (J2000) | d† | ||||
| [h:m:s] | [d:m:s] | [mJy] | [mJy] | [mJy] | [mJy] | [arcmin] |
| 23:49:42 | 56:38:25 | 45 3 | 71 3 | 96 3 | 77.0 2.9 | - |
| 23:49:43 | 56:37:31 | 21 3 | 37 3 | 43 3 | 25.0 2.8 | 0.9 |
| 23:49:25 | 56:35:27 | 23 4 | 26 4 | 32 4 | 2.9 1.7 | 5.2 |
| 23:49:39 | 56:36:33 | 12 3 | 16 3 | 23 4 | 3.9 1.3 | 2.1 |
| 23:49:36 | 56:41:17 | 7 3 | 14 3 | 19 3 | 3.2 1.6 | 3.2 |
| 23:49:55 | 56:34:17 | 6 4 | 10 3 | 20 5 | 4.8 1.8 | 5.3 |
| 23:49:12 | 56:40:31 | 11 5 | 16 5 | 22 5 | 6.8 2.6 | 7.7 |
† Distance from central SPT2349-56 source.
References
- [1] Wang, T. et al. Discovery of a galaxy cluster with a violently starbursting core at . The Astrophysical Journal 828, 56 (2016).
- [2] Mantz, A. B. et al. The XXL Survey: XVII. X-ray and Sunyaev-Zel’dovich Properties of the Redshift 2.0 Galaxy Cluster XLSSC 122. ArXiv e-prints (2017). 1703.08221.
- [3] Stanford, S. A. et al. IDCS J1426.5+3508: Discovery of a Massive, Infrared-Selected Galaxy Cluster at . The Astrophysical Journal 753, 164 (2012).
- [4] Springel, V. et al. Simulating the joint evolution of quasars, galaxies and their large-scale distribution. Nature 435, 629–636 (2005).
- [5] Overzier, R. A. et al. CDM predictions for galaxy protoclusters - I. The relation between galaxies, protoclusters and quasars at. Monthly Notices of the Royal Astronomical Society 394, 577–594 (2009).
- [6] Chiang, Y.-K., Overzier, R. A., Gebhardt, K. & Henriques, B. Galaxy Protoclusters as Drivers of Cosmic Star Formation History in the First 2 Gyr. The Astrophysical Journal Letters 844, L23 (2017).
- [7] Miley, G. & De Breuck, C. Distant radio galaxies and their environments. Astronomy and Astrophysics Review 15, 67–144 (2008).
- [8] Casey, C. M. et al. A massive, distant proto-cluster at caught in a phase of rapid formation? The Astrophysical Journal Letters 808, L33 (2015).
- [9] Chapman, S. C. et al. Do Submillimeter Galaxies Really Trace the Most Massive Dark-Matter Halos? Discovery of a High-z Cluster in a Highly Active Phase of Evolution. The Astrophysical Journal 691, 560–568 (2009).
- [10] Tamura, Y. et al. Spatial correlation between submillimetre and Lyman- galaxies in the SSA22 protocluster. Nature 459, 61–63 (2009).
- [11] Ma, J. et al. Stellar Masses and Star Formation Rates of Lensed, Dusty, Star-forming Galaxies from the SPT Survey. The Astrophysical Journal 812, 88 (2015).
- [12] Chiang, Y.-K., Overzier, R. & Gebhardt, K. Ancient Light from Young Cosmic Cities: Physical and Observational Signatures of Galaxy Proto-Clusters. The Astrophysical Journal 779, 127 (2013).
- [13] Vieira, J. D. et al. Extragalactic Millimeter-wave Sources in the South Pole Telescope Survey Data: Source Counts, Catalog, and Statistics for an 87 Square-Degree Field. The Astrophysical Journal 719, 763–783 (2010).
- [14] Mocanu, L. M. et al. Extragalactic millimeter-wave point source catalog, number counts and statistics from 771 square degrees of the SPT-SZ Survey. The Astrophysical Journal 779, 61 (2013).
- [15] Vieira, J. D. et al. Dusty starburst galaxies in the early Universe as revealed by gravitational lensing. Nature 495, 344–347 (2013).
- [16] Spilker, J. et al. ALMA Imaging and Gravitational Lens Models of South Pole Telescope-Selected Dusty, Star-Forming Galaxies at High Redshifts. The Astrophysical Journal 826, 112 (2016).
- [17] Strandet, M. L. et al. The redshift distribution of dusty star forming galaxies from the SPT survey. The Astrophysical Journal 822, 80 (2016).
- [18] Beers, T. C. et al. Measures of location and scale for velocities in clusters of galaxies - A robust approach. The Astronomical Journal 100, 32 (1990).
- [19] Evrard, A. E. et al. Virial Scaling of Massive Dark Matter Halos: Why Clusters Prefer a High Normalization Cosmology. The Astrophysical Journal 672, 122–137 (2008).
- [20] Cole, S., Helly, J., Frenk, C. S. & Parkinson, H. The statistical properties of Lambda cold dark matter halo formation. Monthly Notices of the Royal Astronomical Society 383, 546–556 (2008).
- [21] Ono, Y., Ouchi, M., Kurono, Y. & Momose, R. Faint Submillimeter Galaxies Revealed by Multifield Deep ALMA Observation: Number Counts, Spatial Clustering, and a Dark Submillimeter Line Emitter. The Astrophysical Journal 795, 5 (2014).
- [22] Simpson, J. M. et al. An ALMA Survey of Submillimeter Galaxies in the Extended Chandra Deep Field South: The Redshift Distribution and Evolution of Submillimeter Galaxies. The Astrophysical Journal 788, 125 (2014).
- [23] Oteo, I. et al. An extreme proto-cluster of luminous dusty starbursts in the early Universe. ArXiv e-prints (2017). 1709.02809.
- [24] Granato, G. L. et al. The early phases of galaxy clusters formation in IR: Coupling hydrodynamical simulations with GRASIL-3D. Monthly Notices of the Royal Astronomical Society 450, 1320–1332 (2015).
- [25] Renzini, A. Stellar Population Diagnostics of Elliptical Galaxy Formation. Annual Review of Astronomy and Astrophysics 44, 141–192 (2006).
- [26] Oñorbe, J. et al. How to zoom: Bias, contamination and lagrange volumes in multimass cosmological simulations. Monthly Notices of the Royal Astronomical Society 437, 1894–1908 (2013).
- [27] Carlstrom, J. E. et al. The 10 Meter South Pole Telescope. PASP 123, 568 (2011).
- [28] Ashby, M. L. N. et al. The Spitzer South Pole Telescope Deep Field: Survey Design and Infrared Array Camera Catalogs. The Astrophysical Journal Supplement Series 209, 22 (2013).
- [29] Collaboration, P. et al. Planck 2013 results. XXII. Constraints on inflation. Astronomy & Astrophysics 571, A22 (2014).
- [30] Weiß, A. et al. ALMA Redshifts of Millimeter-Selected Galaxies From the SPT Survey: The Redshift Distribution of Dusty Star-Forming Galaxies. The Astrophysical Journal 767, 88 (2013).
- [31] Siringo, G. et al. The Large APEX BOlometer CAmera LABOCA. Astronomy & Astrophysics 497, 945–962 (2009).
- [32] Weiß, A. et al. LABOCA observations of nearby, active galaxies. Astronomy & Astrophysics 490, 77–86 (2008).
- [33] Aravena, M. et al. The ALMA Spectroscopic Survey in the Hubble Ultra Deep Field: Search for [CII] Line and Dust Emission in Galaxies. The Astrophysical Journal 833, 71 (2016).
- [34] Williams, J. P. et al. Clumpfind: Determining Structure in Molecular Clouds. Astrophysics Source Code Library ascl:1107.014 (2011).
- [35] Wilson, W. E. et al. The Australia Telescope Compact Array Broad-band Backend: Description and first results. Monthly Notices of the Royal Astronomical Society 416, 832–856 (2011).
- [36] Sault, R. J., Teuben, P. J. & Wright, M. C. H. A retrospective view of Miriad. Astronomical Data Analysis Software and Systems IV 77, 433 (1995).
- [37] Mcmullin, J. P., Waters, B., Schiebel, D., Young, W. & Golap, K. CASA Architecture and Applications. In Astronomical Data Analysis Software and Systems XVI, vol. 376, 127 (2007).
- [38] Solomon, P. M. et al. The Molecular Interstellar Medium in Ultraluminous Infrared Galaxies. The Astrophysical Journal 478, 144–161 (1997).
- [39] Fazio, G. G. et al. The Infrared Array Camera (IRAC) for the Spitzer Space Telescope. The Astrophysical Journal Supplement Series 154, 10–17 (2004).
- [40] Werner, M. W. et al. The Spitzer Space Telescope Mission. The Astrophysical Journal Supplement Series 154, 1–9 (2004).
- [41] Béthermin, M., Dole, H., Cousin, M. & Bavouzet, N. Submillimeter Number Counts at 250, 350 and 500 microns in BLAST data. Astronomy and Astrophysics 516, 13 (2010).
- [42] Barger, A. J. et al. Is There a Maximum Star Formation Rate in High-Redshift Galaxies? The Astrophysical Journal 784 (2014).
- [43] Safarzadeh, M., Hayward, C. C., Ferguson, H. C. & Somerville, R. S. What Shapes the Far-infrared Spectral Energy Distributions of Galaxies? The Astrophysical Journal 818, 62 (2016).
- [44] Bothwell, M. S. et al. A survey of molecular gas in luminous sub-millimetre galaxies. Monthly Notices of the Royal Astronomical Society 429, 3047–3067 (2013).
- [45] Burgarella, D. et al. Star formation and dust attenuation properties in galaxies from a statistical ultraviolet-to-far-infrared analysis. Monthly Notices of the Royal Astronomical Society 360, 1413–1425 (2005).
- [46] Noll, S. et al. Analysis of galaxy spectral energy distributions from far-UV to far-IR with CIGALE: studying a SINGS test sample. Astronomy and Astrophysics 507, 1793–1813 (2009).
- [47] Bruzual, G. & Charlot, S. Stellar population synthesis at the resolution of 2003. Monthly Notices of the Royal Astronomical Society 344, 1000–1028 (2003).
- [48] Chabrier, G. The Galactic Disk Mass Function: Reconciliation of the Hubble Space Telescope and Nearby Determinations. The Astrophysical Journal 586, L133–L136 (2003).
- [49] Casey, C. M. The Ubiquity of Coeval Starbursts in Massive Galaxy Cluster Progenitors. The Astrophysical Journal 824, 36 (2016).
- [50] Chapman, S. C., Blain, A. W., Smail, I. & Ivison, R. J. A Redshift Survey of the Submillimeter Galaxy Population. The Astrophysical Journal 622, 772–796 (2005).
- [51] Blain, A. W., Chapman, S. C., Smail, I. & Ivison, R. Clustering of Submillimeter‐selected Galaxies. The Astrophysical Journal 611, 725–731 (2004).
- [52] Kurk, J. D. et al. A Search for clusters at high redshift. I. Candidate Lyalpha emitters near 1138-262 at . Astronomy and Astrophysics 358, L1–L4 (2000).
- [53] Kuiper, E. et al. A SINFONI view of flies in the Spiderweb: A galaxy cluster in the making. Monthly Notices of the Royal Astronomical Society 415, 2245–2256 (2011).
- [54] Dannerbauer, H. et al. An excess of dusty starbursts related to the Spiderweb galaxy. Astronomy & Astrophysics 570 (2014).
- [55] Steidel, C. et al. A Large Structure of Galaxies At Redshift and its Cosmological Implications. The Astrophysical Journal 492, 428–438 (1997).
- [56] Hayashino, T. et al. Large-Scale Structure of Emission-Line Galaxies at . The Astronomical Journal 128, 2073–2079 (2004).
- [57] Chapman, S. C. et al. Submillimeter Imaging of a Protocluster Region at . The Astrophysical Journal 548, L17–L21 (2001).
- [58] Geach, J. E. et al. A submillimetre survey of Lyman haloes in the SA 22 protocluster at . Monthly Notices of the Royal Astronomical Society 363, 1398–1408 (2005).
- [59] Umehata, H. et al. ALMA Deep Field in SSA22: A concentration of dusty starbursts in a protocluster core. The Astrophysical Journal Letters 815 (2015).
- [60] Hung, C.-L. et al. Large scale structure around a cluster. The Astrophysical Journal 826 (2016).
- [61] Daddi, E. et al. Two Bright Submillimeter Galaxies in a Protocluster in GOODS-North, and Accurate Radio-Infrared Photometric Redshifts. The Astrophysical Journal 694, 1517–1538 (2009).
- [62] Daddi, E. et al. A CO Emission Line From the Optical and Near-IR Undetected Submillimter Galaxy GN10. The Astrophysical Journal 695, L176–L180 (2009).
- [63] Walter, F. et al. The intense starburst HDF 850.1 in a galaxy overdensity at in the Hubble Deep Field. Nature 486, 233–236 (2012).
- [64] Lewis, A. J. R. et al. Ultra-Red Galaxies Signpost Candidate Proto-Clusters at High Redshift. ArXiv e-prints (2017). 1711.08803.
- [65] Noirot, G. et al. HST Grism Confirmation of Two z~2 Structures From the Clusters Around Radio-Loud AGN (CARLA) Survey. The Astrophysical Journal 830, 90 (2016).
- [66] Ivison, R. J. et al. Herschel-ATLAS: a binary HyLIRG pinpointing a cluster of starbursting proto-ellipticals. The Astrophysical Journal 772 (2013).
- [67] Fu, H. et al. The rapid assembly of an elliptical galaxy of 400 billion solar masses at a redshift of 2.3. Nature 498, 338–341 (2013).
- [68] Chapman, S. C. et al. A millimetre-wave redshift search for the unlensed HyLIRG, HS1700.850.1. Monthly Notices of the Royal Astronomical Society 453, 951–959 (2015).
- [69] Miller, T. B., Hayward, C. C., Chapman, S. C. & Behroozi, P. S. The bias of the submillimetre galaxy population: SMGs are poor tracers of the most-massive structures in the Universe. Monthly Notices of the Royal Astronomical Society 452, 878–883 (2015).
- [70] Trainor, R. F. & Steidel, C. C. The Halo Masses and Galaxy Environments of Hyperluminous QSO’s at in the Keck Baryonic Structure Survey. The Astrophysical Journal 752, 39 (2012).
- [71] Rosati, P. et al. Multi-wavelength study of XMMU J2235.3-2557: the most massive galaxy cluster at z > 1. Astronomy and Astrophysics 508, 583–591 (2009). arXiv:0910.1716v2.
- [72] Brodwin, M. et al. IDCS J1426.5+3508: The Most Massive Galaxy Cluster at z > 1.5. The Astrophysical Journal 817, 122 (2016).
- [73] Andreon, S. et al. JKCS 041: a Coma cluster progenitor at z = 1.803. A & A 565, A120 (2014). 1311.4361.
- [74] Gobat, R. et al. A mature cluster with X-ray emission at z = 2.07. A & A 526, A133 (2011). 1011.1837.
- [75] Gobat, R. et al. WFC3 GRISM Confirmation of the Distant Cluster Cl J1449+0856 at <z >= 2.00: Quiescent and Star-forming Galaxy Populations. The Astrophysical Journal 776, 9 (2013).
- [76] Bocquet, S. et al. Mass Calibration and Cosmological Analysis of the SPT-SZ Galaxy Cluster Sample Using Velocity Dispersion and X-ray Measurements. The Astrophysical Journal 799 (2014). 1407.2942.
- [77] Mandelker, N., van Dokkum, P. G., Brodie, J. P., van den Bosch, F. C. & Ceverino, D. Cold Filamentary Accretion and the Formation of Metal Poor Globular Clusters and Halo Stars. ArXiv e-prints (2017). 1711.09108.
- [78] Cautun, M., van de Weygaert, R., Jones, B. J. T. & Frenk, C. S. Evolution of the cosmic web. MNRAS 441, 2923–2973 (2014). 1401.7866.
- [79] Bower, R. G. et al. Breaking the hierarchy of galaxy formation. MNRAS 370, 645–655 (2006). astro-ph/0511338.
- [80] Hopkins, P. F., Hernquist, L., Cox, T. J. & Kereš, D. A Cosmological Framework for the Co-Evolution of Quasars, Supermassive Black Holes, and Elliptical Galaxies. I. Galaxy Mergers and Quasar Activity. ApJS 175, 356–389 (2008). 0706.1243.
- [81] Hayward, C. C. et al. Spatially unassociated galaxies contribute significantly to the blended submillimetre galaxy population: predictions for follow-up observations of ALMA sources. Monthly Notices of the Royal Astronomical Society 434, 2572–2581 (2013).
- [82] Prada, F., Klypin, A. A., Cuesta, A. J., Betancort-Rijo, J. E. & Primack, J. Halo concentrations in the standard cold dark matter cosmology. Monthly Notices of the Royal Astronomical Society 423, 3018–3030 (2012).
- [83] Behroozi, P. S., Wechsler, R. H. & Wu, H.-Y. The Rockstar Phase-Space Temporal Halo Finder and the Velocity Offsets of Cluster Cores. The Astrophysical Journal 762 (2011).
- [84] Behroozi, P. S., Wechsler, R. H. & Conroy, C. The Average Star Formation Histories of Galaxies in Dark Matter Halos From . The Astrophysical Journal 770, 57 (2013).
- [85] Sargent, M. T. et al. The Contribution of Starbursts and Normal Galaxies to Infrared Luminosity Functions at . The Astrophysical Journal 747, L31 (2012).
- [86] Hayward, C. C. et al. Submillimetre galaxies in a hierarchical universe: Number counts, redshift distribution and implications for the IMF. Monthly Notices of the Royal Astronomical Society 428, 2529–2547 (2013).
- [87] Hayward, C. C. et al. What Does a Submillimeter Galaxy Selection Actually Select? The Dependence of Submillimeter Flux Density on Star Formation Rate and Dust Mass. The Astrophysical Journal 743, 159 (2011).