Age Gradients throughout the Galaxy with O-Miras
Abstract
We assemble the largest sample of oxygen rich Miras to date and highlight their importance for age-dating the components of the Galaxy. Using data from the Catalina Surveys and the All Sky Automated Survey for Supernovae, we extract a clean sample of O-Miras, stretching from the Galactic Bulge to the distant halo. Given that the period of O-Miras correlates with age, this offers a new way of determining age gradients throughout the Galaxy. We use our sample to show (i) disc O-Miras have periods increasing on moving outwards from 3 to 15 kpc, so the outer disc O-Miras are younger than the inner disc, (ii) the transition from younger disc to halo O-Miras occurs at kpc and is marked by a plummeting in period, (iii) there exists a population of young O-Miras likely kicked from the disc to heights of order of kpc, (iv) great circle counts of old Miras show strong evidence for distant debris agglomeration associated with the Magellanic Clouds, (v) seven stars in our samples are located at distances between 200 and 500 kpc surpassing all previously established records, and, finally, (vi) O-Miras may be present in the Fornax, Sculptor, Sextans and Leo II Galactic dwarf spheroidals, as well as the distant globular cluster Pal 4. We spotlight the importance of O-Mira in the Era of Gaia as universal chronometers of the Galactic populations.
keywords:
Galaxy: halo – Galaxy: disc – Galaxy: structure1 Introduction
Miras are variable Asymptotic Giant Branch (AGB) stars. They are in the late stages of evolution and will expel their envelopes to form planetary nebulae in a few million years. Typically, they have periods longer than 100 days, and amplitudes greater than 2.5 magnitudes at visual wavelengths (Habing & Olofsson, 2003).
They are worthy of special study for a number of reasons. Firstly, they are the most luminous representatives of the intermediate-age population. Miras are so intrinsically bright that they are detectable throughout the Galactic disc, bulge and halo (Habing & Olofsson, 2003), the Magellanic Clouds (Deason et al., 2017), the dwarf satellites (Whitelock et al., 2009; Sakamoto et al., 2012) and even in M31 and M33 (An et al., 2004). Secondly, they provide an independent distance calibration via period–luminosity relations (Whitelock et al., 2008). Both oxygen rich (O-Miras) and carbon rich (C-Miras) obey separate period–luminosity-colour relations (Feast et al., 1989). For O-Miras, the colour term in the period-luminosity relation is a very minor correction (Huang et al., 2018). Thirdly, they are major contributors to the processed material currently entering the interstellar medium and an important source of enrichment. However, perhaps the most important property of Miras is that they provide good chronometers (Feast et al., 2006; Feast, 2009).
Accurate stellar ages have the potential to completely transform Galactic astronomy. The dissection of the Galaxy according to age would allow us to map its assembly and growth, as well as to study secular processes that control its evolution. Unhappily, good stellar ages are unusually hard to come by! The most successful attempts so far use a combination of spectroscopy and stellar evolutionary models. For example, the masses of red giants can be predicted from their photospheric carbon and nitrogen abundances, together with their spectroscopic stellar parameters. With the masses in hand, stellar evolutionary theory is then used to obtain ages, typically with errors of 40 per cent (e.g., Martig et al., 2016a; Ness et al., 2016).
Variable stars also offer grand opportunities to derive stellar ages. For example, the period of a Cepheid variable is dependent on its luminosity. An increase in luminosity implies an increase in the stellar mass and a decrease in the Cepheid age. This can be made formal through period-age or period-age-colour relationships, which depend on whether the Cepheid is pulsating in the fundamental or first overtone mode (Efremov, 1978; Bono et al., 2005). This can give Cepheid ages with errors of 20 per cent. As Cepheids are tracers of young stellar populations, this method is used to date the age distribution and star formation history in the LMC disc. In principle, age estimates from variable stars depend primarily on the period, which is unaffected by systematics, such as reddening or distance errors. Even relative age estimates for an abundant variable population can supply constraints on the existence of age gradients.
It has long been known empirically that O-Mira kinematics depend on their periods. For nearby O-Miras, the age and velocity dispersion relationship calibrated for stars in the solar neighborhood can be used to derive a period-age relationship (Feast & Whitelock, 2000; Feast, 2007). The period of a Mira increases with increasing luminosity, and hence mass. Thus, longer period Miras correspond to younger ages. Samples of O-rich Miras can therefore be used to determine age gradients in the Milky Way Galaxy and even, in the most propitious circumstances, date the populations. Additionally, the measured spread in near-infrared colours of O-rich Miras is substantially smaller than that observed in the C-rich counterparts (e.g. Whitelock et al., 2006; Matsuura et al., 2009; Yuan et al., 2017). One possible explanation of this phenomenon is that the O-Miras suffer less from varying levels of extinction due to circumstellar dust. If true, this makes them more trustworthy distance indicators than their C-rich peers.
Here, we exploit two new datasets to build the largest sample of O-Miras so far assembled. It contains O-Miras with remarkable radial coverage, Galactocentric radii between 1 and 200 kpc. We use it to identify age gradients throughout the Galaxy, to study the transition in ages between disc and halo O-Miras and to compare the relative ages of different Galactic populations as a function of Galactocentric distance.
The paper is arranged as follows. Section 2 presents the Mira dataset, the selection of the oxygen-rich sample, as well as the calculation and validation of the Mira distances. Section 3 details the application of O-rich Miras to studies of population ages in the Galactic disc and halo, the identification of substructure at large distances and the populations of the dwarf spheroidal galaxies. Section 4 summarises with a discussion of future prospects as the Gaia Era enters high noon.
2 Data
This work exploits data from two primary sources, that of the Catalina Surveys and the All Sky Automated Survey for Supernovae (ASAS). The Catalina Surveys catalog is comprised of two main components surveying the Northern (Drake et al., 2014) and Southern (Drake et al., 2017) sky respectively. Both surveys are analysed by the Catalina Real-Time Transient Survey (CRTS) in search of optical transient phenomena. Data is extracted from both subsets and will referred to as CRTS hereon. Our sample of Mira candidates is then cross-matched with the 2MASS catalog to obtain magnitudes, yielding a total of 960 unique sources. The ASAS project is an all-sky optical survey with published classifications of variable stars (Jayasinghe et al., 2018). Cross-matching the ASAS Mira candidates with 2MASS provided 1,831 sources for study. A cross-match radius of 1 arcesec was used in both instances. Magnitudes are dereddened with extinction coefficients of = 0.72, = 0.46 and = 0.306 combined with the reddening values of Schlegel et al. (1998).
2.1 Mira Selection
C-Miras (and their allies, the Carbon stars) have been studied extensively before (e.g., Downes et al., 2004; Battinelli & Demers, 2014). They were exploited most recently by Huxor & Grebel (2015) to trace out structures in the stellar halo. In this study, we will focus on the less well-studied O-Miras.
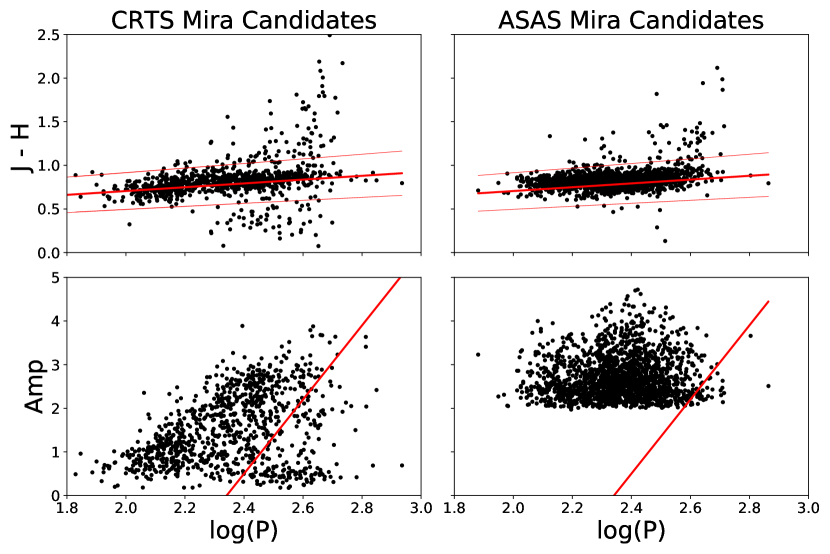
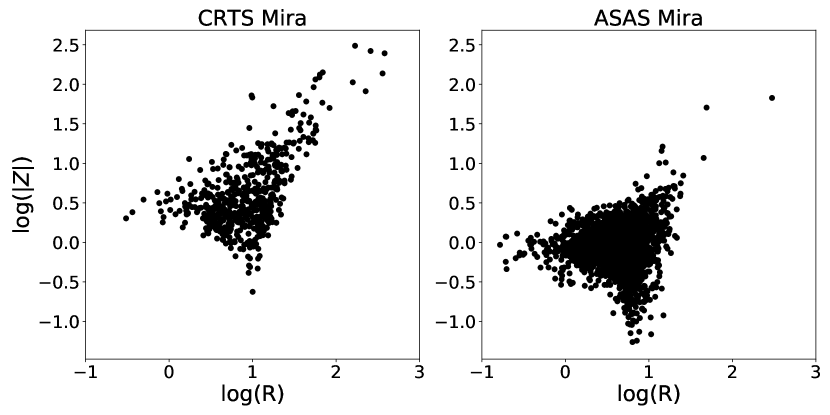
The selection of a clean sample of O-Miras proceeds via the application of two main cuts. The work of Yuan et al. (2017) and Glass et al. (1995) shows that the colour indices of Mira increase as a function of period, itself a proxy for age, with linear relations provided by Glass et al. (1995) for O-Miras in the SAAO photometric system. For this work, the relation is converted into the 2MASS photometric system via the transformation of Carpenter (2001) and is shown as the solid red line in the top two panels of Fig. 1. Associated errors of the original linear relations and colour transformations are combined to produce a 1- bound defining the selection cut for O-Mira form our sample. These are displayed as the thin red lines in the upper panels of Fig. 1. Notice that the O-Mira form a tight sequence with only a mild dependence on colour in these plots.
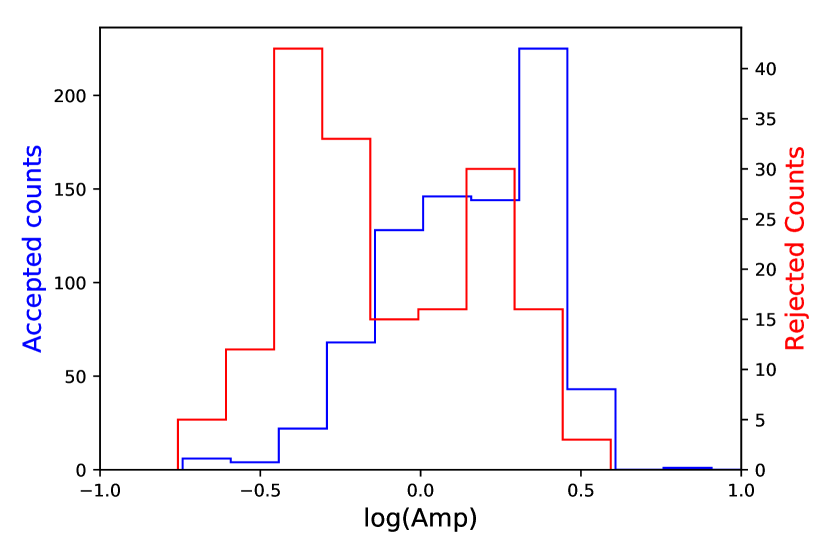
To further rid our sample of C-Miras and other variable contaminants, a cut in amplitude in the -band is applied. The work of Soszyński et al. (2009a) reveals a distinction between O-rich and C-rich stars in amplitude-period space, on which we base our cut shown in the bottom row of Fig. 1. The CRTS catalog groups Mira and semi-regular variables (SRV), which are themselves C-rich, under the single classification of long period variables (LPV). Accordingly, we use our CRTS sample to define the cut in amplitude based on the higher potential for contamination and the fact that the ASAS sample is predominantly an O-rich population, as evidenced by the top right panel of Fig. 1. Once the cut is applied, we expect that the rejected C-rich sources display a bimodal distribution in amplitude space given that they are constituted from two components: C-Miras and SRVs. Fig. 2 shows this to be the case. This is also in agreement with the results of Soszyński et al. (2009a) who probed the Mira amplitude distribution in the OGLE band.
The combined CRTS and ASAS cleaned samples of O-Mira consist of 2,447 sources or of the original combined sample. We do not study the rejected sample of mainly C-Miras any further in this paper.
2.2 O-Mira Distributions
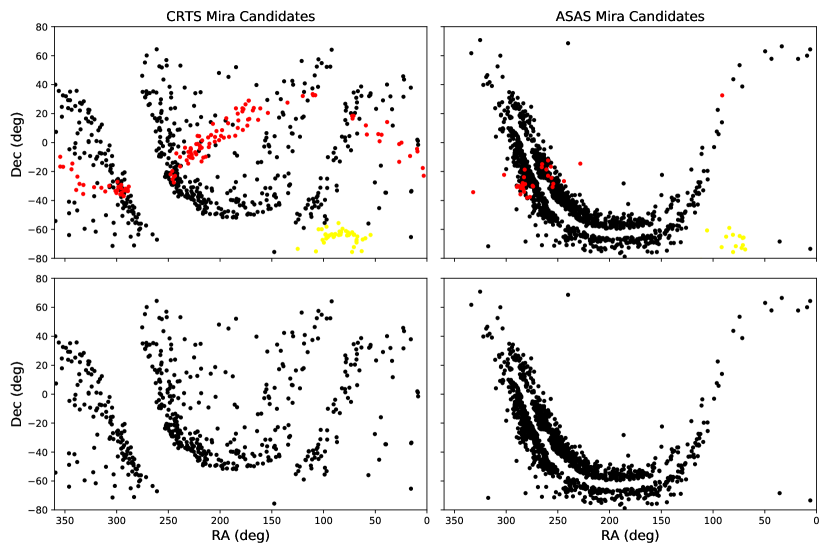
The spatial distribution of our O-Mira sample is displayed in Fig. 3. The ASAS O-Miras lie close to the Galactic plane with approximately 81 of the stars having . This enables us to probe the O-Mira structure within the Galactic disc. O-Mira from the CRTS selection extend to much higher latitudes and thus grant us information on the halo component of the Galaxy. Of course, the spatial distribution is strongly affected by selection biases of the parent surveys. However, we plan to use the O-Miras to trace age gradients throughout the Galaxy, for which purpose they are unbiased.
We immediately see in Fig. 3 a number of prominent substructures, including the Large Magellanic Cloud (LMC) and the Sagittarius Stream (Sgr Stream). They are identified and removed from our sample. Although interesting from the viewpoint of substructure studies, they are a nuisance here as our aim is to understand the relative ages of the mainstream Galactic populations.
We remove sources associated with the LMC by excising a 15∘ radii circle centered on the respective structure. Identifying Sgr Stream denizens requires a transformation into the Sgr Stream coordinates () of Belokurov et al. (2014). We remove stars with Sgr Stream latitude and heliocentric kpc. The latter is needed as the Sgr Stream passes through the Galactic plane, yet we wish to retain the disc O-Miras. Once removed, our sample of O-Miras is comprised of 2,233 distinct sources, probing the Galactic thin and thick discs, bulge and halo.
2.3 Distance Determination and Validation
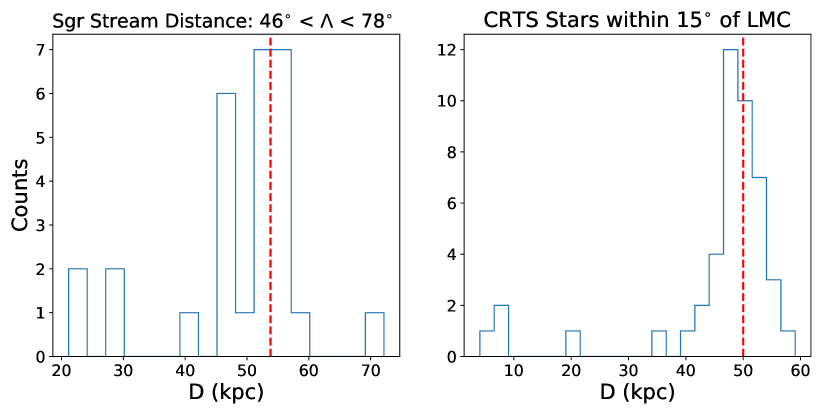
We calculate Mira distances using the empirical quadratic Period-Luminosity relation from equation 1 of Yuan et al. (2017). We choose to work in the band to minimise the effects of extinction. Current best estimates of the distance to the LMC from the work of Elgueta et al. (2016) yield values of 50.3 0.5 kpc. We then select our LMC Mira candidates (i.e. those within 15∘ of the dwarf’s center), compute their distance and apply a small empirical correction (0.17 mag) to the period luminosity relation to produce a distance distribution peaked at the 50 kpc range. The distance distribution of these Miras is shown in the right panel of Fig. 4. The median distance of the prominent peak is kpc. The standard deviation approximated from the median absolute deviation of the LMC sample is kpc. This can be used as a typical distance error to O-Mira stars in our sample, which, encouragingly, appears to be . This method results in a final period luminosity relation of:
| (1) |
where is the period in days and is the absolute magnitude in the band. The logarithm here, and henceforth, is to base 10. As a further check, the distance to a well populated section of the Sgr Stream was computed for the associated O-Mira. The left panel of Fig. 4 shows the peak of the distribution to lie at 50 kpc in agreement with the values in Table 1 of Belokurov et al. (2014) which quote distances of 45 - 58 kpc in the chosen Sgr Stream longitude range.
Taking the solar position as kpc, we convert from Galactic and heliocentric distance to Galactocentric cylindrical polar coordinates (). The panels of Fig. 5 compare the spatial distributions of O-Mira in the CRTS and ASAS samples. In CRTS, the sample probes distances characteristic of the Galactic bulge right out to the far halo. By contrast, in ASAS, we see a clustering of stars at low around the solar neighbourhood, along with a sample largely confined to within a kpc of the Galactic plane. The two samples are therefore highly complementary, with CRTS probing from the bulge to the halo, and ASAS concentrating on the thin and thick discs.
Given the strong dependence of the Miras luminosity on its period, the completeness and contamination of the O-Mira selection must vary with distance. This is dictated by the distribution of the LPV stars in the space spanned by period, colour and amplitude as shown in Fig. 1. For example, the contamination from C-rich Mira stars and other LPVs with broader colour range increases sharply with period. Thus, because at fixed limiting magnitude the most distant stars detectable are those with larger periods, it is possible to expect that contamination may increase with distance. On the other hand, the short-period O-Mira stars have lower amplitudes and thus may suffer a much faster drop in completeness with distance compared to the long-period counterparts.
3 Results
3.1 Age Gradients in the Galactic Disc
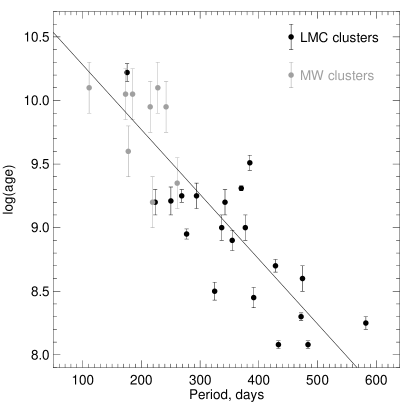
While the age of the Mira variables has typically been estimated by matching them to disc stellar populations with similar velocity dispersions (see e.g. Feast, 2007, 2009; López-Corredoira, 2017), we attempt to calibrate the Mira age-period relation by finding candidate LPVs in the LMC and the Milky Way star clusters with known ages. In the LMC, we rely on the Mira catalog by Soszyński et al. (2009b) and the compendium of massive star clusters by Baumgardt et al. (2013). In the Galaxy, we use the combined ASAS+CRTS sample of O-rich Mira presented in this work and the catalog of star clusters by Kharchenko et al. (2016). Fig. 6 shows the age of the star cluster as a function of the period of the candidate Mira matched to its location. In agreement with previous similar studies (Nishida et al., 2000; Kamath et al., 2010), the trend is clear albeit with considerable scatter. The shortest period Miras with days do tend to live in clusters that are 8-10 Gyr old. On the other hand, Mira stars with periods of days are found in much younger star cluster with ages of order of 1 Gyr.
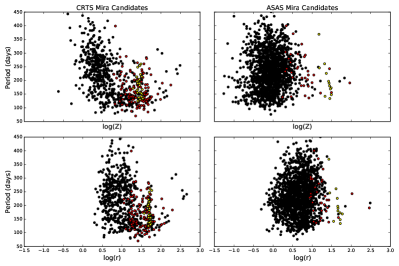
We plot Galactocentric spherical polar radius and vertical height above or below the Galactic plane as a function of period with a view to understanding the O-Mira age distribution in both the disc and halo components of the Galaxy. This is shown with and without substructures in the four topmost and bottommost two panels of Fig. 7. The CRTS panels of these plots are the most interesting. They show that O-Miras with short periods ( days) reach much greater heights above the Galactic plane than O-Miras with long periods ( days). A similar pattern is seen in the plot of period versus distance, with long period O-Miras confined to within the innermost kpc of the Galaxy. Clearly, we are seeing the transition from a younger disc O-Mira population into an older halo component. The age profile of the halo is rather flat, seemingly at odds with the recent claims of the negative age gradient in the halo by Carollo et al. (2016). Further, the six most distant stars (beyond 200 kpc) seen in the CRTS sample are clearly young. Less transition is observed in the ASAS counterpart owing to the limited sampling at high Galactic latitudes in this dataset. The LMC and Sgr Stream O-Mira are seen to predominantly inhabit an intermediate to low period range representative of the stellar population these structures contain. This is because of comparatively recent star formation processes, not seen in the halo in general.
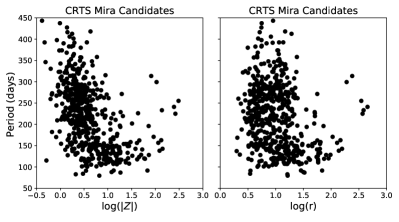
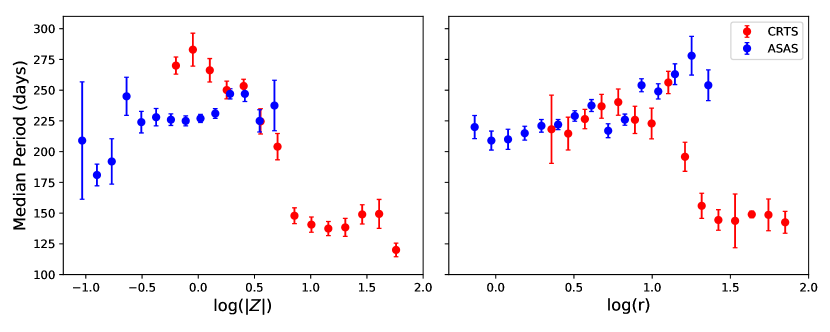
The panels of Fig. 8 give the period distributions of the O-Miras in vertical distance from the plane and spherical polar radius . Distances have been binned, with bins containing less than 5 stars being rejected, and prominent substructures removed. Both mean and median periods have been computed for each bin along with standard errors. The standard error on the median is formulated through appropriate scaling of the median absolute deviation. As the ASAS Mira sample contains predominately disc O-Miras, it is interesting to note the positive correlation between Galactocentric radius and period given that period is a proxy for age. The implication here, then, is that the age of the O-Mira populated components of the disc decreases on moving outwards. We do not see any evidence of a sharp upturn in the radial profile of the median age of disc, as conjectured by Roškar et al. (2008). Their simulations suggest that the outer disc is deficient in young stars, but is populated by old stars which migrated from the inner disc. If such an upturn exists, then it must lie beyond kpc. In fact, Amôres et al. (2017) have recently argued that the break may be at kpc on the basis of population synthesis applied to 2MASS data.
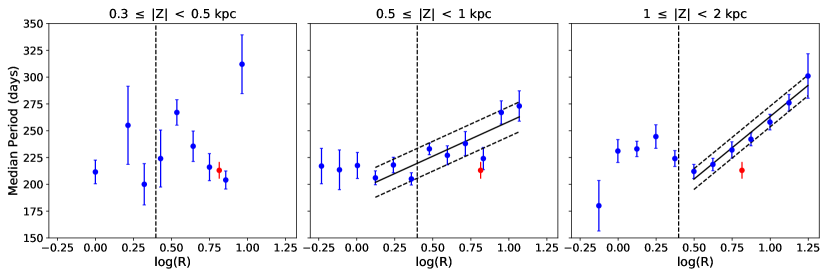
To probe any change in period gradient, the ASAS O-Mira are further binned into three subgroups: kpc, kpc and kpc. We use cylindrical radius in this instance to focus on the evolution of period throughout the Galactic disc. These cuts correspond to radial ranges of kpc, kpc and kpc respectively, as enforced by the footprint in Fig. 5. The middle and rightmost panels of Fig. 9 clearly demonstrate that beyond 2.5 kpc the O-Mira population follows the trend of increasing median period with increasing Galactocentric distance. This can be quantified by linear fits yielding:
| (2) |
where represents the median period and the fits correspond to the ranges of kpc and kpc respectively. At small radii ( kpc), the trend is not present and the relationship between median period and distance is flat. This is possibly indicative of existence of the intermediate age Mira reported towards the bulge in the works of Catchpole et al. (2016), Blommaert & Groenewegen (2007) and Matsunaga et al. (2017), which are difficult to separate from the disc Miras.
Recent estimates, from the works of Ojha (2001), Jurić et al. (2008) and Jayaraman et al. (2013), for the scale of the thick disc are based on double exponential models with radial and vertical scale heights in the ranges 3.6- 4kpc and 0.8-1 kpc. In a broad sense, the expected populations in the consecutive panels of Fig. 9 would be expected to comprise of thin disc, thick disc and halo stars from the left to right. It is interesting to note that radial age gradients at different ranges have been observed by Martig et al. (2016b) in a population of APOGEE red clump stars, from 4kpc onward. They see clear separations in age gradients between the bins, that is, higher bins constitute a clearly older population for given radius , whereas the distinctive gradients in our sample are less well separated. However, their results are consistent with ours, as we both detect an older stellar population as we moves outwards in the disc.
Additionally, the red marker in Fig. 9 corresponds to the datum derived from a solar neighbourhood selection of Mira. From Fig. 5, there is an appendage of Mira extending to low at the Solar position. A cut selecting Mira with has been used to define the O-Miras in the solar region. This though leads to the surprising result that the solar neighbourhood O-Miras have median periods lower than the thick disc O-Miras, and hence are older! Although the origin of this result is not fully clear, there are indications that our solar neighbourhood sample is affected by survey systematics. In addition to the variation of the sample completeness and contamination with period as discussed in Section 2.3, other effects such as that linked to saturation may be taking place. Saturation for ASAS is at . Nearby long period O-Miras are not only more luminous, but they also have higher amplitudes, so they are more likely to be saturated and therefore not included in the selection. Finally, it is worth pointing out that, if only a sub-class of Miras is considered - such as O-rich stars, the period-based chronometry argument might only work for a limited range of ages. This is because the period-age relation is normally derived for a combination of both C- and O-rich Miras, however, their period distributions are rather different. It has been noticed (see e.g. Cioni et al., 2001; Feast et al., 1989; Lorenz et al., 2011) that O-rich stars are biased towards short periods while C-rich ones tend to have longer periods on average. Translated into age, these differences imply that O-rich Mira might significantly under-sample the younger populations of the Galactic disc.
3.2 Miras outside of the Galactic disc
While the ASAS sample is largely limited to kpc, the complementary CRTS Miras probe a much larger range of Galactic heights, kpc (and probably beyond). We first focus on the distribution of long-period pulsators in CRTS. According to Fig. 8, the bulk of the disc Miras in the ASAS set have periods in excess of 170 days. Note that many lines of – albeit indirect – evidence exist that the long-period stars are substantially younger than their short-period counterparts (see Fig. 6 for example). Fig. 10 gives the view of the distribution of the population of the long-period (and thus likely young) Mira stars across the Milky Way. Apart from the obvious disc denizens (filled black circles), three distinct groups can be identified in the Figure. The first two are the stars belonging to the Sgr stream (red filled circles) and the LMC (yellow filled circles).
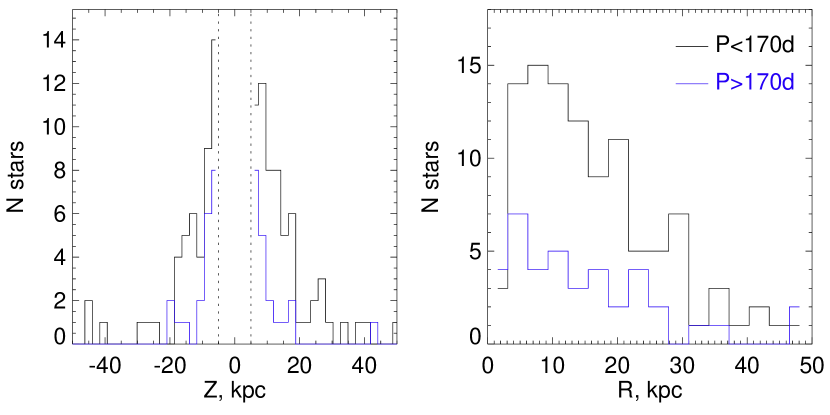
The last group (blue filled circles) is comprised of stars that follow the extent of the disc in dimensions but travel to heights as large as kpc. Their reach in and can be gleaned from Fig. 11, where their distribution (blue histograms) is compared to that of the short-period Miras (black histograms). Indeed, both long-period and short-period objects are detected as far as kpc, however the (likely) young CRTS Miras do not wander beyond kpc. We therefore speculate that, if our distance estimates are valid, these objects represent a population of kicked disc stars. As of today, several prominent groups of high disc stars are known including those composed of M-giant stars, close relatives of Miras (Rocha-Pinto et al., 2004; Xu et al., 2015; Bergemann et al., 2018; Sheffield et al., 2018; Deason et al., 2018a; de Boer et al., 2018). Strikingly, apart from the three obvious groups, such as the kicked disc population (blue) and the members of the Sgr stream and the LMC (red and yellow), there are almost no young Miras in the Galactic halo.
However, we do find a total of 7 long-period Miras that go much beyond the rest of the sample, i.e. to Galactocentric distances in excess of kpc and are not projected behind the Sgr stream of the LMC on the sky. Six of these are part of the CRTS catalog and one from ASAS. The locations of these Miras are marked with filled green stars in the right panel of Fig. 10. Moreover, we use black outlines to point out 4 remarkable objects (all from CRTS) with kpc. Please note that at this stage, these 7 objects should be viewed as candidates. This is because, as explained in Section 2.3, the sample contamination likely increases with period and all of these Miras have periods larger than 220 days, as presented in Table 1. If our absolute magnitude estimates are correct, then all 4 of the Miras marked with green stars and black outlines in Fig. 10 lie further than the previously identified most distant Milky Way stars. There are however, several reasons to be cautious. As judged by the contents of Table 1, some of the distant Miras have suspiciously low amplitudes given their relatively long period. It is of course not impossible that their amplitudes are under-estimated given that these objects are some of the faintest Miras in our sample. Another possibility is that these stars are misclassified and are not O-Miras but rather C-rich LPVs instead. In that case, we have checked that simply applying the period-colour-luminosity relation appropriate for C-Miras given in Yuan et al. (2017) would yield distances similar to those listed in the Table or larger. Note that for C-Miras, PCLRs typically yield larger uncertainties compared to those derived for O-Miras, indicative, most likely of unknown (and quite often significant) amounts of circumstellar dust.
| RA (deg) | Dec (deg) | Period (days) | Amplitude | D (kpc) | |||||
|---|---|---|---|---|---|---|---|---|---|
| 257.7 | 27.1 | 49.0 | 33.0 | 14.5 | 13.9 | 13.6 | 299 | 1.5 | 191 15 |
| 177.3 | -41.7 | 290.7 | 19.7 | 14.9 | 14.2 | 14.0 | 314 | 1.4 | 240 20 |
| 283.8 | -48.1 | 348.4 | -20.4 | 16.8 | 15.9 | 15.6 | 233 | 1.2 | 386 31 |
| 301.7 | -63.4 | 333.1 | -32.5 | 16.4 | 15.9 | 15.9 | 241 | 1.0 | 454 36 |
| 322.6 | -54.0 | 342.5 | -44.7 | 16.5 | 15.9 | 15.6 | 225 | 1.5 | 369 30 |
| 340.8 | -41.5 | 355.8 | -60.1 | 16.0 | 15.4 | 15.2 | 255 | 0.9 | 350 28 |
| 213.9 | -48.1 | 317.2 | 12.4 | 16.2 | 15.4 | 15.3 | 209 | 2.3 | 306 24 |
The latest tally of the record holders can be found in Bochanski et al. (2014). Table 1 of the paper lists all of the 9 stars with distances greater than 120 kpc known at the time. Of all large-distance candidates, the most securely identified are the horizontal branch stars. At least three independent samples of pulsating HB stars, called RR Lyrae, have been published recently, each containing sizeable numbers of stars beyond 100 kpc (see Drake et al., 2013; Sesar et al., 2017; Medina et al., 2018). Additionally, blue HB stars can also be used as standard candles – albeit with somewhat lower accuracy - and thus used to trace the outskirts of the Galaxy. For example, Deason et al. (2012) uses a combination of deep multi-band photometry and VLT spectroscopy to detect BHBs at distances of order of 150 kpc. Finally, just like Miras, other stars around the AGB are good candidates for the most distant objects in the Galaxy owing to their spectacular luminosity. Accordingly, in the last two decades, Carbon stars and M-giants have been used routinely to scout the far reaches of the Milky Way (e.g. Totten & Irwin, 1998; Majewski et al., 2003; Mauron, 2008; Deason et al., 2012; Bochanski et al., 2014; Koposov et al., 2015; Mauron et al., 2018).
Curiously, not only the four Southern (Galactic hemisphere) CRTS Miras surpass all current distance records, they appear to cluster conspicuously in a relatively small area of the sky. The group sits around and . This portion of the celestial sphere is squeezed inbetween the trailing tail of the Sgr dwarf and the trailing tail of the LMC, with the four distant Mira positioned away from the Sgr stream and from the Magellanic Stream, in the coordinate system defined by Nidever et al. (2008). Even though the Miras are not aligned with either of the streams perfectly, note that both the Sgr and the LMC debris are predicted to travel to large distances around this location (Dierickx & Loeb, 2017; Diaz & Bekki, 2012; Besla et al., 2013). Most recently, Deason et al. (2018b) have detected an excess of distant BHB stars in the ultra-deep data from the Subaru’s Hyper Suprime-CAM at the location not too far from that traced by the four Southern CRTS Miras. The distant BHB over-density also overlaps with the so-called Pisces Cloud (Sesar et al., 2007; Watkins et al., 2009; Nie et al., 2015). While plenty of evidence now exists that both dwarfs would leave trails of very distant stars as their orbits evolve under the influence of the dynamical friction (see also Gibbons et al., 2017; Jethwa et al., 2016), it is less clear where on the sky these debris should pile up. The uncertainty here is due to the lack of constraints on the shape of the outer dark matter halo.
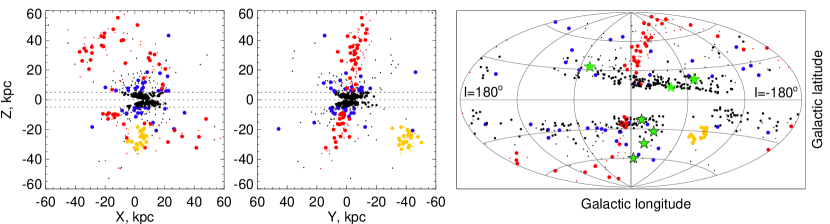
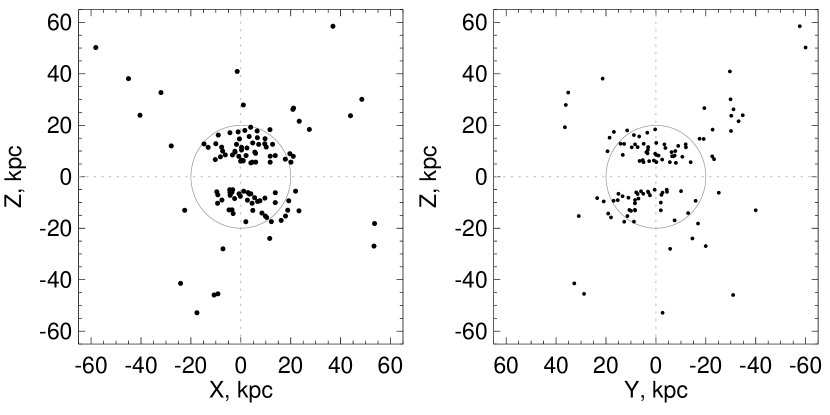
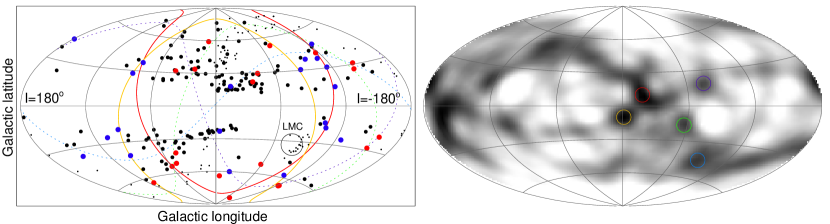
The whereabouts of the old Miras, i.e. those with short period ( d) can be studied in Fig. 12. Their distribution appears to be broken into two components, a relatively smooth, compact one with kpc (as indicated by black circle) and sparse lumpy one with kpc. To investigate further the spatial properties of the distant old Miras, we break them into three sub-samples according to their Galactocentric distance, as shown in Fig. 13 in Galactic coordinates. Additionally, for all short-period Miras with kpc we carry out a great circle star count, following ideas of (e.g. Lynden-Bell & Lynden-Bell, 1995; Johnston et al., 1996; Ibata et al., 2001; Mateu et al., 2011). In practice, for a given pole, we assign a Gaussian (with ) weight to each Mira according to its latitude in the great circle coordinate system. The density of stars in the plane of poles is shown in the right panel of Fig. 13 in Galactic coordinates. The two most prominent over-densities are located near and are marked with red and yellow empty circles. The corresponding great circles are over-plotted in the left panel. Interestingly, the two great circle pass very close to the LMC and are approximately aligned with the motion of the Cloud on the plane of the sky. This tentative detection of the Magellanic debris traced by Miras is in agreement with the earlier study of Deason et al. (2017). Additionally, we identify three other, lower significance over-densities marked in green, blue and violet, whose corresponding great circles are shown in the left panel with dotted lines.
3.3 Satellite Galaxy and Globular Cluster Associations
Although AGB stars have been surveyed in the Local Group dwarf spheroidals (dSphs), the only confirmed detection of an O-Mira is in Sextans (Sakamoto et al., 2012). There are two C-Miras, but no O-Mira, so far found in Sculptor (Menzies et al., 2011). Whitelock et al. (2009) report 6 C-Miras in Fornax – a further candidate (F51010 in their notation) is so blue that they were unable to determine from its colours whether it was C-rich or O-rich.
The spatial coordinates of the O-Mira are compared against those of known objects within the Local Group. We search for associations by requiring the O-Mira to lie less than half a degree from the centers of globular clusters and dSphs in the Local Group. We use half a degree because many of these objects are expected to have extra-tidal stars. Given that Miras correspond to a short-lived phase of stellar evolution, they are intrinsically extremely rare and so any chance association is a priori very unlikely.
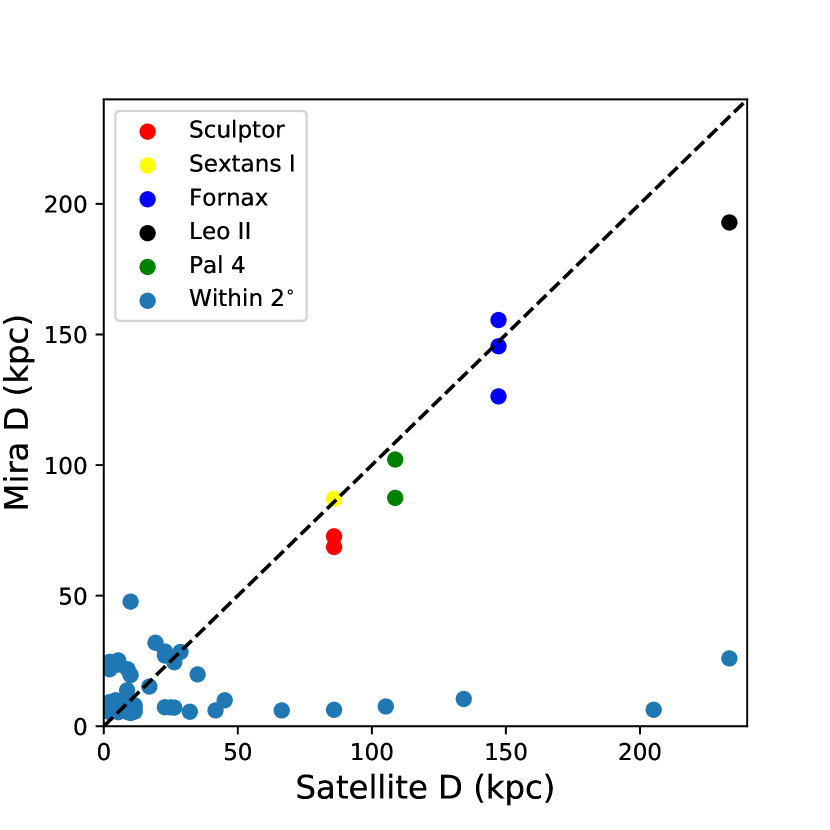
Potential associations exist with the Sculptor, Fornax, Sextans and the Leo II dwarf dSphs based on angular separation, as illustrated in Fig. 14. Our candidates are checked to be O-Mira by confirming their location in Fig. 1. This shows all the candidate associations to be clearly O-Mira lying comfortably within our criteria. The CRTS IDs, distances, periods and amplitudes of our candidates are listed in Table 2. It would be interesting to confirm the candidates with kinematic evidence, which may already be possible with proper motion data from the forthcoming data release 2 of the Gaia satellite.
We also identified two O-Mira that are located close to the Palomar 4 (Pal 4) globular cluster. This is a young halo globular cluster that is likely to have been accreted by the Milky Way via the infall of its parent dwarf satellite. The two O-Mira are at heliocentric distances of 87 kpc and 102 kpc, compared to a distance of Pal 4 of 109 kpc (Sohn et al., 2003). The latter authors carried out deep photometric searches in a field around Pal 4, and claimed evidence for the existence of extra-tidal tails and features. Although semi-regular variables are known in Pal 4, this is the first report of possible Miras.
| CRTS ID | Period (days) | Amplitude | Mira D (kpc) | Satellite | Satellite D (kpc) | Age estimate (Gyr) |
|
|||
|---|---|---|---|---|---|---|---|---|---|---|
| J005958.9-332834 | 196 | 1.1 | 72 6 | Sculptor | 86 6 | 6 | 0.2 | |||
| J010120.8-335304 | 92 | 0.8 | 69 5 | Sculptor | 86 6 | 10 | 0.3 | |||
| J101234.2-013440 | 120 | 1.1 | 87 7 | Sextans (I) | 86 4 | 10 | 0.1 | |||
| J023822.6-343804 | 163 | 0.8 | 145 12 | Fornax | 147 12 | 9 | 0.4 | |||
| J023910.7-343920 | 157 | 0.9 | 126 10 | Fornax | 147 12 | 10 | 0.3 | |||
| J024045.9-343453 | 143 | 0.8 | 156 12 | Fornax | 147 12 | 10 | 0.2 | |||
| J111320.6+221116 | 184 | 0.8 | 193 15 | LeoII | 233 14 | 7 | 0.05 | |||
| J112912.3+285815 | 151 | 1.9 | 87 7 | Pal 4 | 100 | 10 | 0.02 | |||
| J112914.6+285814 | 131 | 1.3 | 102 8 | Pal 4 | 100 | 10 | 0.009 |
4 Conclusions
This paper has highlighted a neglected resource. The Miras are bright and can be traced throughout the Galaxy, and beyond. The carbon-rich or C-Miras have a long history of use as tracers of halo substructure (e.g., Downes et al., 2004; Huxor & Grebel, 2015). However, the oxygen-rich or O-Miras have been less widely scrutinised, yet they are at least as valuable. Their period and luminosity only weakly depends on colour, so the O-Miras are excellent distance indicators. Their period depends on age, with young O-Miras having the longest periods, so the O-Miras are excellent chronometers. So, samples of Miras will enable us to detect age gradients throughout the Galaxy and to date the Galactic populations. Here, we have used the Catalina Surveys and the All Sky Automated Survey for Supernovae to extract a clean sample of O-Miras, the largest assembled to date. They probe the Galactic bulge, thin and thick discs and the distant halo. In principle, they offer a unique resource to age-date all the structural components of the Galaxy.
We show that the disc O-Miras have periods increasing on moving outwards from to 15 kpc. As the period of O-Miras correlates inversely with age, this is a clear demonstration of the ’inside out’ nature of the Galactic disc (e.g., Martig et al., 2016b). The outer disc O-Miras have median period days (roughly 1-3 Gyrs), as compared to the inner disc value of days (roughly 8-10 Gyrs). At least out to 15 kpc, there is no evidence of an upturn in the radial profile of the age of disc, as expected from models in which the outer disc is populated by old stars which migrated from the inner disc (Roškar et al., 2008). There are also hints of vertical variation, in the sense that O-Miras at higher comprise an older population for given radius . At smaller Galactocentric distances, within 2-3 kpc from the MW center, age gradients flatten out, signaling that the bulge contains a mix of stellar ages, in agreement with earlier studies (see e.g. Catchpole et al., 2016). Moving away from the center, clearly visible in our data is the transition from younger disc to older halo O-Miras, which occurs at kpc where the median O-Mira period plummets. The median period of the halo O-Miras is days (roughly 10 Gyrs).
O-Mira are also precious as tracers outside the Galactic disc. The tails from the Sagittarius are detectable in O-Miras, much like their brethren the C-Miras. Moreover, we find strong evidence that for the O-Miras in the Magellanic Stream at large distances from the LMC. There is also a population of long period, and hence young, O-Miras that follow the extent of the Galactic disc, but lie at heights of up to 10 kpc. These may be stars kicked out of the disc, perhaps analogous to other high latitude structures (Bergemann et al., 2018; Sheffield et al., 2018; Deason et al., 2018a). The O-Miras are so intrinsically luminous that they can trace the very outermost reaches of the halo. We identify seven long-period (and therefore likely young) O-Miras reaching distances between 200 and 500 kpc, much beyond presently known record holders. A good fraction of the Miras with extreme distances appear clustered on the sky, not too far from the position where distant extensions of the Sgr stream, the LMC trailing arm and the Pisces Cloud are expected. In addition to the detection of distant debris piles associated with accretion events, we have also provided new detections of O-Miras in Milky Way satellites. Specifically, we found associations between O-Mira and the Fornax, Sculptor, Sextans and Leo II Galactic dwarf spheroidals, as well as the distant globular cluster Pal 4.
The Gaia satellite will dramatically increase the data on Mira. Although the main variable star data release occurs in 2020, Gaia Data Release 2 will already provide classifications for 500,000 variable stars, including many Miras. This offers the opportunity to select high quality samples of O-Miras, use the period-age relationship as a prior and provide ages of the main Galactic components as a function of distance. This will provide independent confirmation of ages estimates derived from isochrones. The opportunity to slice the Galaxy by age will soon be given to us. We are optimistic that the future for Miras is very bright.
Acknowledgments
JG acknowledges financial support from the Science and Technology Facilities Council. We thank members of the Cambridge Streams group for helpful comments as this work was in progress. Iulia Simion, Alis Deason, Victor Debattista and Patricia Whitelock are thanked for helpful comments on the draft manuscript. The research leading to these results has received funding from the European Research Council under the European Union’s Seventh Framework Programme (FP/2007-2013) / ERC Grant Agreement n. 308024.
References
- Amôres et al. (2017) Amôres E. B., Robin A. C., Reylé C., 2017, A&A, 602, A67
- An et al. (2004) An J. H., et al., 2004, MNRAS, 351, 1071
- Battinelli & Demers (2014) Battinelli P., Demers S., 2014, A&A, 568, A100
- Baumgardt et al. (2013) Baumgardt H., Parmentier G., Anders P., Grebel E. K., 2013, MNRAS, 430, 676
- Belokurov et al. (2014) Belokurov V., et al., 2014, MNRAS, 437, 116
- Bergemann et al. (2018) Bergemann M., et al., 2018, Nature, 555, 334
- Besla et al. (2013) Besla G., Hernquist L., Loeb A., 2013, MNRAS, 428, 2342
- Blommaert & Groenewegen (2007) Blommaert J. A. D. L., Groenewegen M. A. T., 2007, in Vallenari A., Tantalo R., Portinari L., Moretti A., eds, Astronomical Society of the Pacific Conference Series Vol. 374, From Stars to Galaxies: Building the Pieces to Build Up the Universe. p. 193
- Bochanski et al. (2014) Bochanski J. J., Willman B., Caldwell N., Sanderson R., West A. A., Strader J., Brown W., 2014, ApJ, 790, L5
- Bono et al. (2005) Bono G., Marconi M., Cassisi S., Caputo F., Gieren W., Pietrzynski G., 2005, ApJ, 621, 966
- Carollo et al. (2016) Carollo D., et al., 2016, Nature Physics, 12, 1170
- Carpenter (2001) Carpenter J. M., 2001, AJ, 121, 2851
- Catchpole et al. (2016) Catchpole R. M., Whitelock P. A., Feast M. W., Hughes S. M. G., Irwin M., Alard C., 2016, MNRAS, 455, 2216
- Cioni et al. (2001) Cioni M.-R. L., Marquette J.-B., Loup C., Azzopardi M., Habing H. J., Lasserre T., Lesquoy E., 2001, A&A, 377, 945
- Deason et al. (2012) Deason A. J., et al., 2012, MNRAS, 425, 2840
- Deason et al. (2017) Deason A. J., Belokurov V., Erkal D., Koposov S. E., Mackey D., 2017, MNRAS, 467, 2636
- Deason et al. (2018a) Deason A. J., Belokurov V., Koposov S. E., 2018a, MNRAS, 473, 2428
- Deason et al. (2018b) Deason A. J., Belokurov V., Koposov S. E., 2018b, ApJ, 852, 118
- Diaz & Bekki (2012) Diaz J. D., Bekki K., 2012, ApJ, 750, 36
- Dierickx & Loeb (2017) Dierickx M. I. P., Loeb A., 2017, ApJ, 836, 92
- Downes et al. (2004) Downes R. A., et al., 2004, AJ, 127, 2838
- Drake et al. (2013) Drake A. J., et al., 2013, ApJ, 765, 154
- Drake et al. (2014) Drake A. J., et al., 2014, ApJS, 213, 9
- Drake et al. (2017) Drake A. J., et al., 2017, Monthly Notices of the Royal Astronomical Society, 469, 3688
- Efremov (1978) Efremov I. N., 1978, Soviet Ast., 22, 161
- Elgueta et al. (2016) Elgueta S. S., et al., 2016, AJ, 152, 29
- Feast (2007) Feast M., 2007, in Kerschbaum F., Charbonnel C., Wing R. F., eds, Astronomical Society of the Pacific Conference Series Vol. 378, Why Galaxies Care About AGB Stars: Their Importance as Actors and Probes. p. 479 (arXiv:astro-ph/0609318)
- Feast (2009) Feast M. W., 2009, in Ueta T., Matsunaga N., Ita Y., eds, AGB Stars and Related Phenomena. p. 48 (arXiv:0812.0250)
- Feast & Whitelock (2000) Feast M. W., Whitelock P. A., 2000, MNRAS, 317, 460
- Feast et al. (1989) Feast M. W., Glass I. S., Whitelock P. A., Catchpole R. M., 1989, MNRAS, 241, 375
- Feast et al. (2006) Feast M. W., Whitelock P. A., Menzies J. W., 2006, MNRAS, 369, 791
- Gibbons et al. (2017) Gibbons S. L. J., Belokurov V., Evans N. W., 2017, MNRAS, 464, 794
- Glass et al. (1995) Glass I. S., Whitelock P. A., Catchpole R. M., Feast M. W., 1995, MNRAS, 273, 383
- Habing & Olofsson (2003) Habing H. J., Olofsson H., eds, 2003, Asymptotic giant branch stars
- Harris (1996) Harris W. E., 1996, AJ, 112, 1487
- Huang et al. (2018) Huang C. D., et al., 2018, preprint, (arXiv:1801.02711)
- Huxor & Grebel (2015) Huxor A. P., Grebel E. K., 2015, MNRAS, 453, 2653
- Ibata et al. (2001) Ibata R., Lewis G. F., Irwin M., Totten E., Quinn T., 2001, ApJ, 551, 294
- Jayaraman et al. (2013) Jayaraman A., Gilmore G., Wyse R. F. G., Norris J. E., Belokurov V., 2013, MNRAS, 431, 930
- Jayasinghe et al. (2018) Jayasinghe T., et al., 2018, preprint, (arXiv:1803.01001)
- Jethwa et al. (2016) Jethwa P., Erkal D., Belokurov V., 2016, MNRAS, 461, 2212
- Johnston et al. (1996) Johnston K. V., Hernquist L., Bolte M., 1996, ApJ, 465, 278
- Jurić et al. (2008) Jurić M., et al., 2008, ApJ, 673, 864
- Kamath et al. (2010) Kamath D., Wood P. R., Soszyński I., Lebzelter T., 2010, MNRAS, 408, 522
- Kharchenko et al. (2016) Kharchenko N. V., Piskunov A. E., Schilbach E., Röser S., Scholz R. D., 2016, A&A, 585
- Koposov et al. (2015) Koposov S. E., Belokurov V., Zucker D. B., Lewis G. F., Ibata R. A., Olszewski E. W., López-Sánchez Á. R., Hyde E. A., 2015, MNRAS, 446, 3110
- López-Corredoira (2017) López-Corredoira M., 2017, ApJ, 836, 218
- Lorenz et al. (2011) Lorenz D., Lebzelter T., Nowotny W., Telting J., Kerschbaum F., Olofsson H., Schwarz H. E., 2011, A&A, 532, A78
- Lynden-Bell & Lynden-Bell (1995) Lynden-Bell D., Lynden-Bell R. M., 1995, MNRAS, 275, 429
- Majewski et al. (2003) Majewski S. R., Skrutskie M. F., Weinberg M. D., Ostheimer J. C., 2003, ApJ, 599, 1082
- Martig et al. (2016a) Martig M., et al., 2016a, MNRAS, 456, 3655
- Martig et al. (2016b) Martig M., Minchev I., Ness M., Fouesneau M., Rix H.-W., 2016b, ApJ, 831, 139
- Mateu et al. (2011) Mateu C., Bruzual G., Aguilar L., Brown A. G. A., Valenzuela O., Carigi L., Velázquez H., Hernández F., 2011, MNRAS, 415, 214
- Matsunaga et al. (2017) Matsunaga N., Menzies J. W., Feast M. W., Whitelock P. A., Onozato H., Barway S., Aydi E., 2017, MNRAS, 469, 4949
- Matsuura et al. (2009) Matsuura M., et al., 2009, MNRAS, 396, 918
- Mauron (2008) Mauron N., 2008, A&A, 482, 151
- Mauron et al. (2018) Mauron N., Gigoyan K. S., Kostandyan G. R., 2018, Astrophysics, 61, 83
- McConnachie (2012) McConnachie A. W., 2012, AJ, 144, 4
- Medina et al. (2018) Medina G. E., et al., 2018, ApJ, 855, 43
- Menzies et al. (2011) Menzies J. W., Feast M. W., Whitelock P. A., Matsunaga N., 2011, MNRAS, 414, 3492
- Ness et al. (2016) Ness M., Hogg D. W., Rix H.-W., Martig M., Pinsonneault M. H., Ho A. Y. Q., 2016, ApJ, 823, 114
- Nidever et al. (2008) Nidever D. L., Majewski S. R., Butler Burton W., 2008, ApJ, 679, 432
- Nie et al. (2015) Nie J. D., et al., 2015, ApJ, 810, 153
- Nishida et al. (2000) Nishida S., Tanabé T., Nakada Y., Matsumoto S., Sekiguchi K., Glass I. S., 2000, MNRAS, 313, 136
- Ojha (2001) Ojha D. K., 2001, MNRAS, 322, 426
- Rocha-Pinto et al. (2004) Rocha-Pinto H. J., Majewski S. R., Skrutskie M. F., Crane J. D., Patterson R. J., 2004, ApJ, 615, 732
- Roškar et al. (2008) Roškar R., Debattista V. P., Stinson G. S., Quinn T. R., Kaufmann T., Wadsley J., 2008, ApJ, 675, L65
- Sakamoto et al. (2012) Sakamoto T., Matsunaga N., Hasegawa T., Nakada Y., 2012, ApJ, 761, L10
- Schlegel et al. (1998) Schlegel D. J., Finkbeiner D. P., Davis M., 1998, ApJ, 500, 525
- Sesar et al. (2007) Sesar B., et al., 2007, AJ, 134, 2236
- Sesar et al. (2017) Sesar B., et al., 2017, AJ, 153, 204
- Sheffield et al. (2018) Sheffield A. A., Price-Whelan A. M., Tzanidakis A., Johnston K. V., Laporte C. F. P., Sesar B., 2018, ApJ, 854, 47
- Sohn et al. (2003) Sohn Y.-J., et al., 2003, AJ, 126, 803
- Soszyński et al. (2009a) Soszyński I., et al., 2009a, Acta Astron., 59, 239
- Soszyński et al. (2009b) Soszyński I., et al., 2009b, Acta Astron., 59, 239
- Totten & Irwin (1998) Totten E. J., Irwin M. J., 1998, MNRAS, 294, 1
- Watkins et al. (2009) Watkins L. L., et al., 2009, MNRAS, 398, 1757
- Whitelock et al. (2006) Whitelock P. A., Feast M. W., Marang F., Groenewegen M. A. T., 2006, MNRAS, 369, 751
- Whitelock et al. (2008) Whitelock P. A., Feast M. W., Van Leeuwen F., 2008, MNRAS, 386, 313
- Whitelock et al. (2009) Whitelock P. A., Menzies J. W., Feast M. W., Matsunaga N., Tanabé T., Ita Y., 2009, MNRAS, 394, 795
- Xu et al. (2015) Xu Y., Newberg H. J., Carlin J. L., Liu C., Deng L., Li J., Schönrich R., Yanny B., 2015, ApJ, 801, 105
- Yuan et al. (2017) Yuan W., Macri L. M., He S., Huang J. Z., Kanbur S. M., Ngeow C.-C., 2017, AJ, 154, 149
- de Boer et al. (2018) de Boer T. J. L., Belokurov V., Koposov S. E., 2018, MNRAS, 473, 647