Mechanical control of crystal symmetry and superconductivity in Weyl semimetal MoTe2
Abstract
The non-centrosymmetric Weyl semimetal candidate, MoTe2 was investigated through neutron diffraction and transport measurements at pressures up to 1.5 GPa and at temperatures down to 40 mK. Centrosymmetric and non-centrosymmetric structural phases were found to coexist in the superconducting state. Density Functional Theory (DFT) calculations reveal that the strength of the electron-phonon coupling is similar for both crystal structures. Furthermore, it was found that by controlling non-hydrostatic components of stress, it is possible to mechanically control the ground state crystal structure. This allows for the tuning of crystal symmetry in the superconducting phase from centrosymmetric to non-centrosymmetric. DFT calculations support this strain control of crystal structure. This mechanical control of crystal symmetry gives a route to tuning the band topology of MoTe2 and possibly the topology of the superconducting state.
Topological superconductivity, which arises when a bulk superconducting state coexists with a topologically non-trivial band structure, leading to gapless surface states in a superconducting system, is of particular interest and excitement due to the possibility of stabilizing exotic Majorana excitationsSato and Ando (2017). One promising route to realizing topological superconductivity is finding superconductivity in materials with topologically non-trivial band structures, as is found in semimetallic MoTe2, where both a type II Weyl Semimetallic state and a superconducting state have been reported Qi et al. (2016); Luo et al. (2016); Guguchia et al. (2017); Huang et al. (2016); Deng et al. (2016, 2017); Rhodes et al. (2017a). This type II Weyl semimetallic state is enabled by an inversion symmetry breaking structural transition which takes place at a transition temperature (TS) around 250 K Clarke et al. (1978); Brown (1966); Takahashi et al. (2017). The superconductivity, the topology, and structure of MoTe2 have been demonstrated to be strongly influenced by both doping Rhodes et al. (2017a); Cho et al. (2017); Rhodes et al. (2017b); Chen et al. (2016a); Belopolski et al. (2016); Lv et al. (2017); Oliver et al. (2017); Takahashi et al. (2017) and pressure Qi et al. (2016); Guguchia et al. (2017); Takahashi et al. (2017). Interestingly, pressure and doping increase the superconducting transition temperature (Tc) while apparently reducing TS, though the coupling between the electronic ground state and the crystal structure is an open question. Here we study the effect of pressure on both superconductivity and the observed structural phase transition in detail and show that the deliberate application of pressure in hydrostatic or non-hydrostatic form allows us to control the crystal symmetry in this material and thus gives us a route to tuning the topology of the superconducting state.
The proposed type-II Weyl semimetal and superconductor MoTe2 offers the opportunity for realizing topological superconductivity through the coexistence of a topologically nontrivial band structure with superconductivity. An open question in this material is the nature of the interplay between pressure, the electronic ground state, and the structural transition between a centrosymmetric monoclinic structure (the 1T’ phase) and a non-centrosymmetric orthorhombic structure (the Td phase). We show through a combination of temperature and pressure dependent transport and elastic neutron scattering measurements that the two possible structures can coexist at a range of pressures and temperatures concurrent with superconductivity. We also illustrate that the ground state crystal structure can be controlled independent of the superconductivity through non-hydrostatic stress, allowing for a centrosymmetric superconducting state, a non-centrosymmetric superconducting ground state, or a superconducting mixed structure state. Our Density Functional Theory (DFT) calculations illustrate the near degeneracy of the two structural phases as well as the small energy barrier between phases, explaining our observation of a mixed phase state under hydrostatic pressure conditions. Unlike the typical case of inversion symmetry breaking structural transitions in perovskite ferroelectrics or geometrically designed polar metals Kim et al. (2016); Benedek and Fennie (2013), we also show that this structural transition is driven not by a phonon mode softening to an imaginary vibrational frequency as is suggested in Duerloo et al. (2014), but rather due to entropic considerations. Our calculations illustrate that the pressure dependent superconductivity in MoTe2 can be reproduced from single layer simulations, consistent with the decoupling of ground state structure and superconductivity. Further, our calculations offer justification for why non-hydrostatic stresses alter the ground state crystal structure and allow for selection between centrosymmetric and non-centrosymmetric states.
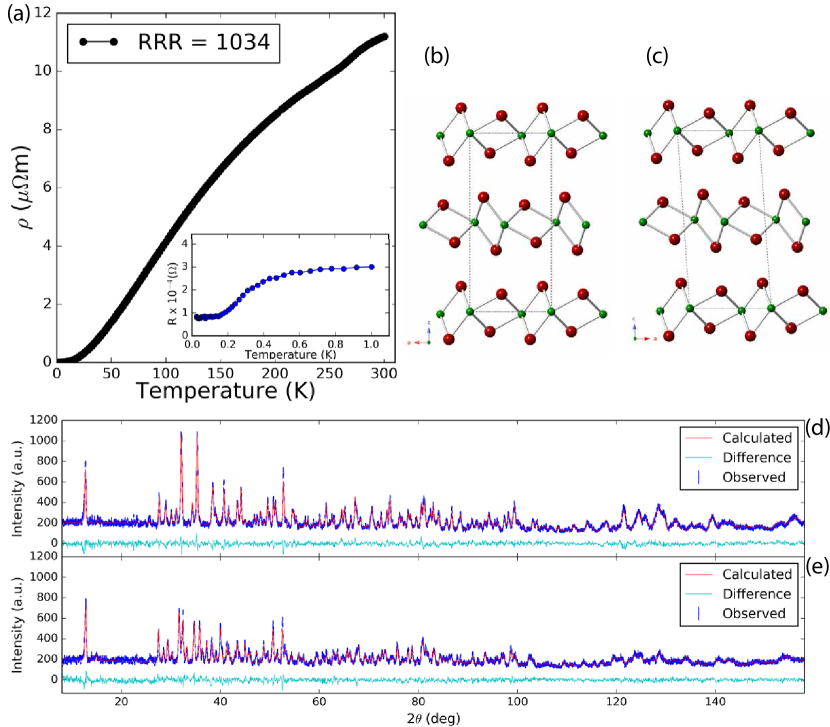
We have performed temperature dependent longitudinal resistivity measurements as well as longitudinal magnetoresistance measurements on a variety of crystals from multiple batches as described in the supplement sup (a). The results for a typical crystal are shown in figure 1(a). We clearly see the transport anomaly associated with the structural transition (at ) from the monoclinic 1T’ phase to the Td phase Qi et al. (2016); Rhodes et al. (2017a); Zandt et al. (2007); Hughes and Friend (1978). This particular crystal shows a RRR value (defined as the ratio of the resistance at 300 K to the resistance at 2 K) of >1000 as well as a MR ratio of >190,000% at 2 K and 15 T which illustrates the high sample quality. From electron probe microanalysis/wavelength-dispersive x-ray spectroscopy(EPMA-WDX), we measure that our crystals have stoichiometric composition within our measurement error, with no obvious trends in RRR value with sample composition and no apparent composition gradients within a given crystal. As is shown in the inset of figure 1 (a), this sample also has a resistive turnover above a temperature of 0.4 K indicating the onset of superconductivity (Tc), which is consistent with the sample quality dependent superconductivity reported in Rhodes et al. (2017a). However, we do not see a full transition to a zero resistance state at ambient pressure down to 25 mK in contrast with previous reports of superconductivity in this system Guguchia et al. (2017); Qi et al. (2016); Rhodes et al. (2017a); Takahashi et al. (2017). Partial volume fraction superconductivity is confirmed with single crystal ac-susceptibility measurements illustrating the onset of superconductivity with small volume fractions at ambient pressure.
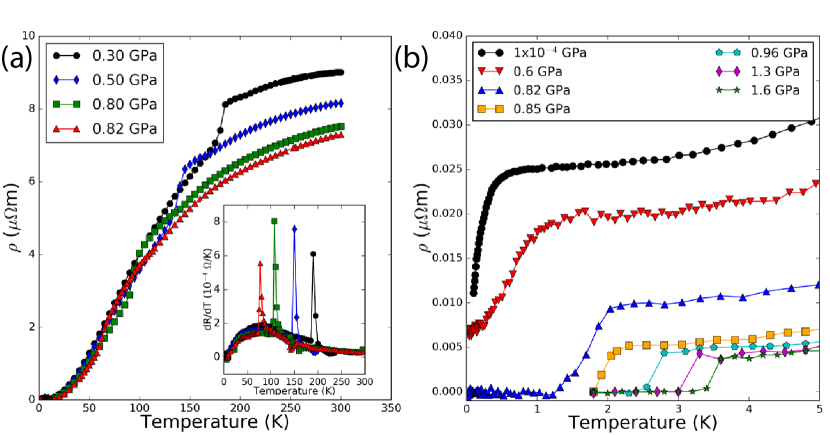
The relationship between pressure enhancement of superconductivity and the pressure driven transition to the 1T’ state from the Td state in both MoTe2 and WTe2 have been taken as evidence of a relationship between the structural transition and Tc enhancement Takahashi et al. (2017); Lu et al. (2016) though this is not a settled matter in either material Zhou et al. (2016); Guguchia et al. (2017); Takahashi et al. (2017). Via transport measurements, we are able to track a suppression of the Td phase with pressure up to 0.82 GPa where TS is suppressed to below 80 K as is shown in figure 2(a). Further increases in pressure show no obvious kink in the resistivity nominally indicating that the non-centrosymmetric phase is unstable above 0.8 GPa, in contrast with the pressure phase diagram in Qi et al. (2016) but consistent with the reports of Takahashi et al. (2017) where the crystal symmetry change is assumed to enhance superconductivity. Furthermore, this 0.82 GPa pressure is also the point at which we observe the transition from a partially superconducting state to a full zero resistance state as is shown in figure 2(b).
Since the Weyl semimetal state can only exist with broken inversion symmetry, it is critical to directly probe the crystal structure of MoTe2 in the superconducting state. Using elastic neutron scattering we have probed the 1T’ to Td structural transition as a function of pressure and temperature. To do this, we selected one set of reflections distinct between the Td and 1T’ phases in one crystal zone (the (201) like reflections) and one set of reflections common to both phases (the (008) reflections) in the same zone and monitored those reflections through phase space. The convention for labeling (hkl) and crystallographic a, b, and c axes in the Td and 1T’ phases varies in the literature. Our convention for axis labeling and our reflection choice is explained in supplement section II. A sup (b). We will refer to the distinct reflections as the monoclinic (coming from the 1T’ phase fraction) and orthorhombic (coming from the Td phase fraction) reflections while referring to the common reflections as the (00l) reflections. Details of the various neutron scattering measurements can be found in the experimental methods section sup (a).
At ambient pressure, we clearly see a first order transition from the 1T’ to the Td phase upon cooling from room temperature while monitoring both the monoclinic and orthorhombic reflections, with a large coexistence region of more than 50 K. The mixed phase state is stable at these temperatures for timescales on the order of hours. Upon heating, we observe the return to the 1T’ phase, though we observe a much larger coexistence region than is seen from transport. Our coexistence region is in line with previous Raman measurements and x-ray measurements which show a coexistence region of >50 K and the survival of a mode attributed to the Td phase up to room temperature upon warming from the Td phase Chen et al. (2016b); Clarke et al. (1978). This suggests that the transport signature, while clearly linked with the structural transition, is not a direct measure of the structural transition volume fraction. Instead, it may be indicating a percolation-like transition upon cooling (warming) with increasing (decreasing) Td phase fraction. We also note that we see equal monoclinic twin populations both in the as grown samples and after cycling through the phase transition.
We next cooled our crystal down to 40 mK and confirmed that we saw no evidence of any reentrant monoclinic phase transition upon the onset of superconductivity. We also performed reciprocal space maps at a range of temperatures between 40 mK and 2 K, and see no evidence of any modulation of the intensity or shape of the orthorhombic reflections as the sample crosses the measured Tc for partial superconductivity. Despite our observation that our crystals do not reach a zero resistance state by 25 mK, if superconductivity were confined to monoclinic sample regions we would have expected to see a monoclinic phase fraction in the scattering.
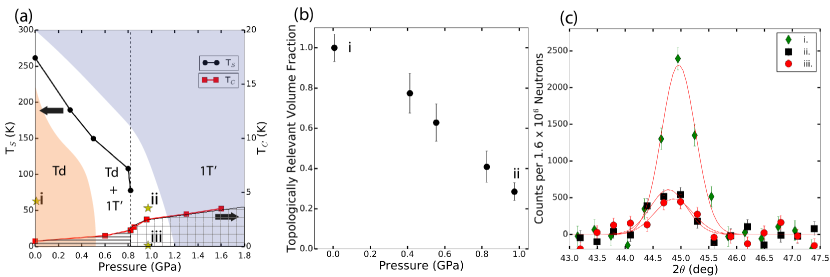
Using a steel based gas pressure cell compatible with in situ neutron scattering as described in the supplement sup (a) and illustrated in figure 4(a), we monitored the same orthorhombic and monoclinic reflections as well as an (008) reflection over a pressure range from 0.02 GPa to 1 GPa in a temperature range from 1.5 K to 100 K. We initial cooled our sample to 63 K at 0.02 GPa and confirmed the expected Td structure at this phase point (point i in figure 3 A). The 63 K temperature is chosen to maintain the He pressure medium in a liquid or gaseous state over the entire pressure range up to 1 GPa. We then increased the pressure by supplying more He gas, and monitored the integrated intensity of longitudinal scans at the orthorhombic position. For these neutron measurements, all error bars and confidence intervals are given by standard deviations of the Poisson distribution.
Upon pressure increase, we immediately observe the start of the transition from the Td to the 1T’ phase, but surprisingly we see that a significant phase fraction (305 %) of the Td phase survives up to our maximum pressure of 1 GPa, which is well above the nominal critical pressure from transport Takahashi et al. (2017). This pressure dependence of the Td phase fraction is shown in figure 3(b), where the extracted phase fractions come from the ratio of the integrated intensity of the orthorhombic reflection (labeled as the (201)O reflection) at a given temperature and pressure to the intensity at 0.02 GPa and 63 K where we have full volume fraction Td. We then cool from 63 K down to 1.5 K while maintaining 1 GPa, we see no obvious change in the phase fraction of the Td phase, which is shown in figure 3(c). It should be noted that due to differences in the structure factor between the monoclinic reflections and the orthorhombic reflection, as well as monoclinic twinning, the orthorhombic reflection is significantly more intense than the monoclinic reflections which limits our ability to detect small phase fractions of monoclinic phase above our background level. While we see a reduction in the orthorhombic peak intensity by 0.4 GPa, we do not see intensity at the monoclinic position until 0.6 GPa, and we attribute this is to our detection limits. By tracking the angular position of the monoclinic reflections we can track the angle of the 1T’ phase. We observe that increases with pressure, consistent with both our DFT calculations (Fig S2.) and with previously reported x-ray diffraction measurements Qi et al. (2016). Importantly, as we observe intensity at the monoclinic peak positions, we see equal scattering intensity from both expected monoclinic twins in this zone indicating pressure homogeneity.
Our study has uncovered a complex interplay between the crystal structure of this system and the underlying electronic ground state. Below 0.8 GPa, our transport measurements indicate partial volume fraction superconductivity and show a strong anomaly related to the Td to 1T’ transition. The neutron diffraction measurements show that the phase fraction of the low-pressure Td phase also drops below 50% at 0.8 GPa. In contrast, previous ac-susceptibility and SR measurements indicate that within this pressure regime, full volume fraction superconductivity is achieved Guguchia et al. (2017). The large phase coexistence region in both pressure and temperature suggests that the Td and 1T’ phases are very close in energy. To address this interplay between pressure, structure, and superconductivity, we turn to first-principles calculations. In particular, we have calculated the pressure dependence of the stability of each phase, the reaction path between the measured structures, how the electron-phonon coupling changes between the Td and 1T’ phases, and whether both structures would be expected to support superconductivity. The details of these calculations are given in the supporting information sup (c).
Our total energy calculations indicate that (see Fig.S1) both phases are nearly degenerate and only separated by an energy barrier of 0.8 meV, in agreement with recent calculations Kim et al. (2017) but in contrast to previous assumptions as to the origin of the large phase coexistence region between the Td and 1T’ phases Clarke et al. (1978); Dawson and Bullett (1987). The centrosymmetric phase always has a slightly lower volume than the non-centrosymmetric phase with applied pressure and therefore at high pressure the enthalpy term prefers 1T’ over as shown in Fig.S3 justifying the pressure driven suppression of TS. We have also calculated full phonon dispersion curves for both phases at different pressures up to 10 GPa and did not find any phonon softening to explain this structural transition(see Fig.S4-S5) in contrast to Duerloo et al. (2014). Interestingly, the calculated free-energy when considering the full phonon dispersions at ambient pressure also prefers the 1T’ phase over the phase at high temperatures as in the case of enthalpy. Hence, the observed phase transition is not soft-phonon driven but rather entropy driven.
To better explain this non-intuitive result we offer the following explanation. Qualitatively, when viewed orthogonal to the orthorhombic b-c plane (as is shown in figure 1(b)), the Mo-Te zig-zag chains of atoms resemble opposed saw-teeth across the van der Waals bonding. If one were to slide these two sheets past each other along the orthorhombic b direction they would observe a periodic potential as the saw-teeth pass each other. As shown in figure S4(a), the inter-plane sliding mode along the long-axis is very anharmonic and features two shallow minima. In the lowest energy minimum, the MoTe2 planes (i.e. saw-teeth points) are more on top of each other and the curvature of one minima is slightly larger than the other. This results in slightly higher phonon energies and also gives a larger c-axis lattice parameter. When one of the planes slides a small amount and enters the minima along b, the teeth of the saw-like planes interlock, causing a c-axis contraction but lowering the energy required for a transverse motion along a, giving lower phonon energies and higher entropy. Hence, at high temperature the system prefers this interlocked configuration where the c-axis is shorter and inter-sliding phonons are lower in energy (i.e. higher entropy). This observation is consistent with the observed negative thermal expansion and the longer c-axis of the lower temperature Td phase. When we cool the system, entropy is less important and the system prefers to be at the minimum energy configuration with the planes aligned on top of each other with a longer c-axis and orthorhombic symmetry, but higher phonon energies.
We have also calculated the electron-phonon coupling () for both structures. Despite the strong apparent correlation between structure and superconductivity, the calculated coupling in both phases is very similar, indicating that the main contribution to superconductivity comes from within a single layer MoTe2 unit. Indeed we found very similar for both single layer MoTe2 and bulk-like MoTe2 (see SI. Section D)sup (c). For both bulk-like phases and the single layer analogue, we find that all phonon modes contribute to . This phase independent and apparent isotropic and energy independent contribution to suggests that there is some other contribution to superconductivity enhancement in MoTe2 beyond the structural transition. The main difference between bulk-like and single layer MoTe2 is found to be the pressure dependence of the . For the case of bulk MoTe2 we did not find significant pressure dependence (Fig.S12) while for a single layer, Tc is increased by an order of magnitude at 10 GPa pressure (Fig. S9) as experimentally observed Qi et al. (2016).
The single layer nature of and the large structural phase coexistence region raises interesting questions about the nature and origins of superconductivity in MoTe2. The previously observed full volume fraction superconductivity from ac-susceptibility and SR in this coexistence region rules out the possibility that superconductivity is living only in isolated regions of the sample where single layers may be structurally decoupled. The interesting 2 gap model needed to explain the temperature dependence of eff-2 (where eff is the powder average effective magnetic penetration depth) in pressure dependent SR could indicate that there is a different superconductivity living in the two phases Guguchia et al. (2017). The nature of the interfaces between non-centrosymmetric and centrosymmetric regions of the sample in the mixed phase may further lead to novel physics and potentially different superconducting states between the two regions. These interfacial regions may even support novel band topologies given the broken symmetry at the interfaces and the possibility for a Weyl semimetal in proximity to a superconductor. The apparent single layer nature of the pressure dependence of and the Tc enhancement observed empirically hints that some kind of single layer decoupling happens with hydrostatic pressure which is surprising. This could be due in part to the expected large number of stacking faults for a Van der Waals bonded material, which have been demonstrated in MoTe2Yan et al. (2017); Manolikas et al. (1979). This is not to say that we are creating new stacking faults with pressure, but rather that pressure appears to make the system more quasi-2D, which may be related to interactions and dynamics of pre-existing planar defects like stacking faults. Furthermore, while the SR study did not consider this, if this pressure enhanced superconductivity is quasi-2D and there is a spin-triplet component to the pairing (allowed by symmetry) this may be a further route to topological superconductivity Sato and Ando (2017); Sato and Fujimoto (2009); Tanaka et al. (2009). Further characterization of the nature of superconductivity in the system that considers the actual populations of the two structural phases and their interfaces is needed to explore these possibilities.
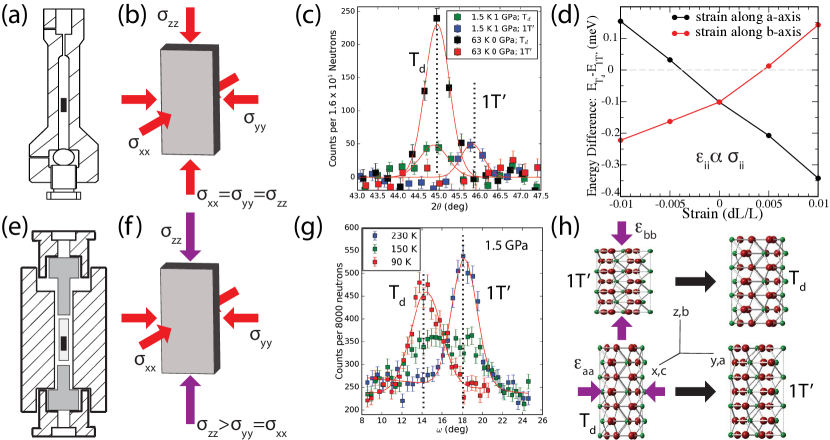
Since we now do not expect that enhanced superconductivity must live only in the centrosymmetric volume fraction of a crystal, we can ask whether there is a way to independently control crystal symmetry and superconductivity. Given the small energy difference between the two phases, one might expect that experimentally achievable strains might also influence the preferred crystal structure. Indeed, our calculations shown in figure 4(d) show that uniaxial strain can stabilize either the Td or 1T’ phase depending on the crystallographic axis along which the strain is applied.
In an effort to take advantage of the calculated uniaxial strain dependence of the ground state crystal structure, we have also performed structural measurements at the Oak Ridge National Laboratory High-Flux Isotope Reactor on the HB-3A four-circle diffractometer Chakoumakos et al. (2011). Here a clamp cell with a fluorinated pressure medium is used, similar to the cell described here Aso et al. (2006). This fluorinated pressure medium has also been demonstrated to be non-hydrostatic above 0.8 GPa, leading to a non-hydrostatic pressure environment in our cell Sidorov and Sadykov (2005). Figures 4 (a) and (b) illustrate the different cell geometries while (e) and (f) illustrate the difference stress environments within the cells. Here we have taken the standard notation where hydrostatic pressure corresponds to a stress tensor with equal and negative (compressive) diagonal components. With the clamping axis applying an larger uniaxial compressive stress along the monoclinic notation crystallographic b-axis, this is equivalent to negative strain along b shown in figure 4(d). At a clamp loading corresponding to 1.5 GPa with this media, we observe clear evidence of non-hydrostatic pressure in the form of strain broadening and detwinning of the monoclinic phase. We also observe a complete change in the ground state crystal structure. As shown in figure 4(g), at a nominal pressure of 1.5 GPa we lose all evidence of any monoclinic phase below 90 K (measured down to 5 K). Upon warming the previously defined monoclinic reflection starts to show up at 100 K and the phase transition is completed by 230 K. This is in contrast to the observed coexistence from our He cell measurements from figure 3 and figure 4 (c). Here we have clear evidence that the ground state crystal structure can be controlled though careful design of the mechanical stress environment, but also that structural determination is critical for interpretation of other measurements. Other groups have also noted the empirical importance of uniaxial strain in this system for magnetotransport properties and for TS at ambient pressureYang et al. (2017). Our extracted single crystal lattice parameters and the change in a/b ratio under pressure loading in this clamp cell (shown in table S5) sup (b) are also consistent with a uniaxial stress geometry compared to the unloaded state .
The ability to stabilize the full volume fraction of the Td phase with non-hydrostatic pressure offers a simple route to a monophase non-centrosymmetric superconductor. Given our calculations of in the two crystal structures, and given the full volume fraction superconductivity in polycrystalline samples from ac-susceptibility Guguchia et al. (2017), we should expect that the enhancement in superconductivity is independent of the ground state crystal structure. One would expect no preferential phase selection in the polycrystalline system given the random orientation of grains with respect to possible non-hydrostatic pressure. Strain control of structure independent of superconductivity enhancement also explains the previous disagreements in pressure-temperature phase diagrams of TS defined by transportTakahashi et al. (2017); Qi et al. (2016). We can think of MoTe2 as offering a system where pressure tunes superconductivity through shifting the single layer electronic DOS and possibly decoupling the layers while in-plane stresses (strains) can select between the centrosymmetric and non-centrosymmetric phases. The huge stability window in both pressure and temperature of the mixed phase state offers a further unique opportunity for phase engineering in this system by tuning structural phase fractions.
I Conclusions
Our results illustrate the possibility to independently control inversion symmetry breaking through structural manipulation in MoTe2 as well as superconductivity in MoTe2 using temperature, hydrostatic pressure, and the symmetry of non-hydrostatic components of pressure (uniaxial-like stress). This decoupling of the superconductivity from the structural transition explains previous disagreements between transport and magnetic measurement generated T-P phase diagrams Qi et al. (2016); Guguchia et al. (2017); Takahashi et al. (2017). We have shown the coexistence of the Td and 1T’ phases at hydrostatic pressures and temperatures concurrent with full volume fraction superconductivity, which demonstrates that MoTe2 can support topological superconductivity in certain regions of the sample, or in full sample volumes under non-hydrostatic pressure loading. The nature of this topological superconductivity can take multiple forms, whether through a proximity effect in the mixed phase region or through a full non-centrosymmetric bulk superconductivity in a Weyl semimetal. We anticipate that these results will help elucidate future interesting and useful transport properties in this material, and may offer a route towards a superconducting system with strain tunable Weyl Fermi arcs and non-trivial band topology.
Acknowledgements
We acknowledge useful discussions with C. Brown. Certain trade names and company products are identified in order to specify adequately the experimental procedure. In no case does such identification imply recommendation or endorsement by the National Institute of Standards and Technology, nor does it imply that the products are necessarily the best for the purpose. This work utilized facilities supported in part by the National Science Foundation under Agreement No. DMR-0454672. This research used resources at the High Flux Isotope Reactor, a DOE Office of Science User Facility operated by the Oak Ridge National Laboratory. Research at the University of Maryland was supported by AFOSR through Grant No. FA9550-14-1-0332 and the Gordon and Betty Moore Foundation’s EPiQS Initiative through Grant No. GBMF4419.
Author contributions statement
C. Heikes and N. Butch synthesized materials. C. Heikes, W. Ratcliff II, Yan Wu, J. Leao, and Huibo Cao performed neutron scattering measurements. Bulk property measurements were performed by I-Lin Liu, Tristin Metz, Chris Eckberg, and N. Butch. L. Hung and T. Yildirim performed DFT calculations. All authors contributed to the manuscript.
Competing financial interests
The authors declare no competing financial interests.
Supplemental Materials: Mechanical control of crystal symmetry and superconductivity in Weyl semimetal MoTe2
Mechanical control of crystal symmetry and superconductivity in Weyl semimetal MoTe2
Supplemental Material
Colin Heikes,1 I-Lin Liu,1,2,4 Tristin Metz,2 Chris Eckberg,2 Paul Neves,2, Yan Wu,3 Linda Hung,1 Huibo Cao,3 Juscelino Leao,1, Johnpierre Paglione,2 Taner Yildirim,1 Nicholas Butch,1,2 and William Ratcliff II1
II Experimental Methods
Powder samples were prepared using the standard solid state synthesis method using high purity Mo powder (99.999% metals basis excluding W, Alpha Aesar), and Te shot(99.9999%, Alpha Aesar). Single crystals were grown using the Te self flux method as described in Rhodes et al. (2017a) using the same source metals as for the powder samples.
Powder neutron measurements were performed on the BT-1 diffractometers at NIST using the Cu(311) monochromator option at 60’ collimation and 1.540 . Powder patterns were fit using the Reitveld method in GSAS-II to obtain lattice constants, atomic positions, and thermal parameters Toby and Von Dreele (2013). NCNR single crystal measurements were performed on the BT-4 and SPINS triple axis spectrometers at NIST. Ambient pressure measurements on BT-4 were made with a 14.7 meV neutron beam with a collimation and filter setup of open-pg-40’-pg-sample-pg-40’-100’ while pressure dependent measurements were made also at 14.7 meV with open-pg-80’-pg-s-pg-80’-100’ collimation and filters where pg referes to pyrolytic graphite. The SPINS data were taken at 5 meV neutron energy with 80’-Be-s-80’-Be filter and collimator configuration, where Be refers to a liquid nitrogen cooled Be powder filter. Single crystal data was also taken with the HB-3A four-circle single crystal diffractometer at ORNL using a wavelength of 1.546 A from a bent perfect Si-220 monochromator Chakoumakos et al. (2011). Refined crystal structure data is shown in supplementary tables S2, S3, and S4.
Pressure dependent measurements on BT-4 were performed over a range from 0 to 1 GPa using a steel measurement cell and He as the pressure media as described in Shen et al. (2016). For these measurements, He is used to reduces possible pressure inhomogeneity compared to fluorocarbon-based techniques as has been demonstrated for CrAs or other pressure sensitive correlated electron systems Shen et al. (2016); Butch et al. (2009). The integrated peak intensities for phase fraction determination were obtained by fitting Gaussian peak profiles and a Lorentzian background to the raw scattering data to account for sample environment related background scattering. The HB-3A measurements investigated the crystal up to 1.5 Gpa pressure with a CuBe clamp pressure cell using Fluorinert 70:77=1:1 as the pressure transmission medium.
A non-magnetic piston-cylinder pressure cell was used for transport measurements under pressure up to 1.6 GPa, choosing a 1 : 1 ratio of n-Pentane to 1-methyl-3-butanol as the pressure medium and the superconducting temperature of lead as pressure gauge at base temperature. For transport measurements, we prepared a 110 thick sample of MoTe2 curing contacts with silver epoxy. Measurements were performed in magnetic fields up to 14 T and down to 1.8 K in Physical Property Measurement System (PPMS). For superconducting temperature below 1.8 K, resistivity measurements down to 25 mK in a dilution refrigerator were taken using a Lakeshore LS370 AC resistance bridge. The resistivity values were taken by the average of 60 stable and successive measurements.
III First-Principles Calculations
III.1 Method
The first-principles total energy, structure optimization under pressure and enthalpy calculations are performed by the Vienna ab initio simulation package VASPKresse and Hafner (1993); Kresse (1996), which is based on density-functional theory (DFT), using a plane wave basis set and the all-electron projected augmented wave (PAW) potentialsBlöchl (1994); Kresse (1999). The exchange-correlation interactions are described by the generalized gradient approximation (GGA) with PBE type functional. The weak inter-layer van der Waals (vdW) interactions are included by optB86b functionalKlimeš et al. (2011). The Brillouin-zone integration are performed using Monkhorst–Pack grids of special points with for total energy and structure optimizations and with optimized-tetrahedra method for electronic density of states calculations. The kinetic energy cut-off of 500 eV is used in all calculations. For particular cases, the spin-orbit (so) interactions are included in the calculations but the effect of SO-coupling is found to be minimal.
For the phonon dispersion curves and the electron-phonon coupling constants calculations, we used Quantum Espresso,Giannozzi et al. (2009) PAW pseudopotentials, the Perdew-Burke-Ernzerhof exchange-correlation functional,Perdew et al. (1996) -point sampling, and 0.02 Ry Methfessel-Paxton smearing with wavefunction and charge density cut-off energies of 100 Ry and 800 Ry, respectively. The electron-phonon coupling constant is calculated in a denser k-grid of and q-grid of . The vdw and SO interactions are also included. We used grimme-d2grimme vdW correction with parameter .
III.2 Energetics of and -phases
In this section, we compare the energetics of the centrosymmetric and non-centrosymmetric phases and try to explain the origin of the phase transition between these two phases within the pressure-temperature plane.
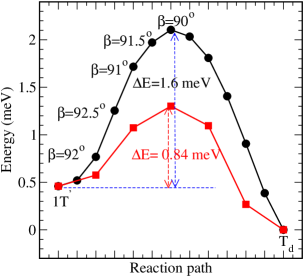
Even though the two phases and look quite different with and without inversion symmetry, we found that both phases are almost degenerate in energy. Both VASP and Quantum Espresso give ground state energies that are almost equal to within 0.5 meV for both phases. Figure S1 shows the energy difference between these two phases and the energy barrier between them as obtained from VASP. With no external pressure, we found that the non-centrosymmetric phase is about 0.35 meV lower in energy than the centrosymmetric phase. In order to get an idea about the energy barrier between these two phases, we carried out nudget elastic band NEB reaction path calculations based on simple initial positions that are a linear superposition of the two phases. The black curve in Figure S1 shows the energy barrier when the angle is reduced from the optimized value of to , which is about 1.6 meV. Once the angle is , the atomic positions in the phase go to the atomic position of the phase lowering the total energy without any energy barrier. The red curve is the result of the NEB calculations, indicating that the actual barrier between these two phases is even less than 1.6 meV and around 0.8 meV.
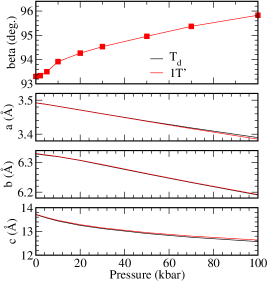
Since the ground state energies of these two phases are so close, it is interesting to see what stabilizes one phase over the other with applied pressure and temperature. We performed full structure optimization with pressure for both phases and the results are summarized in Figure S2. The cell angle is found to increase with applied pressure up to , which is consistent with our experimental observations. The phase always has a slightly lower volume than the phase, which suggests that at high pressure, due to enthalpy term , the phase may become the ground state.
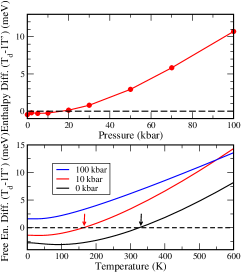
Figure S3 shows the enthalpy difference between two phases with applied pressure. The energy difference is still small up to pressures of 20 kbar. Only above 20 kbar does it increases rapidly, stabilizing the phase over above 20 kbar. Hence, it seems to be possible to stabilize the phase with applied pressure. One may wonder what is the mechanism for the phase transition at no external pressure? In order to shed some light on this, we have calculated the full phonon spectrum at a given pressure, from which we estimate the free energy of the system as a function of temperature. The bottom panel in Figure S3 shows the difference in free energy between these two phases. Similar to the enthalpy term, the free energy difference also prefers the phase at high temperature and high pressures. At zero pressure, we see a sign change (i.e. phase transition) near 340 K which is reduced significantly down to 160 K with 1 GPa pressure and then the free energy difference is always positive for pressures larger than 10 GPa (i.e.the phase is the ground state at pressures above 10 GPA at all temperatures). This trend seems to be in perfect agreement with what we see experimentally.
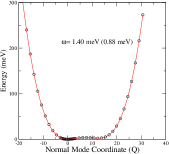
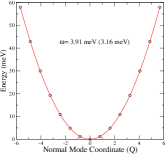
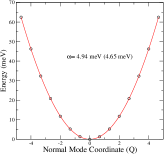
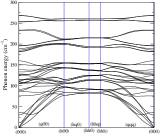
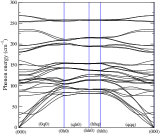
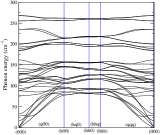
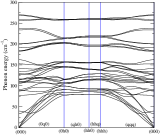
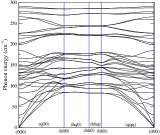
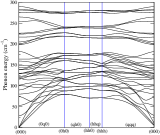
As an alternative mechanism for the phase transition from to phase, we also investigate the possibility of a soft phonon mode, such as interplane sliding phonons of MoTe2 planes as this type of phonon would have a very low energy and it is also related to the cell angle , which defines how the layers stack. Figure S4 shows the three lowest energy optical modes in phase. Interestingly, the mode involves the inter-plane phonon oscillation along the b-axis (i.e. direction related to cell angle ), is very anharmonic, and has two slight dips in the potential. We repeated these frozen phonon energies with applied pressure and did not see any negative modes with applied pressure. The full phonon dispersion curves with pressures up to 100 kbar are also calculated for both phases (shown in Figures S5) and no sign of negative modes is observed. With applied pressure the lowest energy optical modes shift up in energy and becomes more harmonic with applied pressure. Hence, it is very tempting to conclude that the observed phase transition from to phase with temperature is entropy driven, which is rather interesting. We are currently carrying out more detailed and accurate calculations to include the effects such as temperature dependence of the phonon energies to see if we can explain the phase transition along with the observed negative thermal expansion for the c-axis. Based on our results, it seems that the inter-planer coupling of the layers is quite crucial not only to explain the negative thermal expansion but also the stabilize the non-centrosymmetric ground state phase as we did not see a non-centrosymmetric phase for an isolated single layer MoTe2.
III.3 Ground State Selection by Strain
In previous section, we showed that by applying hydrostatic pressure, we can change the energetics between and phases and make the centrosymmetric phase ground state above kbar pressure. Here we discuss the effect of anisotropic pressure by applying strain along one of the a- and b-axes. We define the strain as ; Hence the negative strain corresponds to compression while positive strain corresponds to elongation of the axis. While we apply strains along one of the a- and b-axis, we let the other lattice parameters/angles and the internal atomic positions fully relaxed. In this way, the change in the b-axis and c-axis in response to a-axis strain can be calculated and from the ratio we obtain the Poisson ratios. The total energy difference between the and phases is shown in Figure S6 as a function of strain along a-axis (black) and b-axis (red).
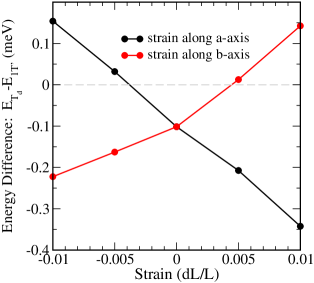
The net effect of strain along a- or b-axis seems to be the opposite for a given compression or elongation, providing us a mechanism to switch the ground state. When we apply compression along the b-axis, the cell-angle decreases whereas if the b-axis is elongated, then the angle is also increased. It seems that the larger the -angle, the more stable the -phase. Hence when we apply pressure along the a-axis (which effectively increases the b-axis and in turn increases the angle) we stabilize the centro-symmetric -phase. On the other hand, when we compress the system along b-axis, the non-centrosymmetric phase is stabilized. Hence by controlling the strain direction, one can tune the topology of the ground state.
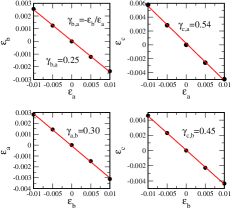
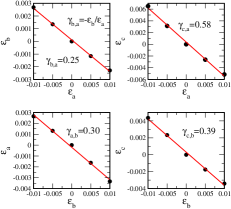
From our constrained cell optimization under strain, we obtain the response of the b- and c-axis to the strain along a-axis as shown in Figure S7-refstain3. Compression along the a-axis causes elongation along the other two axes, yielding positive Poisson ratios for MoTe2. Figures S7-S8 show that the in-plane Poisson ratios for the and -phases are the same. This is expected as the response of a-axis to a change in b-axis and vice versa is mainly controlled by the in-plane interactions within a single MoTe2 plane. The effect of vdW interactions between the planes seems to have a very small effect on the in-plane Poisson ratios. The and phases have slightly different Poisson ratios for the c-axis response to the strain along a- and b-axes. Since the main difference between these two phases are the stacking of the planes which is controlled by vdW interactions, this small difference in Poisson ratio is also expected.
III.4 Electron-phonon Coupling in the and phases
III.4.1 A single layer MoTe2
In order to get a better understanding of the origin of superconductivity in MoTe2, we first study an individual MoTe2 layer. We consider both the centrosymmetric -phase and the non-centrosymmetric -phase. The single layer of MoTe2 is obtained by deleting the 2nd layer in the unit cell of - and -phases and taking the c-axis as , which gives enough vacuum between the layers. Table S1 shows the initial symmetry of the layer obtained from -phase. After structural optimizations, we surprisingly discovered that both single layers converge to the same structure with a symmetry that recovers the inversion symmetry (see TableS1). We repeat the structural optimization with positive and negative charge doping as well as with different strains in plane but the optimization always yield a centrosymmetric configuration. Hence, we conclude that the origin of the non-centrosymmetric phase of the -structure is due to weak inter-layer interactions; Once the inter-planes are separated, there is no reason for the system to keep the non-centrosymmetric phase and the systems recover inversion symmetry. This is rather an unexpected and important findings as lack of inversion symmetry is a requirement for the Weyl state and for topological superconductivity.
| Initial Structure from | P1m1 (#6): | |
|---|---|---|
| a=6.3818 Å, b=3.5042 Å | (x,y,z) | (x,-y,z) |
| Mo1 1a 0.5968 | 0 | 0.5004 |
| Mo2 1b -0.0403 | 0.5 | 0.5150 |
| Te1 1a 0.8536 | 0 | 0.6565 |
| Te2 1b 0.7001 | 0.5 | 0.3589 |
| Te3 1a 0.2053 | 0. | 0.4040 |
| Te4 1b 0.3514 | 0.5 | 0.6112 |
| Optimized Structure | P 1 21/m 1 (#11): | |
| a=6.3818 Å, | (x,y,z) | (-x,y+1/2,-z) |
| b=3.5042 Å | (-x,-y,-z) | (x,-y+1/2,z) |
| Mo1 2e 0.31925 | 0.25 | 0.49401 |
| Te1 2e 0.57863 | 0.25 | 0.62955 |
| Te2 2e -0.07014 | 0.25 | 0.40736 |
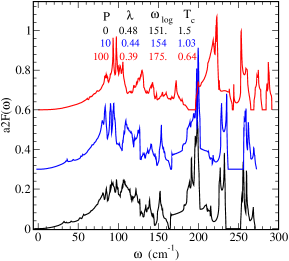
Next, we study phonons and the electron-phonon (el-ph) coupling in single layer MoTe2 for zero and 100 kbar (i.e. 10 GPa) external pressure (within ab-plane). The phonon spectrum and the electron-phonon couplings are summarized in Figure S9. At zero external pressure, we obtained el-ph coupling and , which yields a of 0.83 K for . With applied pressure of 100 kbar (i.e. 10 GPa), the increases almost twice while reduces to 112 K while the Tc increases to 6 K, which is similar to what we observe experimentally. As we shall discuss later, we do not see this trend for the case of bulk MoTe2 in either of and phases. From the projected Eliashberg function , we determined that both and contribution equally to . Similarly, phonon projections along , , and gives similar contributions to , indicating that electron-phonon coupling in MoTe2 is rather isotropic, getting contribution from all phonons based on and phonons along all three directions in space. This is a very different situation than in MgB2 where the main contribution to el-ph coupling comes from limited in-plane B-based phonons. In MoTe2 layer, all phonons at all energies contribute equally to the el-ph coupling.
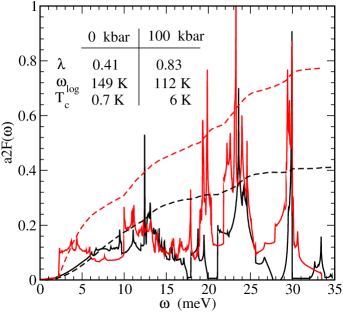
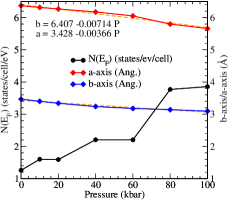
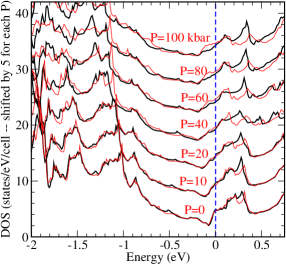
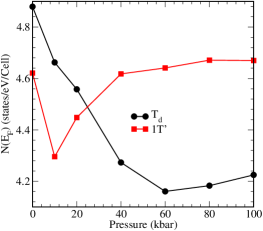
In order to get better insight to the sharp increase in with applied pressure, we look at the electronic density of states with pressure which is shown in Figure S10. Some of the states above Fermi level decreases in energy with applied pressure and eventually intersect the Fermi level near kbar, causing the increase in the density of states near Fermi level. This is clearly shown in Figure S11. Since the logarithmic phonon energy is actually decrease with the increasing pressure, the increase in N(EF) with pressure seems to be the only mechanism to explain the observed increase in with applied pressure.
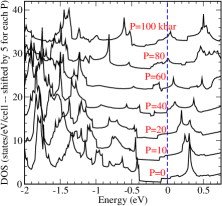
Figure S11 also shows the lattice parameters and axis with in-plane applied pressure. Due to single layer nature of MoTe2, the buckling of the atoms out of the plane is easier in the case of single layer and therefore the compressibilty of a- and b-axes are larger than the case of bulk. However as we shall discuss below, if we take the lattice constants of the 2D layer at 100 kbar and repeat the el-ph coupling calculations for the case of bulk, we do not see increase in , which raises quite interesting questions about the origin of Tc enhancement with pressure observed experimentally.
III.4.2 Bulk MoTe2: and phases
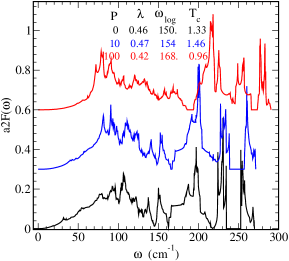
We now discuss the electron phonon coupling in bulk MoTe2 with both phases at zero and applied pressure. Our results are summarized in Figure S12. Both phases show a very similar Eliashberg function at a given pressure with similar and logarithmic average phonon energies. As in the case of single layer MoTe2, projected shows that the contribution to the total comes from all phonons at all energies and polarizations. The zero pressure for the bulk phase is quite similar to the isolated single layer MoTe2, indicating that the main mechanism of superconductivity is involved within the single MoTe2 plane and the interlayer coupling has no apparent effect. The main difference between the bulk and the single layer MoTe2 is the pressure dependence of the electron phonon coupling. For the case of single layer, we found almost an order of magnitude increase in Tc from 0 kbar to 100 kbar pressure range. However that is not the case for the bulk MoTe2 in either phases. We did not see significant changes in either or . Hence based on our calculations, a conventional phonon-based electron phonon coupling can not explain the observed enhancement of Tc with pressure. One potential explanation could be that the applied pressure may decouple the MoTe2 layers and then the decoupled layers are responsible for the enhanced Tc with pressure, observed experimentally. Proximity effects may also play a strong role.
In order to have a better understanding of the effect of pressure on the superconductivity, we study the density of states as a function of pressure for both phases. In the case of single layer, we observed that the density of states at the Fermi level, is the main factor that increases with pressure and in turn, yields higher el-ph coupling constants at high pressures. As shown in Figure S13, we do not see a similar pressure dependence in the bulk case. The actually decreases slightly with applied pressure for the case of phase, which makes sense as the lattice parameters decrease, the orbital overlap increases, giving rise to wider band dispersion lowering . The behavior is slightly different for the phase where the density of states first decreases and then increases and stay constant with pressure. We attribute this behavior to an increase of the cell angle which increases by with applied pressure. In any case, we do not see any significant increase in the density of states with pressure as we found in the case of single layer MoTe2. The main effect of pressure is a slight increase of the logarithmic average phonon energies but the increase is not large enough to explain the large increase in Tc with only 10 GPa pressure as experimentally observed.
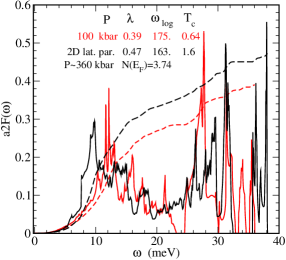
One may wonder if we use the lattice parameters of the 2D MoTe2 at 100 bar for the case of bulk MoTe2, can we get enhanced and therefore a higher Tc with applied pressure. For the case of single layer MoTe2, the buckling of the atoms is easier and therefore a- and b-axes change almost twice as fast as in the bulk case. Indeed if we use the lattice parameters of the 2D structure at 100 kbar, we obtained pressures about 360 kbar for the bulk case. Figure S14 summarizes the results for the Eliashberg function and other parameters. Interestingly despite using the same lattice constants as single layer MoTe2, we do not get either higher or larger . The results are rather similar to the case of 100 kbar, which was also shown in the same figure for comparison. Hence, we can not explain the observed high Tc with pressure by taking compressed lattice parameters, even that of 360 kbar. We clearly need more study to fully understand the origin of the pressure dependence of the superconductivity observed in MoTe2 but based on our results it seems that maybe pressure acts to decouple layers of MoTe2 which is responsible for the observed behavior. More study, in particular, more experiments to test these ideas would be quite interesting.
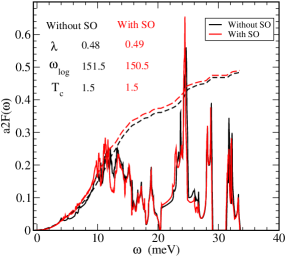
Finally, we study the effect of spin-orbit interactions on the phonon spectrum and the electron-phonon coupling for the -phase. Due to lack of inversion in the -phase, we thought that SO interaction may be important but as shown in Figure S15, the effect of SO both on the phonon spectrum and the el-ph coupling is rather small. We also checked the effect of SO-interaction in the -phase at particular q-points and similar to -phase, we did not see significant change with SO interaction turned on. Hence, it seems to be safe to ignore the SO-interactions in structure and lattice dynamics of MoTe2 in either phases.
IV Structure Determination
IV.1 Structure Notation
The standard (hkl) notation used to describe reciprocal lattice planes in space group 11 (1T’ phase) and 31 (Td phase) uses different conventions for the labeling of the crystallographic a,b, and c unit cell directions. Here we will use the monoclinic convention where c is the long axis along the van de Waals bonding direction with a lattice constant of order 13.8 , a is the axis opposite the monoclinic distortion with lattice constant of order 6.3 , and b is the remaining axis with lattice constant of order 3.5 . The orthorhombic phase is effectively the same as the monoclinic angle but with a angle of 900, which effectively transposes the h and k labels from the standard orthorhombic notation in space group Pmn21 (this can be alternatively described as using the non-standard Pnm21 space group in Hermann-Mauguin notation).
As our metric for structure we focused on the reflections from the (201) like lattice planes. In the monoclinic phase the (201) and the (20) reflections split in reciprocal space, while there is just once centrally located (201) reflection in the orthorhombic phase.
We mounted single crystals from the same synthesis batch as our transport measurements in the (h0L)M zone and monitored the (00L)M reflections, the (201)M reflections, and the (20)M reflections. In this way, we could monitor changes in the c-axis as well as the merging of the (201)M and (20)M reflections into a single (201)M reflection as the crystal transitioned from the 1T’ to Td phase. Due to monoclinic twinning, we can best monitor the phase fraction of the two phases by tracking the integrated intensity of the (201)M reflection at the reciprocal space position for the orthorhombic phase. Details of the neutron scattering measurements can be found in the methods section.
IV.2 Structural refinements
Powder neutron measurements were performed on the BT-1 diffractometers at NIST using the Cu(311) monochromator option at 60’ collimation and 1.540 . Powder patterns were fit using the Reitveld method in GSAS-II to obtain lattice constants, atomic positions, and thermal parameters. The crystalographic parameters for powder data taken at 300 K and 3 K are shown in table S2 while atomic positions for the two refined structures are shown in tables S3 and S4. We see a small fraction of metallic Te as an impurity phase, which is included in the refinement as a secondary phase. Due to the anisotropic cleaving of MoTe2, we see expected prefered orientation in the powder which is treated as a 4th order spherical harmonic.
Single crystal data was also taken with the HB-3A 4-circle single crystal diffractometer at ORNL using using a 34.22 meV neutron beam. Lattice parameters at a range of pressures and temperatures were calculated using the 4-circle data reduction package within MANTID from the ORNL data. These parameters are shown in table S5. Strain broadening in the high pressure state and a large sample environment background from our pressure cell prevented us from refining atomic positions beyond our powder refinements, though lattice parameters are consistent with an altered a/b ratio for the 1.5 GPa state.
| Neutron Powder Diffraction Extracted Crystallographic | ||
|---|---|---|
| Parameters and Refinement Statistics | ||
| Temperature | 300 K | 3 K |
| Space Group | P21/m, (No. 11) | Pmn21, (No. 31) |
| a () | 6.3281(3) | 3.46464(13) |
| b () | 3.47703(17) | 6.30716(23) |
| c () | 13.8182(11) | 13.8431(6) |
| 90∘ | 90∘ | |
| 93.882(5)∘ | 90∘ | |
| 90∘ | 90∘ | |
| Cell Volume | 303.346(20) | 302.500(13) |
| 1.01 | 1.25 | |
| wR (%) | 7.00 | 7.68 |
| 300 K P21/m Phase Atomic positions | |||||
| Atom | X | Y | Z | Uiso | Wyckoff Position |
| Mo1 | 0.1828(7) | 0.25 | 0.0083(4) | 0.0052(10) | 2e |
| Mo2 | 0.3194(8) | -0.25 | 0.5062(4) | 0.0087(10) | 2e |
| Te1 | 0.5880(10) | 0.25 | 0.1064(5) | 0.0097(13) | 2e |
| Te2 | 0.0966(9) | -0.25 | 0.1493(5) | 0.0102(14) | 2e |
| Te3 | 0.5571(10) | -0.25 | 0.3513(5) | 0.0108(14) | 2e |
| Te4 | 0.0563(10) | 0.25 | 0.3953(4) | 0.0110(13) | 2e |
| 3 K Pmn21 Phase Atomic positions | ||||
| Atom | X | Y | Z | Wyckoff Position |
| Mo1 | 0.0 | 0.6061(7) | 0.497244 | 2a |
| Mo2 | 0.0 | 0.0293(8) | 0.014242 | 2a |
| Te1 | 0.0 | 0.8659(10) | 0.653546 | 2a |
| Te2 | 0.0 | 0.6411(9) | 0.112020 | 2a |
| Te3 | 0.0 | 0.2877(11) | 0.857259 | 2a |
| Te4 | 0.0 | 0.2147(10) | 0.401510 | 2a |
| Single Crystal Lattice Parameters | |||
|---|---|---|---|
|
5 K
Ambient Pressure |
5 K
1.5 GPa |
240 K
1.5 GPa |
|
| a () | 6.31 0.027 | 6.27 0.013 | 6.30 0.027 |
| b () | 3.47 0.023 | 3.44 0.013 | 3.476 0.025 |
| c () | 13.93 0.044 | 13.71 0.019 | 13.63 0.034 |
| 90∘ | 90∘ | 90∘ | |
| 90∘ | 90∘ | 94.76 0.29∘ | |
| 90∘ | 90∘ | 90∘ | |
References
- Sato and Ando (2017) M. Sato and Y. Ando, Reports on Progress in Physics 80, 076501 (2017).
- Qi et al. (2016) Y. Qi, P. G. Naumov, M. N. Ali, C. R. Rajamathi, W. Schnelle, O. Barkalov, M. Hanfland, S.-C. Wu, C. Shekhar, Y. Sun, et al., Nature communications 7 (2016).
- Luo et al. (2016) X. Luo, F. Chen, J. Zhang, Q. Pei, G. Lin, W. Lu, Y. Han, C. Xi, W. Song, and Y. Sun, Applied Physics Letters 109, 102601 (2016).
- Guguchia et al. (2017) Z. Guguchia, F. Rohr, Z. Shermadini, A. Lee, S. Banerjee, A. Wieteska, C. Marianetti, B. Frandsen, H. Luetkens, Z. Gong, et al., Nature Communications 8, 1082 (2017).
- Huang et al. (2016) L. Huang, T. M. McCormick, M. Ochi, Z. Zhao, M.-T. Suzuki, R. Arita, Y. Wu, D. Mou, H. Cao, J. Yan, et al., Nature materials 15, 1155 (2016).
- Deng et al. (2016) K. Deng, G. Wan, P. Deng, K. Zhang, S. Ding, E. Wang, M. Yan, H. Huang, H. Zhang, Z. Xu, et al., Nature Physics 12, 1105 (2016).
- Deng et al. (2017) P. Deng, Z. Xu, K. Deng, K. Zhang, Y. Wu, H. Zhang, S. Zhou, and X. Chen, Physical Review B 95, 245110 (2017).
- Rhodes et al. (2017a) D. Rhodes, R. Schönemann, N. Aryal, Q. Zhou, Q. Zhang, E. Kampert, Y.-C. Chiu, Y. Lai, Y. Shimura, G. McCandless, et al., Physical Review B 96, 165134 (2017a).
- Clarke et al. (1978) R. Clarke, E. Marseglia, and H. P. Hughes, Philosophical Magazine B 38, 121 (1978), https://doi.org/10.1080/13642817808245670 .
- Brown (1966) B. E. Brown, Acta Crystallographica 20, 268 (1966).
- Takahashi et al. (2017) H. Takahashi, T. Akiba, K. Imura, T. Shiino, K. Deguchi, N. Sato, H. Sakai, M. Bahramy, and S. Ishiwata, Physical Review B 95, 100501 (2017).
- Cho et al. (2017) S. Cho, S. H. Kang, H. S. Yu, H. W. Kim, W. Ko, S. W. Hwang, W. H. Han, D.-H. Choe, Y. H. Jung, K. J. Chang, et al., (2017).
- Rhodes et al. (2017b) D. Rhodes, D. Chenet, B. Janicek, C. Nyby, Y. Lin, W. Jin, D. Edelberg, E. Mannebach, N. Finney, A. Antony, et al., Nano Letters 17, 1616 (2017b).
- Chen et al. (2016a) F. Chen, X. Luo, R. Xiao, W. Lu, B. Zhang, H. Yang, J. Li, Q. Pei, D. Shao, R. Zhang, et al., Applied Physics Letters 108, 162601 (2016a).
- Belopolski et al. (2016) I. Belopolski, D. S. Sanchez, Y. Ishida, X. Pan, P. Yu, S.-Y. Xu, G. Chang, T.-R. Chang, H. Zheng, N. Alidoust, et al., Nature communications 7, 13643 (2016).
- Lv et al. (2017) Y.-Y. Lv, L. Cao, X. Li, B.-B. Zhang, K. Wang, B. Pang, L. Ma, D. Lin, S.-H. Yao, J. Zhou, et al., Scientific reports 7, 44587 (2017).
- Oliver et al. (2017) S. M. Oliver, R. Beams, S. Krylyuk, I. Kalish, A. K. Singh, A. Bruma, F. Tavazza, J. Joshi, I. R. Stone, S. J. Stranick, et al., 2D Materials 4, 045008 (2017).
- Kim et al. (2016) T. Kim, D. Puggioni, Y. Yuan, L. Xie, H. Zhou, N. Campbell, P. Ryan, Y. Choi, J.-W. Kim, J. Patzner, et al., Nature 533, 68 (2016).
- Benedek and Fennie (2013) N. A. Benedek and C. J. Fennie, The Journal of Physical Chemistry C 117, 13339 (2013).
- Duerloo et al. (2014) K.-A. N. Duerloo, Y. Li, and E. J. Reed, Nature communications 5, 4214 (2014).
- sup (a) (a), see Supplemental Material at [URL will be inserted by publisher] for experimental methods.
- Zandt et al. (2007) T. Zandt, H. Dwelk, C. Janowitz, and R. Manzke, Journal of alloys and compounds 442, 216 (2007).
- Hughes and Friend (1978) H. Hughes and R. Friend, Journal of Physics C: Solid State Physics 11, L103 (1978).
- Lu et al. (2016) P. Lu, J.-S. Kim, J. Yang, H. Gao, J. Wu, D. Shao, B. Li, D. Zhou, J. Sun, D. Akinwande, et al., Physical Review B 94, 224512 (2016).
- Zhou et al. (2016) Y. Zhou, X. Chen, N. Li, R. Zhang, X. Wang, C. An, Y. Zhou, X. Pan, F. Song, B. Wang, et al., AIP Advances 6, 075008 (2016).
- sup (b) (b), see Supplemental Material at [URL will be inserted by publisher] for details of crystallographic refinements.
- Chen et al. (2016b) S.-Y. Chen, T. Goldstein, D. Venkataraman, A. Ramasubramaniam, and J. Yan, Nano letters 16, 5852 (2016b).
- sup (c) (c), see Supplemental Material at [URL will be inserted by publisher] for details of first principles calculations.
- Kim et al. (2017) H.-J. Kim, S.-H. Kang, I. Hamada, and Y.-W. Son, Physical Review B 95, 180101 (2017).
- Dawson and Bullett (1987) W. Dawson and D. Bullett, Journal of Physics C: Solid State Physics 20, 6159 (1987).
- Yan et al. (2017) X.-J. Yan, Y.-Y. Lv, L. Li, X. Li, S.-H. Yao, Y.-B. Chen, X.-P. Liu, H. Lu, M.-H. Lu, and Y.-F. Chen, npj Quantum Materials 2, 31 (2017).
- Manolikas et al. (1979) C. Manolikas, J. Van Landuyt, and S. Amelinckx, physica status solidi (a) 53, 327 (1979).
- Sato and Fujimoto (2009) M. Sato and S. Fujimoto, Physical Review B 79, 094504 (2009).
- Tanaka et al. (2009) Y. Tanaka, T. Yokoyama, A. V. Balatsky, and N. Nagaosa, Physical Review B 79, 060505 (2009).
- Chakoumakos et al. (2011) B. C. Chakoumakos, H. Cao, F. Ye, A. D. Stoica, M. Popovici, M. Sundaram, W. Zhou, J. S. Hicks, G. W. Lynn, and R. A. Riedel, Journal of Applied Crystallography 44, 655 (2011).
- Aso et al. (2006) N. Aso, Y. Uwatoko, T. Fujiwara, G. Motoyama, S. Ban, Y. Homma, Y. Shiokawa, K. Hirota, and N. Sato, in AIP conference proceedings, Vol. 850 (AIP, 2006) pp. 705–706.
- Sidorov and Sadykov (2005) V. Sidorov and R. Sadykov, Journal of Physics: Condensed Matter 17, S3005 (2005).
- Yang et al. (2017) J. Yang, J. Colen, J. Liu, M. C. Nguyen, G.-w. Chern, and D. Louca, Science advances 3, eaao4949 (2017).
- Toby and Von Dreele (2013) B. H. Toby and R. B. Von Dreele, Journal of Applied Crystallography 46, 544 (2013).
- Shen et al. (2016) Y. Shen, Q. Wang, Y. Hao, B. Pan, Y. Feng, Q. Huang, L. W. Harriger, J. B. Leao, Y. Zhao, R. M. Chisnell, J. W. Lynn, H. Cao, J. Hu, and J. Zhao, Phys. Rev. B 93, 060503 (2016).
- Butch et al. (2009) N. P. Butch, J. R. Jeffries, D. A. Zocco, and M. B. Maple, High Pressure Research 29, 335 (2009).
- Kresse and Hafner (1993) G. Kresse and J. Hafner, Physical Review B 47, 558 (1993).
- Kresse (1996) G. Kresse, Phys. Rev. B 54, 11169 (1996).
- Blöchl (1994) P. Blöchl, Phys. Rev. B 50, 17953 (1994).
- Kresse (1999) G. Kresse, Phys. Rev. B 59, 1758 (1999).
- Klimeš et al. (2011) J. Klimeš, D. R. Bowler, and A. Michaelides, Physical Review B 83, 195131 (2011).
- Giannozzi et al. (2009) P. Giannozzi, S. Baroni, N. Bonini, M. Calandra, R. Car, C. Cavazzoni, D. Ceresoli, G. L. Chiarotti, M. Cococcioni, I. Dabo, et al., Journal of physics: Condensed matter 21, 395502 (2009).
- Perdew et al. (1996) J. P. Perdew, K. Burke, and M. Ernzerhof, Physical review letters 77, 3865 (1996).