A curious case of the accretion-powered X-ray pulsar GX 1+4
Abstract
We present detailed spectral and timing studies using a NuSTAR observation of GX 1+4 in October 2015 during an intermediate intensity state. The measured spin period of 176.778 s is found to be one of the highest values since its discovery. In contrast to a broad sinusoidal-like pulse profile, a peculiar sharp peak is observed in profiles below 25 keV. The profiles at higher energies are found to be significantly phase-shifted compared to the soft X-ray profiles. Broadband energy spectra of GX 1+4, obtained from NuSTAR and Swift observations, are described with various continuum models. Among these, a two component model consisting of a bremsstrahlung and a blackbody component is found to best-fit the phase-averaged and phase-resolved spectra. Physical models are also used to investigate the emission mechanism in the pulsar, which allows us to estimate the magnetic field strength to be in (5–10)1012 G range. Phase-resolved spectroscopy of NuSTAR observation shows a strong blackbody emission component in a narrow pulse phase range. This component is interpreted as the origin of the peculiar peak in the pulse profiles below 25 keV. The size of emitting region is calculated to be 400 m. The bremsstrahlung component is found to dominate in hard X-rays and explains the nature of simple profiles at high energies.
keywords:
stars: neutron – pulsars: individual: GX 1+4 – X-rays: stars.1 Introduction
Accretion powered X-ray pulsars constitute a large fraction of the brightest X-ray binaries in our Galaxy. These objects are highly magnetized rotating neutron stars that are powered by mass accretion from their optical companion. Depending on the characteristics of the donor star, mass transfer from the optical companion to the neutron star takes place through different mechanisms such as (i) Roche-lobe overflow (in low mass X-ray binaries), (ii) capture of stellar wind (in high mass X-ray binaries), and (iii) Be-disk accretion (in Be/X-ray binaries, a sub-class of high mass X-ray binaries; Paul & Naik 2011). Irrespective of the accretion mechanisms, the magnetic field of the neutron star has a strong influence on the emission processes that leads towards a characteristic shape of X-ray continuum spectrum and beam geometry. Most of the high energy emission from the accretion-powered X-ray pulsars originates from the Comptonization of seed photons in the accretion column, formed on the surface of the neutron stars (Becker & Wolff, 2007).
GX 1+4 is an interesting accretion powered X-ray pulsar discovered in 1970 by a balloon-borne experiment at a spin period of about 2 minutes (Lewin et al., 1971). It belongs to a rare type of symbiotic stars, the emerging class of X-ray binaries, consisting of bright objects that accrete matter from late type (K-M spectral class) giant companions (Iben & Tutukov, 1996). Generally a white dwarf is expected to be the accreting object in this type of systems, though a handful of systems with neutron stars as compact objects have been discovered in the last four decades, e.g. GX 1+4, 4U 1945+31, 4U 1700+24, Sct X-1 and IGR J16194-2810 (Corbet et al. 2008 and references therein). The optical counterpart of GX 1+4 is the bright infrared star V2116 Oph of M6 III spectral type, confirming the system to be a symbiotic binary (Glass & Feast 1973; Davidsen et al. 1977; Chakrabarty & Roche 1997). Assuming the neutron star mass as 1.35 M⊙, the mass of the optical companion has been estimated to be 1.2 M⊙ through the infrared radial velocity measurement method (Hinkle et al., 2006). The neutron star in this system is thought to accrete from dense stellar wind as the giant companion underfills its Roche-lobe (Makishima et al. 1988; Hinkle et al. 2006). The distance of the binary was estimated in the range of 3-15 kpc (Chakrabarty & Roche, 1997), and Hinkle et al. (2006) suggested it to be 4.3 kpc.
Since its discovery, the pulsar has exhibited an unusual pulse period history. It was first found to be spinning up during 1970s with the fastest period change rate (=-7.510-8 s s-1; Makishima et al. 1988) known among X-ray pulsars. Later, for an extended period in early 1980s, the pulsar became undetectable. When it reappeared, a torque reversal was observed and the source started showing spin-down behavior on similar magnitude as observed during the spinning-up era (Makishima et al., 1988). Based on the standard accretion torque theory, the torque-reversal event made it possible to predict the magnetic field of the neutron star to be 1014 G (Ghosh & Lamb 1979; Makishima et al. 1988; Dotani et al. 1989). Alternative models such as accretion from retrograde disk are also suggested to resolve the unusual high value of magnetic field and the rapid spin-down of the pulsar (Makishima et al., 1988). Using BATSE observations, an anti-correlation between torque and luminosity was detected and was explained by considering retrograde disk scenario (Chakrabarty & Roche, 1997). This retrograde disk concept also denied the need for a high magnetic field in GX 1+4. A tentative detection of a cyclotron absorption line at 34 keV has been reported from BeppoSAX and INTEGRAL observations, suggesting the magnetic field of the pulsar to be in the order of 1012 G (Naik et al. 2005; Rea et al. 2005; Ferrigno et al. 2007). Though the retrograde disk hypothesis was supported by many authors (Dotani et al. 1989; Chakrabarty & Roche 1997), recent long term spin-period evolution on top of sudden spin-up episodes can not be explained either by standard disk accretion model or retrograde disk theory, but rather through the quasi-spherical disk accretion on to the neutron star (González-Galán et al., 2012).
Using the pulse period variation during the spinning-up phase of pulsar, Cutler et al. (1986) proposed a periodicity of 304 d as the orbital period of the system. Detailed studies based on the infrared, optical and X-ray observations later established the orbital period to be 1161 d (Hinkle et al. 2006; Iłkiewicz et al. 2017). GX 1+4 is a peculiar source in many aspects. The pulse profiles of the pulsar show a characteristic sharp dip at medium and low intensity states which was interpreted as due to the eclipse of the emitting region by the accretion column (Giles et al. 2000; Galloway et al. 2000, 2001). The relationship between spin period history and the source luminosity is much more complicated than predicted by the standard accretion disk theory (Ghosh & Lamb 1979; Chakrabarty & Roche 1997; González-Galán et al. 2012). It occasionally shows a low flux state during which pulsations from the neutron star \textcolorblueare not observed (Cui 1997; Cui & Smith 2004). The absence of pulsation was interpreted as due to the onset of “propeller effect” and was detected for the first time in an accretion-powered X-ray pulsar (Cui, 1997).
The X-ray spectrum of GX 1+4 has been described by a cutoff power law model during intermediate and high intensity states (10-10–10-9 erg cm-2 s-1 in 2-10 keV range; Cui & Smith 2004; Ferrigno et al. 2007) or with a physical continuum model consisting of Comptonization of soft photons in hot plasma (Galloway et al. 2000, 2001; Naik et al. 2005). Along with intrinsic absorption, strong iron emission lines at 6.5–7 keV with equivalent widths of 0.2–0.5 keV were detected in spectra obtained from RXTE and BeppoSAX observations. The pulsar also exhibits rare and irregular low intensity states (10-11 erg cm-2 s-1 in 2-10 keV range) for durations varying from several days to month. During these low intensity states, the spectra were found to be highly variable (Galloway et al. 2000; Rea et al. 2005; Naik et al. 2005). The origin of the peculiar low intensity state is still ambiguous and is suggested to be associated with different mechanisms such as (i) propeller effect, (ii) accretion column eclipses, and (iii) obstruction through a thick accretion disk (Cui & Smith 2004; Galloway et al. 2000; Rea et al. 2005).
In the present work, comprehensive spectral and timing studies of GX 1+4 have been carried out by using data from major broadband X-ray observatories such as NuSTAR, Swift, RXTE and Suzaku. The motivation of this study is to understand the energy and luminosity evolutions of the emission geometry of the pulsar by exploring pulse profiles at various intensity levels. A thorough investigation of the source spectrum is also carried out by using empirical and physical models. We have employed physical continuum models based on the thermal and bulk Comptonization processes in the accretion column (Becker & Wolff 2007; Ferrigno et al. 2009; Farinelli et al. 2012) to understand the column physics. In this paper, Section 2 describes the details of the observations and the procedures followed for analysing data from sevaral observatories. Our results and discussions are presented in following sections.
2 Observations and Analysis
GX 1+4 has been observed on several occasions at various intensity levels with X-ray observatories such as Nuclear Spectroscopic Telescope Array (NuSTAR), Swift, Suzaku and Rossi X-ray Timing Explorer (RXTE). We have used high quality NuSTAR and Suzaku data to explore the spectral characteristics and accretion column physics at distinct luminosity levels. Along with this, we have also analyzed a total of 143 pointing observations of the pulsar with the RXTE for an effective exposure of 551.53 ks performed during 1996 February to 2003 January to understand the evolution of beam function and spectral shape of the pulsar. A log of pointed observations used in this paper is given in Table 1 along with corresponding effective exposures. A detail description of observations and data analysis methods are presented in following section.
| RXTE | No. of | Time Range | Expo. |
|---|---|---|---|
| Proposal ID | Obs. IDs | (MJD) | (ks) |
| 10133 | 4 | 50125.58–50126.53 | 50.08 |
| 10104 | 23 | 50130.12–50481.60 | 135.26 |
| 10103 | 5 | 50284.15–50284.85 | 60.56 |
| 10144 | 1 | 50464.13–50464.25 | 10.28 |
| 20170 | 20 | 50504.09–50588.29 | 19.33 |
| 60060 | 40 | 51974.70–52320.67 | 120.9 |
| 70064 | 40 | 52338.80–52593.68 | 124.61 |
| 70065 | 8 | 52390.87–52585.32 | 28.95 |
| 70425 | 2 | 52662.73–52670.41 | 1.56 |
| Observatory/ | ObsID | Start Date | Expo. |
| Instrument | (MJD) | (ks) | |
| Suzaku | 405077010 | 55471.28 | 99.8 |
| NuSTAR | 30101040002 | 57309.02 | 49.3 |
| Swift/XRT | 00081653001 | 57309.39 | 1.7 |
2.1 NuSTAR and Swift Observations
NuSTAR is the first hard X-ray focusing observatory covering 3–79 keV energy range (Harrison et al., 2013). It was launched on 2012 June 13 in a low inclination Earth orbit with motivation to understand the enigma of X-ray cosmos. It carries two identical grazing angle focusing telescopes that reflect high energy photons below 79 keV to their respective focal plane modules, FPMA and FPMB. Each module comprises four 3232 Cadmium-Zinc-Telluride (CZT) detectors arranged in a plane. The total dimension of CZT detector is 20 mm20 mm with thickness of 2 mm. The focal length of each telescope is 10.15 m. The energy resolution of NuSTAR is 0.4 keV at 10 keV and 0.9 keV at 68 keV (FWHM), respectively.
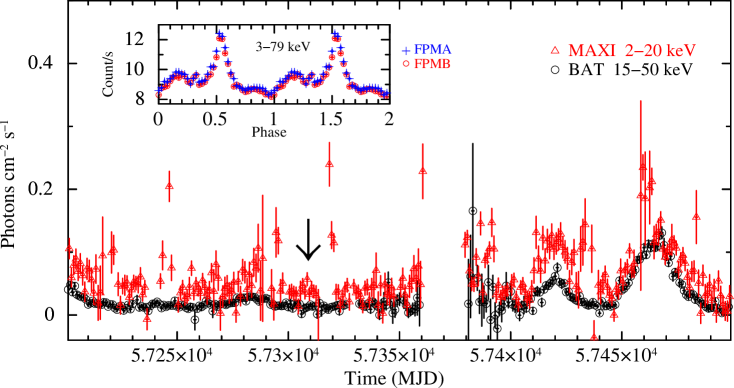
GX 1+4 was observed with NuSTAR on 2015 October 14 (MJD 57309.02) in a faint state. Long term monitoring light curves from MAXI and Swift/BAT are shown in Fig. 1. The arrow mark in the figure indicates the date of NuSTAR observation of the pulsar for an effective exposure of 49.3 ks (Obs ID: 30101040002). The pulsar was also observed with the Swift/XRT (Burrows et al. 2005) on the same day with a net exposure of 1.7 ks. We followed standard procedures to analyze the NuSTAR data by using NUSTARDAS software v1.4.1 of HEASoft version 6.16. We first reprocessed unfiltered events with the help of nupipeline task for both the detector units in the presence of recent calibration data base (CALDB) files. Further, science quality events, produced after the reprocessing, were utilized for extracting the barycentric corrected light curves, spectra, response matrices and effective area files by using nuproducts command. The source products were accumulated from a circular region of 120 arcsec around the central object for both the detectors. Moreover, background light curves and spectra were estimated in similar manner by considering a circular region of 120 arcsec away from the source.
Swift/XRT was operated in photon counting mode during the observation of GX 1+4. We have used data from this observation for spectral coverage in 1-10 keV energy range. The unfiltered events were reprocessed by using XRTPIPELINE. We noticed that the light curve obtained from cleaned data consisted of high count rate (0.6) durations, indicating possible photon piled-up in XRT observation. We estimated the pile-up affected region across the source centre, as suggested by the instrument team111http://www.swift.ac.uk/analysis/xrt/pileup.php. Accordingly, an annulus region with inner and outer radii of 10 and 60 arcsec was considered to extract source spectra from the cleaned XRT events using XSELECT package. Background spectra were accumulated from a source free region in a similar manner. Response matrix and effective area files were also accumulated by following the standard procedure.
2.2 RXTE Observations
To investigate the properties of pulsar across a wide range of luminosity, we used publicly available RXTE observations carried out during 1996 February to 2003 January in our study (see Table 1). Though most of these observations have been already used to understand the properties of GX 1+4 (Cui 1997; Galloway et al. 2000, 2001; Cui & Smith 2004; Serim et al. 2017), we are motivated to examine long term spectral evolution of the pulsar to characterize its emission geometry. The RXTE was a space-based observatory, launched in 1995 December by NASA. It worked for more than 16 years and extensively explored the X-ray sky. It had a broad-band energy coverage of 3–250 keV with two sets of onboard detectors such as (i) Proportional Counter array (PCA; Jahoda et al. 1996) and (ii) High Energy Timing Experiment (HEXTE; Rothschild et al. 1998). The PCA consisted of five Proportional Counter Units (PCUs) sensitive in 2–60 keV range with a total collecting area of 6500 cm2. The HEXTE consisted of two clusters of detectors e.g., Cluster A and Cluster B, rocking orthogonally to each other for simultaneous measurement of source and background. Each cluster of HEXTE was a package of four NaI(Tl)/CsI(Na) phoswich scintillators, effective in the energy range of 15–250 keV. The total collective area of HEXTE was 1600 cm2.
We followed standard procedures of data analysis as described in RXTE cook book222https://heasarc.gsfc.nasa.gov/docs/xte/recipes/cook_book.html. Source and background products were extracted by creating good time intervals by applying filter selections on all available PCUs. The source light curves were extracted in 2–60 keV range from Standard-1 data at 0.125 s time resolution by using saextrct task of FTOOLS. Corresponding background light curves and spectra were also generated from Standard-2 data by using background models provided by the instrument teams. For spectral studies, the source spectra were accumulated from Standard-2 data by using saextrct task. The response matrices were generated by using pcarsp task.
2.3 Suzaku Observation
A Suzaku observation was also used in our study to understand the broad-band spectral properties of GX 1+4. Suzaku, the fifth Japanese X-ray satellite, was launched by Japanese Aerospace Exploration Agency in 2005 July (Mitsuda et al., 2007). It carried two sets of major instruments such as X-ray Imaging Spectrometers (XISs; Koyama et al. 2007) and Hard X-ray Detectors (HXDs; Takahashi et al. 2007), providing a coverage of 0.2–600 keV energy range. Four CCD instruments were the part of the XIS instruments, effectively operating in 0.2-12 keV range. The HXD unit of Suzaku consisted of two detectors such as HXD/PIN and HXD/GSO. The HXD/PIN consisted of silicon diode detectors, sensitive in 10–70 keV energy range, whereas HXD/GSO consisted of crystal scintillator detector working in the 40–600 keV energy range.
GX 1+4 was observed with Suzaku on 2010 October 2 for a total exposure of 195 ks (see Table 1). Following the procedures described in Suzaku ABC Guide333https://heasarc.gsfc.nasa.gov/docs/suzaku/analysis/abc/, source and background spectra from XIS-0, XIS-1, XIS-3, PIN and GSO instruments were accumulated and analysed to understand the broadband spectral characteristics of the pulsar.


3 Timing analysis
Following the procedures described in Section 2.1, source and background light curves were extracted from NuSTAR data in various energy bands at a time resolution of 0.1 s. Barycentric correction was applied on background subtracted light curves to incorporate the motion of earth and satellite to the barycenter of the solar system. We applied the -maximization technique (Leahy 1987) on the 3–79 keV barycentric corrected light curve to estimate the spin period of the pulsar. Using this technique, X-ray pulsations at 176.778(6) s were detected in the pulsar light curve. We also confirm the estimated spin period by using another software package e.g. HENDRICS - High ENergy Data Reduction Interface from the Command Shell (Bachetti 2015). This package performs a pulsation search by following different approaches such as epoch-folding and the Z statistics (Buccheri et al., 1983) on clean events. Using both methods, a best fitted period at 176.778 s was detected in the NuSTAR data of the pulsar. Based on the agreement on the estimated values of periodicity through independent methods, the spin period of GX 1+4 was considered to be 176.778(6) s. This is one of the highest value of spin period of the pulsar since its discovery, indicating a continuous spin-down trend after torque reversal in early 1980s.
Pulse profiles were generated by folding the 3–79 keV light curves from the FPMA and FPMB detectors of NuSTAR at the measured pulsation period and are shown in the inset in Fig. 1. A plateau like feature in the pulse profile at 0.4 phase, followed by a peculiar sharp peak in 0.5–0.6 phase range is seen (Fig. 1). Such type of unusual features have not been detected in the pulse profiles of GX 1+4 obtained from RXTE, BeppoSAX, INTEGRAL and Suzaku observations (Cui & Smith 2004; Naik et al. 2005; Ferrigno et al. 2007; Yoshida et al. 2017). The effect of spin period derivative (= 10-7 s s-1; González-Galán et al. 2012) was considered while checking the shape of pulse profile of the pulsar from NuSTAR observation. Indifferent shape of the profile confirmed the presence of a peculiar emission geometry during the NuSTAR observation.
3.1 Luminosity dependence of pulse profiles from RXTE observations
To thoroughly investigate the long term pulse profile evolution of the pulsar and compare the same from the NuSTAR observation, a detailed timing studies were performed using all available RXTE observations of GX 1+4 during the period of 1996 to 2003. These pointed observations were carried out at various flux levels of the pulsar, providing a unique opportunity to probe the energy and luminosity evolutions of the beam geometry and column physics. For this, the 2–60 keV light curves, generated from Standard-1 data, were used to obtain the pulse profiles from each of the observations. This was done by folding the light curves at their respective estimated spin periods in between 123.5 to 139 s. The epochs were manually adjusted to align the profiles such that the primary dip (minimum) was always at phase 0. Representing the pulse profiles in such a way can make it suitable to investigate the evolution of emission geometry during various pointings. Some of the representative pulse profiles obtained from the RXTE observations are shown in Fig. 2 in increasing order of source flux. The date of corresponding observations (MJD) are also quoted in the pulse profiles. The shape of pulse profiles appeared to be broad. Apart from the broad shape, the profiles did not show any long term luminosity dependence or any systematic change. However, the evolution of beam geometry or pulse profile can be easily traced among successive RXTE observations. A sharp peak like profile as seen during NuSTAR observation (not exactly the same) was also noticed in the figure at MJD 50284.85 and 52008.53 (i.e. second and seventh panels of Fig. 2). Moreover, the detailed energy evolution of these profiles was found to be simple and consistent with a broad sinusoidal like profile at higher energies.
3.2 Energy dependence of pulse profiles from NuSTAR observation
Evolution of pulse profiles with energy was investigated out by folding the background subtracted energy resolved light curves obtained from the NuSTAR observation, with the estimated spin period of the pulsar. These pulse profiles are shown in Fig. 3. The profiles were found to be strongly energy dependent in contrast to the profiles seen during the RXTE era. A broad peak in 0.3–0.7 phase range of 3–7 keV profile evolved to a very narrow peak with increasing energy up to 25 keV which then completely disappeared from the profiles at higher energies. Pulse profiles at 30 keV are found to be singly peaked and 180 degree phase shifted with respect to the 3–7 keV pulse profile. From the evolution of the pulse profiles with energy, it is apparent that two different components are contributing to the pulsar emission during the NuSTAR observation. One of the component, dominating below 25 keV, is thought to be originated from a narrow phase range (0.4–0.6) of the pulsar whereas the other component contributed significantly in the hard X-ray range. Based on our study, it is clear that the pulse profile of the pulsar during the NuSTAR observation is unique and seen for the first time in the history of GX 1+4. To probe the origin of the observed peculiar structures and its distinct emission components, phase-averaged and phase-resolved spectroscopy are performed and described in the next section.
| Parameters | Spectral Models | ||||||
|---|---|---|---|---|---|---|---|
| HECut+BB | Cutoff+BB | CompTT+Br | CompTT+BB | NPEX+BB | Br+BB | COMPMAG2 | |
| NHa | 2.550.32 | 2.480.22 | 3.620.6 | 0.910.23 | 2.180.24 | 2.660.15 | 1.20.1 |
| Photon index | 1.320.04 | 1.20.04 | – | – | 1.090.08 | – | |
| Ecut (keV) | 7.20.8 | 33.62.4 | – | – | 25.734.5 | – | – |
| Efold (keV) | 37.73.1 | – | – | – | – | – | – |
| BB temp. (keV) | 2.010.15 | 2.040.07 | – | 2.80.1 | 1.940.09 | 2.160.05 | – |
| Bremss temp. (keV) | – | – | 1.70.5 | – | – | 42.911.31 | – |
| CompTT T0 (keV) | – | – | 1.50.1 | 0.950.05 | – | – | – |
| CompTT | – | – | 2.50.1 | 3.30.2 | – | – | – |
| CompTT kT (keV) | – | – | 14.30.8 | 12.20.6 | – | – | – |
| COMPMAG kTbb (keV) | – | – | – | – | – | – | 1.370.02 |
| COMPMAG kTe (keV) | – | – | – | – | – | – | 0.81 |
| COMPMAG | – | – | – | – | – | – | 0.310.01 |
| Column radius (m) | – | – | – | – | – | – | 28351 |
| Emission lines | |||||||
| Line energy (keV) | 6.360.02 | 6.360.02 | 6.360.01 | 6.360.01 | 6.360.01 | 6.360.02 | 6.360.01 |
| Eq. width (eV) | 99.89.2 | 102.39.1 | 93.26.9 | 115.210.4 | 102.27.5 | 105.68.9 | 94.89.8 |
| Line energy (keV) | 6.940.16 | 6.970.08 | 6.990.1 | 6.960.06 | 6.960.07 | 6.990.07 | 6.960.08 |
| Eq. width (eV) | 17.410.1 | 22.17.2 | 16.76.2 | 29.36.8 | 227 | 23.96.1 | 19.38.4 |
| Component Fluxb | |||||||
| Power-law flux | 5.950.6 | 5.80.5 | – | – | 5.820.5 | – | – |
| Blackbody flux | 0.330.05 | 0.490.05 | – | 0.670.07 | 0.440.03 | 0.440.05 | – |
| CompTT flux | – | – | 6.00.4 | 5.40.3 | – | – | – |
| Bremsstrahlung flux | – | – | 0.37 | – | – | 5.90.1 | – |
| Source fluxb | |||||||
| Flux (3-10 keV) | 1.960.07 | 2.050.17 | 2.080.36 | 1.840.11 | 1.940.04 | 1.980.05 | 1.860.1 |
| Flux (10-70 keV) | 4.350.22 | 4.350.42 | 4.350.31 | 4.310.26 | 4.360.4 | 4.370.08 | 4.340.15 |
| Reduced (d.o.f) | 0.97 (795) | 0.98 (795) | 0.99 (795) | 1.07 (794) | 0.97 (794) | 0.99 (796) | 1.02 (794) |
4 Spectral analysis
4.1 Phase-averaged spectroscopy with NuSTAR and Swift/XRT
A detailed investigation on the presence of different emission components in GX 1+4 was carried out by using NuSTAR and Swift/XRT observations in a faint state in 2015 October. For broad-band spectral analysis, source and background spectra were accumulated by following the procedures described in earlier section. With appropriate background, response matrices and effective area files, the 1-79 keV energy spectra of GX 1+4 were fitted with several continuum models in XSPEC package (ver. 12.8.2). In our simultaneous spectral fitting, all the model parameters were tied together for spectra obtained from FPMA, FPMB and XRT detectors whereas the relative instrument normalizations were kept free.
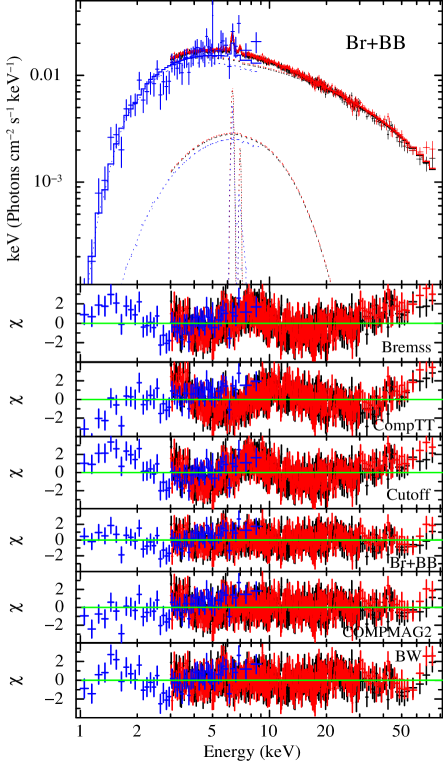
Standard continuum models for accretion powered X-ray pulsars such as high energy cutoff power law (HECut), Negative and Positive Exponential Cutoff (NPEX), Fermi-Dirac cutoff power law, cutoff power law and Comptonization (CompTT) models along with photoelectric absorption component were applied to fit the energy spectrum of GX 1+4. However, none of the above models was suitable to fit the 1-79 keV spectrum obtained from NuSTAR and Swift/XRT observations. Presence of a broad excess in 4–20 keV energy range (third and fourth panels of Fig. 4) caused the simultaneous spectral fitting with above models unacceptable. Usually, the accretion powered X-ray pulsars show an excess in soft X-rays, known as soft excess in their spectra (Hickox et al., 2004). The soft excess feature is interpreted as due to the reprocessing of hard X-ray photons in the surrounding regions of the neutron star and described by a thermal emission component. Based on similar analogy, we attempted to express the broad excess observed in GX 1+4 with a blackbody or bremsstrahlung component. Addition of a blackbody component to the above continuum models provided an acceptable fit by bringing down the reduced value from 1.5 to 1 in each case. The blackbody temperature obtained from the fitting was found to be in the range of 2–3 keV (see Table LABEL:table2). Such high temperature thermal component is difficult to understand in the soft excess scenario. Therefore, we presumed that the excess seen during the NuSTAR and Swift/XRT observations could be associated with the continuum from the accretion column and can be explained by a composite or physical model. A similar type of continuum i.e. cutoff power law with blackbody (Cutoff+BB) was used earlier to explain the pulsar spectra during high and intermediate states with Suzaku, RXTE and BeppoSAX (Yoshida et al., 2017).
Instead of the blackbody component, a bremsstrahlung component was also tried with above ad-hoc models for understanding the nature of excess during NuSTAR observation. We found that the CompTT model with bremsstrahlung component (CompTT+Br) can fit the continuum as well. Apart from the interesting spectral shape, two iron emission lines at 6.4 and 6.9 keV are also detected in the spectrum of GX 1+4 during 2015 October observation. We did not find any signature of cyclotron absorption feature in the 1-79 keV range. This is in contrast to the previous tentative detections of a cyclotron line at 34 keV from BeppoSAX and INTEGRAL observations (Naik et al. 2005; Rea et al. 2005; Ferrigno et al. 2007). Moreover the source flux during the NuSTAR observation was found to be lower compared to these earlier observations. With NuSTAR, the 3-10 keV unabsorbed flux was estimated to be 210-10 erg cm-2 s-1, indicating an intermediate intensity state of the pulsar during the observation.
While exploring the suitable spectral model for GX 1+4, we noticed that a two-component thermal model i.e. bremsstrahlung and blackbody components (Br+BB) along with interstellar absorption and two Gaussian functions for iron emission lines at 6.4 and 6.9 keV also fitted the spectra well. The equivalent widths of the 6.4 and 6.9 keV lines were estimated to be 106 eV and 24 eV, respectively. The bremsstrahlung component in this model was found to describe the pulsar continuum, producing a broad-excess in 4-20 keV range which was explained by a thermal blackbody component (second and fifth panels of Fig. 4). The Br+BB model was found statistically comparable to other models used to describe GX 1+4 spectrum from NuSTAR and Swift/XRT observations. Spectral parameters obtained from all the models are presented in Table LABEL:table2. The equivalent hydrogen column density is found to be variable in the range of 1–41022 cm-2 depending on the continuum model. This is higher than the estimated value of Galactic absorption in the direction of the source (31021 cm-2). Therefore, the presence of an additional absorber close to the neutron star is expected. However, pulse phase dependency of column density can not be explored in the present study due to limiting coverage in soft X-ray ranges 3 keV. The energy spectra of GX 1+4 for the best fitting Br+BB model is presented in the first panel of Fig. 4. Second, third and fourth panels of the figure show the residuals obtained after fitting the spectra with bremsstrahlung, CompTT and cutoff power law models, respectively. The fifth panel indicates the residuals obtained after adding a blackbody component with the bremsstrahlung model.
4.2 Phase-averaged spectroscopy with physical models
To understand the properties of accretion column, we attempted to fit the pulsar spectra obtained from NuSTAR and Swift/XRT observations with COMPMAG (Farinelli et al., 2012) and Becker and Wolff (BW; Becker & Wolff 2007) models. These continuum models are derived by considering slightly different assumptions on the accretion geometry, emission processes, velocity profile and also use different methods to solve the radiative transfer equation of photons through the accretion column.
The COMPMAG model can successfully produce the spectral shape of faint accreting X-ray pulsars and supergiant X-ray transients. This model computes the bulk and thermal Comptonization of blackbody seed photons during cylindrical accretion on to the poles of the magnetized neutron star, assuming two different velocity profiles characterized by and terminal velocity near the surface (Farinelli et al., 2012). We have used this model in our study with reasonable parameter values consistent to low luminosity pulsars i.e. free fall velocity profile =0.5, terminal velocity =0.5 and the albedo of neutron star surface (A) to be 1 (Farinelli et al., 2012). The pulsar spectra when fitted with the COMPMAG model using general velocity profile (hereafter COMPMAG1) produced a broad excess in the residuals similar to that obtained while fitting the data with the empirical models. Addition of a blackbody component at 1.8 keV temperature yielded an acceptable fit. We have also fitted the spectrum of GX 1+4 by using a specific velocity profile of COMPMAG (hereafter COMPMAG2) that is linearly dependent on the optical depth (). The spectra fitted with the latter velocity profile resolved the peculiar broad excess and described continuum well with a reduced close to 1. The residual obtained from COMPMAG2 is shown in the sixth panel of Fig. 4. Corresponding parameters obtained from data fitting are presented in Table LABEL:table2. Based on these results, we expect that the broad feature (with ad-hoc and COMPMAG1 models) is intrinsically associated with the emission from accretion column or region located close to the neutron star. Moreover, the effect of bulk Comptonization of blackbody seed photons was found to dominate the continuum as the low value of electron plasma temperature was detected at high .
The BW model was also used to explore the spectrum of GX 1+4. This is a physics based complex model that considers the effects of thermal and bulk Comptonization of seed photons, originated from bremsstrahlung, blackbody, and cyclotron emissions with accreting plasma in the column (Becker & Wolff, 2007). It is best suitable for explaining the spectra of bright pulsars such as 4U 0115+63 (Ferrigno et al., 2009) and EXO 2030+375 (Epili et al., 2017) in the presence of a radiation dominating shock in the accretion column. For a canonical neutron star, BW model consists of six free parameters i.e. the ratio between bulk and thermal Comptonization , a dimension-less parameter related to photon escape time , magnetic field , mass accretion rate , electron plasma temperature , and accretion column radius .
We found that the pulsar spectrum in 1-79 keV range can be represented by the BW model. This model was able to resolve the puzzling 4-20 keV broad excess as seen while fitting the data with the traditional and COMPMAG1 models (see Fig. 4). This also explains the presence of excess emission over the continuum from the accretion column or regions close to the pulsar. For spectral fitting with the BW model, the mass accretion rate was calculated by using the values of source flux estimated from empirical models and the distance of the source as 4.3 kpc (Hinkle et al., 2006). It is important to mention that the source distance is not well constrained because of the uncertainties in estimating the binary parameters. The uncertainties in source distance, therefore, affects the estimation of column radius which is strongly dependent on mass accretion rate (Becker & Wolff, 2007). We have employed the BW model by considering a source distance of 4.3 and 10 kpc to compare the effect of mass accretion on other spectral parameters. We found that the parameters obtained at both the distances are nearly equal (within errors) except the column radius and normalization constant of the BW model. While fitting, the mass accretion rate was kept frozen at respective value of distances. As the column radius strongly depends on the accretion rate, we also fixed the value of after best fitting of the model to get a better constraint on other parameters, as suggested by Ferrigno et al. (2009). The column radius was found to be 5 and 10.5 m at source distances of 4.3 and 10 kpc, respectively. This model also provides opportunity to constrain the magnetic field of the pulsar along with other physical parameters. In our study, the value of magnetic field for GX 1+4 was found to be 5.61012 G using NuSTAR and XRT data. We noticed that the value of magnetic field obtained from this model is insensitive to upper bound of the parameter. Therefore, only a lower value of field strength is reported in Table LABEL:table3. Residual obtained from the spectral fitting with the BW model is shown in the seventh panel of Fig. 4.
| Parameters | NuSTAR | Suzaku |
|---|---|---|
| NHa | 0.780.1 | 13.930.07 |
| 1.420.02 | 4.9 | |
| 12.860.87 | 0.550.25 | |
| Electron temp. Te (keV) | 4.30.1 | 11.7 |
| Column radius (m) | 10.52 | 48.22 |
| Magnetic field B (1012 G) | 4.6 | 8.2 |
| Accretion rateb (1017 g/s) | 0.4 | 2.87 |
| Source flux (3-70 keV)c | 6.180.24 | 38.1510.43 |
| Reduced (d.o.f) | 1.02 (799) | 1.06 (841) |
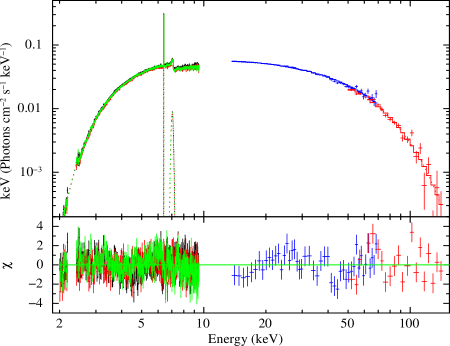
In order to constrain the magnetic field and understand the physics of accretion column at different intensity levels of GX 1+4, we used data from a Suzaku observation of the pulsar in our analysis. This observation was carried out in 2010 October at an intermediate intensity level (3–10 keV flux 710-10 erg cm-2 s-1; also see Yoshida et al. 2017). The phase-averaged spectra obtained from XIS-0, XIS-1, XIS-3, PIN and GSO detectors of Suzaku observation were fitted with the BW model in 2-150 keV energy range. As the pulsar was relatively bright, a systematic error of 1% was added to the data from XISs to incorporate the cross calibration among front and back illuminated CCDs, as suggested in Epili et al. (2016) and references therein. Considering a source distance of 4.3 and 10 kpc, the parameters obtained from the fitting the data with the BW model were found to be consistent (within errors) with the earlier values, though the column radii were estimated to be 20.2 and 48.2 m, respectively. These values were relatively small compared to the column radii obtained from COMPMAG2 model. The estimated strength of magnetic field from the Suzaku observation was in the range of (7–10)1012 G. This value was found to be marginally higher compared to that computed from the NuSTAR and Swift observations. All the spectral parameters obtained from fitting Suzaku data with the BW model are presented in Table LABEL:table3. We have described the implication of these results in the discussion section.

4.3 Intensity dependent spectral studies of GX 1+4 with RXTE
It has been found that the phase-averaged spectrum of GX 1+4 can be described with several continuum models such as CompTT, Cutoff+BB, HECut models (Galloway et al. 2001; Naik et al. 2005; Ferrigno et al. 2007; Yoshida et al. 2017; Serim et al. 2017). To investigate the spectral evolution of the pulsar with luminosity and understand the cause of the peculiar features observed during the NuSTAR and Swift/XRT observations (present work), all the RXTE observations of the pulsar during 1996 February to 2003 January have been analysed. In the beginning, we attempted to fit the 3–30 keV RXTE/PCA spectra with several models, as described in Section 4.1. While fitting, a systematic error of 0.5% was also added to the spectra. We found that a HECut or CompTT model fits well to the pulsar continuum across a wide range of source intensity. In a few cases, a partial absorption component was also required to fit the data well. While fitting the data during intermediate and high flux states, the pulsar continuum was found relatively complicated. Yoshida et al. (2017) used Cutoff+BB continuum model to describe pulsar spectrum at such intensity level. Based on the results obtained from present comparative analysis, we suggest that HECut or CompTT can describe the pulsar continuum better than cutoff power law model. Serim et al. (2017) also reported similar results by using the RXTE observations of GX 1+4 during 2001–2003. Variation of spectral parameters obtained from fitting data with the HECut and CompTT models with the absorption corrected flux in 3–30 keV range are shown in top and bottom panels of Fig. 6, respectively.
For HECut model, parameters such as power-law photon index, cutoff energy, folding energy and galactic absorption column density are shown in the top panels of the figure. The power-law photon index was found to remain comparable (within errors) for a wide flux range of 4–40 10-10 erg cm-2 s-1 although moderate variations are seen for a few observations. The cutoff energy did not show any significant variability over the wide flux range. However, the folding energy showed a positive correlation with source flux. Though the absorption column density, obtained from HECut and CompTT models, did not show any systematic pattern, its values were high during medium and high intensity states of the pulsar. Spectral parameters from CompTT model such as optical depth and input soft photon temperature (T0) were found to be relatively constant with the source flux. As in case of folding energy (HECut model), a positive correlation was also seen between plasma temperature and source flux.
To compare the results obtained from NuSTAR and Swift observations with the RXTE observations of the pulsar, we attempted to fit the RXTE spectra with Br+BB model. However, we found that this model did not fit the data from any of the RXTE observations. Shape of the pulse profile obtained from 2015 October NuSTAR observation was also unique and entirely different from the profiles obtained from all the available RXTE observations of the pulsar. This indicates that the 2015 October NuSTAR observation of GX 1+4 was peculiar and different from all other observations.
4.4 Phase-resolved spectroscopy during a peculiar state with NuSTAR
Based on the results obtained from a detailed spectral and timing studies of GX 1+4 by using the RXTE and Suzaku observations, it is clear that the properties of the pulsar such as emission mechanism, shape of pulse profiles observed during the NuSTAR observation are unique and had never been seen before. Phase-averaged spectroscopy of NuSTAR and Swift observations showed that several continuum models fitted the broad-band data very well with comparable values of reduced chi-sqaure (see Table LABEL:table2). To investigate the cause of peculiar features observed during the NuSTAR observation and the nature of continuum models, we attempted to carry out phase-resolved spectroscopy of the NuSTAR observation. For this, we extracted phase-resolved spectra for 25 phase bins by using XSELECT package. With appropriate background, response and effective area files, phase-resolved spectroscopy was performed in 3–70 keV energy range. We fitted the phase-sliced spectra with several continuum models such as (i) Cutoff+BB, (ii) CompTT+BB and (iii) CompTT+Br along with photoelectric absorption component and a Gaussian function for 6.4 keV iron emission line. We was found that these three continuum models described phase-resolved spectra from NuSTAR observation well, yielding a reduced close to 1 in each case. As the values of equivalent hydrogen column density and iron line width did not show any variation over pulse phase, these parameters were kept fixed at values obtained from phase-averaged spectroscopy (Table LABEL:table2). In addition to these, we did not see any significant absorption like feature in the phase-sliced spectra.

Phase-resolved spectroscopy of NuSTAR observation, though yielded acceptable fits for all phase bins with above three continuum models, most of the spectral parameters did not show any significant variation (within errors) over pulse phases except the flux of thermal and non-thermal components. The flux of thermal components (blackbody and bremsstrahlung components) showed enhanced values in 0.5–0.6 phase ranges where a sharp peak was seen in the pulse profile below 25 keV (see Fig. 3). However, the flux of non-thermal component showed a shallow peak in 0.0–0.3 pulse phase range. The shape of total flux profile did not match with that of the pulse profile of the pulsar which is possibly because of the significant flux differences in the soft and hard X-ray bands. As the flux of thermal (blackbody or bremsstrahlung) component is low by a factor of 10-20 as compared to the flux of non-thermal components (power law or CompTT; see Table LABEL:table2), the hard X-ray flux dominated the soft X-ray flux leading to different shape of profile of total flux to that of the pulse profile. Apart from the shape of thermal, non-thermal and total flux profiles over pulse phase, the value of temperature of thermal component was also relatively high in 0.5–0.6 phase bin. Therefore, it is now confirmed that the narrow peak in the pulse profile below 25 keV was due to a thermal component which dominated emission in soft X-rays. Other than this, phase-resolved spectroscopy of NuSTAR observation of the pulsar with (i) Cutoff+BB, (ii) CompTT+BB and (iii) CompTT+Br continuum models did not provide any other information in understanding the properties of the source during this peculiar observation.
Following this, we fitted the phase-resolved spectra obtained from the NuSTAR observation of the pulsar with Br+BB continuum model. In contrast to the results obtained from the phase-resolved spectroscopy with other three models (described earlier in this section), the Br+BB continuum model produced a better constraint on the spectral parameters. The parameters obtained from fitting all 25 phase-resolved spectra with this model are shown in Fig. 7 along with the pulse profile of the pulsar in the top panel. From the figure, it can be seen that the blackbody temperature and its flux were changing significantly with pulse phase and peaking in the same phase range (0.5–0.6 phase) at which the sharp peak was detected in profiles below 25 keV. The temperature and flux of the bremsstrahlung component were also found to be strongly variable across pulse phases and followed the shape of hard X-ray pulse profiles at energies 30 keV (Fig. 3). The unabsorbed flux in different energy bands such as 3–10 keV, 10–25 keV, 25–70 keV and 3–70 keV ranges, estimated from phase-resolved spectroscopy, are shown in sixth, seventh, eighth and ninth panels of the figure, respectively. The fluxes in these bands were found to be consistent with the pulse profiles in same energy ranges. Based on comparative studies of spectral models, we found that the Br+BB continuum model successfully described the phase-averaged and phase-resolved spectra of GX 1+4 better than all other models. This also provides an important clue on the peculiar evolution of pulse profiles and its corresponding spectral components during the NuSTAR observation in a faint state of the pulsar.
5 Discussion
5.1 The origin of the peculiar pulse profile at low intensity level of GX 1+4
Understanding the pulse profiles of accretion-powered X-ray pulsars illustrates the characteristics of the emission geometry and its beam pattern originating from the accretion column. Generally, these profiles are expected to be smooth and single peaked. However, most of the transient Be/X-ray binary pulsars such as EXO 2030+375 and GX 304-1 (Naik et al. 2013; Epili et al. 2017; Jaisawal, Naik & Epili 2016) show profiles with complicated structures including multiple dips or notches at various pulse phases. These features are found to be strongly energy dependent and seen up to high energies in EXO 2030+375 (Naik et al., 2013). Using phase-resolved spectroscopy, a high value of column density was estimated at these phases of pulse profiles. This suggested that the dips in the pulse profiles of Be/X-ray binary pulsars are due to absorption of X-ray photons by dense streams of matter that are phase-locked with the neutron star.
In the case of GX 1+4, the pulse profile is observed to be broad and singly peaked, as seen during the RXTE observations in 1996 to 2003 across a wide range of intensity (Fig. 2 of present work). Energy and luminosity dependence of the pulse profiles have also been reported earlier (Cui & Smith 2004; Naik et al. 2005; Yoshida et al. 2017). In addition to the broad shape, a characteristic sharp dip is also detected in the profiles at low and intermediate intensity levels. This feature was first detected in the data obtained from the Ginga observation of the pulsar (Dotani et al., 1989). The origin of this dip was thought to be related to the effect of cyclotron resonant scattering of photons near the neutron star surface. However, results from the RXTE and Suzaku observations suggest that this feature is associated with the obscuration or eclipse of emission region by the accretion column (Giles et al. 2000; Galloway et al. 2000, 2001; Yoshida et al. 2017). In the present work, we have explored long term evolution of pulse profiles of the pulsar to understand the properties of the emission geometry at various luminosities. For the first time, unusual energy dependent peaks are detected in the pulse profiles of GX 1+4 during the NuSTAR observation. The observed profile is found to be strongly energy dependent. It shows a remarkable energy evolution by changing the broad shaped profile into a strong narrow peak below 25 keV. This peculiar peak disappears from the profile at higher energies. Moreover, another component also gradually emerges in the profiles at 15 keV. This leads to the origin of broad profiles at hard X-rays.
From the energy evolution, it can be considered that two emission components are contributing to the shape of pulse profiles during the NuSTAR observation. Corresponding spectral studies also confirm the presence of two components, blackbody and bremsstrahlung, in the broad-band energy spectrum of GX 1+4 (see discussion below). With the help of phase-resolved spectroscopy, we find that the emission from blackbody component is peaking in a narrow pulse phase range. Therefore, it is possible that a hot emitting region is present in this phase causing the peculiar sharp peak in the profile. The broad-band continuum, expressed as a bremsstrahlung continuum or resulting from bulk Comptonization, is found to dominate in hard X-rays, producing a simple profile at higher energies.
5.2 Spectroscopy
The broadband energy spectrum of GX 1+4 has been described with standard models such as high energy cutoff power law, exponential cutoff power law and Comptonization of soft photons in a hot plasma, despite the complex processes occurring in the accretion column near the poles of the neutron star (Galloway et al. 2000, 2001; Cui & Smith 2004; Naik et al. 2005; Ferrigno et al. 2007; Serim et al. 2017). An additional blackbody component was also needed to describe the spectrum of the pulsar during high and intermediate intensity states (Yoshida et al. 2017). It is believed that the observed hard X-ray photons from accretion powered X-ray pulsars are due to the Comptonization of seed photons (blackbody, bremsstrahlung and cyclotron radiations) by the energetic electrons in the accretion column (Becker & Wolff, 2007). The effects of bulk Comptonization as well as thermal Comptonization can lead to a power law spectrum with high exponential cutoff in these sources (Becker & Wolff 2007; Farinelli et al. 2012).
For investigating the spectral characteristics, physics of accretion column and the causes of peculiar peaks in the pulse profile as seen during the NuSTAR observation, we have comprehensively studied the spectral properties of GX 1+4 by using RXTE, Suzaku and NuSTAR observations over a wide range of luminosity. The 1-79 keV spectra from NuSTAR and Swift are well described by several traditional models along with an additional blackbody component. We find that a model consisting of a bremsstrahlung component and a blackbody component (Br+BB) best describes the energy spectrum of GX 1+4 obtained from NuSTAR and Swift observations. This model provides a better understanding of the origin of the peculiar shape of pulse profile during the NuSTAR observation. Using the value of blackbody normalization from spectral fitting and a source distance of 10 kpc, the radius of blackbody emitting region can be estimated to be 400 m. This indicates that the emitting region was located close to the neutron star surface or the base of the accretion column.
Apart from the standard empirical models, physical models such as COMPMAG and BW models are also used to describe the spectra of GX 1+4 obtained from NuSTAR and Swift observations to understand the properties of the accretion column. These models were developed by considering the effects of Comptonization processes occuring near the neutron star surface (Becker & Wolff 2007; Ferrigno et al. 2009; Farinelli et al. 2012). Considering a distance of 4.3 and 10 kpc, the source luminosity was estimated to be 1.4 and 7.41036 erg s-1, respectively. The critical luminosity in some of the pulsar sources e.g. EXO 2030+375, V 0332+53, GX 304-1 (Mushtukov et al. 2015; Epili et al. 2017) is in the range of 1037 erg s-1, though at sub-critical luminosity level, the 1-79 keV spectrum of GX 1+4 was successfully described with the BW model for bright sources. The physical parameters obtained from this model show interesting results. The ratio of bulk to thermal Comptonization is found to be relatively high by an order of magnitude during the observation. This indicates that the Comptonization from bulk motion of electrons with seed photons dominates the pulsar emission during a faint state. Similar outcome is also manifested from the COMPMAG2 model in which a lower electron temperature is detected at high terminal velocity . Becker & Wolff (2005) have reported the dominance of bulk motion Comptonization in sub-critical pulsar (accreting below a specific luminosity), as observed in the present study. To investigate the changes in the emission process further, the BW model is used to describe the spectra from a Suzaku observation at high intensity. We find that the effect of thermal Comptonization is high or relative close to the bulk emission process during bright state. However, we also noticed in this case that the parameter significantly differs from the condition =2/ for the accretion flow that goes through a radiation dominated shock and satisfies the zero velocity condition at the neutron star surface (see Equation 26 from Becker & Wolff 2007). Advanced BW model is, therefore, needed to comprehend the nature of the X-ray continuum for sub-critical pulsars as observed with Suzaku.
The BW model also provides opportunity to constrain the magnetic field of the neutron star. Several attempts have been made for estimating the field strength of GX 1+4 by using the standard accretion disk model as well as cyclotron resonance scattering feature (Dotani et al. 1989; Makishima et al. 1988; Ferrigno et al. 2007). It is interesting to mention that a high value of magnetic field, in the order of 1013–1014 G, was predicated by studying the spin-period evolution of the pulsar (Dotani et al. 1989; Makishima et al. 1988; Cui & Smith 2004). A relatively lower value of field strength (31012 G) was also reported by tentative detection of a cyclotron line at 34 keV (Naik et al. 2005; Rea et al. 2005; Ferrigno et al. 2007). Cyclotron lines are absorption like features observed in the hard X-ray spectrum of pulsars. These features are due to resonant scattering of photons with electron in a strong magnetic field of the order of 1012 G (Jaisawal & Naik, 2017). Detection of these features, therefore, provides a direct method to estimate the magnetic field of neutron stars. This line was tentatively reported at 34 keV in GX 1+4 using BeppoSAX and INTEGRAL observations. However, we do not find any evidence of this feature in the broad-band spectra of the pulsar obtained from Suzaku and NuSTAR observations. Using the BW model, we put a tentative constrain on the magnetic field strength of the pulsar at (5–10)1012 G. Future observations in bright phase can possibly confirm this finding through the detection of cyclotron line in the pulsar spectrum.
6 Summary and Conclusion
In summary, a detailed timing and spectral study of accretion-powered pulsar GX 1+4 was presented in this paper by using data from RXTE, Suzaku, NuSTAR and Swift observations. Our long term studies on pulse profile showed that the emission geometry of the pulsar is relatively simple, producing sinusoidal-like profiles that do not strongly depend on luminosity. During the NuSTAR observation, a peculiar narrow peak is detected in the profile below 25 keV. This peak is found to be strongly energy dependent. However, the hard X-ray profiles appear to be simple and broad peaked. The energy spectrum from NuSTAR is well described with a two component model consisting of a bremsstrahlung and blackbody component along with iron fluorescence lines at 6.4 and 6.9 keV. In the phase-resolved spectroscopy, a strong blackbody component is detected, peaking in a narrow pulse phase range of the pulsar and is interpreted as the cause of the peculiar peak in the profile. The BW and COMPMAG models are also used to explain the spectra of GX 1+4. We found that the effect of bulk Comptonization dominates the energy spectra in faint state. Though, we do not detect previously-reported cyclotron line in our study, the magnetic field is constrained to a range of (5–10)1012 G by using the BW model.
Acknowledgments
We sincerely thank the referee for his/her suggestions on the paper. GKJ thanks C. Ferrigno and M. Wolff for discussions on the physical models. The research work at Physical Research Laboratory is funded by the Department of Space, Government of India. The research leading to these results has received funding from the European Union’s Seventh Framework Programme and Horizon 2020 Research and Innovation Programme under the Marie Skłodowska-Curie Actions grant no. 609405 (FP7) and 713683 (H2020; COFUNDPostdocDTU). This research has made use of data obtained through HEASARC Online Service, provided by the NASA/GSFC, in support of NASA High Energy Astrophysics Programs.
References
- Bachetti (2015) Bachetti M., 2015, MaLTPyNT, Astrophysics Source Code Library, record ascl:1502.021.
- Becker & Wolff (2005) Becker P. A., & Wolff M. T. 2005, ApJ, 630, 465
- Becker & Wolff (2007) Becker P. A., & Wolff M. T. 2007, ApJ, 654, 435
- Buccheri et al. (1983) Buccheri R., Bennett K., Bignami G. F., et al. 1983, A&A, 128, 245
- Burrows et al. (2005) Burrows D. N., et al. 2005, SSRv, 120, 165
- Chakrabarty et al. (1997) Chakrabarty D., Bildsten L., Finger M. H., et al. 1997, ApJ, 481, L101
- Chakrabarty & Roche (1997) Chakrabarty D., & Roche, P. 1997, ApJ, 489, 254
- Corbet et al. (2008) Corbet R. H. D., Sokoloski J. L., Mukai K., Markwardt C. B., & Tueller J., 2008, ApJ, 675, 1424
- Cui (1997) Cui W., 1997, ApJL, 482, 163
- Cui & Smith (2004) Cui W., Smith B., 2004, ApJ, 602, 320
- Cutler et al. (1986) Cutler, E. P., Dennis, B. R., & Dolan, J. F. 1986, ApJ, 300, 551
- Davidsen et al. (1977) Davidsen, A., Malina, R., & Bowyer, S. 1977, ApJ, 211, 866
- Dotani et al. (1989) Dotani, T., Kii, T., Nagase, F., et al. 1989, PASJ, 41, 427
- Epili et al. (2016) Epili P., Naik S., Jaisawal G. K., 2016, RAA, 16, 77
- Epili et al. (2017) Epili P., Naik S., Jaisawal G. K., Gupta S., 2017, MNRAS, 472, 3455
- Farinelli et al. (2012) Farinelli R., Ceccobello C., Romano P., Titarchuk L., 2012, A&A, 538, 67
- Ferrigno et al. (2007) Ferrigno C., Segreto A., Santangelo A., et al. 2007, A&A, 462, 995
- Ferrigno et al. (2009) Ferrigno C., Becker P. A., Segreto A., Mineo T., Santangelo A., 2009, A&A, 498, 825
- Galloway et al. (2001) Galloway D.K., Giles A.B., Greenhill J.G., et al. 2000, MNRAS, 311, 755
- Galloway et al. (2000) Galloway D.K., Giles A.B., Wu K., Greenhill J.G., 2001, MNRAS, 325, 419
- Ghosh & Lamb (1979) Ghosh P., & Lamb F. K. 1979b, ApJ, 234, 296
- Giles et al. (2000) Giles A. B., Galloway D. K., Greenhill J. G., Storey M. C., and Wilson M. C., 2000, ApJ, 529, 447
- Glass & Feast (1973) Glass I. S., & Feast M. W. 1973, Nature, 245, 39
- González-Galán et al. (2012) González-Galán, A., Kuulkers E., Kretschmar P., et al. 2012, A&A 537.
- Harrison et al. (2013) Harrison F.A. et al. 2013, ApJ, 770, 103
- Hickox et al. (2004) Hickox R. C. & Narayan R., 2004, ApJ, 614, 881
- Hinkle et al. (2006) Hinkle K. H., Fekel F. C., Joyce R. R., et al. 2006, ApJ, 641, 479
- Iben & Tutukov (1996) Iben I., Jr., Tutukov A. V. 1996, ApJ, 456, 738
- Iłkiewicz et al. (2017) Iłkiewicz K., Mikołajewska J., Monard B. et al. 2017, A&A 60
- Jahoda et al. (1996) Jahoda K., Swank J. H., & Giles A. B. et al. 1996, ApJS, 163, 401
- Jaisawal, Naik & Epili (2016) Jaisawal G. K., Naik S., Epili P., 2016, MNRAS, 457, 2749
- Jaisawal & Naik (2017) Jaisawal G. K., Naik S., 2017, 7 years of MAXI: monitoring X-ray Transients Conference proceeding, 153 (arXiv:1705.05536)
- Koyama et al. (2007) Koyama K. et al., 2007, PASJ, 59, 23
- Leahy (1987) Leahy D.A., A&A, 1987, 180, 275
- Lewin et al. (1971) Lewin W.H.G., Ricker G.R., McClintock, J.E., 1971, ApJL, 169, 17
- Makishima et al. (1988) Makishima K., Ohashi T., et al. 1988, Nature, 333, 746
- Mitsuda et al. (2007) Mitsuda K. et al. 2007, PASJ , 59, S1-S7
- Mushtukov et al. (2015) Mushtukov A. A., Suleimanov V. F., Tsygankov S. S., Poutanen J., 2015, MNRAS, 447, 1847
- Naik et al. (2005) Naik, S., Paul, B., & Callanan, P. J. 2005, ApJ, 618, 866
- Naik et al. (2013) Naik S., Maitra C., Jaisawal G. K., Paul B., 2013, ApJ, 764, 158
- Paul & Naik (2011) Paul B., Naik S., 2011, BASI, 39, 429
- Rea et al. (2005) Rea, N., Stella, L., Israel, G. L., et al. 2005, MNRAS, 364, 1229
- Rothschild et al. (1998) Rothschild R. E., et al., 1998, ApJ, 496, 538
- Serim et al. (2017) Serim, M. M., Şahiner, Ş, Çerri-Serim, D., İnam, S. Ç, & Baykal, A., 2017, MNRAS 469, 250
- Takahashi et al. (2007) Takahashi T. et al. 2007, PASJ , 59, S35-S51
- Yoshida et al. (2017) Yoshida, Y., Kitamoto, S., Suzuki, H., et al. 2017, ApJ, 838, 30