Investigating a population of infrared-bright gamma-ray burst host galaxies
Abstract
We identify and explore the properties of an infrared-bright gamma-ray burst (GRB) host population. Candidate hosts are selected by coincidence with sources in WISE, with matching to random coordinates and a false alarm probability analysis showing that the contamination fraction is 0.5. This methodology has already identified the host galaxy of GRB 080517. We combine survey photometry from Pan-STARRS, SDSS, APASS, 2MASS, GALEX and WISE with our own WHT/ACAM and VLT/X-shooter observations to classify the candidates and identify interlopers. Galaxy SED fitting is performed using MAGPHYS, in addition to stellar template fitting, yielding 13 possible IR-bright hosts. A further 7 candidates are identified from previously published work. We report a candidate host for GRB 061002, previously unidentified as such. The remainder of the galaxies have already been noted as potential hosts. Comparing the IR-bright population properties including redshift , stellar mass M⋆, star formation rate SFR and V-band attenuation AV to GRB host catalogues in the literature, we find that the infrared-bright population is biased toward low , high M⋆ and high AV. This naturally arises from their initial selection - local and dusty galaxies are more likely to have the required IR flux to be detected in WISE. We conclude that while IR-bright GRB hosts are not a physically distinct class, they are useful for constraining existing GRB host populations, particularly for long GRBs.
keywords:
gamma-ray burst: general – infrared: galaxies – galaxies: statistics – galaxies: star formation – dust, extinction1 Introduction
Gamma-ray bursts (GRBs) occur when relativistic jets are launched by a newly formed neutron star or black hole, along our line of sight, in the immediate aftermath of a cataclysmic event such as the collapse of a massive star or merger of two compact objects. The distribution of GRB durations (the time over which 90 per cent of the gamma-ray radiation arrives) is indicative of two main populations. Long bursts (T90 2s) are thought to arise from the collapse of particularly massive, rapidly rotating stars (Woosley & Bloom, 2006; Levan et al., 2016; Schady, 2017), while short GRBs (SGRBs) are associated with the merger of compact objects (The LIGO Scientific Collaboration & The Virgo Collaboration, 2017; LIGO Scientific Collaboration et al., 2017; Troja et al., 2017; Goldstein et al., 2017; Tanvir et al., 2017b). Throughout, we denote short and long bursts in the text as SGRBs and LGRBs respectively. Because the progenitors of LGRBs are massive stars, and these only exist for a short while after formation, we expect to find that their host galaxies are actively star-forming. Multi-wavelength observations of LGRB hosts have found this to be the case. Within their hosts, LGRBs appear to trace the regions of highest UV luminosity, and hence star formation (Fruchter et al., 2006; Svensson et al., 2010; Starling et al., 2011; Blanchard et al., 2016; Lyman et al., 2017). Similarly, we would expect the comoving rate density of LGRBs to scale with the star formation rate density throughout cosmic history (Hopkins & Beacom, 2006; Madau & Dickinson, 2014). However, LGRBs have an apparent aversion to massive, luminous galaxies at fixed SFR, which has been interpreted as a host metallicity bias (Fruchter et al., 2006; Perley et al., 2013; Hjorth et al., 2012; Perley et al., 2016a). The bias has been confirmed spectroscopically (Krühler et al., 2015). For a massive star to produce a GRB, it is thought that the progenitor must have sufficient angular momentum (see Blandford & Znajek (1977), and Williams (1995)). This is difficult if the stellar metallicity is high, because metals increase the opacity of the stellar envelope, driving mass and angular momentum loss through line-driven winds (Vink & de Koter, 2005; Vink & Harries, 2017). Furthermore, if pre-burst mass loss produces a dense, high metallicity circumstellar medium, the opacity to gamma-rays is increased and may stifle the jet (Hjorth, 2013).
Despite these theoretical considerations, the aversion to massive, dusty galaxies may also be due to observational biases (Perley et al., 2013). The picture of LGRBs favouring low mass, low metallicity hosts is complicated by the existence of dark bursts. These are GRBs which have a steeper X-ray to optical slope, , than would be expected from extrapolation of their X-ray spectra (Rol et al., 2005). The implication is that the optical emission is suppressed. Studies have shown that per cent of all bursts fall into this category (Jakobsson et al., 2004; Selsing et al., 2018). The proposed explanations for the high values in this population include intrinsic faintness, the burst being at very high redshift, and dust obscuration within the host. The first of these is hard to explain on theoretical grounds, as the GRB and subsequent afterglow are though to arise from the same outflow of material interacting with the ISM; as such GRBs which are bright in X-rays ought to also be optically bright (e.g. Dainotti et al., 2015). If the burst is at very high redshift, observed optical bands correspond to rest-frame ultraviolet (UV), which is absorbed along the line of sight by neutral Hydrogen. However, such bursts are expected to be rare, and indeed only a small fraction of bursts have been confirmed at (Ruiz-Velasco et al., 2007; Tanvir et al., 2009; Salvaterra et al., 2009; Greiner et al., 2009; Cucchiara et al., 2011; McGuire et al., 2016; Tanvir et al., 2017a; Bolmer et al., 2017). The majority of dark bursts are thought to be optically faint due to dust extinction. Early studies of GRB host populations systematically missed dark burst hosts because localisation was performed with optical afterglows, particularly before the launch of Swift. More recent studies have attempted to account for this by selecting hosts of bursts which have an undetected optical afterglow, using X-rays for localisation instead. However, Krühler et al. (2011) and Perley et al. (2013) found that even when considering dark burst hosts, which are typically more massive and dusty, the overall GRB population still shows a bias towards fainter, less massive systems than the typical star forming galaxy population at the same epoch. Moving to host identification in the infrared (IR) may provide a route to further reducing this bias, since ultraviolet light from young stellar populations is preferentially absorbed by dust, and re-emitted in the IR. This only aids the identification of dark GRB hosts, however, if they are dark due to extinction from galaxy-wide dust. If the extinction is local to the burst site, or exclusively along the line of sight, then a burst might be optically suppressed in an otherwise IR-faint galaxy with little dust re-emission.
All-sky infrared surveys, such as the Wide-field Infrared Survey Explorer (WISE, Wright et al., 2010), can be used for the purpose of host identification. Such surveys are shallow, favouring the identification of nearby (Kovács & Szapudi, 2015) or luminous and dusty hosts. A small number of GRB hosts have been confirmed at , which we define as local. These include LGRBs 051109B, 060218, 100316D and 111005A (Perley et al., 2006; Liang et al., 2007; Starling et al., 2011; Michałowski et al., 2016), while the host of LGRB 080517 was studied by Stanway et al. (2015a) following initial selection through coincidence with a notably bright source in the WISE bands. Subsequent follow-up resulted in characterisation of the stellar population and star formation rate in this galaxy through a number of indicators, including radio emission. It also secured the detection of molecular gas for only the third time in a GRB host, constraining the gas consumption timescale (Stanway et al., 2015b).
In general, the benefits of identifying local GRB hosts are threefold. First, as discussed, proximity makes observation at radio, submillimetre and infrared wavelengths more feasible (e.g., Michałowski et al., 2015). This is exemplified by the recent identification of infrared molecular hydrogen emission lines in low-redshift GRB host galaxies (Wiersema et al, in prep). Secondly, local galaxies will tend to have greater angular extent and thus be easier to spatially resolve for GRB environment studies, increasingly using IFUs (e.g. Christensen et al., 2008; Starling et al., 2011). Finally, a rare class of low-luminosity long GRB (LLGRB) has emerged thanks to their low redshift identification (e.g. Galama et al., 1998; Stanway et al., 2015a). Because the supernovae (SNe) associated with LLGRBs appear typical of GRB-SNe across the full range of LGRB energies, it seems unlikely that the progenitors of LLGRBs are different to ‘regular’ LGRBs (Schady, 2017). The question then is, what factors can produce the wide range of inferred LGRB isotropic energies, while influencing the range of SN energies much less? Suggestions have included the effect of viewing angle, differences between central engine activity duration versus the shock breakout time, and progenitor metallicity having an impact on burst efficiency (Hjorth, 2013; Levan et al., 2016; Schady, 2017). Studies of a large sample of low redshift LGRB hosts will be invaluable in determining the conditions capable of producing LGRBs, including low-luminosity bursts, as well as for studying the evolution of LGRB hosts over cosmic time.
In this paper we explore the properties of a population of IR-bright GRB host galaxies, detected in WISE. The hosts are localised in X-rays and are selected from all bursts detected between 2005-2016 inclusive. Such galaxies may be nearby, or extremely luminous and dusty. The paper is structured as follows. Section 2 describes the sample and selection criteria used. Section 3 details observations of a sub-sample of these candidate hosts, including VLT/X-shooter and WHT imaging and spectroscopy, in addition to ATCA radio observations. We compile archival and survey data in section 4. In section 5, previously studied hosts are identified. SED fitting is performed in section 6. Section 7 presents our results and discussion, with the broader implications considered in section 8. Our conclusions follow in section 9. Where required, the standard CDM cosmology is used, with = 0.7, = 0.3 and = 0.7. Magnitudes are quoted in the AB system (Oke & Gunn, 1983).
2 Sample Selection
2.1 Rationale
The Swift observatory (Gehrels et al., 2004), which has detected the bulk of GRBs since 2005, is mounted with an X-ray telescope (XRT, Burrows et al., 2004), a Gamma-ray Burst Alert Telescope (BAT, Barthelmy et al., 2005) and an Ultraviolet and Optical Telescope (UVOT, Roming et al., 2005), as on-board instruments. UVOT provides the best localisations, however only one third of bursts with an X-ray detection have a UVOT determined position. At the other extreme, all detected GRBs have a BAT detection by definition, however the localisation is no better than a few arcminutes. The best balance between the number of detections and the ability to locate a host is therefore provided by X-rays, for which 98 per cent of bursts have a localisation. We have identified a sample of infrared-bright gamma-ray burst host galaxies by cross-matching the GRB X-ray afterglow coordinates with the ALLWISE IR all-sky catalogue from WISE (the Widefield Infrared Survey Explorer, Wright et al., 2010). This provides aperture matched photometry in four wavebands, , at 3.4, 4.6, 12 and 22 m. Any cross match procedure between these catalogues will identify both genuine matches and spurious matches to unassociated sources. Because the WISE dataset is relatively shallow, we expect to see nearby or very luminous extragalactic sources, in addition to Galactic stellar contaminants.
2.2 Initial Cross-Matching and Cuts
Data for GRBs (detected by Swift, INTEGRAL, Konus-Wind and the IPN) in the years 2005-2016 inclusive were downloaded from NASA’s GRB catalogue111https://swift.gsfc.nasa.gov/archive/grb_table/. Swift positions were checked against the Swift XRT-GRB catalogue222http://www.swift.ac.uk/xrt_live_cat/. The data include positions in the gamma-ray, X-ray and UV/optical bands, with their associated 90 per cent confidence error radii, in addition to the durations. We do not, at this stage, differentiate between long and short bursts. The total sample contains 1001 bursts, which are used for the following analysis. TOPCAT333http://www.star.bris.ac.uk/ mbt/topcat/ (Taylor, 2005) was used to cross-match the X-ray locations with sources in the ALLWISE catalogue. Matching is primarily to the W1 band, i.e. all of our sources have at least a W1 detection. No significance cut in W1 was made at this stage, since the quality of the sources are determined through flags and visual inspection, as described later.
We perform an initial cross-matching analysis with a fixed radius for all bursts. In order to determine the expected contamination fraction, we also match to a catalogue of positions created by shifting the 1001 GRB positions by 1 and 2 deg in each of Right Ascension (RA) and Declination (Dec). Because the search radii used are of the order arcseconds, and the X-ray positional uncertainties are also on this scale, shifting by 1 or 2 deg removes all physical correlations and creates a random sample of coordinates. Crucially however, the broad distribution of points in galactic latitude and hence surface density is preserved. Various trial radii from 1 to 10 arcsec are tested. The difference between the number of matches to actual GRB coordinates, and to our new pseudo-random coordinates, is used to estimate a significance through the Poisson cumulative distribution,
| (1) |
where the smallest corresponds to the best matching radius. We find that = 2.5 arcsec minimizes the contamination fraction. The significance is further improved by employing cuts. This includes the removal of sources contaminated by diffraction spikes, optical ghosts and similar data artefacts, using the ALLWISE contamination and confusion flag (CCF). If one of the W1 or W2 bands is dominated by contaminating flux, the match is rejected, or if both of these bands are contaminated (but not dominated), the match is rejected. Matched sources which do not satisfy these criteria cannot be considered robust or reliable. The random matches include both brighter and fainter objects than the actual matches, therefore we limit the random matches to the same range in apparent magnitude to evaluate the probability of selecting the same population by chance. The cuts effectively act as a signal-to-noise filter, with the lowest W1 SNR after cuts of . This gives a maximum centroiding error of 0.5 arcsec (given ). The X-ray positional uncertainties therefore dominate the cross-matching. A final cut was made by removing objects whose cross-matched counterparts were ambiguous or blended in W1 on visual inspection, but which otherwise satisfied the confusion flag cut. These are SGRB 060801 and LGRB 061007. Image cutouts of these (and all other) burst locations in the W1 band are given in the appendix. Given that visual inspection is both time consuming and subjective, this last cut was not applied to the randoms and as such all numerical comparisons between actual and random samples were made before this stage.
With these cuts, and with a 2.5 arcsec matching radius, we find 45 matches to actual GRB positions and 23 to random coordinates. The corresponding Poisson cumulative probability is . Using this methodology, we estimate a contaminant fraction of 0.51, with a Poisson 95 per cent confidence interval covering the region 0.36 0.67.
2.3 Consideration of Burst Error Radii and Local Background Densities
In the previous section, we use the same matching radius for all bursts to give an estimate of the contamination fraction. However, this fails to consider two important factors. First, while 2.5 arcsec is the best matching radius when averaging over the GRB sample, individual burst error radii vary and can be larger than this, so we may be missing genuine matches which lie further out. Second, because GRBs occur in galaxies which tend to exist as members of groups and clusters, our previous analysis considering only the effect of galactic latitude on chance alignment probability is incomplete. The true chance of random alignment may be greater than suggested by averaging over degree-scales because GRBs should preferentially occur in over-densities, which have angular scales much smaller than this.
To address the first issue concerning the tailoring of cross-matching radius to each GRB, we use a radius of 1.5R90. This is approximately the 99 per cent error radius, assuming a Gaussian profile for the X-ray probability function. From 1001 GRBs, this yields 60 GRBs with one IR match and 4 with two or more. Some WISE sources are included in this count, and not in the 45 discussed previously, because their associated GRB has 1.5R90>2.5 arcsec and a match at >2.5 arcsec. Others are not included because the matched radius from the previous analysis is greater than 1.5R90. These are GRBs 050716, 060428B, 070208, 120119A, 120612A and 161108A. We add these 6 bursts back into the sample - a small X-ray uncertainty is not used at this stage to reject an otherwise good match, because the source of the IR flux could plausibly be extended.
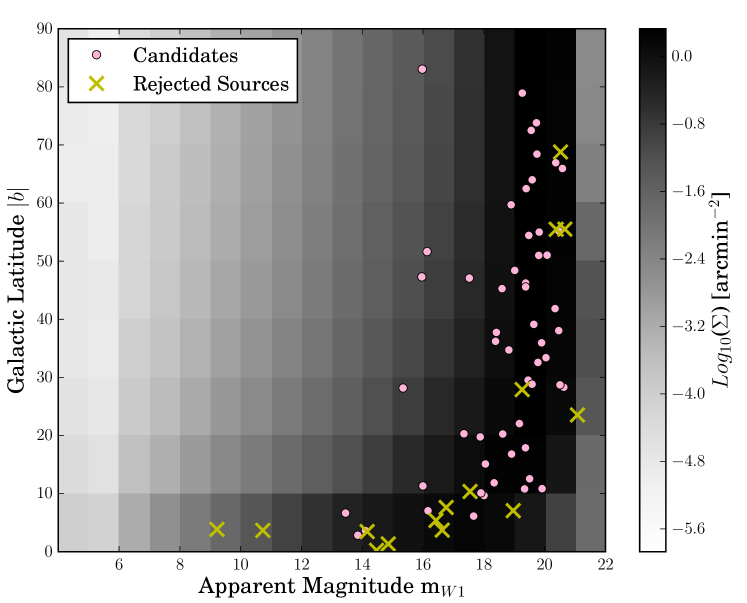
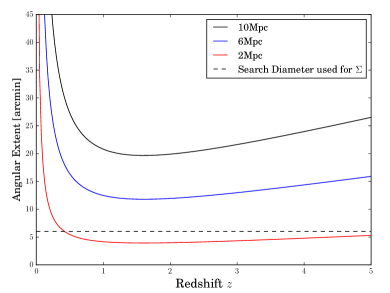
In order to estimate the chance that each association is genuine, we perform a false alarm probability (FAP) analysis. The surface density of sources in the entire ALLWISE catalogue is visualised in figure 1, as a function of latitude and W1 magnitude. The matched bursts are indicated. Clearly the apparent magnitude and galactic latitude both affect the probability that a match is spurious. However, sky object density also varies on small scales, in addition to the broad galactic latitude trend. To sample the local surface density around each burst, we cross-match the X-ray coordinates for each burst with a 3 arcmin radius. Given that galaxy clusters have typical sizes of 10Mpc, a 6 arcmin diameter is a sufficiently small angular scale to sample density variation due to clustering and cosmic variance. This is demonstrated in figure 2, which relates redshift to angular extent for physical scales of 2, 6 and 10Mpc, through , where is the angular diameter distance.
| GRB | T90 | Short/ | X-ray Ra | X-ray Dec | R90 | WISE Ra | WISE Dec | Sep | FAP | Type |
|---|---|---|---|---|---|---|---|---|---|---|
| [s] | Long | [deg] | [deg] | [arcsec] | [deg] | [deg] | [arcsec] | |||
| 050219A | 23.7 | L | 166.4124 | -40.6842 | 1.9 | 166.4128 | -40.6847 | 2.13 | 0.013183 | NC/LG |
| 050318 | 32 | L | 49.7129 | -46.3961 | 1.4 | 49.7129 | -46.3961 | 0.02 | 0.000002 | NC |
| 050522 | 10.8 | L | 200.1458 | 24.7883 | 6 | 200.1440 | 24.7869 | 8.06 | 0.002003 | s |
| 050716 | 69.1 | L | 338.5866 | 38.6843 | 1.4 | 338.5866 | 38.6850 | 2.42 | 0.014346 | ND/s |
| 050721 | 98.4 | L | 253.4356 | -28.3811 | 1.7 | 253.4352 | -28.3814 | 1.90 | 0.018820 | s |
| 050724 | 96 | S | 246.1847 | -27.5409 | 1.5 | 246.1849 | -27.5407 | 0.89 | 0.002065 | G |
| 060428B | 57.9 | L | 235.3570 | 62.0248 | 1.4 | 235.3583 | 62.0249 | 2.26 | 0.002668 | CA |
| 061002 | 17.6 | L | 220.3480 | 48.7414 | 2.6 | 220.3478 | 48.7413 | 0.65 | 0.000302 | PG |
| 070208 | 47.7 | L | 197.8859 | 61.9651 | 1.5 | 197.8866 | 61.9656 | 2.37 | 0.011924 | PG/CA |
| 070309 | 40 | L | 263.6658 | -37.9307 | 4.4 | 263.6647 | -37.9306 | 3.33 | 0.026938 | NC |
| 070429B | 0.47 | S | 328.0159 | -38.8283 | 2.4 | 328.0156 | -38.8286 | 1.40 | 0.004958 | NC/LG |
| 070724A | 0.4 | S | 27.8085 | -18.5944 | 1.7 | 27.8088 | -18.5944 | 1.02 | 0.001910 | G |
| 071117 | 6.6 | L | 335.0439 | -63.4433 | 1.5 | 335.0444 | -63.4428 | 2.09 | 0.008035 | NC |
| 080207 | 340 | L | 207.5122 | 7.5022 | 1.4 | 207.5124 | 7.5018 | 1.55 | 0.008959 | ND/LG |
| 080307 | 125.9 | L | 136.6287 | 35.1388 | 1.4 | 136.6290 | 35.1392 | 1.98 | 0.011835 | ND/CA |
| 080405 | 40 | L | 162.5996 | -4.2888 | 2.5 | 162.5988 | -4.2888 | 2.71 | 0.001357 | s |
| 080517 | 64.6 | L | 102.2420 | 50.7352 | 1.6 | 102.2415 | 50.7353 | 1.06 | 0.000455 | G |
| 080605 | 20 | L | 262.1252 | 4.0157 | 1.5 | 262.1254 | 4.0156 | 0.60 | 0.000889 | ND/LG |
| 080623 | 15.2 | L | 237.6610 | -62.0491 | 1.4 | 237.6616 | -62.0487 | 1.56 | 0.012242 | NC |
| 090904B | 47 | L | 264.1855 | -25.2132 | 1.4 | 264.1854 | -25.2129 | 1.11 | 0.005129 | s |
| 091102 | 6.6 | L | 72.6155 | -72.5197 | 2 | 72.6149 | -72.5199 | 1.01 | 0.003337 | NC |
| 100206A | 0.12 | S | 47.1626 | 13.1570 | 3.3 | 47.1631 | 13.1581 | 4.15 | 0.010560 | G |
| 100316D | 1300 | L | 107.6276 | -56.2555 | 3.7 | 107.6255 | -56.2562 | 4.96 | 0.030711 | NC/LG |
| 100816A | 2.9 | L? | 351.7399 | 26.5784 | 1.4 | 351.7395 | 26.5780 | 1.97 | 0.009327 | ND/LG |
| 110206A | 20 | L | 92.3343 | -58.8069 | 1.9 | 92.3331 | -58.8067 | 2.24 | 0.024210 | NC |
| 110305A | 12 | L | 260.8806 | -15.8025 | 1.7 | 260.8810 | -15.8030 | 2.22 | 0.006510 | Ps |
| 110918A | 22 | L | 32.5387 | -27.1061 | 1.5 | 32.5386 | -27.1057 | 1.24 | 0.003484 | ND/LG |
| 111222A | 1 | S | 179.2197 | 69.0709 | 2.9 | 179.2208 | 69.0704 | 2.40 | 0.000177 | s |
| 120119A | 253.8 | L | 120.0288 | -9.0817 | 1.4 | 120.0291 | -9.0824 | 2.49 | 0.021870 | Ps |
| 120224A | 8.13 | L | 40.9422 | -17.7613 | 1.4 | 40.9424 | -17.7617 | 1.76 | 0.003069 | ND/g |
| 120612A | 90 | L | 126.7217 | -17.5748 | 1.5 | 126.7212 | -17.5743 | 2.41 | 0.009252 | s |
| 120819A | 71 | L | 235.9075 | -7.3091 | 1.7 | 235.9076 | -7.3093 | 0.92 | 0.002322 | ND |
| 130515A | 0.29 | S | 283.4401 | -54.2791 | 2.4 | 283.4385 | -54.2792 | 3.44 | 0.040879 | NC/s |
| 130527A | 44 | L | 309.2763 | -24.7250 | 1.4 | 309.2761 | -24.7247 | 1.31 | 0.005843 | ND/g |
| 130528A | 59.4 | L | 139.5051 | 87.3012 | 1.9 | 139.4988 | 87.3015 | 1.48 | 0.008832 | ND/LG/CA |
| 130603B | 0.18 | S | 172.2006 | 17.0714 | 1.4 | 172.2012 | 17.0714 | 1.85 | 0.006614 | G |
| 130725A | 101.8 | L | 230.0324 | 0.6276 | 1.8 | 230.0318 | 0.6276 | 2.09 | 0.007389 | ND |
| 130907A | >360 | L | 215.8922 | 45.6073 | 1.4 | 215.8921 | 45.6070 | 0.78 | 0.000969 | PG |
| 131018B | 38 | L | 304.5369 | 23.1876 | 4.9 | 304.5361 | 23.1876 | 2.84 | 0.009425 | Ps |
| 131122A | 70 | L | 152.5422 | 57.7277 | 4.8 | 152.5440 | 57.7292 | 6.50 | 0.044608 | PG |
| 140331A | 209 | L | 134.8644 | 2.7173 | 1.7 | 134.8650 | 2.7175 | 2.05 | 0.007334 | G |
| 140927A | 6.26 | L | 291.7916 | -65.3936 | 1.8 | 291.7922 | -65.3932 | 1.64 | 0.000745 | Ps |
| 141212A | 0.3 | S | 39.1248 | 18.1470 | 2.6 | 39.1254 | 18.1468 | 2.23 | 0.018170 | G |
| 150101B | 0.018 | S | 188.0205 | -10.9336 | 1.8 | 188.0207 | -10.9335 | 0.67 | 0.000070 | G |
| 150120A | 1.2 | S | 10.3189 | 33.9949 | 1.8 | 10.3193 | 33.9952 | 1.49 | 0.003069 | PG |
| 150323C | 159.4 | L | 192.6169 | 50.1912 | 1.6 | 192.6162 | 50.1909 | 1.93 | 0.010869 | ND/g |
| 150626A | 144 | L | 111.3368 | -37.7808 | 1.8 | 111.3370 | -37.7813 | 1.97 | 0.005876 | NC |
| 151111A | 76.93 | L | 56.8448 | -44.1615 | 1.5 | 56.8447 | -44.1619 | 1.53 | 0.004170 | NC |
| 160703A | 44.4 | L | 287.4168 | 36.9175 | 3.9 | 287.4164 | 36.9174 | 1.16 | 0.005082 | Ps |
| 161001A | 2.6 | L? | 71.9200 | -57.2608 | 1.4 | 71.9195 | -57.2604 | 1.69 | 0.007076 | NC |
| 161007A | 201.7 | L | 103.4090 | 23.3068 | 1.5 | 103.4087 | 23.3064 | 1.65 | 0.011553 | ND/g |
| 161010A | 30 | L | 275.2143 | -28.7852 | 2.9 | 275.2144 | -28.7862 | 3.68 | 0.017848 | s |
| 161104A | 0.1 | S | 77.8937 | -51.4601 | 3 | 77.8941 | -51.4613 | 4.47 | 0.024994 | NC |
| 161108A | 105.1 | L | 180.7879 | 24.8682 | 1.5 | 180.7885 | 24.8678 | 2.44 | 0.006978 | PG |
| 161214B | 24.8 | L | 3.8512 | 7.3524 | 1.5 | 3.8510 | 7.3524 | 0.73 | 0.000854 | s |
s - star. Ps - photometric star. G - galaxy. PG - photometric galaxy. NC - no coverage. ND - optical non-detection. LG - identified as an IR-bright host galaxy by comparison to the published literature. CA - rejected due to possible or confirmed chance alignment.
| GRB | T90 | Short/ | X-ray Ra | X-ray Dec | R90 | WISE Ra | WISE Dec | Sep | FAP | Type |
|---|---|---|---|---|---|---|---|---|---|---|
| [s] | Long | [deg] | [deg] | [arcsec] | [deg] | [deg] | [arcsec] | - | - | |
| 050117 | 166.6 | L | 358.4708 | 65.9389 | 15 | 358.4747 | 65.9404 | 7.78 | 0.787461 | FR |
| 050306 | 158.3 | L | 282.3088 | -9.1531 | 6 | 282.3101 | -9.1545 | 6.87 | 0.004357 | CC |
| 060223B | 10.3 | L | 254.2450 | -30.8128 | 10 | 254.2454 | -30.8141 | 4.94 | 0.197244 | FR |
| 060502B | 0.131 | S | 278.9385 | 52.6315 | 15 | 278.9413 | 52.6328 | 7.70 | 0.275397 | FR |
| 060801 | 0.49 | S | 213.0055 | 16.9818 | 1.5 | 213.0059 | 16.9818 | 1.40 | 0.007557 | WB |
| 061007 | 75.3 | L | 46.3317 | -50.5007 | 1.4 | 46.3318 | -50.5007 | 0.23 | 0.000191 | WB |
| 071001 | 58.5 | L | 149.7336 | -59.7818 | 6 | 149.7353 | -59.7822 | 3.44 | 0.004577 | CC |
| 071109 | 30 | L | 289.9746 | 2.0465 | 9 | 289.9747 | 2.0463 | 0.96 | 0.022986 | CC |
| 080212 | 123 | L | 231.1474 | -22.7417 | 1.4 | 231.1469 | -22.7415 | 1.68 | 0.007351 | CC |
| 100909A | 70 | L | 73.9473 | 54.6594 | 5.4 | 73.9510 | 54.6594 | 7.75 | 0.161417 | CC |
| 120419A | 20 | L | 187.3876 | -63.0079 | 4.5 | 187.3876 | -63.0095 | 5.62 | 0.075810 | CC |
| 120811A | 166 | L | 257.1654 | -22.7106 | 2.8 | 257.1658 | -22.7114 | 3.31 | 0.047855 | WB |
| 140103A | 17.3 | L | 232.0875 | 37.7592 | 3.6 | 232.0876 | 37.7577 | 5.31 | 0.127637 | FR |
| 150301A | 0.48 | S | 244.3047 | -48.7131 | 5 | 244.3019 | -48.7136 | 6.81 | 0.188791 | FR |
| 151004A | 128.4 | L | 213.6322 | -64.9391 | 7 | 213.6343 | -64.9369 | 8.58 | 0.091087 | FR |
CC - flagged as confused in WISE. WB - flagged as a blend in W1 band. FR - Rejected due to FAP>0.05
For the region around each burst, the local density of sources of magnitude equal to the WISE match or brighter is given by,
| (2) |
where is the number of sources within 3 arcmin of the burst of W1 magnitude or brighter, and = 3 arcmin. The probability of a match at angular distance being genuine and not a false alarm can be written as,
| (3) |
which tends to 1 as tends to 0, and tends to 0 as tends to , as required. Using this method, the false alarm probability (FAP) is given by . The CCF flag cuts from section 2.2 are again used. After these are made, a cut of FAP<0.05 is chosen. This cut, when applied to the matching of random positions to ALLWISE, yields a theoretical maximum of 50 matches by chance. However, the distribution continues well below 0.05. The average FAP is therefore is much lower, and the number of false matches will also be lower. This is backed up by the addition of only 7 matches when going from a FAP cut of 0.025 to 0.05. Included in these 7 is LGRB 100316D, which has a previously noted =0.059 host galaxy. Using a FAP cut of 0.05 allows us to catch hosts which have larger projected sizes, such as that of LGRB 100316D. In addition, it allows us to identify the hosts of bursts with large X-ray uncertainties, provided the field is not crowded and the WISE source is sufficiently bright.
As in section 2.2, SGRB 060801 and LGRB 061007 are removed due to possible blending in WISE, in addition to LGRB 120811A. Three GRBs with more than one IR match (GRBs 060223B, 071007 and 071109) had all of their candidates rejected due to CCF or FAP cuts. The fourth example with more than one match, LGRB 050117, lies in the galactic plane ( = 3) and has two matches almost equidistant at 7 arcsec, with similar false alarm probabilities. We cannot distinguish which IR source is more likely to be associated, and the line of sight extinction meant there was no optical afterglow reported for this burst, precluding a improved localisation. Therefore, we reject LGRB 050117. This leaves us with a final sample of 55 bursts, each with one matched WISE source. This differs from the sample derived in section 2.2, in that ten extra bursts are included: LGRB 050522, LGRB 070309, LGRB 080405, SGRB 100206A, LGRB 100316D, LGRB 130118B, SGRB 130515A, LGRB 131122A, LGRB 161010A and SGRB 161104A.
2.4 Sample Summary
The final sample includes candidate host galaxies for 55 GRBs. These are listed in table 1, with the candidates rejected for CCF flags, WISE blending and high false alarm probabilities given in table 2. The tables give the X-Ray coordinates, WISE coordinates, T90 estimates, the 90 per cent confidence interval on the X-ray position, the X-ray-WISE separation and a false alarm probability for association with the WISE source. Given the analysis in section 2.2, we are confident that around a third to two-thirds of the associations are spurious. However, some will be Galactic stars, and others may be galaxies with properties inconsistent with being a GRB host. These contaminants can be identified as such through their photometric and spectroscopic properties, as well as through better burst localisation. Observations and archival searches for these observations are thus the next objective of this analysis.
| Target | Filter | Int. [s] | Mag(AB) | 2 depth | Seeing [arcsec] |
|---|---|---|---|---|---|
| 061002 | g | 573 | 22.27 0.06 | 24.6 | 1.86 |
| r | 573 | 21.84 0.05 | 23.9 | 1.82 | |
| i | 572 | 21.09 0.05 | 23.8 | 1.88 | |
| z | 573 | 20.45 0.07 | 22.0 | 1.88 | |
| 070208 | g | 573 | 19.81 0.01 | 24.9 | 1.80 |
| r | 730 | 19.46 0.01 | 24.1 | 2.25 | |
| i | 573 | 19.25 0.02 | 22.8 | 1.75 | |
| z | 573 | 19.13 0.03 | 20.8 | 1.66 | |
| 080307 | g | 897 | 24.1 0.2 | 24.6 | 1.78 |
| r | 1653 | 23.0 0.1 | 24.3 | 1.90 | |
| i | 213 | > 22.8 | 23.4 | 1.78 | |
| z | 731 | > 23.9 | 22.4 | 2.32 | |
| 100816A | g | 573 | > 24.1 | 24.0 | 2.52 |
| r | 693 | 22.6 0.1 | 23.6 | 1.67 | |
| i | 514 | > 21.3 | 21.8 | 1.49 | |
| 111222A | g | 261 | 19.11 0.02 | 22.5 | 2.46 |
| r | 81 | 18.14 0.03 | 20.8 | 1.65 | |
| i | 81 | 16.64 0.01 | 20.5 | 1.73 | |
| z | 180 | 15.89 0.02 | 22.2 | 1.79 | |
| 140331A | g | 491 | > 25.0 | 24.6 | 2.74 |
| r | 933 | 22.59 0.09 | 23.9 | 2.38 | |
| i | 573 | > 20.0 | 21.1 | 2.67 | |
| z | 371 | 20.80 0.06 | 22.4 | 2.31 | |
| 141212A | r | 573 | 22.8 0.1 | 23.3 | 2.08 |
| i | 573 | 22.7 0.2 | 23.0 | 2.38 | |
| z | 573 | > 21.9 | 22.4 | 1.46 |
3 Observations
In order to investigate the true hosts and determine which matches are spurious, we have observed subsets of the sample with WHT/ACAM, VLT/X-shooter and ATCA. 7 targets were observed with ACAM/WHT, 5 with VLT/X-shooter and 14 with ATCA.
3.1 WHT Imaging
Observations of 7 candidate hosts were taken over two nights (2015 January 19 and 20) with the auxiliary-port camera (ACAM) on the William Herschel Telescope (WHT). These were associated with programme WHT/2015A/34. Both nights were severely affected by poor observing conditions. The object associated with SGRB 111222A was observed on 2015 January 19, however observations were hampered by clouds and wind gusts in excess of 70 km h-1. The objects associated with LGRB 100816A, SGRB 141212A, LGRB 140331A, LGRB 070208, LGRB 061002 and LGRB 080307 were observed on 2015 January 20. Conditions were clearer but still windy, with poor seeing (2 arcsec). Sloan , , and filters were used. The images were reduced with standard IRAF procedures and aperture photometry performed on the candidate hosts. Aperture sizes were chosen to be 2 times the seeing FWHM (of the largest band) if the target was a point source, or else 2 times the FWHM of the object of interest. Aperture sizes were kept constant for each source. Details of the observations and measured quantities are listed in table 3, along with 2 depths and the seeing. The quoted magnitudes are in broad agreement with archival data where available.
| Target | Obsv. | Date | Int.UV [s] | Int.Vis [s] | Int.IR [s] | Seeing [arcsec] |
|---|---|---|---|---|---|---|
| 111222A | WHT | 2015 Jan 19 | 1260 | 1260 | - | 1.91 |
| 140331A | WHT | 2015 Jan 20 | 1255 | 1255 | - | 2.53 |
| 091102 | VLT | 2015 Dec 07 | 1800 | 2220 | 2160 | < 0.8 |
| 091102 | VLT | 2015 Dec 07 | 1800 | 2220 | 2160 | < 0.8 |
| 120224A | VLT | 2015 Dec 13 | 1800 | 2220 | 2160 | < 0.8 |
| 120224A | VLT | 2015 Dec 14 | 1800 | 2220 | 2160 | < 0.8 |
| 120612A | VLT | 2015 Dec 13 | 1800 | 2220 | 2160 | < 0.8 |
| 120612A | VLT | 2015 Dec 14 | 1800 | 2220 | 2160 | < 0.8 |
| 140331A | VLT | 2015 Dec 14 | 1788 | 2190 | 2664 | < 0.8 |
| 140331A | VLT | 2016 Jan 07 | 1788 | 2190 | 2664 | < 0.8 |
| 141212A | VLT | 2015 Dec 08 | 1788 | 2190 | 2664 | < 0.8 |
| 141212A | VLT | 2015 Dec 15 | 1788 | 2190 | 2664 | < 0.8 |
3.2 WHT Spectroscopy
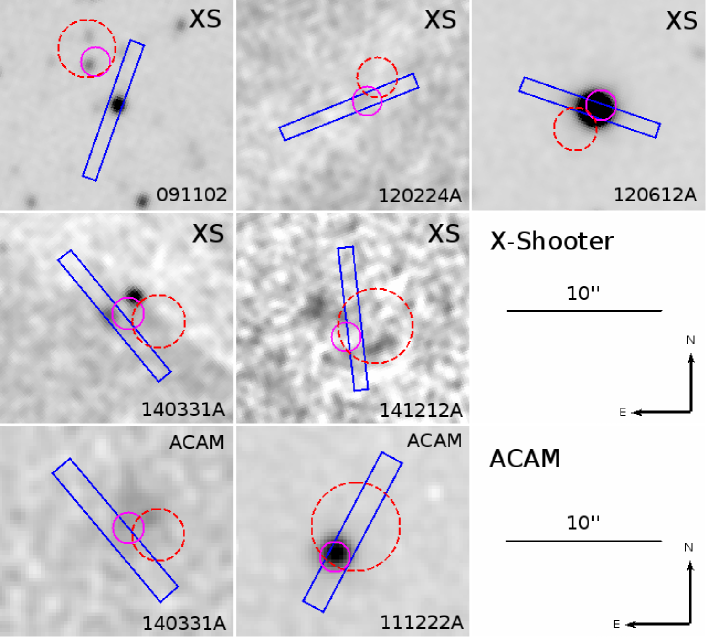
The candidate hosts of SGRB 111222A and LGRB 140331A were observed on 2015 January 19 and 20 respectively, using the V400 grism and a 1.5 arcsec slit on ACAM. The position of the slit with respect to the 90 per cent XRT error circle and WISE source are shown in figure 3, overlaid on r-band images. Given the poor seeing, slit losses were significant. The observations are listed in table 4. The LGRB 140331A candidate counterpart was not detected. The SGRB 111222A IR counterpart is identified as an M dwarf, as shown in figure 4.
3.3 VLT Spectroscopy
We observed five GRB host candidates using the echelle spectrograph on VLT/X-shooter (Vernet et al., 2011). Observations were associated with programme 096.D-0260(A) (PI: Stanway) and are detailed in table 4. Images in the r-band and the position of the slit with respect to the XRT and WISE positions are also shown in figure 3. The XS images are used primarily for visualising the slit placement. The 2 depths of the XS images corresponding to GRBs 091102, 120224A, 120612A, 140331A and 141212A are 23.5, 22.6, 24.1, 22.9 and 21.7 respectively. In each case, the slit placement was chosen to overlap with the WISE source.
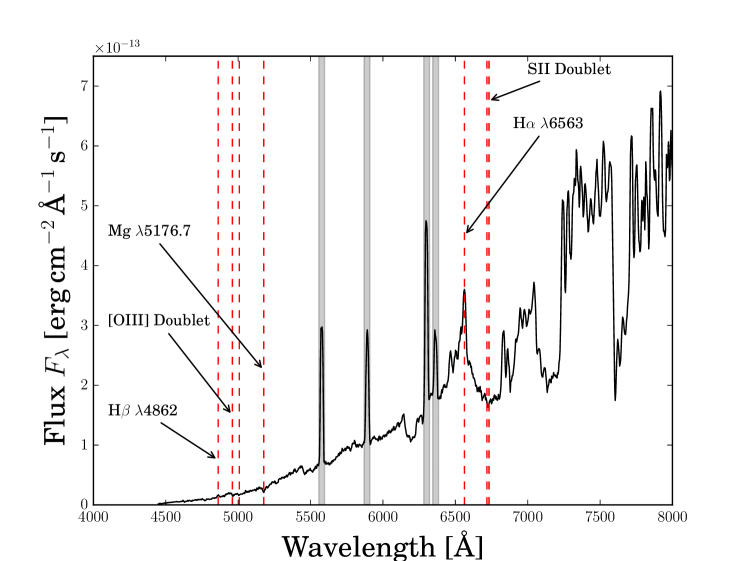
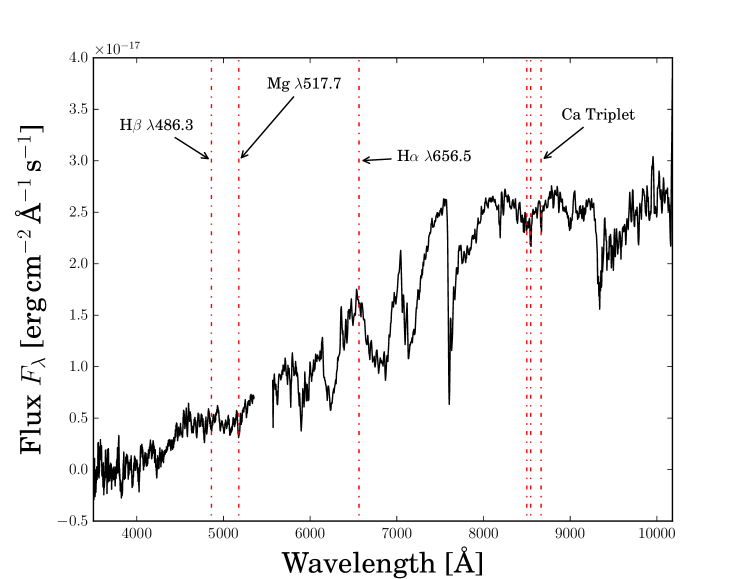
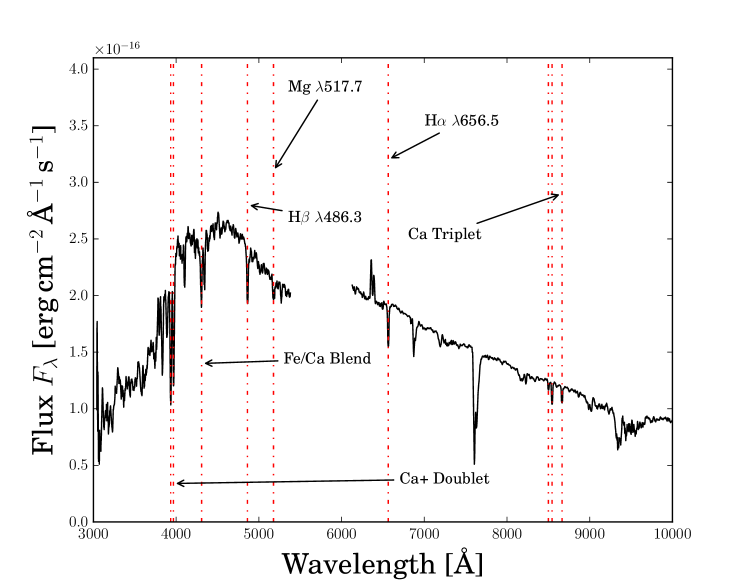
The spectra were reduced using the standard ESO pipeline in Gasgano. Of the five targets, two were marginally detected (LGRBs 120224A and 140331A), one was detected with prominent emission lines (SGRB 141212A), and two were found to be foreground stars (LGRBs 091102 and 120612A). The two stellar spectra are shown in figures 5 and 6 respectively. We note that service-mode observations of the counterpart of LGRB 091102 has been misaligned, likely due to the misidentification of a selected offset and alignment star. Thus the spectroscopic identification of this as a star is irrelevant to the GRB and is presented here to avoid confusion in future studies of archival data for these observations. This is the only case where we are required to attempt photometry on the XS imaging, measuring an r-band magnitude of the faint WISE aligned source of 21.4 (anchored to the APOP magnitude for the nearby bright star, Qi et al., 2015). However, it is not detected in the other bands available, and . Combined with GALEX and 2MASS non-detections, we deem there to be insufficient data for fitting the SED of this object. We classify it as having no coverage in table 1.
The spectra of the LGRB 120224A and 140331A targets are featureless, with only marginally detected continuum flux and no readily identifiable absorption or emission lines. LGRB 120224A’s candidate host has also been observed with X-shooter in a different programme, with similar results (Wiersema et al., 2012). If these are indeed the LGRB host galaxies, this requires them either to be mature stellar systems without nebular emission, or else heavily dust enshrouded. It should be noted that the WCS of the X-shooter images are misaligned with ALLWISE and the X-ray positions, leading to small offsets from their true positions. For example, the slit for LGRB 140331A has been deliberately placed over the fainter object south-east of the error circle, because the centroid of the IR flux aligns with it, suggesting that it corresponds to the source of the IR emission. While the other, brighter object might be the true host, it is likely not IR-bright, and would therefore be out of place in our sample.
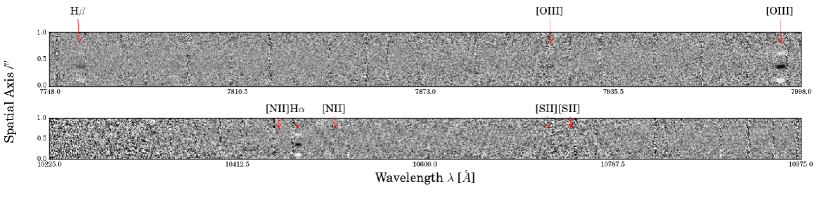
The potential host of SGRB 141212A has a weak continuum with H, H and O iii emission lines. The wavelength of these correspond to a redshift of 0.5960.001. This is in agreement with Chornock et al. (2014), who observed an object within the enhanced XRT error circle one day post burst with the Gemini-N spectrograph. They found that, out of two objects near the error circle, the likely host has a redshift =0.596. Portions of the 2D spectrum covering key emission lines are shown in figure 7. Emission line measurements are listed in table 5. Owing to the low signal-to-noise ratio, meaningful constraints on the H/H ratio are not possible. However, we note that the presence of these lines is in qualitative agreement with the star-forming best-fitting SED as discussed later in section 6.
| Line | Flux | |
|---|---|---|
| [Å] | [ ergs cm-2 s-1] | |
| H | 77594 | 0.530.47 |
| OIII | 79913 | 1.80.8 |
| H | 104745 | 2.00.9 |
| GRB | z | Beam FWHM | Image RMS | 3 SFR Limit |
|---|---|---|---|---|
| [arcsec] | [Jy] | [M⊙yr-1] | ||
| 050219A | 0.212 | 9.71.5 | 10.5 | 10 |
| 050318 | 1.44 | 5.21.9 | 10.2 | 990 |
| 070429B | 0.902 | 8.91.9 | 9.6 | 290 |
| 070724A | 0.457 | 131.8 | 10.7 | 62 |
| 071117 | 1.33 | 6.41.5 | 12.9 | 1020 |
| 080623 | – | 5.51.8 | 13.3 | - |
| 080702B | 2.09 | 511.6 | 17.2 | 4100 |
| 091102 | – | 4.01.8 | 10.3 | - |
| 110206A | – | 3.42.1 | 11.5 | - |
| 110918A | 0.984 | 121.9 | 12.9 | 480 |
| 120119A | 1.73 | 341.8 | 10.0 | 1500 |
| 120224A | – | 171.8 | 9.0 | - |
| 120612A | – | 181.7 | 11.1 | - |
| 120819A | – | 421.7 | 10.8 | - |
3.4 ATCA Radio Observations
Radio observations of 14 candidate hosts were made at central frequencies of 5.5 GHz and 9.0 GHz and a bandwidth of 2 GHz per frequency, with the Australia Telescope Compact Array (ATCA). Science targets and secondary phase calibrators were observed during programme C3002 (PI: Stanway). Observations were taken on 2015 January 31 and 2015 February 1 and 2. The array was in its most extended, 6A, configuration with a maximum baseline of 6km and six antennae in use. Short observations were taken across a range of hour angles to secure reasonable -plane coverage. The data were reduced with the standard data reduction software Miriad. Absolute flux calibration was performed using observations of PKS 1934-638.
None of the targets were detected. The observations are listed in table 6. We also list the synthesized beam size, which varied significantly from source to source given their wide range of declinations, and the final image RMS noise level. Where a redshift for the source is known, we use the 1.4 GHz flux to star formation rate (SFR) calibration of Kennicutt & Evans (2012) to estimate a 3 upper limit on the star formation rate (assuming a radio spectral slope of -1).
4 Archival and Survey Data
Additional information for the candidate GRB host counterparts was gathered from archival surveys and the literature. The main source of optical photometry is the Pan-STARRS survey (DR1, Chambers et al., 2016), which covers the whole sky north of -30° declination down to 3 depths of 23.3,23.2,23.1,22.3,21.3. Cross-matching between the Pan-STARRS 1 science archive and the 55 WISE counterparts was performed with a 2.5 arcsec matching radius, producing 27 matches. Of these, a small subset have more than one possible optical counterpart, and these are carefully considered in section 6.1. The candidate hosts for SGRB 141212A are visible in Pan-STARRS but below the cataloging threshold, so we measure the magnitudes from image cutouts, complementing our WHT photometry presented in section 3.1. The Sloan Digital Sky Survey (SDSS, Alam et al., 2015, we use DR12), VST/ATLAS (Shanks et al., 2015) and APASS (Henden & Munari, 2014) were also searched by matching to within 2.5 arcsec of the WISE source. All of these surveys extend south of -30° declination. Two GRB locations have matches in VST/ATLAS, SGRBs 070724A and 150101B, which are also covered by Pan-STARRS, and only one in APASS (LGRB 140927A). There are 12 matches in SDSS, which provides the only optical photometry for LGRB 161108A. In the remaining 11 matched cases, Pan-STARRS data also exists, and we use the best available combination of photometry. At the very least, band limits are used from the SDSS matches. Overall, we have a total of 29 optical survey detections.
The remaining 26 positions may fail to obtain a match because the source lies outside the Pan-STARRS survey region (14 objects), or because the galaxy is optically faint (12 instances). Where a GRB falls in a field covered by one of the surveys used, but no object is detected at that position, 2 upper limits are used. Four host candidates lacking coverage have been studied in the literature (GRBs 050219A, 070429B, 100316D and 130515A), so 10 are classified ’NC’ (no coverage) in table 1.
A total of 6 of the 12 optically undetected sources have been well studied in the literature. In these cases we use the results of those works. The total number of WISE sources for which we have survey coverage but are lacking information on an optical counterpart, is therefore 6. The 12 undetected sources are discussed further in sections 5 and 7.
The GALEX All Sky Imaging Survey (AIS, Martin & GALEX Science Team, 2005) provides UV photometry or limits for all of our objects at near-constant depth (Martin et al., 2003). GALEX has two photometric bands, the Far and Near UV (FUV and NUV), with effective wavelengths of 1528Å and 2271Å respectively. Ten of the sample have a NUV source within 5.3 arcsec, the NUV PSF FWHM. Expanding the search radius to 10 arcsec yields only one more match (at 9 arcsec), suggesting that those matches identified are genuine. Of these, four (LGRB 080405, LGRB 080517, LGRB 100316D and SGRB 150101B) also have a FUV detection. Where we have no detection, we use the AIS mean 2 upper limits, mFUV = 20.89 and mNUV = 21.79.
The 2 Micron All Sky Survey (2MASS) was used to provide NIR data or limits for our sample (Skrutskie et al., 2006). A catalogued 2MASS source was identified for 14 of the 55 WISE matches. Image cutouts for all the GRB positions were also inspected, and we measure 2 upper limits for the remainder of the sample. We search the FIRST (Becker et al., 1994) and NRAO VLA Sky Survey (NVSS, Condon et al., 1998) radio surveys, cross-matching to the WISE coordinates, and find only one match. The host of SGRB 150101B is detected in NVSS at 1.4 GHz. The full table of FUV to W4 photometry derived from this compilation of observations and archival data is given in table 10 of the appendix.
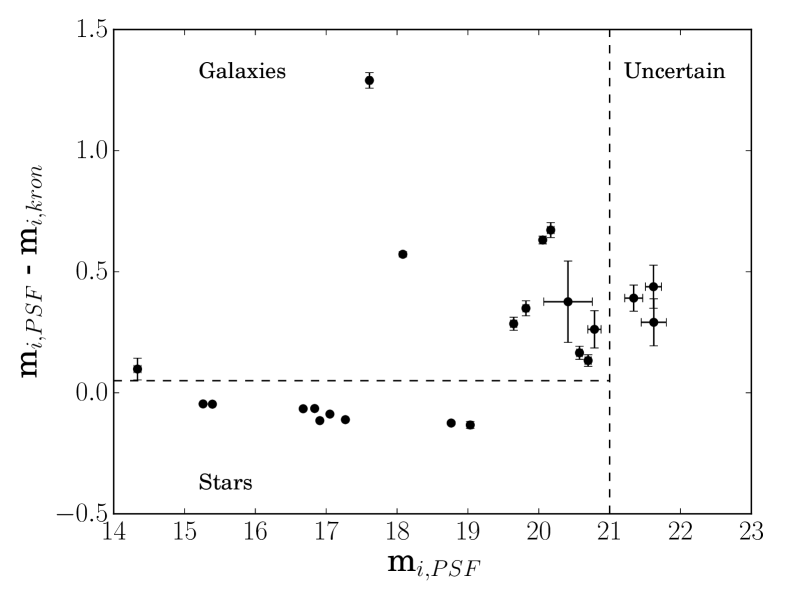
Initial checks were performed with the available data to discern the physical nature of the sources. The first method employed uses the difference between PSF and Kron magnitudes (Farrow et al., 2014, and references therein), which is a recommended technique for star-galaxy separation in Pan-STARRS. Because the Kron radii vary with the light distribution of the object in question, and the PSF does not, extended sources such as galaxies (or saturated stars) show discrepancies between the two magnitudes. A plot showing star-galaxy separation in our sample using this method is given in figure 9. Beyond an i-band apparent magnitude of 21, the separation becomes unreliable. Additionally, PSF-Kron positions towards the lower right of the galaxy region might be contaminants, and we do not use positioning in this region as grounds for galaxy classification. For all sources, a visual check for extension was also made. It should be noted that while the PSF-Kron method can confirm an object as a galaxy, it cannot definitively classify stars. In particular, compact, dwarf or distant galaxies may be unresolved at Pan-STARRS resolution and appear ’starlike’ by this classifier. Where the only information we have is an insecure galaxy or star classification using PSF-Kron, and the object is not obviously extended by eye, we use SED fitting to distinguish the possibilities (see section 6).
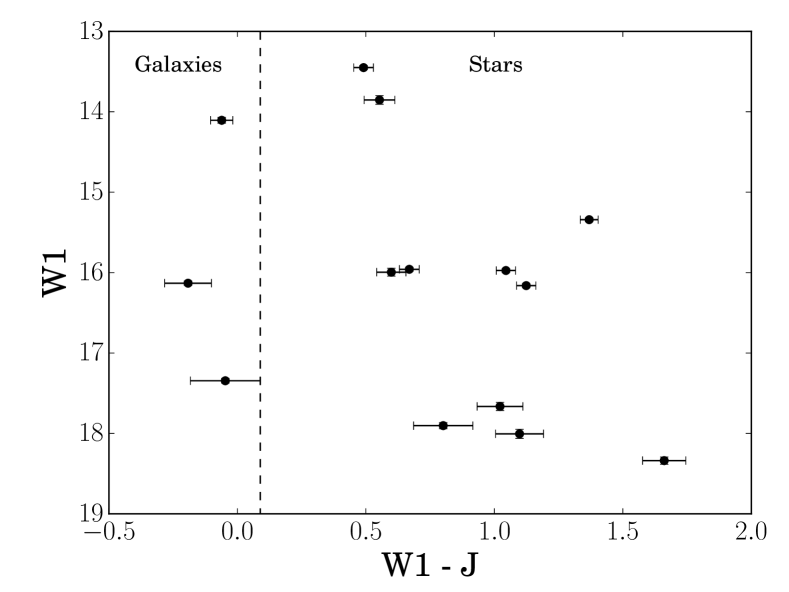
An alternative method, proposed by Kovács & Szapudi (2015), separates stars and galaxies with the aid of the J-band. This is demonstrated in figure 9. At fixed W1 magnitude, objects that are bluer in W1-J are more likely to be galaxies. Kovács & Szapudi (2015) found that a cut at W1-J = 0.09 (AB magnitudes) is an effective star-galaxy separator, with a stellar contamination on the galaxy side of only 1.8 per cent. However, we caution that this technique was applied to brighter sources than we are dealing with, with the galaxies lying at a median redshift of 0.14, much lower than our in our sample. Because it is unknown how the W1-J colours vary for lower mass, star forming galaxies across a range of redshift, the use of the cut here is a suggestive, but not decisive, diagnostic.
We also check for proper motion in WISE classifying those with notable proper motion (we require a total proper motion of at least 2 significance) as stars. The HSOY catalogue (Altmann et al., 2017) is also searched. This is a precursor to the full Gaia DR2. We identify several optical sources, all within 1 arcsec of their respective WISE match, which have proper motions allowing us to rule them out as stars. A small number of sources have notable PM in HSOY but not WISEṪhese might be chance alignments between a foreground star and a background IR source. However, due to large uncertainties on the WISE proper motions, we are unable to tell. Where this scenario arises, we assume that the optical counterparts are associated with the IR sources, given that this is most likely. Table 7 gives the results for those sources that have data available for at least one of the star-galaxy checks discussed.
| GRB | PM WISE | PM HSOY | PSF-Kron | W1-J | Type |
| 050522 | - | S | S | S | S |
| 050716 | S | - | S | - | S |
| 050721 | - | S | S | S | S |
| 050724 | - | - | G | - | G |
| 060428B | - | - | G | - | G |
| 061002 | - | - | U | - | U |
| 070208 | - | - | G | - | G |
| 070724A | - | - | G | - | G |
| 080405 | - | S | G | - | S |
| 080517 | - | - | G | G | G |
| 090904B | S | S | S | G | S |
| 100206A | - | - | U | - | U |
| 110305A | - | - | S | S | S |
| 111222A | - | S | S | S | S |
| 120119A | - | - | G | - | G |
| 120612A | - | - | S | S | S |
| 130603B | - | - | G | - | G |
| 131018B | - | - | S | S | S |
| 140927A | - | - | - | S | S |
| 150101B | - | - | G | G | G |
| 150120A | - | - | U | - | U |
| 160703A | - | S | S | - | S |
| 161010A | S | - | G | S | S |
| 161214B | - | S | S | - | S |
| 070309 | - | - | - | S | S |
| 080623 | S | S | - | S | S |
| 150626A | - | S | - | S | S |
| 161001A | - | S | - | - | S |
| 161104A | S | - | - | - | S |
G - galaxy. S - star. U - uncertain.
5 Previously Reported GRB Hosts and Observations
Many of the GRBs in our sample of 55 have previously been studied, yielding useful information for our analysis. In this section, we compile reported afterglow positions, detailed host studies and other noteworthy information. This allows us to rule out some IR sources as chance alignments, and add some hosts to our sample for which we lacked the required observations. We split these into 3 categories: matched IR sources with an optical detection, those without, and those lying outside the optical surveys searched in this paper.
5.1 Optical Survey Detections
LGRB 060428B: The candidate host represents a single IR source corresponding to what appears to be a single optical source. However, Perley et al. (2007) has suggested that a compact blue galaxy lies underneath the foreground elliptical’s light, at an offset of 2.6 arcsec. This corresponds to the foreground object’s Einstein radius, as such they claim that LGRB 060428B is likely a gravitationally lensed event originating from the higher redshift, bluer galaxy. While this work has not been fully published, it seems a plausible explanation. We therefore take a conservative approach and exclude this source from later analysis.
LGRB 160703A: Zheng et al. (2016) observed the afterglow with Keck-I in the g and r bands. The improved positional certainty over XRT suggests that the IR source is not the host. The object has proper motion (see table 7), confirming this interpretation. Therefore we remove the source from further analysis.
LGRB 161214A: The object associated with the matched WISE source was observed by Malesani et al. (2016), who obtained spectroscopy identifying it as a K or M star.
There are cases where an improved burst localisation (e.g. in the optical) strengthens the IR source association, rather than ruling it out. There are also hosts where we have sufficient photometry for SED fitting, in addition to previously reported host parameters. We use this information to compare to our SED fitting results. These studies and observations are referenced for each burst in table 8 of section 6.
5.2 Optical Survey Non-Detections
LGRB 050716: No object is detected in optical imaging. Rol et al. (2007) deduced a burst redshift based on the optical to X-ray afterglow SED, however the matched WISE source has proper motion - assuming that the flux is entirely from this star, we reject this association as a chance alignment.
LGRBs 070208 and 120119A: Blanchard et al. (2016) report HST imaging of the burst locations in these cases, with the optical afterglow positions indicating that these may be chance alignments with the IR-bright sources. This is backed up by our analysis in section 6.
LGRB 080207: We successfully identify this host, which has been extensively studied in the literature (Hunt et al., 2011; Svensson et al., 2012a; Hjorth et al., 2012; Krühler et al., 2012b; Arabsalmani et al., 2017) as an example of a red, dusty luminous infrared galaxy. There is a 1 arcsec separation between the WISE centroid and the Chandra position provided by Svensson et al. (2012a), which itself is clearly placed over the galaxy in question. Therefore, we include the reported parameters for this galaxy in our analysis. The optical faintness of this galaxy shows that such sources can have steep optical to IR spectral slopes, and demonstrates that other optical non-detections could be similar in nature.
LGRB 080307: This burst has an X-ray detected AGN a few arcseconds away (Page et al., 2009). Both the WISE IR emission and X-ray flux have levels consistent with expectations for local AGN (Eckart et al., 2010). Therefore, we suggest that the AGN is the most likely source of the IR flux. While it is possible that the AGN resides in the host galaxy (as is the case with SGRB 150101B, see Fong et al. (2016)), we use MAGPHYS for our SED fitting in the next section, which does not have a prescription for AGN. Because the IR flux is consistent with being AGN dominated, this would lead to incorrect parameters when the SED is fitted by MAGPHYS. Therefore, we take a cautious approach and remove LGRB 080307 from further analysis.
LGRB 080605: In the imaging provided by Krühler et al. (2012a) and Blanchard et al. (2016), we can see that the WISE flux centroid is centered on a = 1.64 galaxy undetected in Pan-STARRS, rather than either of the two bright sources. The burst redshift of = 1.64 was determined from afterglow spectroscopy. Because this galaxy is therefore confirmed as the host, we reject the nearby bright objects and reclassify this host as a Pan-STARRS non-detection. Krühler et al. (2012a) provide estimated parameters for the host galaxy, which we employ.
GRBs 100816A and 110918A: For these sources we use the physical parameters reported by Pérez-Ramírez et al. (2013) and Elliott et al. (2013) respectively. In both cases, the IR bright source is aligned with the reported host galaxy.
GRB 120224A: This object is only marginally detected in our X-shooter spectroscopy, however Selsing et al. (2018) found a 2 emission line in similar X-shooter data. If the line is H, this corresponds to a redshift of 1.1. We tentatively assume this to be the case going forward, treating the source as an optically undetected galaxy at = 1.1.
LGRBs 130527A, 150323C and 161007A: The positions of these bursts were observed in the optical. In each case, an extended object was seen, allowing galaxy classifications (Cano et al., 2013; Malesani et al., 2015; Heintz et al., 2016). There is insufficient photometry for SED fitting, so we continue to treat these as non-detections, but note the IR flux likely originates from faint galaxies (rather than stellar contaminants).
LGRB 130528A: While undetected in Pan-STARRS, this source is revealed to be in a crowded region in deeper imaging, with multiple objects in a 10 arcsec region (Jeong et al., 2014). Because we cannot assign the IR flux to a single object with any certainty, we classify this burst as a potential chance alignment and do not consider it any further.
5.3 Lacking Coverage
GRBs 050219A, 070429B, 100316D: We use the host galaxy physical parameters reported by Rossi et al. (2014), Cenko et al. (2008) and Starling et al. (2011) respectively. In these cases, we compare the reported host coordinates to the WISE positions. For all three, the IR flux is aligned with the galaxies identified as a potential hosts. Because these are good quality IR sources which satisfy our FAP cut, we include the reported host parameters in our analysis.
LGRB 130515A: Levan & Tanvir (2013) observed the brightest source in the X-ray error circle with VLT/FORS2, finding it to be an M star. The position of the star is consistent with the WISE source, so we discount this association.
6 SED Fitting
6.1 Multiple Candidate Hosts
In our sample, there are cases where multiple optical sources lie inside the search radius used to match optical imaging to WISE. Visual inspection reveals 3 GRBs (141212A, 140331A and 150120A) where the candidate host IR flux is not uniquely associated with a single optical source. In these cases, the optical and IR images were aligned to check for astrometric offsets.
For LGRB 140331A, the IR emission originates from the fainter of two optical sources within the XRT error circle. Inspection of Chandra X-ray imaging with sub-arcsecond afterglow localisation suggests that the burst may not, in fact, be associated with either optical galaxy, but we cannot rule this out (Chrimes et al., in prep). The optical source aligned with the IR flux matched to LGRB 140331A does not reach the threshold for cataloging in Pan-STARRS. Instead, and in addition to the WHT photometry (see section 3.1), we measure magnitudes from Pan-STARRS cutouts. It is this photometry which appears in the appendix, and is used for SED fitting.
In the case of SGRB 141212A, the IR source centroid lies closest to the host identified by Malesani et al. (2014), although there may be some blending with neighbouring objects. We download and perform aperture photometry on the Pan-STARRS images in addition to the WHT images previously discussed. The photometry from both is in good agreement, and the Pan-STARRS measurements are again given in the appendix.
The IR source associated with SGRB 150120A may have either of two optical counterparts, both catalogued in Pan-STARRS DR1. We fit their SEDs separately, in each case assuming that the entire IR flux is associated with the galaxy under consideration. The better of the two fits us used in the subsequent analysis.
6.2 Galaxy SED fitting with MAGPHYS
Spectral Energy Distribution (SED) fitting on this sample was performed by minimisation using templates derived from MAGPHYS and its high redshift update (da Cunha et al., 2008, 2015). MAGPHYS was chosen for fitting our sample due to its careful implementation of dust extinction and re-emission. Given that our sources are detected in the infrared, we expect dust to be an important influence on their spectra. The population synthesis models of Bruzual & Charlot (2003) are employed, with the dust absorption and re-emission model of Charlot & Fall (2000). The stellar populations are built up by assuming a range of ages distributed evenly from 0.1 Gyr to the maximum age permitted at a given redshift (i.e. the age of the Universe). The star formation rate is modelled as declining proportional to e-γt, where is the star formation timescale and is the time elapsed since the onset of star formation. Random constant SFR bursts are overlaid, with durations evenly distribution between 3107 yr and 3108 yr. The probability of a burst is such that 50 per cent of the model galaxies have experienced a starburst phase in the last 2 Gyr. The amplitude of these bursts is defined as the ratio of stellar mass formed in the burst and all stellar mass assembled since the galaxy was formed at time tform; this parameter is distributed logarithmically from 0.03 to 4.00.
Many of the candidates already have confirmed or likely redshifts, either from afterglow absorption lines or from the host. These were used to fix the redshift where possible. We also derive a photometric redshift for each galaxy. At each step in a grid of trial redshifts, we make use of the internal Bayesian fitting code built into MAGPHYS to determine the redshift interval for which (Avni, 1976). We did this at redshift intervals of 0.05 over the range 0 z 1, or up to = 3 if no acceptable solution is found at lower redshifts. The distribution of over redshift is then minimized. In this way, MAGPHYS is effectively used a photometric redshift code (da Cunha et al., 2015), with the redshift treated as an additional free parameter. Our photometric redshifts are generally in agreement with spectroscopic redshifts where available, as shown in table 8. Uncertainties on SED fitting parameters include the effect of photometric redshift uncertainty where a spectroscopic (or SDSS) redshift is not used.
MAGPHYS fits for stellar mass, current star formation rate, star formation history (age, timescale and burst amplitude), metallicity, and dust extinction, amongst other parameters. We caution that the number of free parameters is greater than the number of data points available for a given galaxy and that the fits may be overconstrained. MAGPHYS does not routinely report uncertainties on metallicity, as this is often a poorly constrained parameter, so we simply state the best-fitting metallicity given by MAGPHYS.
6.3 Galaxy SED fitting Summary
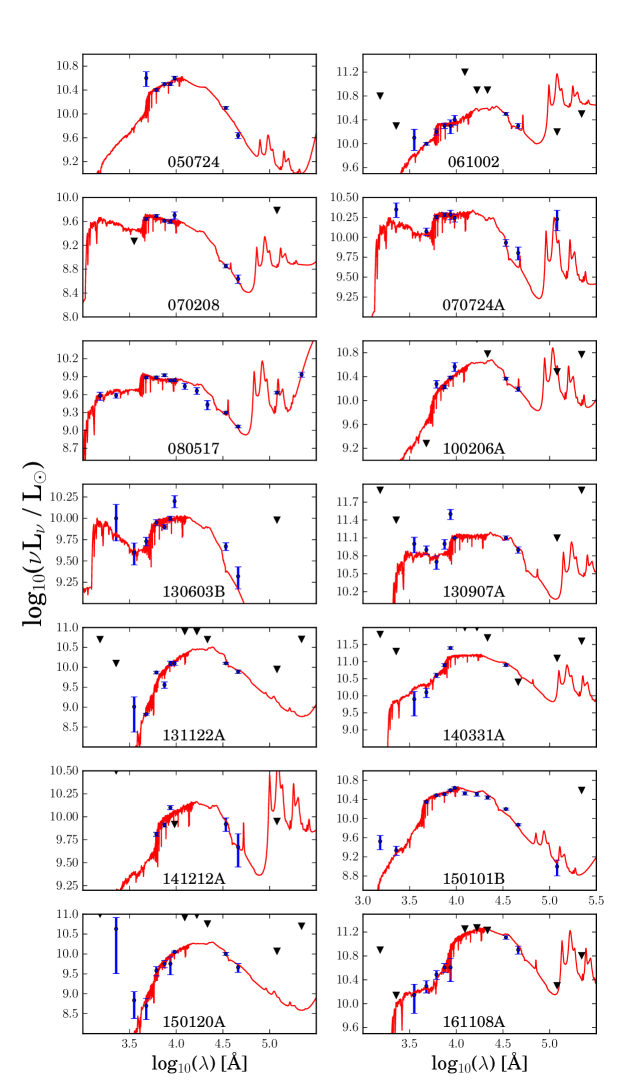
Of the 55 GRBs with candidate WISE counterparts, 29 have optical-NIR photometry (from Pan-STARRS, SDSS, APASS, 2MASS, WHT observations or some combination of the above) in addition to at least WISE band 1. We correct this observed photometry for the Galactic extinction of Schlafly & Finkbeiner (2011) and a Fitzpatrick reddening law with RV = 3.1, using the IRSA dust reddening and extinction service444http://irsa.ipac.caltech.edu/applications/DUST/ and the York Extinction Solver (YES, McCall, 2004). We fit 28 SEDs (excluding LGRB 060429B, as this has been rejected as probable chance alignment). For the host of SGRB 050120A, we fit the two optical components separately, assigning the entire WISE flux each time. 14 of the 28 objects are best-fitting, or otherwise confirmed, as galaxies. Objects identified as galaxies or stars solely through the quality of fitting to stellar or galaxy templates are classified as photometric galaxies or stars (’PG’ or ’Ps’) in table 1. The limited number of stellar templates available makes it difficult to decide whether an object is best-fitting as a star or galaxy based on the reduced alone. Therefore, we note the reduced values for galaxy fitting, but make the assumption that a visually good star fit indicates that the object is a star, when the corresponding galaxy value is poor.
The data for the objects best-fitting as galaxies, together with the best-fitting galaxy templates, are shown in figure 10 and table 8. There are some instances where the FUV/NUV flux appears inconsistent with the SED. This might be because we have matched to a different object - the matching to WISE is independent for the UV, optical and NIR. However, this unlikely as we would expect a nearby UV source to also be seen in the optical. They might be UV upturns, a phenomena seen in otherwise red elliptical galaxies, or the fitting may simply be failing to properly account for complex stellar populations.
Some fits produced no clear minimum in , and therefore lack a robust photometric redshift. In these cases, we use a spectroscopic or SDSS photometric redshift where available. For LRGB 061002, we obtain a photometric redshift of 0.10. However, the SDSS photometric redshift, which is calculated using machine learning techniques, is much more precise at = 0.564. Therefore we fix our redshift to the SDSS value, which has sufficiently small uncertainties that the fit parameters are unaffected by variation with this redshift range. Similarly, the photometric redshift for LGRB 131122A is unconstrained, likely because there is no clear Balmer or Lyman break evident from the photometric points. However, this object also has an SDSS photometric redshift, at = 0.399. This produces a visually acceptable fit, so we employ this redshift.
Another object, the candidate host of LGRB 070208, is correctly identified as a galaxy in our analysis but our photometric redshift of = 0.16 is inconsistent with a previous spectroscopic redshift of = 1.165 (Cucchiara et al., 2007). The foreground object is not detected in the spectroscopy reported by Cucchiara et al. (2007), but there is a marginally detected object seen offset from the foreground galaxy, nearer to the afterglow centroid. The HST imaging of Blanchard et al. (2016) confirms this interpretation. Given this information, we do not include LGRB 070208 in the discussion of our sample properties.
6.4 Stellar Fitting
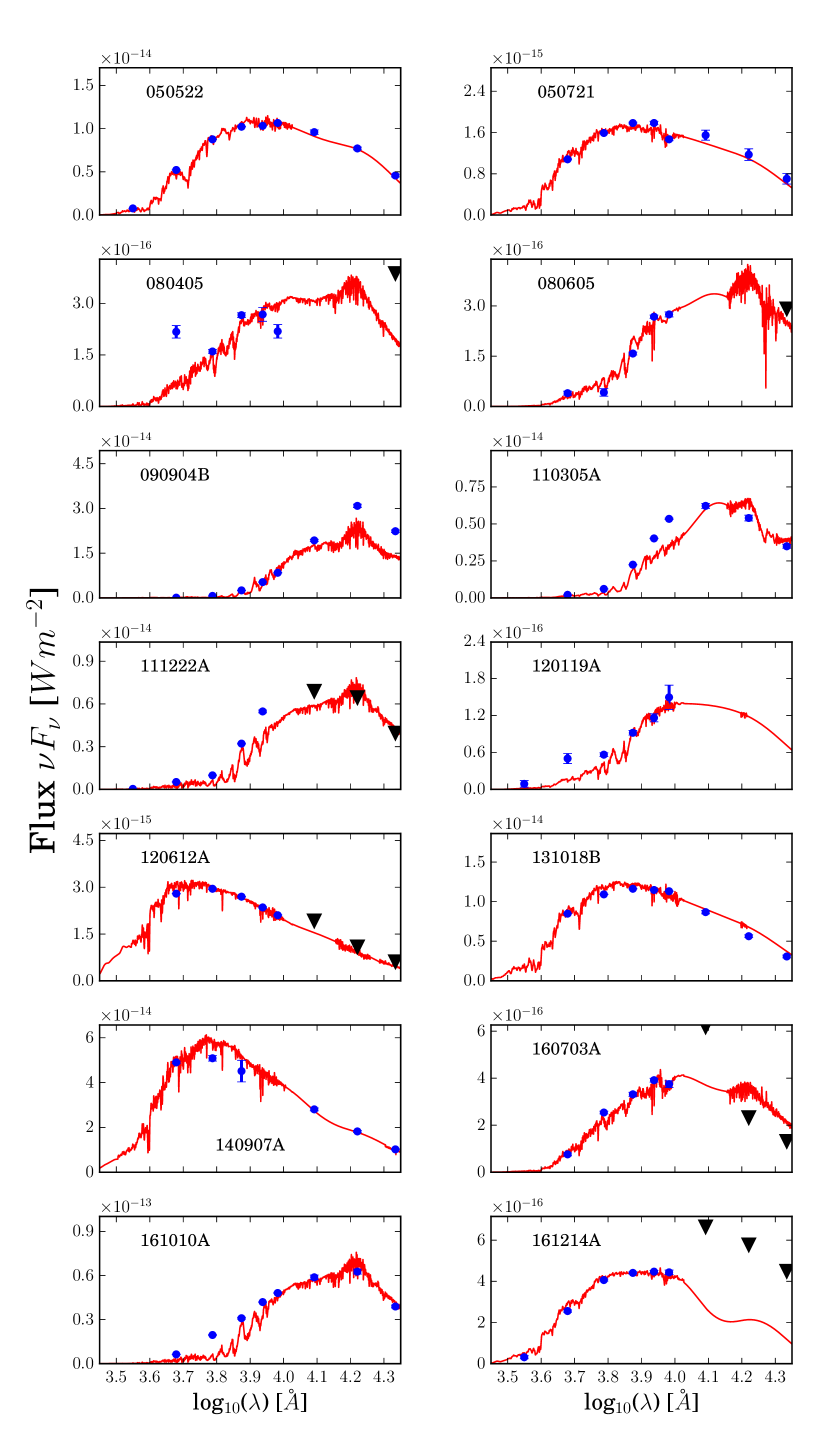
We also perform fitting to a library of 131 stellar spectra (Pickles, 1998), with the expectation that a significant fraction of our objects will be best-fitting as stars. The spectra span the range 1150-25000Å, allowing fitting from the FUV to K bands. In most of the 14 cases where MAGPHYS does not provide a good fit, stellar fitting does. The best-fitting stellar templates for these sources are shown in figure 11. Here, we show the SEDs for those objects with proper motion or other star diagnostics, in addition to sources where a stellar SED is a better fit than a galaxy SED. We note that the sources which fit best to stellar templates include all objects for which a spectroscopic or proper motion confirmation as a star is available.
7 Results and Discussion
7.1 SED Fitting Results
In table 8 we present the results of our SED fitting for the 13 candidate or confirmed GRB hosts that match best to galaxy templates (the 14 shown in figure 10, excluding the likely interloper LGRB 070208), and also a compilation of information from the literature for seven of the GRB hosts discussed in section 5.
In comparing the SED fit results to independent measures of the host properties, potential discrepancies arises between them. The SED derived SFR, 0.15 M⊙yr-1, for the host of SGRB 150101B disagrees with the NVSS 1.4 GHz radio SFR, 300 M⊙yr-1 and the detection of this source at 5.8m in the W3 band. This is due to the presence of an AGN (Fong et al., 2016). Unlike LGRB 080307 which was rejected due to coincidence with a nearby AGN, the association of SGRB 150101B with this galaxy has been secured with spectroscopic observations. Therefore, we keep it in the analysis. Only two other sources in our sample are detected in the W3 band. While this is sometimes used as a SFR indicator or AGN discriminator, the two cannot be unambiguously differentiated without a reliable (and low) redshift (Davies et al., 2017). We do not consider this data any further at this point.
| GRB | zphot | zspec | SFR (M⊙yr-1) | M⋆ (1010M⊙) | sSFR (10-10yr-1) | AV | Z/Z⊙ | /dof | Ref. |
| 050724 | 0.258 | 2.450.13 | 0.038 | 1.81 | [1], [2] | ||||
| 061002 | 0.564 | - | 1.60.6 | 1.46 | 1.90 | [3] | |||
| 070724A | 0.500.23 | 0.457 | 1.093 | 0.85 | [4], [5] | ||||
| 080517 | 0.089 | 3.30.1 | 1 | 2.51 | [6], [7] | ||||
| 100206A | - | 0.4068 | 1.15 | 1.34 | [8] | ||||
| 130603B | 0.356 | 0.038 | 2.78 | [9], [10] | |||||
| 130907A | 1.238 | 1.450.8 | 7164 | 1.9 | 1.9 | 2.54 | [11], [12] | ||
| 131122A | 0.399 | - | 2.20.1 | 0.038 | 1.25 | - | |||
| 140331A | - | 6.49 | [13] | ||||||
| 141212A | – | 0.596 | 0.650.4 | 2.20.13 | 1 | 2.42 | [14] | ||
| 150101B | 0.134 | 0.150.03 | 0.0230.005 | 3.6 | 0.4 | 2.59 | [15] | ||
| 150120A | 0.46 | 1.70.3 | 0.89 | 0.90 | [16] | ||||
| 161108A | <1.3 | 1.159 | 0.250.11 | 1.6 | 1.81 | [17] | |||
| 050219A | - | 0.2115 | 0.06 | 1 | 0.06 | <0.1 | - | - | [18] |
| 070429B | - | 0.9 | 1.1 | 440 | 0.0025 | - | - | - | [19] |
| 080207 | - | 2.086 | 119 | 328 | 4 | 1.9 | 1 | - | [20],[21],[22],[23] |
| 080605 | - | 1.64 | 0.60.2 | - | [24] | ||||
| 100316D | - | 0.0591 | 1.200.08 | 0.0895 | 13 | 0.86 | 0.3 | - | [25],[26] |
| 100816A | - | 0.804 | - | - | - | 0.2 | - | - | [27] |
| 110918A | - | 0.984 | 40 | 10.680.16 | 3.7 | 0.100.16 | - | - | [28], [29] |
These objects are short bursts. This object has extended emission but is likely a disguised short burst. Uses an SDSS photometric redshift.
References: [1] Prochaska et al. (2005), [2] Berger
et al. (2005), [3] Alam et al. (2015), [4] Kocevski
et al. (2010), [5] Berger et al. (2009), [6] Stanway
et al. (2015a), [7] Stanway et al. (2015b), [8] Perley
et al. (2012), [9] de Ugarte
Postigo et al. (2014), [10] Frederiks (2013), [11] de Ugarte Postigo
et al. (2013), [12] Golenetskii
et al. (2013), [13] Littlejohns
et al. (2014), [14] Chornock
et al. (2014), [15] Fong et al. (2016), [16] Chornock &
Fong (2015), [17] de Ugarte
Postigo et al. (2016), [18] Rossi et al. (2014), [19] Cenko et al. (2008), [20] Arabsalmani
et al. (2017), [21] Hunt
et al. (2011), [22] Svensson
et al. (2012b), [23] Svensson
et al. (2012a), [24] Krühler
et al. (2012a), [25] Starling
et al. (2011), [26] Michałowski
et al. (2015), [27] Pérez-Ramírez et al. (2013), [28] Elliott
et al. (2013), [29] Frederiks &
Pal’Shin (2011)
7.2 Short GRBs
Before considering the redshift distribution and other properties of this sample, it is important to consider the selection effects that will shape any comparison we make. The first issue to consider is whether we may be particularly biased towards long or short bursts. Since their progenitor mechanisms differ, we expect their host properties to also differ. As such it is essential to consider the short vs long divide. Of the 55 GRB locations identified as having a WISE counterpart, 11 of the associated bursts had an observed s. Of these, 8 are reported in table 8 as galaxies. Two are identified as a Galactic stars.
The lack of a clear divide between the two populations can lead to ambiguity (e.g. Berger, 2014, and references therein). Two of our targets have a s and might be classified as short by some proposed criteria. Of these, one is identified in our galaxy sample, while one has insufficient photometry. In the following, we treat these "intermediate" sources as long bursts.
If we consider the 20 GRBs for which galaxy properties are assembled in table 8, the fraction of SGRBs is 40 per cent (8/20) and would be as high as 50 per cent if the intermediate bursts were included. This compares to the short burst fraction in the entire GRB catalog of only 6 per cent (Berger, 2014), suggesting that we may be preferentially selecting short bursts. This may reflect the difference in the underlying redshift distribution of these sources, exemplified by the mean redshift of = 0.45 for the SGRBs in our sample. Short GRBs are typically of lower isotropic-equivalent luminosity and their distribution is biased towards low redshifts () relative to long GRBs (), due to the differences in both their progenitors and detection probabilities (Berger, 2014). Given the relatively shallow depth of the W1 band imaging, we might expect a low redshift, and therefore SGRB, excess in our sample.
7.3 Redshift Distribution
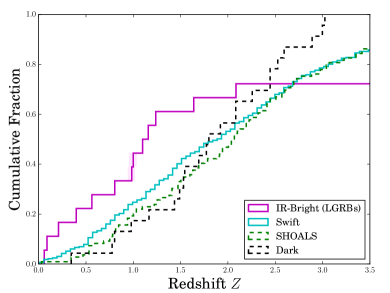
We now consider the detailed properties of the IR-bright LGRB host population. Figure 12 shows the cumulative redshift distribution for the 13 candidate host galaxies that form our IR-bright LGRB host population (the 12 in table 8 plus LGRB 120224A at = 1.1). We compared these to the SHOALS sample of LGRB hosts (Perley et al., 2016a, b), all Swift LGRBs with a known redshift, and a sample of dark LGRB hosts (Perley et al., 2013). In each case we indicate uncertainty on the cumulative distribution by performing an analysis in which each value is permitted to vary by addition of its associated random error, drawn from a skewed Gaussian distribution, in order to account for asymmetric errorbars. The scale and alpha parameters are chosen in each case such that the asymmetric distributions are reproduced. We show the standard deviation of 1000 realisations of the perturbed cumulative distribution as a shaded region.
In our sample, 7 objects have survey coverage but are undetected, and lack extensive study in the literature. It is possible that some of these may be M, L or T dwarfs, which can be a few magnitudes brighter in the WISE bands than the optical (e.g., Best et al., 2013). Indeed, the optically undetected object associated with LGRB 050716 has significant WISE proper motion. Late L and T dwarfs have the reddest colours of these stars and would be most able to satisfy the criteria of W1 detection and optically non-detection, however these are also the rarest classes of these objects.
Alternatively, the optical non-detections could be intrinsically faint or higher redshift galaxies. This possibility has been demonstrated by several such examples in section 5. Three of the optically undetected sources have been identified as extended sources in deeper imaging, as described in section 5. One of the non-detections, LGRB 120224A, may be at = 1.1 (Selsing et al., 2018). We can see in figure 12 that our sample is biased towards low redshifts when we do not included the non-detections. Therefore, the most extreme scenario is that all 5 of the remaining non-detections are in fact galaxies at higher redshift than the highest confirmed LGRB in our sample. Setting these 5 non-detections to an arbitrarily high redshift, we are still unable to match the slower rise of the SHOALS and dark samples, demonstrating that there is a low bias even in the ’worst case’ scenario. In reality, their redshifts could well be lower, given that the optical undetected hosts of LGRBs 080605, 100816A, 110918A and 120224A all lie at < 2.
We must also consider the possibility that chance alignments remain in our sample. LGRB 140331A is at high risk in this regard, since the XRT error circle position favours a different optical source, unaligned with the WISE flux. In general, foreground chance alignments preferentially select lower redshift or foreground objects, and this remains a possible explanation for the difference in cumulative distribution between our sample and others. However, all but three of these sources have spectroscopic redshifts, and it is unlikely that a spectroscopic redshift measurement would be unaffected by a foreground interloper. We do, however, note that chance alignment is the most likely scenario for LGRB 070208.
We further quantify the effect of the small number statistics in this sample by bootstrap resampling of the SHOALS sample. We extract a subsample of sources from one of the reference samples matching the IR bright sample in size, and calculate its redshift distribution. This is done 100,000 times to explore the frequency with which the subsample realisation matched the observed distribution. We define a match as a scenario in which an appropriate fraction of the sample lies at = 1.24 (our highest optically detected galaxy redshift) or lower. We also consider the Kolmogorov-Smirnov (KS) statistic for the same distribution. As the results in table 9 demonstrate, the KS-test is unable to the reject the null hypothesis that IR-bright sample is drawn from the same population as SHOALS, while the bootstrapping estimate gives a 0.06 per cent chance of drawing this redshift distribution from SHOALS. Assuming instead that the undetected sources are dusty, lower redshift galaxies, or that they are stars, only increases the disparity between the samples (see later).
The differences between the bootstrap and KS-test results are pronounced. The bootstrapping method supports a much stronger identification of IR-bright LGRB hosts being biased in redshift, compared to the KS-test. Fundamentally the two tests are exploring different aspects of the data. The KS-test is primarily sensitive to the shape of the distribution, and at < 1.24 these are similar. However, the entire distribution for the IR-bright galaxies is shifted towards lower redshifts, producing the clear bootstrap results indicated in table 9. The IR-bright hosts possess a biased distribution in redshift, but since the distribution shape is similar, this does not necessarily imply a distinct underlying population.
| Property | Boostrap Target | Bootstrap | KS-test |
|---|---|---|---|
| %age prob. | p-value1 | ||
| z | 0.61 by = 1.24 | 0.056 | 0.45 |
| M⋆ | 0.50 by log | 0.001 | 0.004 |
| AV | 0.50 by = 0.84 | 20.2 | 0.07 |
| AV | 0.75 by = 1.89 | 0.09 | 0.07 |
| SFR | 0.50 by log = 0.17 | 50.1 | 0.62 |
1The KS test requires a p-value of less than 0.05 to pass the widely used threshold of 2 significance.
7.4 Masses, Dust Extinction and SFR
We compare the stellar masses derived for our IR-bright LGRB host population (11 objects - 6 from our SED fitting and 5 literature values), to existing samples over the same redshift range, in figure 13. The IR-bright and SHOALS distributions yield a KS-test p-value that passes the 2 threshold for significance. This, and the corresponding bootstrap result, are given in table 9. In comparing the mass distributions, we assume that the optically-faint subsample is not significantly biased in mass.

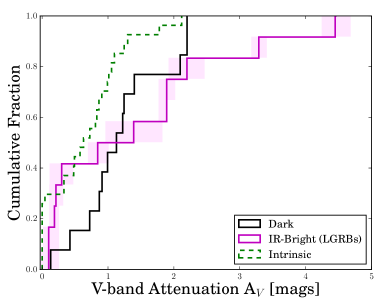
Given that we are selecting in the infrared, we expect the dust extinction (and hence re-emission at long wavelengths) to be a parameter of interest. A constraint on this is obtained from the SED fitting, parameterised by the V-band attenuation AV. The cumulative distribution of AV in our LGRB sample is shown in figure 14. This is compared to the LGRB host distribution of AV (where we have restricted the sample to < 2), as determined by Perley et al. (2013) by correcting previous optically biased studies.
The bootstrap and KS-test results are again given in table 9. 50 and 75 per cent bootstrap targets are provided to demonstrate the significance of the divergence of the distributions around AV = 1. We make no a priori assumption about the extinction in optical non-detections. As in the case of the redshift distribution, it is appropriate to consider the possibility that the 5 optically undetected sources may, in fact, be biased and have very high dust extinction values. This would only strengthen the conclusion that IR bright sources are dustier than the typical host galaxy, while also making them more extreme outliers in redshift.
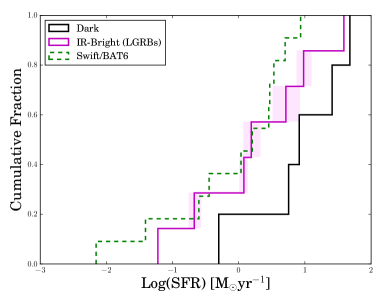
Finally, we compare our population distribution in terms of the star formation rate in LGRB hosts. We compare the 7 IR-bright LGRB sources at < 1 for which we have SFR constraints (4 from SEDs, 3 from literature values) against the < 1 distribution reported by Salvaterra et al. (2009) and Japelj et al. (2016) for the BAT6 LGRB subsample in figure 15. The KS-test p-value and boostrap result in table 9 fail to reject the null hypothesis that the IR bright sources are typical examples drawn from the underlying LGRB population.
7.5 Host Luminosity
Given a large range of source redshifts, any single photometric band samples a range of rest frame wavelengths, complicating an analysis of their rest frame magnitudes. Perley et al. (2016b) obtained Spitzer 3.6 m photometry for each of their targets in the unbiased SHOALS catalogue. We transform the 3.4m W1 and Spitzer 3.6 m apparent magnitudes to absolute magnitudes, without K-correction, while cautioning that these correspond to a rest-frame wavelength of 3.5 m/() in each case. The absolute W1/() magnitudes of the LGRB sample are shown in figure 16, and are compared to the Perley et al. (2016b) distribution. Since this is a direct comparison with Spitzer data, the distribution in absolute magnitude at a given redshift is indepent of the K-correction uncertainties. At low redshift (0.6), the W1 band is probing a fall off in the stellar flux and a rise in dust and PAH emission, rather than the stellar continuum. Above 0.6 and below 3, the W1 magnitude is probing a fairly flat region of stellar emission and so is a good mass indicator. Again, the comparison to literature work is valid because the SHOALS magnitudes also suffer from this effect.
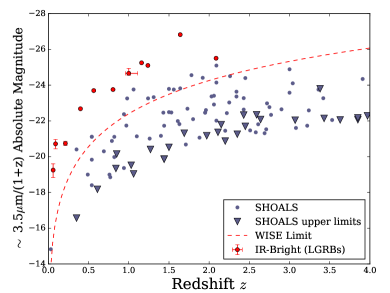
The faintest objects detected in WISE band 1 have an apparent magnitude mW1 20. Placing such a source at = 2 corresponds to a 3.4m/(1+z) absolute magnitude of -24.5, which is at the very high end for GRB hosts as figure 16 shows. The dashed line in figure 16 indicates the 2 detection threshold for WISE as a function of redshift. It is clear that most SHOALS host galaxies, even at low redshift, fail to satisfy this threshold.
We note that we are only matching against very bright sources, satisfying the cut-off for inclusion in the ALLWISE catalog. Perley et al. (2016b) obtained their 3.6m host galaxy fluxes by subtracting the flux from nearby bright sources to reveal an underlying host. This introduces the possibility that we may be overestimating the IR flux. However, in most cases we do not see another optical source that might be the true origin of the WISE flux. In other words, if the IR sources we match to are simply chance alignments, then many of the GRB hosts would have to be too optically faint for detection in Pan-STARRS. In addition, we know that IR-bright GRB hosts exist from previous work (Stanway et al., 2015a; Stanway et al., 2015b). Therefore, we have confidence that the differences between the 3.6m magnitudes in this sample, and those of the SHOALS sample, are real.
The contrast between our sample and SHOALS is rather unsurprising, since our IR-bright sample is selected to be extreme in the W1 band. However, it does present the possibility that the bias towards low redshifts comes from sampling deeper into the host galaxy luminosity function. While our failure to identify higher redshift hosts may be a simple WISE data selection effect, our most luminous host galaxy would, theoretically, have been detectable out to 3. At these redshifts, the W1 band probes the rest-frame near-infrared and is unlikely to be strongly affected by dust, but the optical is probing the rest-frame ultraviolet, so dust extinction may account for observed optical non-detections.
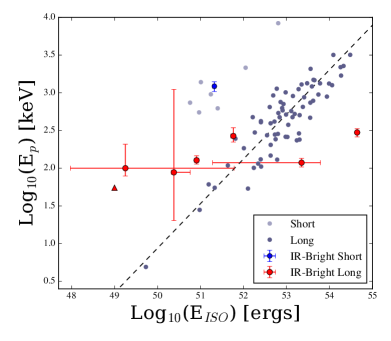
7.6 Burst Luminosity
GRB studies have found a correlation between the rest-frame photon energy Ep,i at peak prompt emission, and the isotropic equivalent energy Eiso, known as the Amati relation (Amati et al., 2002; Amati, 2006). One member of our IR-bright host population, LGRB 080517, has already been identified as a sub-luminous LLGRB on this relation (Stanway et al., 2015a) due to its low Eiso and lower limit on Ep,i. We thus consider whether other members of this population are low-luminosity bursts.
A number of targets in our sample have literature constraints on Eiso and Ep,i. Six bursts had Eiso and Ep,i estimates in the literature (see the references in table 8 for details). For LGRBs 061002 and 050219A, we calculate Eiso and the rest frame peak energy Ep,i using the SDSS photometric redshift given in section 6, the spectroscopic redshift presented by Rossi et al. (2014) and the bolometric fluence and observed peak energy provided by Butler et al. (2007). We use a cut-off power law to extrapolate from the gamma-ray band and infer Eiso.
These eight GRBs with IR-bright hosts are placed on the Amati relation in figure 17. Additional (non-IR bright) bursts are shown as grey circles in the background for reference, while the bursts from our sample are shown in red (long bursts) and blue (short) with error bars. While LGRB 061002 lies in a similar region to LGRB 080517, towards the low-luminosity region of parameter space, the uncertainties cannot rule out consistency with the Amati relation. Targets selected in the W1 band appear to cluster at the low end of the distribution, consistent with expectations given the low redshift bias in our sample.
8 Interpretation
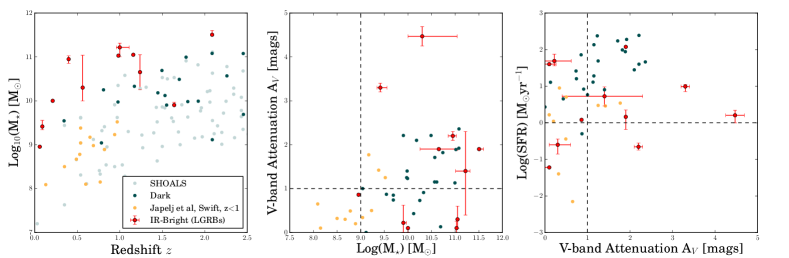
Our targets were selected to be bright in W1 imaging. At low redshifts, W1 lies above the bulk of stellar photospheric emission, while at intermediate redshift it probes the bulk of the stellar mass. As figure 16 makes clear, we are strongly limited by the shallow depth of W1 imaging in WISE. This introduces a Malmquist bias (Malmquist, 1922) which limits us to comparatively low redshift. Given that the star forming galaxy luminosity function favours less luminous systems, we are able to sample a larger fraction of the extant population at the lowest redshifts, and likely miss many of the galaxies in the more distant Universe.
However, many of the sources for which optical data is available are also extremely red (see appendix and figures 10 and 11). Red colours can arise from either old stellar populations or dusty populations. The Balmer break, which appears in a galaxy spectrum after the death of hot young O stars, is an age indicator and so may allow us to distinguish betwen these two cases. In 2 of the 14 galaxy SEDs presented in figure 10, there is no clear constraint on the Balmer break. In 5 cases there is a clear indication of a Balmer break. Even those galaxies with Balmer breaks have moderate star formation rates. Thus for the sources which are detected in the optical, we can rule out IR-bright, old galaxies as being dominant in this sample.
The population for which an IR-detection exists, but which remain undetected in optical surveys presents a slightly different challenge. It is possible that some of these may show a prominent 4000Å break, if the galaxy in question lies at >0.8. However, given the attenuation distribution presented in figure 14, our failure to detect galaxies in the range instead suggests that the rest-frame UV being probed at these redshifts has been attenuated by dust, resulting in observer-frame optical non-detections.
In figure 18 we present the multivariate distribution of properties for our LGRB hosts. While our W1 band magnitudes are bright by construction, the emission may arise for different reasons. The sources could be extremely dusty, or, if lying at , may instead be very massive. Figure 18 indicates that our sources are amongst the most massive LGRB hosts known at their redshifts (figure 18, left). In terms of attenuation and mass, mass appears to be the dominant factor (figure 18, centre). Around half of the IR-bright sample are dusty for their star formation rate (figure 18, right). In turn, this implies they have high mass for their SFR (Whitaker et al., 2017), or relatively low sSFRs for LGRB hosts (i.e. sit below what is known as the galaxy ’main sequence’, Noeske et al., 2007). This is also seen in the sSFRs given in table 8. While some hosts have high sSFRs of yr-1, as is expected from LGRB hosts generally, others have low values (e.g. yr-1 for LGRB 050219A and yr-1 for LGRB 080517).
This has implications for the supply and depletion of molecular gas in these systems. If our sample is preferentially selecting molecular gas (and therefore star formation) poor systems, this implies either that the hydrogen gas in these systems is in a different phase (i.e. heated by shocks, interactions or a large scale environment effect) or that there is very little gas, as might be seen in an old underlying system which accretes a small star forming satellite. This latter scenario has already been demonstrated in the most luminous example in this sample of IR-bright systems, the host of LGRB 080517 (Stanway et al., 2015b, and in prep). However a molecular gas detection has recently been reported for a second GRB host in our IR-bright selection, the dark burst LGRB 080207 (Arabsalmani et al., 2017), and two galaxies in our LGRB sample (080517 and 100316D) have detections of IR molecular Hydrogen emission lines (Wiersema et al., in prep). Arabsalmani et al. (2017) find that the host of LGRB 080207 appears to follow the normal scaling relations for star forming galaxies and is not noticeably poor in molecular gas. It is however a dark burst, in a host which has already been noted for being relatively massive and dusty - criteria which bring it into our overall sample. This implies that we are not preferentially selecting molecular gas rich systems.
Figure 18 shows that the IR-bright LGRB host sample may not have a single set of consistent properties. If we divide the sample into dusty (AV > 1) vs non-dusty, and massive (log10(M⋆/M⊙) > 9) vs less massive, we find that of 11 LGRB host galaxies in our sample that have M⋆ and AV information, 6 would be classed as both massive and dusty, while 4 are simply massive, and one is on the border of being low in mass and not dusty.
A question thus arises: is this a distinct population, or is it sampling the tails of existing and known populations? The diversity of host galaxy properties in our sample favours the latter possibility. There is no clear separation between the IR luminous host galaxies and the bulk of the LGRB population in any projection of parameter space. While our sources are dustier than the bulk of the population over the same redshift range, they do not lie significantly outside of the range of typical LGRB host properties, with both AV and another extreme property (e.g. high stellar mass, low redshift) required for selection. This suggests that we are sampling the tails of previously established host distributions. As such, it is unlikely that implications for LGRB progenitors can be derived from this sample. None the less, selection in these relatively shallow infrared bands is useful for constraining the tails of existing distributions and therefore the full range of LGRB host properties.
This analysis has identified 2 new candidate GRB hosts. These are LGRB 080517, which has already been extensively studied (Stanway et al., 2015a; Stanway et al., 2015b) following selection with this methodology, and LGRB 061002. This burst has a false alarm probability for association with the IR-bright galaxy of only 0.0003. We have also newly identified existing host candidates as being bright in the WISE bands. Generally, the low number of IR-bright GRB hosts we have found (only 20 from 1001 bursts), is consistent with expectations for the following reasons. First and foremost, a shallow survey such as WISE only allows us to sample low redshifts, covering a small cosmological volume. A secondary effect might be arising because the LGRB rate appears to be suppressed in the local Universe (e.g. Perley et al., 2016a), tracing the star formation rate density but also the increase in metallicity over cosmic time. Local and/or massive and dusty galaxies are typically detected in WISE, however massive and dusty galaxies are typically higher in metallicity and are less often seen to host LGRBs. SGRBs could be hosted by these classes of galaxy, however short bursts are intrinsically less luminous and have a much lower observed redshift distribution. Finally, by the time we get to high enough redshifts that the rest frame bands LGRB hosts are bright in (e.g. UV) are redshifted to W1, the emission is too faint for detection by shallow surveys such as WISE. These factors conspire to produce only small sample of GRB hosts that can be detected in WISE.
In theory, using these data, it is possible to calculate the fraction of low redshift and massive, dusty GRB hosts that have been missed in previous follow up studies. This is primarily true for low redshift galaxies. As figure 16 shows, the WISE 2 limit corresponds to absolute magnitudes of -18 at =0.1. This is well below the knee of the galaxy luminosity function, probing galaxies of 0.1 L∗ and above (Babbedge et al., 2006). We would therefore naively expect to see the majority of galaxies at in . However, our cross matching procedure fails to capture bursts at very large apparent offsets from their hosts, and this primarily affects short bursts and the lowest redshift galaxies in the GRB population. In fact, of the three known long bursts at , we identify zero as IR-bright. There are four long bursts known to be at , of these we detect two and one of those was selected as low purely on the basis of its WISE detection. The remaining two GRBs constitute one source at large offset from a very extended galaxy, and one source in a highly sub-luminous host. This demonstrates that 3.6 micron selection is not a highly efficient method for identifying low redshift bursts in all cases, but nonetheless that for typical galaxies in its redshift sweet spot, we would expect to have identified any source present in the archival data. Thus, while we cannot rule out the continued presence of galaxies in the archival data set, we can be reasonably confident that the fraction of GRB hosts without redshift identifications which lie at is very low. With the exception of GRB 080517, which was selected as part of this sample, we identify no further candidates in this range and would have expected to detect at least half of those present, unless the GRB host luminosity function has a steep faint end slope. This suggests that the total number of hosts still remaining unidentified in the archival sample is of order a few, at most.
We note that deeper IR data, for example that obtained with Spitzer or JWST, would detect galaxies further down the luminosity function, but would not overcome the issues of large projected offsets or galaxy sizes. It is therefore possible that future deeper infrared surveys will allow this analysis to be extended to slightly higher redshifts, and, for example, characterise the overlooked GRB hosts (if any) at .
9 Conclusions
A population of infrared-bright GRB host galaxies has been identified by cross-matching X-ray afterglow positions to the ALLWISE catalogue. Selective cuts in apparent magnitude and catalogue quality flags, in addition to a false alarm probability analysis, yield 55 IR-sources that are convincingly associated with a GRB X-ray position. Compiling photometry from surveys and our own observations, we perform SED fitting, finding that 14 sources fit well to galaxy templates and 14 are best-fittung to stellar SEDs. The remainder are either cut from the sample, optically undetected, lacking survey coverage or have been previously studied. Spectroscopy of 6 targets supplements the photometric data and allows us to rule out 3 stellar interlopers. Our methodology has identified the host of LGRB 080517, and potentially LGRB 061002. The former has already undergone extensive study, while the candidate host of LGRB 061002 is newly reported here. Focusing on LGRB hosts in particular, we find that the population is biased towards massive, dusty and low redshift galaxies, with respect to unbiased samples of LGRB hosts. The low redshift bias appears to be due to the depth of WISE, and within this low redshift population, galaxies with high stellar mass and dust content are selected. Dusty and local galaxies are the most frequently discovered hosts of dark and low-luminosity LGRBs respectively, classes of burst which are crucial to understand if we are to develop a full picture of the collapsar GRB phenomenon. We propose that the spatial association of IR-bright galaxies with LGRBs is therefore a useful technique for the identification of unusual host systems.
Acknowledgements
We acknowledge PhD studentship 1763016 (AAC) from the UK Science and Technology Facilities Council (STFC). AAC also thanks the William Edwards Educational Charity. We acknowledge support from the European Research Council (AJL). CRA acknowledges receipt of a studentship from the Midlands Physics Alliance. SMLG is funded by a research studentship from the UK STFC.
This paper contains original results based on observations taken at WHT and ATCA. The Australia Telescope Compact Array is part of the Australia Telescope National Facility which is funded by the Australian Government for operation as a National Facility managed by CSIRO. The William Herschel Telescope is operated on the island of La Palma by the Isaac Newton Group of Telescopes in the Spanish Observatorio del Roque de los Muchachos of the Instituto de Astrofisica de Canarias.
This paper makes use of archival data. The Pan-STARRS Surveys and the PS1 public science archive have been made possible through contributions by the Institute for Astronomy, the University of Hawaii, the Pan-STARRS Project Office, the Max-Planck Society and its participating institutes. Funding for SDSS-III has been provided by the Alfred P. Sloan Foundation, the Participating Institutions, the National Science Foundation, and the U.S. Department of Energy Office of Science. The SDSS-III web site is http://www.sdss3.org/. SDSS-III is managed by the Astrophysical Research Consortium for the Participating Institutions of the SDSS-III Collaboration.
We use observations made with the NASA Galaxy Evolution Explorer. GALEX is operated for NASA by the California Institute of Technology under NASA contract NAS5-98034. This publication makes use of data products from the Wide-field Infrared Survey Explorer, which is a joint project of the University of California, Los Angeles, and the Jet Propulsion Laboratory/California Institute of Technology, funded by the National Aeronautics and Space Administration. We acknowledge the use of public data from the Swift data archive. This research has made use of the APASS database, located at the AAVSO web site. Funding for APASS has been provided by the Robert Martin Ayers Sciences Fund. This publication makes use of data products from the Two Micron All Sky Survey, which is a joint project of the University of Massachusetts and the Infrared Processing and Analysis Center/California Institute of Technology, funded by the National Aeronautics and Space Administration and the National Science Foundation. This research has made use of the NASA/ IPAC Infrared Science Archive, which is operated by the Jet Propulsion Laboratory, California Institute of Technology, under contract with the National Aeronautics and Space Administration.
We make use of a number of astronomical tools. IRAF is distributed by the National Optical Astronomy Observatory, which is operated by the Association of Universities for Research in Astronomy (AURA) under a cooperative agreement with the National Science Foundation. We acknowledge the use of Ned Wright’s cosmology calculator (Wright, 2006). Finally, we thank the anonymous referee for their valuable feedback.
References
- Alam et al. (2015) Alam S., et al., 2015, ApJS, 219, 12
- Altmann et al. (2017) Altmann M., Roeser S., Demleitner M., Bastian U., Schilbach E., 2017, A&A, 600, L4
- Amati (2006) Amati L., 2006, MNRAS, 372, 233
- Amati et al. (2002) Amati L., et al., 2002, A&A, 390, 81
- Arabsalmani et al. (2017) Arabsalmani M., et al., 2017, preprint, (arXiv:1709.00424)
- Avni (1976) Avni Y., 1976, ApJ, 210, 642
- Babbedge et al. (2006) Babbedge T. S. R., et al., 2006, MNRAS, 370, 1159
- Barthelmy et al. (2005) Barthelmy S. D., et al., 2005, Space Sci. Rev., 120, 143
- Becker et al. (1994) Becker R. H., White R. L., Helfand D. J., 1994, in Crabtree D. R., Hanisch R. J., Barnes J., eds, ASP Conference Series Vol. 61, Astronomical Data Analysis Software and Systems III. p. 165
- Berger (2014) Berger E., 2014, ARA&A, 52, 43
- Berger et al. (2005) Berger E., et al., 2005, Nature, 438, 988
- Berger et al. (2009) Berger E., Cenko S. B., Fox D. B., Cucchiara A., 2009, ApJ, 704, 877
- Best et al. (2013) Best W. M. J., et al., 2013, ApJ, 777, 84
- Blanchard et al. (2016) Blanchard P. K., Berger E., Fong W.-f., 2016, ApJ, 817, 144
- Blandford & Znajek (1977) Blandford R. D., Znajek R. L., 1977, MNRAS, 179, 433
- Bolmer et al. (2017) Bolmer J., Greiner J., Krühler T., Schady P., Ledoux C., Tanvir N. R., Levan A. J., 2017, preprint, (arXiv:1709.06867)
- Bruzual & Charlot (2003) Bruzual G., Charlot S., 2003, MNRAS, 344, 1000
- Burrows et al. (2004) Burrows D. N., et al., 2004, in Flanagan K. A., Siegmund O. H. W., eds, Proc. SPIEVol. 5165, X-Ray and Gamma-Ray Instrumentation for Astronomy XIII. pp 201–216, doi:10.1117/12.504868
- Butler et al. (2007) Butler N. R., Kocevski D., Bloom J. S., Curtis J. L., 2007, ApJ, 671, 656
- Cano et al. (2013) Cano Z., Malesani D., Tanvir N. R., Xu D., Kangas T., Kajava J., 2013, GRB Coordinates Network, Circular Service, No. 14710, #1 (2013), 14710
- Cenko et al. (2008) Cenko S. B., et al., 2008, preprint, (arXiv:0802.0874)
- Chambers et al. (2016) Chambers K. C., et al., 2016, preprint, (arXiv:1612.05560)
- Charlot & Fall (2000) Charlot S., Fall S. M., 2000, ApJ, 539, 718
- Chornock & Fong (2015) Chornock R., Fong W., 2015, GRB Coordinates Network, 17358
- Chornock et al. (2014) Chornock R., Fong W., Fox D. B., 2014, GRB Coordinates Network, 17177
- Christensen et al. (2008) Christensen L., Vreeswijk P. M., Sollerman J., Thöne C. C., Le Floc’h E., Wiersema K., 2008, A&A, 490, 45
- Condon et al. (1998) Condon J. J., Cotton W. D., Greisen E. W., Yin Q. F., Perley R. A., Taylor G. B., Broderick J. J., 1998, AJ, 115, 1693
- Cucchiara et al. (2007) Cucchiara A., Fox D. B., Cenko S. B., Price P. A., 2007, GRB Coordinates Network, 6083
- Cucchiara et al. (2011) Cucchiara A., et al., 2011, ApJ, 736, 7
- Dainotti et al. (2015) Dainotti M., Petrosian V., Willingale R., O’Brien P., Ostrowski M., Nagataki S., 2015, MNRAS, 451, 3898
- Davies et al. (2017) Davies L. J. M., et al., 2017, MNRAS, 466, 2312
- Eckart et al. (2010) Eckart M. E., McGreer I. D., Stern D., Harrison F. A., Helfand D. J., 2010, ApJ, 708, 584
- Elliott et al. (2013) Elliott J., et al., 2013, preprint, (arXiv:1308.5520)
- Farrow et al. (2014) Farrow D. J., et al., 2014, MNRAS, 437, 748
- Fong et al. (2016) Fong W., et al., 2016, ApJ, 833, 151
- Frederiks (2013) Frederiks D., 2013, GRB Coordinates Network, 14772
- Frederiks & Pal’Shin (2011) Frederiks D., Pal’Shin V., 2011, GRB Coordinates Network, 12370
- Fruchter et al. (2006) Fruchter A. S., et al., 2006, Nature, 441, 463
- Galama et al. (1998) Galama T. J., et al., 1998, Nature, 395, 670
- Gehrels et al. (2004) Gehrels N., et al., 2004, ApJ, 611, 1005
- Goldstein et al. (2017) Goldstein A., et al., 2017, ApJ, 848, L14
- Golenetskii et al. (2013) Golenetskii S., Aptekar R., Frederiks D., Pal’Shin V., Oleynik P., Ulanov M., Svinkin D., Cline T., 2013, GRB Coordinates Network, 15203
- Greiner et al. (2009) Greiner J., et al., 2009, ApJ, 693, 1610
- Heintz et al. (2016) Heintz K. E., Malesani D., de Ugarte Postigo A., Pursimo T., Kruehler T., Telting J., Fynbo J. P. U., 2016, GRB Coordinates Network, Circular Service, No. 20020, #1 (2016), 20020
- Henden & Munari (2014) Henden A., Munari U., 2014, Contributions of the Astronomical Observatory Skalnate Pleso, 43, 518
- Hjorth (2013) Hjorth J., 2013, Philosophical Transactions of the Royal Society of London Series A, 371, 20120275
- Hjorth et al. (2012) Hjorth J., et al., 2012, ApJ, 756, 187
- Hopkins & Beacom (2006) Hopkins A. M., Beacom J. F., 2006, ApJ, 651, 142
- Hunt et al. (2011) Hunt L., Palazzi E., Rossi A., Savaglio S., Cresci G., Klose S., Michałowski M., Pian E., 2011, ApJ, 736, L36
- Jakobsson et al. (2004) Jakobsson P., Hjorth J., Fynbo J. P. U., Watson D., Pedersen K., Björnsson G., Gorosabel J., 2004, ApJ, 617, L21
- Japelj et al. (2016) Japelj J., et al., 2016, A&A, 590, A129
- Jeong et al. (2014) Jeong S., et al., 2014, A&A, 569, A93
- Kennicutt & Evans (2012) Kennicutt R. C., Evans N. J., 2012, ARA&A, 50, 531
- Kocevski et al. (2010) Kocevski D., et al., 2010, MNRAS, 404, 963
- Kovács & Szapudi (2015) Kovács A., Szapudi I., 2015, MNRAS, 448, 1305
- Krühler et al. (2011) Krühler T., et al., 2011, A&A, 534, A108
- Krühler et al. (2012a) Krühler T., et al., 2012a, A&A, 546, A8
- Krühler et al. (2012b) Krühler T., et al., 2012b, ApJ, 758, 46
- Krühler et al. (2015) Krühler T., et al., 2015, A&A, 581, A125
- LIGO Scientific Collaboration et al. (2017) LIGO Scientific Collaboration et al., 2017, preprint, (arXiv:1710.05833)
- Levan & Tanvir (2013) Levan A. J., Tanvir N. R., 2013, GRB Coordinates Network, Circular Service, No. 14667, #1 (2013), 14667
- Levan et al. (2016) Levan A., Crowther P., de Grijs R., Langer N., Xu D., Yoon S.-C., 2016, Space Sci. Rev., 202, 33
- Liang et al. (2007) Liang E., Zhang B., Virgili F., Dai Z. G., 2007, ApJ, 662, 1111
- Littlejohns et al. (2014) Littlejohns O., et al., 2014, GRB Coordinates Network, Circular Service, No. 16050, #1 (2014), 16050
- Lyman et al. (2017) Lyman J. D., et al., 2017, MNRAS, 467, 1795
- Madau & Dickinson (2014) Madau P., Dickinson M., 2014, ARA&A, 52, 415
- Malesani et al. (2014) Malesani D., D’Avanzo P., D’Elia V., Vergani S. D., Andreuzzi G., Garcia A., Escudero G., Bonomo A., 2014, GRB Coordinates Network, 17170
- Malesani et al. (2015) Malesani D., Xu D., Jakobsson P., Harmanen J., 2015, GRB Coordinates Network, Circular Service, No. 17655, #1 (2015), 17655
- Malesani et al. (2016) Malesani D., et al., 2016, GRB Coordinates Network, Circular Service, No. 20319, #1 (2016), 20319
- Malmquist (1922) Malmquist K. G., 1922, Meddelanden fran Lunds Astronomiska Observatorium Serie I, 100, 1
- Martin & GALEX Science Team (2005) Martin D. C., GALEX Science Team 2005, in American Astronomical Society Meeting Abstracts. p. 1235
- Martin et al. (2003) Martin C., et al., 2003, in Blades J. C., Siegmund O. H. W., eds, Proc. SPIEVol. 4854, Future EUV/UV and Visible Space Astrophysics Missions and Instrumentation.. pp 336–350, doi:10.1117/12.460034
- McCall (2004) McCall M. L., 2004, AJ, 128, 2144
- McGuire et al. (2016) McGuire J. T. W., et al., 2016, ApJ, 825, 135
- Michałowski et al. (2015) Michałowski M. J., et al., 2015, A&A, 582, A78
- Michałowski et al. (2016) Michałowski M. J., et al., 2016, preprint, (arXiv:1610.06928)
- Noeske et al. (2007) Noeske K. G., et al., 2007, ApJ, 660, L43
- Oke & Gunn (1983) Oke J. B., Gunn J. E., 1983, ApJ, 266, 713
- Page et al. (2009) Page K. L., et al., 2009, MNRAS, 395, 328
- Pérez-Ramírez et al. (2013) Pérez-Ramírez D., et al., 2013, in Castro-Tirado A. J., Gorosabel J., Park I. H., eds, EAS Publications Series Vol. 61, EAS Publications Series. pp 345–349, doi:10.1051/eas/1361055
- Perley et al. (2006) Perley D. A., Foley R. J., Bloom J. S., Butler N. R., 2006, GRB Coordinates Network, 5387
- Perley et al. (2007) Perley D. A., Bloom J. S., Butler N. R., Li W., Chen H.-W., 2007, in Immler S., Weiler K., McCray R., eds, American Institute of Physics Conference Series Vol. 937, Supernova 1987A: 20 Years After: Supernovae and Gamma-Ray Bursters. pp 526–529, doi:10.1063/1.3682955
- Perley et al. (2012) Perley D. A., Modjaz M., Morgan A. N., Cenko S. B., Bloom J. S., Butler N. R., Filippenko A. V., Miller A. A., 2012, ApJ, 758, 122
- Perley et al. (2013) Perley D. A., et al., 2013, ApJ, 778, 128
- Perley et al. (2016a) Perley D. A., et al., 2016a, ApJ, 817, 7
- Perley et al. (2016b) Perley D. A., et al., 2016b, ApJ, 817, 8
- Pickles (1998) Pickles A. J., 1998, PASP, 110, 863
- Prochaska et al. (2005) Prochaska J. X., Chen H.-W., Bloom J. S., Stephens A., 2005, GRB Coordinates Network, 3679
- Qi et al. (2015) Qi Z., et al., 2015, ApJ, 150, 137
- Rol et al. (2005) Rol E., Wijers R. A. M. J., Kouveliotou C., Kaper L., Kaneko Y., 2005, ApJ, 624, 868
- Rol et al. (2007) Rol E., et al., 2007, MNRAS, 374, 1078
- Roming et al. (2005) Roming P. W. A., et al., 2005, Space Sci. Rev., 120, 95
- Rossi et al. (2014) Rossi A., et al., 2014, A&A, 572, A47
- Ruiz-Velasco et al. (2007) Ruiz-Velasco A. E., et al., 2007, ApJ, 669, 1
- Salvaterra et al. (2009) Salvaterra R., et al., 2009, Nature, 461, 1258
- Schady (2017) Schady P., 2017, preprint, (arXiv:1707.05214)
- Schlafly & Finkbeiner (2011) Schlafly E. F., Finkbeiner D. P., 2011, ApJ, 737, 103
- Selsing et al. (2018) Selsing J., et al., 2018, preprint, (arXiv:1802.07727)
- Shanks et al. (2015) Shanks T., et al., 2015, MNRAS, 451, 4238
- Skrutskie et al. (2006) Skrutskie M. F., et al., 2006, AJ, 131, 1163
- Stanway et al. (2015a) Stanway E. R., Levan A. J., Tanvir N., Wiersema K., van der Horst A., Mundell C. G., Guidorzi C., et al. 2015a, MNRAS, 446, 3911
- Stanway et al. (2015b) Stanway E. R., Levan A. J., Tanvir N. R., Wiersema K., van der Laan T. P. R., 2015b, ApJ, 798, L7
- Starling et al. (2011) Starling R. L. C., et al., 2011, MNRAS, 411, 2792
- Svensson et al. (2010) Svensson K. M., Levan A. J., Tanvir N. R., Fruchter A. S., Strolger L.-G., 2010, MNRAS, 405, 57
- Svensson et al. (2012a) Svensson K. M., et al., 2012a, MNRAS, 421, 25
- Svensson et al. (2012b) Svensson K. M., et al., 2012b, MNRAS, 421, 25
- Tanvir et al. (2009) Tanvir N. R., et al., 2009, Nature, 461, 1254
- Tanvir et al. (2017a) Tanvir N. R., et al., 2017a, preprint, (arXiv:1703.09052)
- Tanvir et al. (2017b) Tanvir N. R., et al., 2017b, ApJ, 848, L27
- Taylor (2005) Taylor M. B., 2005, in Shopbell P., Britton M., Ebert R., eds, ASP Conference Series Vol. 347, Astronomical Data Analysis Software and Systems XIV. p. 29
- The LIGO Scientific Collaboration & The Virgo Collaboration (2017) The LIGO Scientific Collaboration The Virgo Collaboration 2017, preprint, (arXiv:1710.05832)
- Troja et al. (2017) Troja E., et al., 2017, preprint, (arXiv:1710.05433)
- Vernet et al. (2011) Vernet J., et al., 2011, A&A, 536, A105
- Vink & Harries (2017) Vink J. S., Harries T. J., 2017, preprint, (arXiv:1703.09857)
- Vink & de Koter (2005) Vink J. S., de Koter A., 2005, A&A, 442, 587
- Whitaker et al. (2017) Whitaker K. E., Pope A., Cybulski R., Casey C. M., Popping G., Yun M. S., 2017, ApJ, 850, 208
- Wiersema et al. (2012) Wiersema K., et al., 2012, GRB Coordinates Network, 12991
- Williams (1995) Williams R. K., 1995, Phys. Rev. D, 51, 5387
- Woosley & Bloom (2006) Woosley S. E., Bloom J. S., 2006, ARA&A, 44, 507
- Wright (2006) Wright E. L., 2006, PASP, 118, 1711
- Wright et al. (2010) Wright E. L., et al., 2010, AJ, 140, 1868
- Zheng et al. (2016) Zheng W., Filippenko A. V., Graham M., 2016, GRB Coordinates Network, Circular Service, No. 19668, #1 (2016), 19668
- da Cunha et al. (2008) da Cunha E., Charlot S., Elbaz D., 2008, MNRAS, 388, 1595
- da Cunha et al. (2015) da Cunha E., et al., 2015, ApJ, 806, 110
- de Ugarte Postigo et al. (2013) de Ugarte Postigo A., Xu D., Malesani D., Gorosabel J., Jakobsson P., Kajava J., 2013, GRB Coordinates Network, 15187
- de Ugarte Postigo et al. (2014) de Ugarte Postigo A., et al., 2014, A&A, 563, A62
- de Ugarte Postigo et al. (2016) de Ugarte Postigo A., et al., 2016, GRB Coordinates Network, 20150
Appendix A Additional Information
A.1 Photometric Compilation
In the table 10, we compile archival photometric data for the 30 GRBs with reliable WISE detected counterparts and detections or limits in archival optical photometry. One target is listed twice, since two plausible optical counterparts are detected. All magnitudes, including those for WISE are given in the AB magnitude system.
| GRB | FUV | FUV | NUV | NUV | u | u | g | g | r | r | i | i | z | z | y | y | J | j | H | h | K | k | W1 | W1 | W2 | W2 | W3 | W3 | W4 | W4 | |
|---|---|---|---|---|---|---|---|---|---|---|---|---|---|---|---|---|---|---|---|---|---|---|---|---|---|---|---|---|---|---|---|
| 050522 | 20.89 | - | 21.79 | - | 19.01 | 0.02 | 16.60 | 0.00 | 15.77 | 0.00 | 15.38 | 0.00 | 15.21 | 0.00 | 15.07 | 0.00 | 14.02 | 0.03 | 13.45 | 0.02 | 13.27 | 0.04 | 13.28 | 0.02 | 13.27 | 0.03 | 11.95 | - | 9.07 | - | |
| 050721 | 20.89 | - | 21.79 | - | - | - | 18.31 | 0.01 | 17.62 | 0.00 | 17.28 | 0.01 | 17.12 | 0.02 | 17.22 | 0.02 | 16.00 | 0.07 | 15.50 | 0.11 | 15.30 | 0.17 | 15.31 | 0.06 | 16.04 | 0.26 | 11.48 | - | 7.99 | - | |
| 050724 | 20.89 | - | 21.79 | - | - | - | 20.75 | 0.35 | 20.21 | 0.05 | 19.48 | 0.03 | 18.99 | 0.06 | 18.74 | 0.08 | 17.13 | - | 16.51 | - | 16.19 | - | 15.35 | 0.05 | 15.42 | 0.13 | 12.37 | - | 8.42 | - | |
| 060428B | 20.89 | - | 21.79 | - | 23.37 | 0.81 | 21.34 | 0.15 | 19.91 | 0.04 | 19.46 | 0.02 | 19.25 | 0.03 | 18.86 | 0.09 | 16.90 | - | 16.00 | - | 15.52 | - | 15.90 | 0.04 | 15.76 | 0.08 | 12.81 | - | 9.44 | - | |
| 061002 | 20.89 | - | 21.79 | - | 22.60 | 0.53 | 22.27 | 0.06 | 21.67 | 0.14 | 21.13 | 0.12 | 20.81 | 0.33 | 20.40 | 0.22 | 16.55 | - | 16.43 | - | 15.69 | - | 16.20 | 0.05 | 15.76 | 0.11 | 12.21 | - | 9.27 | - | |
| 070208 | 20.89 | - | 21.79 | - | 23.29 | - | 20.00 | 0.02 | 19.60 | 0.04 | 19.57 | 0.03 | 19.43 | 0.08 | 19.06 | 0.16 | 17.10 | - | 16.30 | - | 17.20 | - | 17.12 | 0.08 | 16.68 | 0.19 | 12.84 | - | 9.54 | - | |
| 070724A | 20.89 | - | 21.70 | 0.25 | - | - | 21.52 | 0.12 | 20.79 | 0.04 | 20.48 | 0.06 | 20.32 | 0.16 | 20.31 | 0.13 | 16.50 | - | 16.00 | - | 16.00 | - | 17.03 | 0.11 | 16.37 | 0.22 | 12.34 | 0.37 | 9.13 | - | |
| 080307 | 20.89 | - | 21.79 | - | 23.29 | - | 24.30 | - | 20.88 | 0.16 | 21.65 | 0.19 | 23.90 | - | 22.30 | - | 16.90 | - | 16.40 | - | 15.80 | - | 17.64 | 0.21 | 16.65 | - | 12.36 | - | 9.10 | - | |
| 080405 | 19.85 | 0.18 | 19.54 | 0.07 | - | - | 20.05 | 0.10 | 20.11 | 0.04 | 19.35 | 0.03 | 19.18 | 0.09 | 19.29 | 0.10 | 16.74 | - | 16.14 | - | 15.95 | - | 14.82 | 0.03 | 13.89 | 0.04 | 11.66 | 0.24 | 8.67 | 0.36 | |
| 080517 | 20.85 | 0.18 | 20.46 | 0.11 | - | - | 18.31 | 0.01 | 17.94 | 0.03 | 17.56 | 0.01 | 17.57 | 0.03 | 17.45 | 0.03 | 16.48 | 0.13 | 15.85 | 0.15 | 15.66 | 0.21 | 14.65 | 0.03 | 14.25 | 0.04 | 9.85 | 0.05 | 7.07 | 0.11 | |
| 080605 | 20.89 | - | 21.79 | - | - | - | 21.90 | 0.18 | 21.57 | 0.34 | 19.91 | 0.03 | 19.18 | 0.02 | 19.04 | 0.03 | 16.93 | - | 16.43 | - | 16.26 | - | 15.92 | 0.05 | 15.98 | 0.17 | 12.56 | - | 8.52 | - | |
| 090904B | 20.89 | - | 21.79 | - | - | - | 21.04 | 0.08 | 18.56 | 0.02 | 16.90 | 0.01 | 15.94 | 0.01 | 15.32 | 0.01 | 13.26 | 0.02 | 11.95 | 0.02 | 11.54 | 0.02 | 11.41 | 0.04 | 11.89 | 0.05 | 11.97 | 0.44 | 8.89 | - | |
| 100206A | 20.89 | - | 21.79 | - | - | - | 24.30 | - | 21.26 | 0.17 | 20.94 | 0.08 | 20.22 | 0.05 | 19.68 | 0.20 | 16.74 | - | 16.14 | - | 15.95 | - | 15.71 | 0.05 | 15.15 | 0.09 | 11.31 | 0.18 | 8.56 | - | |
| 110305A | 20.89 | - | 21.79 | - | - | - | 20.10 | 0.03 | 18.67 | 0.02 | 17.03 | 0.01 | 16.24 | 0.01 | 15.82 | 0.01 | 14.49 | 0.03 | 13.84 | 0.04 | 13.56 | 0.04 | 13.30 | 0.05 | 13.16 | 0.05 | 11.41 | - | 8.41 | - | |
| 111222A | 20.89 | - | 21.79 | - | 22.34 | 0.30 | 19.25 | 0.01 | 18.10 | 0.01 | 16.68 | 0.00 | 15.98 | 0.00 | 15.61 | 0.00 | 14.38 | 0.03 | 13.65 | 0.03 | 13.43 | 0.04 | 13.26 | 0.02 | 13.16 | 0.03 | 12.45 | - | 8.91 | - | |
| 120119A | 20.89 | - | 21.79 | - | 23.85 | 1.00 | 21.65 | 0.19 | 21.25 | 0.06 | 20.50 | 0.05 | 20.09 | 0.06 | 19.70 | 0.15 | 16.75 | - | 16.06 | - | 15.41 | - | 16.64 | 0.08 | 16.92 | 0.37 | 12.69 | - | 8.97 | - | |
| 120612A | 20.89 | - | 21.31 | 0.25 | - | - | 17.28 | 0.00 | 16.95 | 0.01 | 16.83 | 0.00 | 16.82 | 0.01 | 16.83 | 0.01 | 15.77 | 0.07 | 15.59 | 0.13 | 15.47 | 0.24 | 15.64 | 0.05 | 15.71 | 0.12 | 12.64 | - | 8.78 | - | |
| 130603B | 20.89 | - | 21.99 | 0.66 | 22.46 | 0.37 | 21.78 | 0.13 | 20.92 | 0.09 | 20.81 | 0.07 | 20.32 | 0.06 | 19.84 | 0.19 | 17.11 | - | 16.50 | - | 16.00 | - | 17.05 | 0.12 | 16.95 | 0.37 | 12.53 | - | 8.91 | - | |
| 130907A | 20.89 | - | 21.79 | - | 22.09 | 0.38 | 22.21 | 0.19 | 22.29 | 0.31 | 21.38 | 0.22 | 19.88 | 0.23 | 20.80 | 0.01 | 16.75 | - | 16.06 | - | 15.41 | - | 16.89 | 0.09 | 16.18 | 0.14 | 12.69 | - | 8.86 | - | |
| 131018B | 20.89 | - | 21.79 | - | - | - | 16.07 | 0.00 | 15.53 | 0.00 | 15.25 | 0.00 | 15.10 | 0.00 | 15.00 | 0.00 | 14.13 | 0.03 | 13.79 | 0.04 | 13.70 | 0.06 | 16.15 | 0.03 | 13.43 | 0.03 | 12.64 | - | 8.98 | - | |
| 131122A | 20.89 | - | 21.79 | - | 24.13 | 1.59 | 24.30 | - | 21.42 | 0.09 | 21.94 | 0.22 | 20.52 | 0.15 | 20.25 | 0.19 | 17.16 | - | 16.19 | - | 15.97 | - | 16.32 | 0.06 | 15.81 | 0.12 | 12.65 | - | 8.73 | - | |
| 140331A | 20.89 | - | 21.79 | - | 23.78 | 1.00 | 23.648 | 0.38 | 21.99 | 0.17 | 21.08 | 0.12 | 19.67 | 0.10 | 20.18 | - | 16.74 | - | 16.14 | - | 15.95 | - | 16.76 | 0.10 | 16.88 | - | 12.23 | - | 9.06 | - | |
| 140927A | 20.89 | - | 18.65 | 0.05 | - | - | 14.49 | 0.02 | 14.09 | 0.03 | 13.98 | 0.15 | 0.01 | 0.01 | 0.01 | 0.01 | 13.06 | 0.03 | 12.76 | 0.03 | 12.74 | 0.03 | 12.64 | 0.02 | 12.65 | 0.03 | 12.21 | 0.33 | 8.70 | - | |
| 141212A | 20.89 | - | 21.79 | - | - | - | 22.81 | - | 22.80 | 0.02 | 22.26 | 0.01 | 21.70 | 0.05 | 20.85 | - | 16.49 | - | 16.06 | - | 15.72 | - | 17.76 | 0.20 | 17.40 | 0.54 | 12.78 | - | 9.23 | - | |
| 150101B | 21.42 | 0.44 | 21.46 | 0.26 | - | - | 17.90 | 0.01 | 17.24 | 0.02 | 16.94 | 0.02 | 16.55 | 0.03 | 16.31 | 0.06 | 15.41 | 0.09 | 14.65 | 0.11 | 14.06 | 0.09 | 13.43 | 0.03 | 13.18 | 0.03 | 12.39 | 0.49 | 8.78 | - | |
| 150120A | 20.89 | - | 21.76 | 2.82 | 25.34 | 1.14 | 25.25 | 0.86 | 22.68 | 0.33 | 21.97 | 0.25 | 21.76 | 0.70 | 21.21 | 0.01 | 17.16 | - | 16.19 | - | 15.97 | - | 16.89 | 0.10 | 16.75 | 0.31 | 12.38 | - | 8.71 | - | |
| 150120A | 20.89 | - | 21.76 | 2.82 | 25.59 | 0.87 | 22.81 | 0.19 | 21.95 | 0.15 | 21.75 | 0.18 | 20.53 | 0.23 | 20.80 | 0.01 | 17.16 | - | 16.19 | - | 15.97 | - | 16.89 | 0.10 | 16.75 | 0.31 | 12.38 | - | 8.71 | - | |
| 160703A | 20.89 | - | 21.79 | - | - | - | 21.19 | 0.09 | 19.61 | 0.03 | 19.11 | 0.03 | 18.77 | 0.02 | 18.71 | 0.04 | 17.00 | - | 17.26 | - | 17.13 | - | 16.81 | 0.07 | 17.71 | 0.50 | 13.04 | - | 9.08 | - | |
| 161010A | 20.89 | - | 21.79 | - | - | - | 16.39 | 0.00 | 14.90 | 0.01 | 14.18 | 0.02 | 13.70 | 0.00 | 13.43 | 0.01 | 12.05 | 0.03 | 11.18 | 0.03 | 10.94 | 0.03 | 10.75 | 0.03 | 10.95 | 0.02 | 11.25 | - | 8.85 | - | |
| 161108A | 20.89 | - | 22.36 | 0.48 | 24.19 | 0.77 | 23.46 | 0.28 | 22.70 | 0.20 | 22.18 | 0.20 | 21.99 | 0.59 | 22.09 | - | 17.19 | - | 16.34 | - | 16.64 | - | 16.57 | 0.08 | 16.10 | 0.18 | 12.23 | - | 8.95 | - | |
| 161214A | 20.89 | - | 21.79 | - | 22.48 | 0.29 | 19.88 | 0.02 | 19.10 | 0.01 | 18.79 | 0.01 | 18.62 | 0.01 | 18.52 | 0.03 | 16.92 | - | 16.27 | - | 15.79 | - | 16.78 | 0.11 | 16.50 | 0.29 | 11.79 | - | 8.88 | - |
A.2 Candidate Host Image Stamps
In figure 19 we provide archival imaging postage stamp cut-outs in the W1, J and r bands. Overlaid are the X-ray R90 error circles (blue, varying size) and the WISE source centroids (red, fixed diameter). The images are 30 arcsec on each side and are centered on the GRB location. The figure extends over seven panels.
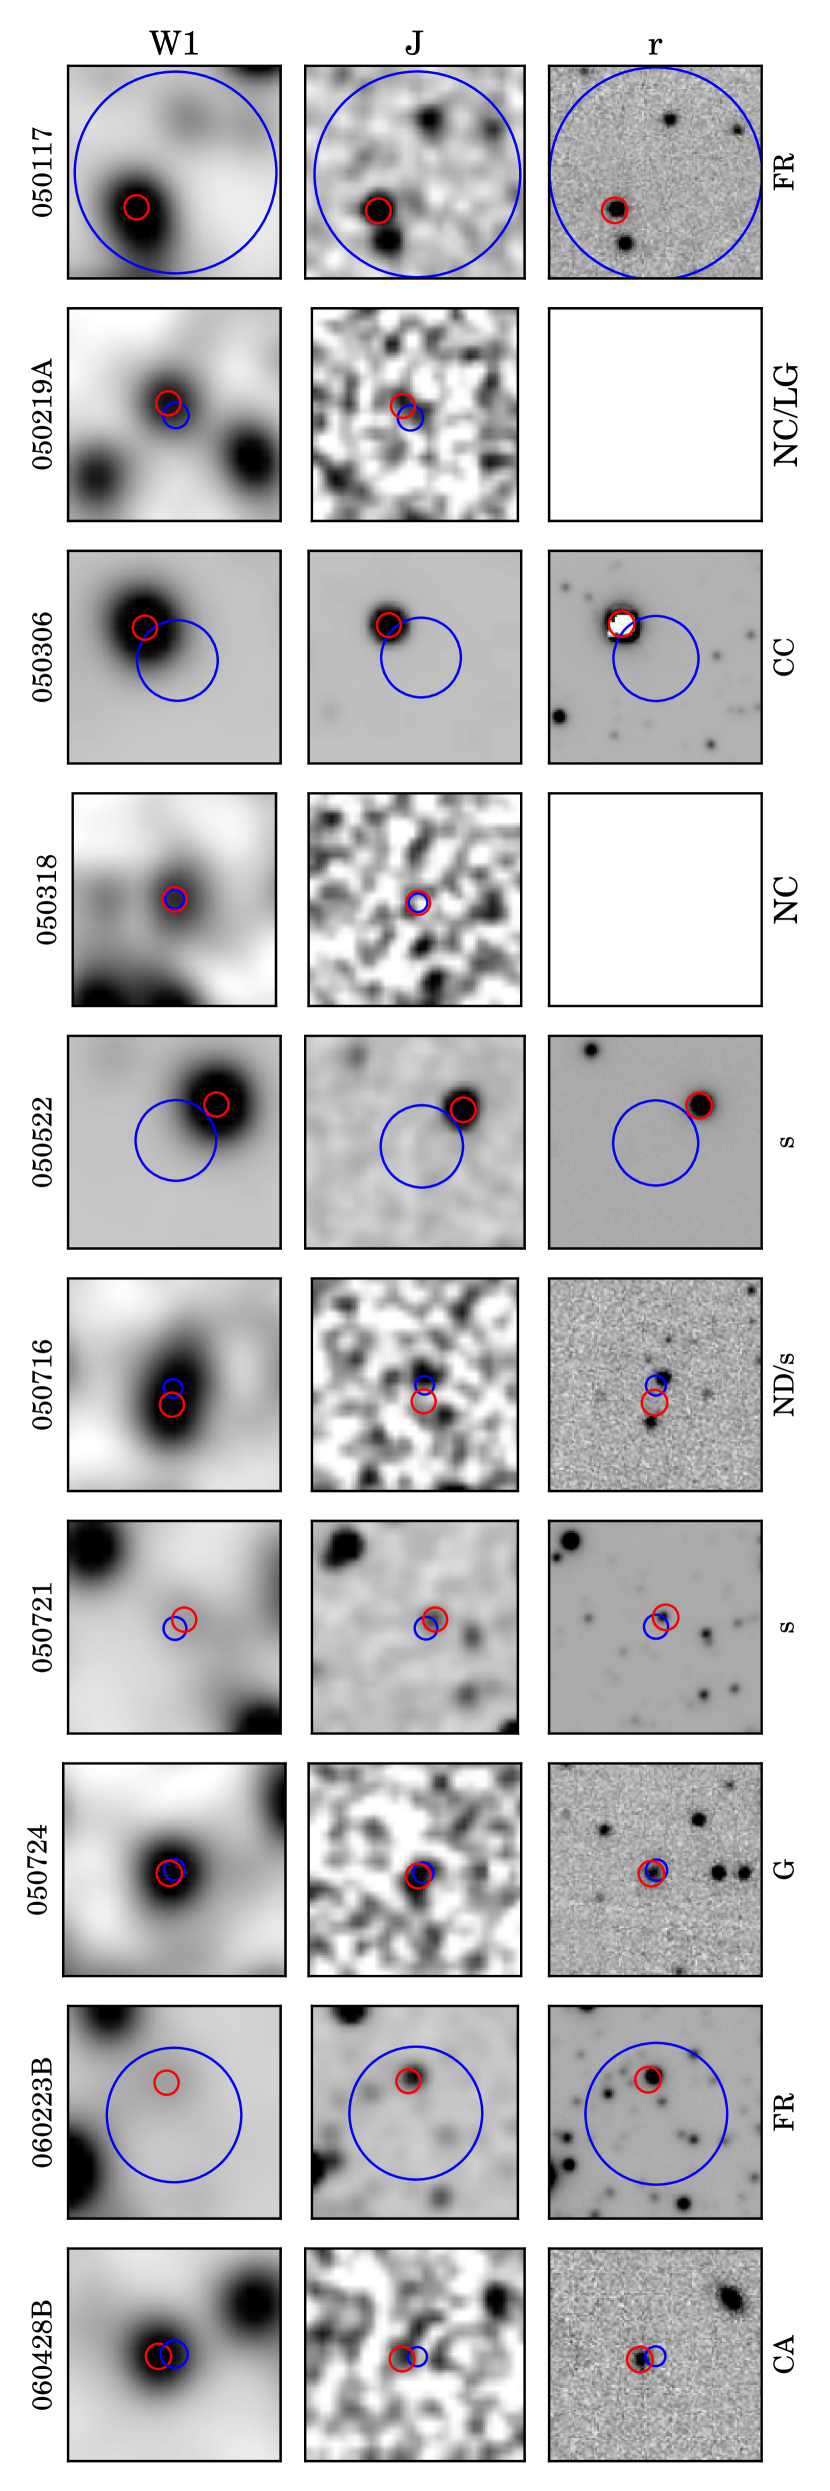
![[Uncaptioned image]](/html/1804.08971/assets/x20.png)
![[Uncaptioned image]](/html/1804.08971/assets/x21.png)
![[Uncaptioned image]](/html/1804.08971/assets/x22.png)
![[Uncaptioned image]](/html/1804.08971/assets/x23.png)
![[Uncaptioned image]](/html/1804.08971/assets/x24.png)
![[Uncaptioned image]](/html/1804.08971/assets/x25.png)