Dependence of light scattering properties on porosity, size and composition of dust aggregates
Abstract
In this work, we study the light scattering properties of dust aggregates () having a wide range of porosity ( = 0.59 to 0.98). The simulations are executed using the Superposition T-matrix code with BCCA, BA, BAM1 and BAM2 clusters of varying porosity. We investigate the nature and dependencies of the different scattering parameters on porosity, size and composition of the aggregated particles for wavelengths 0.45 m and 0.65 m. We find that the scattering parameters are strongly correlated with the porosity of the aggregated structures. Our results indicate that, when the porosity of the aggregates decreases, keeping characteristic radius of the aggregates () same for all structures, there is an enhancement in the negative polarization branch (NPB) which is accompanied by a substantial increase in the anisotropies present in the material. Also at the exact backscattering region, the anisotropies are found to be linearly correlated with the porosity of the aggregated structure. The computational study reveals that, for low absorbing materials (), the negative polarization minimum () is strongly correlated with the associated anisotropies. Finally, we put forward a qualitative comparison between our computationally obtained results and some selected data from the Amsterdam Light Scattering Database for both low and high absorbing materials. The experimental results also suggest that an increase in the NPB is always accompanied by an enhancement in the anisotropy at the backscattering region.
keywords:
Light scattering; Aggregates; Porosity; Modeling; T-matrix; Polarization; Depolarization; Anisotropy1 Introduction
The electromagnetic scattering of light by dust particles found in space has been studied widely using remote sensing and laboratory setups. The physical and chemical properties of cosmic dust particles provide useful evidence about the formation of the planetary system. Cosmic dust is a broader category of dust particles found in space which consists of cometary dust, interplanetary dust, interstellar dust and circumstellar dust particles. The interplanetary dust particles collected from the Earth’s stratosphere are found to have an irregular and porous structural arrangement [1, 2]. Laboratory simulations, microgravity experiments and computer simulations of IDPs, cometary dust and interstellar dust particles have been carried out to infer a better understanding of the properties of dust particles found in space. These earlier studies of cosmic dust reveal the dependencies of phase function and linear polarization on the scattering angle and wavelength for a variety of cosmic dust samples. Polarimetric study of comets and IDP reveal the existence of negative polarization branch in the backscattering region [3, 4, 5]. Laboratory experiments for the measurements of light scattering parameters for aerosols and cosmic dust indicate the presence of negative polarization branch in the backscattering region [6, 7]. To study the position and maximum of linear polarization of asteroids, the theoretical approach and modified T-matrix method were used by Petrov & Kiselev [15]. Their study showed that the value of phase angle maximum () strongly depends on the refractive index. They found that the increase of imaginary refractive index leads to increase in and , whereas the increase of the real part of the refractive index decreases .
Recently we have studied the light scattering properties of moderately large aggregates with a wide variation in porosity from 0.57 to 0.98. This study indicates that if cluster size parameter () is increased by increasing number of monomers () then compact clusters show more enhanced NPB compared to that of fluffy clusters whereas, an opposite trend is observed if is increased by changing the wavelength and keeping constant. We have also studied the correlation among , and (180°) with . A linear relation is found to exist among them [8]. We utilize this concept to explore the NPB and its dependencies on various physical parameters. This negative polarization, on the other hand proves the availability of silicate materials in the dust particles [9, 10, 11, 12]. It has been suggested that near field effect and the constructive interference of multiply scattered waves give rise to the phenomenon of negative polarization in dust particles though there is no direct evidence or reason behind the actual cause of negative polarization [13]. However, some of the recent studies revealed the dependence of anisotropy on the scattering angle for atmospheric dust particles [14]. Though anisotropy does not show notable changes for most of the particles in the backscattering region, yet for birefringent or for very low absorbing materials there are some significant variations which are worth studying.
In this paper, we investigate the nature and dependencies of the different scattering parameters on porosity, size and composition of the aggregated particles for wavelengths 0.45 m and 0.65 m. We will also explore how the negative polarization and anisotropy are correlated.
2 Aggregate dust model
Cosmic dust particles are composed of grains which are irregular in shape and whose porosity ranges from very high to very low. The interplanetary dust particles (IDPs) collected from Earth’s stratosphere have irregular shapes and fluffy structures, even the interstellar dust grains are also considered to be composed of such aggregate structures [16]. To model dust aggregates, porous and composite aggregates of small spheres (monomers) are generated using various aggregation schemes. Aggregates are created using the Monte-Carlo simulation by random hitting and sticking spheres together. If the process allows a single monomer to join a cluster of monomers, the aggregate is called Ballistic Particle Cluster Agglomeration (BPCA). And if the procedure permits clusters of monomers to stick together then the aggregate is called Ballistic Cluster Cluster Agglomeration (BCCA). BCCA and BPCA clusters are highly fluffy, and a lot of studies has been conducted using such clusters. The porosity of BCCA and BPCA clusters is given by 0.98 and 0.87. To extract the variation or dependence of the light scattering parameters of cosmic dust on the porosity of the dust particles, we need to consider a wide range of porosity from high to low. Shen et. al [17] developed three different types of cluster growth which have a wide range of porosity, from high porous (fluffy) to low porous (compact), such as Ballistic Agglomeration (BA), Ballistic Agglomeration with one migration (BAM1) and Ballistic Agglomeration with two migrations (BAM2). BA clusters are similar to the Ballistic Particle Cluster Agglomeration (BPCA) having porosity 0.86 and fractal dimension 3.0. BAM1 clusters are moderately porous with porosity 0.75, and BAM2 clusters are the least porous with porosity (0.59–0.64). In Fig. 1, we show structures of BA, BAM1, BAM2 aggregates.
These clusters are composed of spherical monomers having monomer radius . The radius of the equal volume sphere is thus given by [18],
| (1) |
The porosity of the cluster is defined by the equation:
| (2) |
where Rc is the characteristic radius of the cluster and it is related to and the filling factor by the following relation, .
The in situ measurements of comet Halley showed the presence of magnesium-rich silicates and carbonaceous materials [19], [20]. Even interplanetary dust particles are also composed of these materials [1]. Organic materials, amorphous and crystalline silicate materials are found in comets and IDPs [21]. Amorphous silicates are also found in interstellar and circumstellar medium and constitute 2/3 of the mass of the interstellar dust. A certain fraction of carbonaceous material is found in the interstellar grains[22]. The results obtained from the Rosetta mission on comet 67P/Churyumov-Gerasimenko indicates the existence of both silicate and organic materials [23, 24, 25]. Thus silicates and carbonaceous compounds are the main material constituents of comet dust.
In this study, we have considered two compositions, (i) amorphous forsterite (low absorbing) and (ii) amorphous carbon (high absorbing) which are most abundant in cosmic dust. The refractive indices for amorphous silicate are taken from Scott & Duley (1996) [26] having = and at = 0.45 m and 0.65 m respectively whereas the refractive indices for amorphous carbon are taken from Jenniskens (1993) [27] having = and at = 0.45 m and 0.65 m respectively. These values were already used by Deb Roy et al. [8] and Kolokolova et al. [28] in their dust modelling. The structural parameters used in this study are shown in Table 1.

| Aggregate | Structure | ||||||||
|---|---|---|---|---|---|---|---|---|---|
| # | (m) | (m) | (m) | (m) | () | () | |||
| BA | 1024 | 1,2,3 | 0.87 | 1.95 | 0.1 | 1.0 | 1.97 | 27.5 | 19.04 |
| 2048 | 1,2,3 | 0.86 | 1.95 | 0.036 | 0.46 | 0.9 | 12.57 | 8.70 | |
| BAM1 | |||||||||
| 2048 | 1,8 | 0.75 | 1.61 | 0.044 | 0.56 | 0.9 | 12.57 | 8.70 | |
| BAM2 | 128 | 10,12,14 | 0.59 | 1.34 | 0.1 | 0.5 | 0.67 | 9.35 | 6.48 |
| 256 | 12,15 | 0.63 | 1.39 | 0.1 | 0.63 | 0.88 | 12.3 | 8.5 | |
| 512 | 12,15 | 0.64 | 1.41 | 0.1 | 0.8 | 1.13 | 15.78 | 10.9 | |
| 1024 | 1,2,3 | 0.64 | 1.41 | 0.1 | 1.0 | 1.41 | 19.7 | 13.6 | |
| 2048 | 7,8 | 0.64 | 1.41 | 0.050 | 0.64 | 0.9 | 12.57 | 8.70 |
3 Numerical Simulations
The numerical calculations for this study are performed using multi-sphere T-matrix code (MSTM) [29] which gives exact solutions for an aggregate of homogeneous spheres. The MSTM code runs on both serial and distributed memory parallel processing systems. It uses memory and processor resources of the machine and allows for a wide range of calculations and output options without modification and recompilation of the code. MSTM uses message passing interface (MPI) commands to execute on distributed memory multiple processor high-performance computing facility. In these simulations, we have used the T-matrix code for a randomly oriented cluster of spheres.
The connection between the incident and scattered electromagnetic radiation is given by a 4 4 Mueller matrix. This matrix can be defined in a various way depending on the type of normalization. Here we use the scattering matrix S as,
where , , and are the Stoke’s parameters; is the wave number and is the distance from the particle to the observer. Sij are the orientationally averaged scattering matrix elements. In the present case, the incident light is considered to be unpolarized.
The numerical study presented in this paper revolves around the following five parameters which are defined by the different scattering matrix elements taken from Nousiainen et al. [14] and Bohren & Huffman [30].
-
(i)
Degree of linear polarization: The degree of linear polarization is denoted by which is a function of the scattering angle and is represented by,
.
-
(ii)
Phase function: It is represented by and the normalization condition for the phase function is
-
(iii)
Depolarization Ratio: This parameter is represented by and arises from the anisotropy relation , where and are the orientationally averaged scattering matrix elements. Depolarization ratio is calculated as,
-
(iv)
Difference parameter: It is represented by and arises from the anisotropy relation , where and are the orientationally averaged scattering matrix elements. This parameter is useful to detect birefringent targets. is defined by the relation
.
-
(v)
Linear Polarization Ratio: This parameter is represented by L and is defined by the equation,
4 Results
In our computations, we have considered two/three cluster realizations of a particular type of aggregate of homogeneous spheres (BA, BAM1 or BAM2) having the same and to reduce the variation in the porosity of the aggregates (see Table 1). The porosity along with its error for BA, BAM1 and BAM2 clusters with = 128, 256, 512, 1024 and 2048 are given in Shen et al. [17] (see Table 2 of that paper). It has been reported by many investigators that low absorbing particles show deeper negative branch of polarization (NPB) whereas high absorbing particles show almost negligible NPB [9, 32, 31, 18, 8]. Fig. 2(a) shows the variation in the degree of linear polarization, phase function, depolarization ratio and difference parameter for amorphous silicate and amorphous carbon at wavelengths 0.45 m and 0.65 m respectively for BA cluster having = 1024 and = 0.1 m. Fig. 2(b) shows the same variation for BAM2 cluster having = 1024 and = 0.1 m. From the figures, it is clear that the silicate particles show both negative and positive branch of polarization with high depolarization ratio and difference parameter which are not observed in the case of carbon particles. Hence in following sections, the study is mainly concentrated on amorphous silicate particles.


.
4.1 Effect of porosity
The porosity of an aggregated structure of dust particles depends on the size, shape, and mixture of grains. With increasing grain size, the porosity of an aggregate shall increase according to equation (2). On the other hand, when and are kept constant, the porosity of the aggregate shall decrease with increasing . As the scattering cross-section depends on aggregate size, the effect of porosity shall be the dominant feature when and are kept constant. The apparent effect of increasing monomer size is mainly the effect of varying or as studied by Shen et al. [17]. In this section, we study the effect of porosity on different parameters linear polarization, phase function, depolarization ratio, linear polarization ratio and difference parameter. The light scattering properties of moderately large dust aggregates was studied by our group recently [8] with a wide range of porosity from 0.57 to 0.98. We found a strong correlation of , and (180°) with porosity (). It is found that and (180°) increases linearly with decreasing porosity, whereas decreases linearly.
In our calculations we have used BCCA, BA, BAM1 and BAM2 aggregates which have porosities in the decreasing order from high to low. To minimize the effect of aggregates size, we have kept the number of monomers and characteristic size of the aggregates constant. The calculations are carried out for = 2048 and = 0.9 m.
As silicate particles show significant degree of negative polarization in the backscattering region, we have studied the effect of porosity for amorphous silicate having refractive index at = 0.45 m.
In the above calculations, the porosities for BCCA, BA, BAM1 and BAM2 are maintained by keeping and constant and by increasing . As is kept constant the effect of becomes dominant over changing monomer size.


4.1.1 Effect of on
Fig. 3(a) depicts the change in linear polarization and phase function due to changing porosity from BCCA BA BAM1 BAM2 for = 2048. shows a decreasing trend with decreasing porosity where particles with high porosity (BCCA) have a high value of polarization, and particles with low porosity (BAM2) have the lowest value of polarization. Thus we can say, with decreasing porosity the positive branch of polarization decreases significantly.
On the other hand intensifies with decreasing porosity, where BA particles show a negligibly small amount of negative polarization (NP), BAM1 particles show a bit intense NP and the highest NP is observed in the case of BAM2 particles. Thus there is a very smooth increase in NP with decreasing porosity. It is to be noted that BCCA particles do not show negative polarization in this case.
The decrease in with decreasing porosity can be attributed to the increased electromagnetic interaction among the scatterers as with decreasing porosity the grain grain distance reduces and the coverage of the single wavelength increases which enhances the electromagnetic intensity.
4.1.2 Effect of on S11
Fig. 3(b) shows the change in with decreasing porosity for =2048. In this case, a significant increase in S11(180°) is observed with decreasing porosity, where (180°) for BCCA is the lowest, and for BAM2 we have the highest value of . Hence porosity plays a key role in increasing or decreasing the (180°). As (180°) is directly proportional to the geometric albedo, with decreasing porosity, we must expect a significant increase in geometric albedo with decreasing porosity.
4.1.3 Effect of on
Fig. 4(a) shows the change in depolarization ratio () with decreasing porosity for =2048. In this cases we observe an increase in the depolarization ratio with decreasing porosity where, BCCA particles show minimum (180°), and BAM2 particles show maximum (180°).
4.1.4 Effect of on L
Fig. 4(b) shows the change in linear polarization ratio (L) with decreasing porosity for =2048. In this case, the linear polarization ratio at 180∘ (L(180°)) increases with decreasing porosity. In the backscattering region, the curves develop a depression with decreasing porosity and the depression is strongest for BAM2 particles.
4.1.5 Effect of on
Fig. 4(c) shows the change in the difference parameter () with decreasing porosity for =2048. The change in is non-monotonous in the forward scattering region. But in the backscattering region, the magnitude of increases with decreasing porosity. As the porosity decreases a peak develops in the backscattering region and the peak is sharpest for the least porosity i.e., BAM2 particles.


4.1.6 Dependence of light scattering parameters on porosity
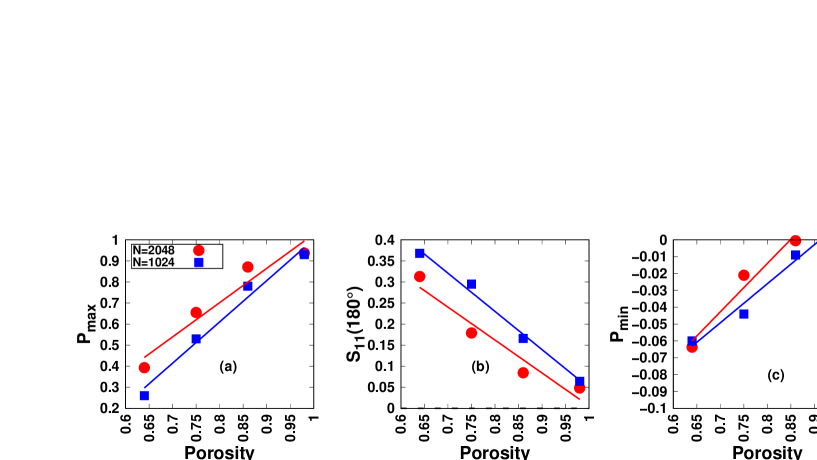
In this subsection we study the dependence of different parameters (, , , , L, , and polarimetric slope, ) on porosity () for the aggregates considered above having N=2048 and Rc=0.9 m for silicate composites at wavelength =0.45 m. We compare the variation of (180°), (180°) and (180°) with from our results, with those obtained by Deb Roy et al. (2017) for , R m as shown in Fig. 5. The results are almost identical as in both the cases (180°), (180°) and (180°) are linearly correlated with . Hence we further try to explore the dependence of (180°), L(180°) and (180°) on as shown in Fig. 6. We find that at the exact backscattering region, (180°), L(180°) and (180°) decreases linearly with increasing .
We now study the variation of scattering angle of the negative polarization minimum (), angle of inversion (), and polarimetric slope () for four considered aggregates (shown in Fig. 3(a)) with porosity (). Instead of considering the usual polarimetric slope, we give two slopes which correspond to the intervals of scattering angles and . The results obtained from Fig. 3 are now plotted in Fig. 7. Since negative polarization is not found for BCCA cluster, three data points are plotted in case of Fig. 7(i). It is observed that is 170∘ for BAM2 and BAM1 cluster, but 175∘ in case of BA. Further, increases almost linearly when the porosity of aggregates is increased from 0.64 to 0.98 (see Fig. 7(ii)). The polarimetric slope () is negative and increases in magnitude with increasing porosity for . The slope remains almost same for .
Our findings suggest that as the aggregate becomes more compact, and increase along with the substantial increase in the NPB. Since compact cluster BAM2 shows deep or intense NPB, so we will mainly concentrate on BAM2 cluster for the study of NPB in the following sections.


4.2 Dependence on
In this section, we study the effect of number of monomers () on the different light scattering parameters for silicate particles with BAM2 structure at wavelengths = 0.45 m and 0.65 m. The monomer size is kept constant at 0.1 m and the number of monomers is varied from 128 256 512 1024 2048. Fig. 8 shows the change in linear polarization, phase function, depolarization ratio and difference parameter with increasing number of monomers () for = 0.45 m and 0.65 m respectively due to amorphous silicate particles. The positive branch of polarization decreases with increasing number of monomers (). When is increased from 128 to 2048, a single wavelength covers more particles which increases the EM interaction among the particles. Hence there is an increase in the scattered intensity which in turn decreases the positive branch of polarization. This increase in intensity increases the depolarization effect, which shows a significant increasing trend in .
In Fig. 9, we have shown the dependence of Pmin, D, and on for amorphous silicate BAM2 clusters of N = 128, 256, 512, 1024 and 2048 respectively, having am = 0.1 m for wavelengths = 0.45 m and 0.65 m. The amplitude of the negative polarization () (see Fig. 9(a)) shows a non-monotonous nature with increasing . As the number of monomers are increased, the arrangement of monomers changes, which in turn changes the interference pattern of multiply scattered waves randomly for each set of and hence there is a non-monotonous nature in NPB [10]. However, the magnitude of increases with increase in (see Fig. 9(b)). It is interesting to observe that increases linearly when is increased from 128 to 2048 at both the wavelengths (see Fig. 9(c)). Also, increases almost linearly with increase in (see Fig. 9(d)).
4.3 Dependence on
In this case, we have considered a single BAM2 structure having number of monomers = 2048 for the study of light scattering properties of aggregated dust particles with the variation of monomer radius . Fig. 10 shows the change in the degree of linear polarization, phase function, depolarization ratio and difference parameter with increasing monomer radius = 0.03 m to 0.11m having step size 0.02 m for wavelengths = 0.45 m and 0.65 m respectively. The positive branch of polarization shows an abrupt decreasing trend with increasing . With increasing the scattering cross-section of the aggregate increases due to which the electro-magnetic interaction among the particles in the neighborhood increases. This in turn increases the scattering intensity as shown in Fig. 10 where phase function shows an increasing trend with increasing . This increase in phase function increases the depolarization and hence there is a decrease in the positive branch of polarization.

We now study the dependence of Pmin, D, and on and is shown in Fig. 11. The magnitude of initially increases with increase of and then a slight non-monotonous nature is noticed (see Fig. 11(a)). The magnitude of D gradually decreases with increase in (see Fig. 11(b)). We also find that increases with increase in and a strong linear correlation between them is observed (see Fig. 11(c)). Further is also found to increase with increase in (see Fig. 11(d)).

4.4 Correlation between and
In this section, we will study how and are correlated to each other. We will mainly study the effects on negative polarization and anisotropy due to variation in complex refractive indices (‘’ and ‘’) for = 0.45 and 0.65 m respectively having monomer size = 0.1 m and = 256 BAM2 cluster. Fig. 12 shows the variation of and with increasing values of for = 0.001, = 256 and = 0.1 m. The variation of is very small when is increased from 1.5 to 1.7. On the other hand the values of remains close to that of for 1.7 and beyond = 1.7 the values start to deviate. The real part of the refractive index for amorphous silicate used in the previous sections exist between = 1.6 to 1.7, and the imaginary part of the refractive index lies between 0.001 to 0.01. Hence we study the effect of on the same cluster having same monomer radius for = 1.6, 1.65 and 1.7. Fig. 13 shows the variation of , , and with increasing from 0.001 to 0.1 for = 1.6, 1.65 and 1.7 respectively. When is increased from 0.001 to 0.1, increases, whereas the magnitudes of (180°), (180°) and (180°) decrease. On the other hand, when increased from 1.6 to 1.7, there is a substantial decrease in , notable increase of (180°), and (180°) and negligible change in (180°). Finally, Fig. 14 depicts the effect on and due to varying and for = 0.45 m and 0.65 m. We observe that the magnitude of and remains constant at = 0.45 m when and then starts decreasing. However the magnitude of remains almost constant for all values of at = 0.65 m. Thus the real part of the refractive index plays a crucial role in enhancing the anisotropy as well as the negative polarization in the backscattering region.


The negative polarization is a unique phenomenon, observed in certain types of materials having imaginary refractive index . Earlier studies claimed that NPB may arise from the internal arrangement of particles where the radiation field is inhomogeneous and the amplitude, phase and the propagation direction changes randomly [13]. In amorphous solids or glasses, the phenomenon of birefringence arises from the anisotropy present in the molecular structure and such birefringence is called structural birefringence [34]. It is to be noted that determines the presence of birefringent material [14]. To study how birefringence and negative polarization are correlated to each other, we plot versus : keeping fixed and varying , and keeping fixed and varying . The plots are shown in Figs. 15 and 16 for = 0.45 m. A strong correlation between and is noticed in both the cases. It can be seen from Fig. 15 that the amplitude of negative polarization () decreases with the decrease of , when is fixed at some value (1.6, 1.65 or 1.7) and is increased from 0.001 to 0.1. In Fig. 16, we observe that and can be fitted by a quadratic regression equation when is increased from 1.5 to 1.7 and is fixed at some value (0.001, 0.0025, 0.005 or 0.0075). It is also important to mention that the change in is higher in Fig. 16 as compared to Fig. 15. It suggests that the effect of anisotropy is more significant when real part of the refractive index is changing from 1.5 to 1.7 and absorptive index is kept constant at some low values. The similar nature is observed at = 0.65 m (figures are not shown). Thus it is clear from our study that the difference parameter (which resembles anisotropy) is affected by the change in real part of the refractive index of the particles () which in turn affects the negative polarization.


5 Experimental verification
In this study, we have mainly used BAM2 clusters to investigate the nature and origin of negative polarization which is observed in cosmic dust particles. To do so, we have considered the difference parameter which is a measure of anisotropy and is used to detect birefringent materials. Our results indicate a dependence of negative polarization on the difference parameter, which is clearly visible in Figs. 15 and 16, where with increasing there is a significant increase in in the backscattering region is observed. Even the sharpness of the peak increases gradually. Again for low absorbing materials both negative polarization, as well as , are very much distinct where as for high absorbing materials both the quantities disappear. In order to verify the above findings, we have considered experimental data of both low and high absorbing materials from the Amsterdam Light Scattering Database [7] to put forward a qualitative comparison between the nature of NPB and in case of our results and those obtained from the experimental database. Fig. 17(a),(b) represents the variation of the degree of linear polarization and for allende [35], green clay [36], olivine [35] and forsterite [37] from the Amsterdam Light Scattering Database. Table-2 shows the physical and chemical morphologies of the above materials considered in the experiment. Apart from the Amsterdam Light Scattering Database, PROGRA2 experiment also provides a large database of linear polarization and phase function for silicates and other materials. As PROGRA2 experiment does not provide the scattering matrix elements , and which are the essentials elements to calculate the anisotropy, so we have considered only the Amsterdam Light Scattering Database in our study. In the backscattering region, with increasing negative polarization there is an increase in magnitude and sharpness of the , which is in agreement with our findings for low absorbing materials. Fig. 17(c),(d) depict the variation of linear polarization and difference parameter for hematite [38] which is a high absorbing material. In this case we find negligible negative polarization and which is again in agreement with our findings for high absorbing materials.

| Material | Chemical formula | |||
|---|---|---|---|---|
| (m) | ||||
| Alende | 1.65 - 0.001 | 0.8 | 3.3 | |
| Green clay | 1.5-1.7 - 0.001-0.00001 | 1.55 | 1.8 | |
| Olivine | 1.62 - 0.00001 | 1.3 | 1.3 | |
| Forsterite | 1.63 - 0.0000 | 1.3 | 3.1 | |
| Hematite | 3.0 - 0.1-0.01 | 0.4 | 0.6 |
6 Summary
-
(i)
The variation in the light scattering parameters , , and is more prominent in case of amorphous silicate as compared to amorphous carbon.
-
(ii)
The porosity of a material plays a key role in enhancing the negative branch of polarization. For a particular characteristic radius (which is ), BCCA cluster shows high and low whereas BAM2 cluster shows low and high . On the other hand as porosity decreases, the anisotropy inside the material increases which is observed in two parameters & . The values of & are lowest for BCCA cluster and highest for BAM2.
-
(iii)
At the exact backscattering region, (180°), L(180°) and (180°) decreases linearly with increasing , when the characteristic radius of the aggregates () are taken to be same for all structures.
-
(iv)
, and polarimetric slope () are strongly correlated with the porosity of the aggregates.
-
(v)
The light scattering parameters show a certain amount of variation with increasing monomer number (). With increasing from 128 256 512 1024 2048, the value of decreases from 0.30 to 0.18 for = 0.45 m and 0.40 to 0.26 for = 0.65 m. shows a non-monotonous nature whereas and increase with increase in . When is increased from 128 to 2048, (180°) and increase linearly with .
-
(vi)
The maximum variation in the light scattering parameters is observed when is increased from 0.03 m to 0.11 m (keeping constant at 2048) for BAM2 cluster. With increasing , the value of decreases from 0.59 to 0.14 for = 0.45 m and 0.69 to 0.22 for = 0.65 m. The phase function at the exact backscattering region (180°) increases from 0.13 to 0.51 for = 0.45 m and 0.08 to 0.43 for = 0.65 m. The value of shows an abrupt increase from 0.26 to 0.85 for = 0.45 m and 0.14 to 0.62 for = 0.65 m with increasing . Also the magnitudes of or (180°) show an increasing trend with increasing . Further is also found to increase with increase in .
-
(vii)
The real part of the refractive index is another parameter which enhances the anisotropy as well as the negative polarization in the backscattering region for low absorbing particles. We have also found that and are strongly correlated to each other when is varied from 1.5 to 1.7 and is fixed at some values (0.001, 0.0025, 0.005 or 0.0075) resembling the low absorbing particles. Our study shows that the difference parameter (which resembles anisotropy) is affected by the change in real part of the refractive index of the particles () which in turn affects the negative polarization.
-
(viii)
A qualitative comparison between our computationally obtained results and some selected data from the Amsterdam Light Scattering Database for both low and high absorbing materials are made. The experiment results also suggest that an increase in the NPB is always accompanied by an enhancement in the anisotropy at the backscattering region.
Acknowledgements
We acknowledge Daniel Mackowski and Michael Mishchenko, who made their Multi-sphere T-matrix code publicly available. We also acknowledge Bruce T. Draine who made BA, BAM1 and BAM2 clusters publicly available in his website. The anonymous reviewers of this paper are highly acknowledged for their comments and suggestions. This work is supported by the Science and Engineering Research Board (SERB), a statutory body under Department of Science and Technology (DST), Government of India, under Fast Track scheme for Young Scientist (SR/FTP/PS-092/2011). The author P. Deb Roy also wants to acknowledge DST INSPIRE scheme for the fellowship. Part of the computations presented in this publication have been carried out using the High Performance Computing (HPC) facility at IUCAA, Pune. We also acknowledge HPC centre of NIT Silchar in collaboration with C-DAC Pune, where some part of computations were performed.
References
- [1] Brownlee D.E., Cosmic dust: collection and research, Ann. Rev. Earth Planet. Sci., 13 (1985) 147
- [2] Warren J.L., Barrett R.A., Dodson A.L., Watts L.A., & Zolensky M.E., Cosmic Dust Catalog, Nasa Johnson space center, 14 (1994)
- [3] Hadamcik E., Levasseur-Reourd A.C., Imaging polarimetry of cometary dust: different comets and phase angles, JQSRT, 79-80 (2003) 661-678
- [4] Das H.S., Medhi B.J., Sebastian W., Bertrang G., Deb Roy P. & Chakraborty A., Polarimetric studies of Comet C/2009 P1 (Garradd), Mon Notice R Astron Soc., 436 (2013) 3500
- [5] Deb Roy P., Das H.S. & Medhi B.J.,Imaging polarimetry of Comet C/2012 L2 (LINEAR), Icarus, 245 (2015) 241
- [6] Hadamcik E., Renard J.B., Rietmeijer F.J.M. , Levasseur-Regourd A.C., Hill H.G.M., Karner J.M., Nuth J.A., Light scattering by fluffy Mg-Fe-SiO and C mixtures as cometary analogs (PROGRA 2 experiment), Icarus, 190 (2007) 660
- [7] Muñoz O., Moreno F., Guirado D., Dabrowska D.D., Volten H. & Hovenier J.W., The Amsterdam-Granada Light Scattering Database, JQSRT, 113 (2012) 565-574
- [8] Deb Roy P., Halder P., Das H.S., Study of light scattering properties of dust aggregates with a wide variation of porosity, Astrophysics Space Sci., 362 (2017) 209
- [9] Kimura H., Kolokolova L. & Mann I., Light scattering by cometary dust numerically simulated with aggregate particles consisting of identical spheres, A & A., 449 (2006) 1243
- [10] Petrova E.V., Tishkovets V.P., Jockers K., Polarization of Light Scattered by Solar System Bodies and the Aggregate Model of Dust Particles, Solar System Res., 38 (2004) 309
- [11] Das H.S., Das S.R., Paul T., Suklabaidya A. & Sen A.K., Modelling the polarization properties of Comet 1P/Halley using a mixture of compact and aggregate particles, Mon Notice R Astron Soc., 389 (2008) 787
- [12] Das H.S., Das S.R. & Sen A.K., Aggregate dust model to describe polarization properties of Comet Hale-Bopp, Mon Notice R Astron Soc., 390 (2008) 1195
- [13] Tishkovets V., Litvinov P., Petrova E., Jockers K. & Mischenko M.: Photopolarimetry in Remote Sensing., Videen G., Yatskiv Y., & Mishchenko M., Eds. Kluwer Academic Publishers, (2004) 221-242.
- [14] Nousiainen T., Zubko E., Lindqvist H., Kahnert M., & Tyynela J., Comparison of scattering by different nonspherical wavelength-scale particles, J. Quant. Spectrosc. Ra., 113 (2012) 2391.
- [15] Petrov, D. & Kiselev, N. Computer simulation of position and maximum of linear polarization of asteroids. J. Quant. Spectrosc. Ra. 2018; 204; 88–93.
- [16] Mathis J. S., Rumpl W., & Nordsieck K. H., Interstellar and cometary dust, Lunar and Planetary Inst., (1989) 48-49
- [17] Shen Y., Draine B.T. & Johnson E.T., Modelling porous dust grains with ballistic aggregates. I. Geometry and optical properties, ApJ, 689 (2008) 260
- [18] Shen Y., Draine B.T. & Johnson E.T., Modelling porous dust grains with ballistic aggregates. II. Light scattering properties, ApJ, 696 (2009) 2126
- [19] Jessberger E.K., Christoforidis A. & Kissel J., Aspects of the major element composition of Halley’s dust, Nature., 332 (1988) 691-695
- [20] Jessberger E.K., Rocky Cometary Particulates: Their Elemental, Isotopic and Mineralogical Ingredients, Space Sci. Rev.,90 (1999) 91-97
- [21] Rietmeijer F.J.M, Nakamura T., Tsuchiyama A., Uesugi K., Nakano T. & Leroux H., Origin and formation of iron silicide phases in the aerogel of the Stardust mission, Meteoritics & Planetary Science, 43 (2008) 121-134
- [22] Draine B.T., Scattering by Interstellar Dust Grains. II. X-Rays, ApJ., 598 (2003) 1026
- [23] Schulz R., Hilchenbach M., Langevin Y., et al., Comet 67P/Churyumov-Gerasimenko sheds dust coat accumulated over the past four years, Nature, 518 (2015) 216
- [24] Capaccioni F., Carodini A., Filacchione G., Erard S., Arnold G., et al., Cometary science. The organic-rich surface of comet 67P/Churyumov-Gerasimenko as seen by VIRTIS/Rosetta, Science, 347 (2015) 6220
- [25] Goesmann F., Rosenbauer H., Bredehft J.H., Cabane M., Ehrenfreund P., et al., Organic compounds on comet 67P/Churyumov-Gerasimenko revealed by COSAC mass spectrometry, Science, 349 (2015) 6247
- [26] Scott A., Duley W.W., Ultraviolet and Infrared Refractive Indices of Amorphous Silicates, ApJS, 105 (1996) 401
- [27] Jenniskens P., Optical constantas of organic refractory residue, A & A, 274 (1993) 653
- [28] Kolokolova L., Das H. S., Dubovik O., Lapyonok T., Yang P., Polarization of cosmic dust simulated with the rough spheroid model, PSS, 116 (2015) 30-38
- [29] Mackowski D.W. & Mischenko M.I., A multiple sphere T-matrix Fortran code for use on parallel computer clusters, J. Quant. Spectrosc. Ra., 112 (2011) 2182
- [30] Bohren, C.F. & Huffman, D.R., Absorption and scattering of light by small particles, John Wiley & Sons, New York, (1983)
- [31] Lasue J., Levasseur-Regourd A.C., Hadamcik E. & Alcouffe G., Cometary dust properties retrieved from polarization observations: Application to C/1995 O1 Hale Bopp and 1P/Halley, Icarus, 199 (2009) 129-144
- [32] Bertini I., Thomas N., Barbieri C., Modeling of the light scattering properties of cometary dust using fractal aggregates, A&A, 461 (2007) 351
- [33] Hanner M.S., Giese R.H., Weiss K., Zerull R., On the definition of albedo and application to irregular particles, A & A, 104 (1981) 42-46
- [34] Raman C.V., Structural birefringence in amorphous solids, Proc. Ind. Acad. Sci., 31A (1950) 141
- [35] Muñoz O., Volten H., de Haan J.F., Vassen W. & Hovenier J.W., Experimental determination of scattering matrices of olivine and Allende meteorite particles, A & A, 360 (2000) 777
- [36] Muñoz O., Volten H., de Haan J.F., Vassen W. & Hovenier J.W., Experimental determination of scattering matrices of randomly oriented fly ash and clay particles at 442 and 633 nm, Journal of Geophysical Research, 106 (2001) 833
- [37] Volten H., Muñoz O., Brucato J.R., Hovenier J.W., Colangeli L., Waters L.B.F.M. & van der Zande W.J., Optical and infrared properties of forsterite particles, JQSRT, 100 (2006) 429
- [38] Muñoz O., Volten H., Hovenier J.W., Min M., Shkuratov Y.G., Jalava J.P., van der Zande W.J. & Waters L.B.F.M., Experimental and computational study of light scattering by irregular particles with extreme refractive indices: hematite and rutile, A & A, 446 (2006) 525