Cluster-induced Deagglomeration in Dilute Gravity-driven Gas-solid Flows of Cohesive Grains
Abstract
Clustering is often presumed to lead to enhanced agglomeration between cohesive grains due to the reduced relative velocities of particles within a cluster. Our discrete-particle simulations on gravity-driven, gas-solid flows of cohesive grains exhibit the opposite trend, revealing a new mechanism we coin “cluster-induced deagglomeration.” Specifically, we examine relatively dilute gas-solid flows, and isolate agglomerates of cohesive origin from overall heterogeneities in the system – i.e., agglomerates of cohesive origin and clusters of hydrodynamic origin. We observe enhanced clustering with an increasing system size (as is the norm for noncohesive systems) as well as reduced agglomeration. The reduced agglomeration is traced to the increased collisional impact velocities of particles at the surface of a cluster – i.e., higher levels of clustering lead to larger relative velocities between the clustered and nonclustered regions, thereby serving as an additional source of granular temperature. This physical picture is further evidenced by a theoretical model based on a balance between the generation and breakage rates of agglomerates. Finally, cluster-induced deagglomeration also provides an explanation for a surprising saturation of agglomeration levels in gravity-driven, gas-solid systems with increasing levels of cohesion, as opposed to the monotonically increasing behavior seen in free-evolving or driven granular systems in the absence of gravity. Namely, higher cohesion leads to more energy dissipation, which is associated with competing effects: enhanced agglomeration and enhanced clustering, the latter of which results in more cluster-induced deagglomeration.
Due to the dissipative nature of solid-solid and fluid-solid interactions, granular and gas-solid flows develop hydrodynamic instabilities that lead to clusters: local regions of high solid concentration Goldhirsch and Zanetti (1993); Glasser et al. (1998); Wylie and Koch (2000); Agrawal et al. (2001); Brilliantov et al. (2004); Aranson and Tsimring (2006); Mitrano et al. (2013); Yin et al. (2013); Fullmer and Hrenya (2017), which are absent in molecular fluids. Inter-particle cohesion, such as van der Waals force Castellanos (2005), liquid-bridging Herminghaus (2005); Mitarai and Nori (2006) and electrostatics Pahtz et al. (2010); Lee et al. (2015), enhances energy dissipation during particle collisions Thornton and Yin (1991); Gollwitzer et al. (2012), causing the formation of agglomerates Royer et al. (2009); Waitukaitis et al. (2011). Unlike the loose collection of particles characterizing clusters, agglomerates refer to particles held together in enduring contacts by cohesion Horio and Clift (1992). Both clustering and agglomeration significantly impact reaction rates, momentum, heat and mass transfer in multiphase flows Fullmer and Hrenya (2017).
Here, we aim to understand the interplay between clusters and agglomerates. For granular systems (no fluid) without gravity, the formation of clusters enhances agglomeration. Namely, in both free-evolving Ulrich et al. (2009); Murphy and Subramaniam (2015); Singh and Mazza (2018) and driven Blair and Kudrolli (2003a); Weber et al. (2004); Takada et al. (2014) systems, particles in clusters have higher collision frequency due to the increased local number density. Therefore, the collisional impact velocities (relative particle velocities prior to collisions) of particles in clusters decay faster than particles in the surrounding, less-dense regions Losert et al. (1999); Goldhirsch (2003). With reduced impact velocities, particles are more likely to agglomerate upon collision Kantak and Davis (2004); Donahue et al. (2010). Moreover, the rapid energy dissipation within clusters results in a pressure gradient across the cluster interface which promotes the migration of free particles towards clusters Goldhirsch and Zanetti (1993); Miller and Luding (2004), further increasing the cluster size and thus the possibility of agglomeration.
In this Letter, we study the relationship between clustering and agglomeration in dilute gas-solid flows of lightly cohesive particles in unbounded fluidization via discrete-particle simulations. Unlike granular systems under zero gravity, gas-solid flows are driven by gravity and have two additional sources of clustering beyond dissipative particle collisions Fullmer and Hrenya (2017): relative motion between gas and solid phases (mean drag) Agrawal et al. (2001) and dissipation of granular energy due to gas viscosity (thermal drag) Wylie and Koch (2000). We report an unexpected response of agglomerates to increasing system size. Namely, analogous to fluid turbulence, the level of clustering increases with system size, as is also observed in non-cohesive systems Capecelatro et al. (2016). However, unlike granular systems, the clustering in gas-solid systems does not enhance agglomeration; instead, the degree of agglomeration reduces with increased system size. This observation is surprising since particles within a cluster are characterized by reduced impact velocities, which favor enhanced agglomeration. Based on an analysis of particle velocities, we uncover the physical mechanism for this surprising behavior - cluster-induced deagglomeration - and establish an analytical model to predict the resulting degree of agglomeration. We then demonstrate the robustness of the mechanism at higher cohesion levels.
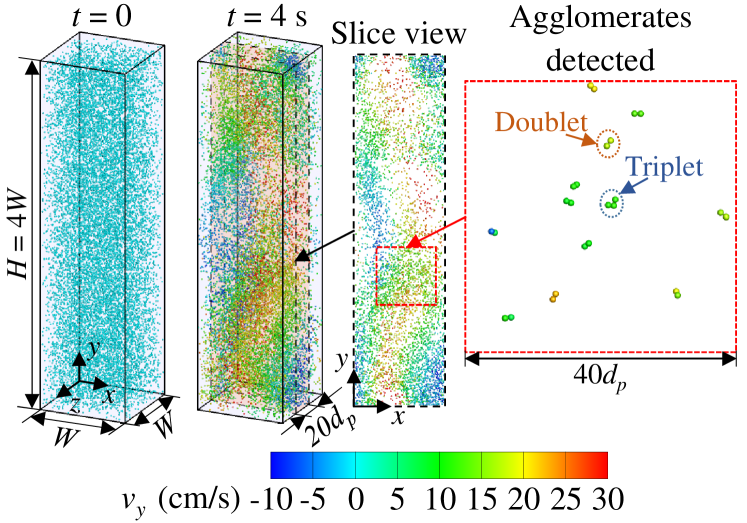
Following our recent work Liu et al. (2017a), unbounded fluidization Fullmer and Hrenya (2017) is simulated in a fully periodic domain with a square cross-section (Fig. 1) via coupled computational fluid dynamics and discrete element method (CFD-DEM). Compared with no-slip side walls, the periodic domain removes bulk shear in the mean flow, thereby isolating the mechanism of deagglomeration associated with clusters. In CFD-DEM, particle trajectories are integrated via Newton’s equations of motion, where the contact forces between particles are related to particle overlap Cundall and Strack (1979); Brilliantov et al. (1996); Pöschel and Schwager (2005); Antypov and Elliott (2011). For computational simplicity and convenient control of cohesion level, a constant cohesion is applied during physical contact of particles (i.e. “square-force” cohesion model with zero cut-off distance Liu et al. (2018)), following previous studies Waitukaitis et al. (2011); Kobayashi et al. (2013). We recently demonstrated Liu et al. (2018) that this square-force cohesion model is a valid surrogate of more rigorous models where cohesion may depend on interparticle separation, surface morphologies, etc. Hamaker (1937); Johnson et al. (1971); Derjaguin et al. (1975); Rumpf (1990); Rabinovich et al. (2000a, b) The gas phase governed by the Navier-Stokes equations is solved using a cell size equal to two particle diameters Tsuji et al. (1993); Xu and Yu (1997); van der Hoef et al. (2008). The gas and solid phases are coupled via a local, solid-concentration-dependent drag law established from direct numerical simulations Hill et al. (2001a, b); Benyahia et al. (2006). The open-source solver MFiX Syamlal et al. (1993) is used to perform the simulations. Details on the numerical method are available elsewhere Liu et al. (2017a). In the simulations, the incompressible gas has density kgm3 and viscosity = Pas. Particles are frictionless solid spheres with diameter m, density kgm3, restitution coefficient = 0.97, Young’s modulus MPa and Poisson’s ratio . Except where noted, a cohesion force nN is applied. To study the effect of system size, we vary the domain width and height in proportion, with constant aspect ratio (see Fig. 3d). In simulations with and independently varied, flow properties show larger sensitivity to increasing than , which is associated with flow anisotropy (see Supplemental Materials). The overall solid concentration = 0.01, corresponding to particle number count from 2,062 to 101,680 as varies from to ( from to ). Particles are initially at rest and randomly placed throughout the domain. Gas flows in the upward direction (-direction in Fig. 1) at a constant superficial velocity 43 cm/s. As time evolves, particles accelerate until they reach the terminal velocity, or statistical steady state. Our following analysis focuses on steady-state properties, i.e. time-averaged data over 1-4 s. (Note that varying does not affect the steady-state gas-solid slip velocity or the levels of clustering and agglomeration, see Supplemental Materials.)
It is worth noting that the flow regime examined here corresponds to that in typical risers Agrawal et al. (2001), with particle Reynolds numbers and mean-flow Stokes number , where is the particle terminal velocity in undisturbed fluid flow Garzó et al. (2012); Tenneti and Subramaniam (2014). Therefore, fluid inertia and viscosity play a secondary role to particle inertia such that the flow, and more specifically agglomeration and breakage, is characterized by solid collisions Koch and Hill (2001); Fullmer and Hrenya (2017). The current system therefore differs from common liquid-solid suspensions with much lower Stokes numbers () Caflisch and Luke (1985); Nicolai and Guazzelli (1995); Segre et al. (1997); Yin and Koch (2008), where deagglomeration in dilute suspensions is largely due to the solid-liquid interactions Lick and Lick (1988); Burban et al. (1989); Stolzenbach and Elimelech (1994); Winterwerp (1998); Higashitani et al. (2001); Grabowski et al. (2011); Babler et al. (2015); Watanabe (2017); Njobuenwu and Fairweather (2018). Examples of such low-Stokes systems are cohesive sediment transport Winterwerp and Kesteren (2004); Burchard et al. (2018). Furthermore, the effect of cluster-induced turbulence, which refers to the generation of gas-phase turbulence due to coupling with the solid phase (Capecelatro et al. (2014, 2015, 2016)), is light in our systems. Namely, the estimated ratio of turbulent viscosity associated with single-particle-induced turbulence (PIT) to gas viscosity (= 0.008) is much smaller than unity, where Sato et al. (1981).
We begin our discussion with solid-phase heterogeneities, quantified by a heterogeneity index . This index characterizes the deviation of the particle-number-density fluctuation from that corresponding to a random distribution Fessler et al. (1994); a larger indicates a higher level of heterogeneity. Specifically, , where and are the mean and standard deviation of the local number density, respectively. is the standard deviation associated with the initial random placement of particles inside the domain, and , where is the cell size used in extracting the local particle number density Fessler et al. (1994).
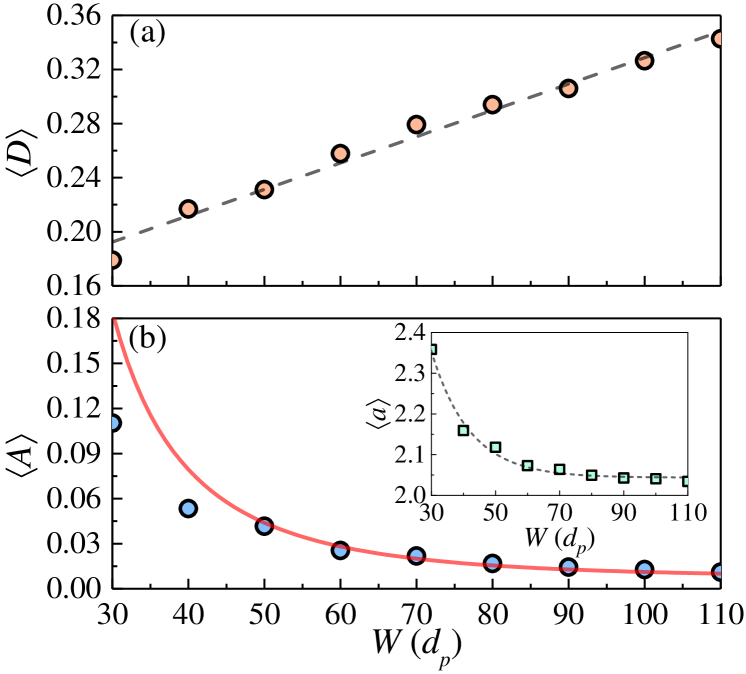
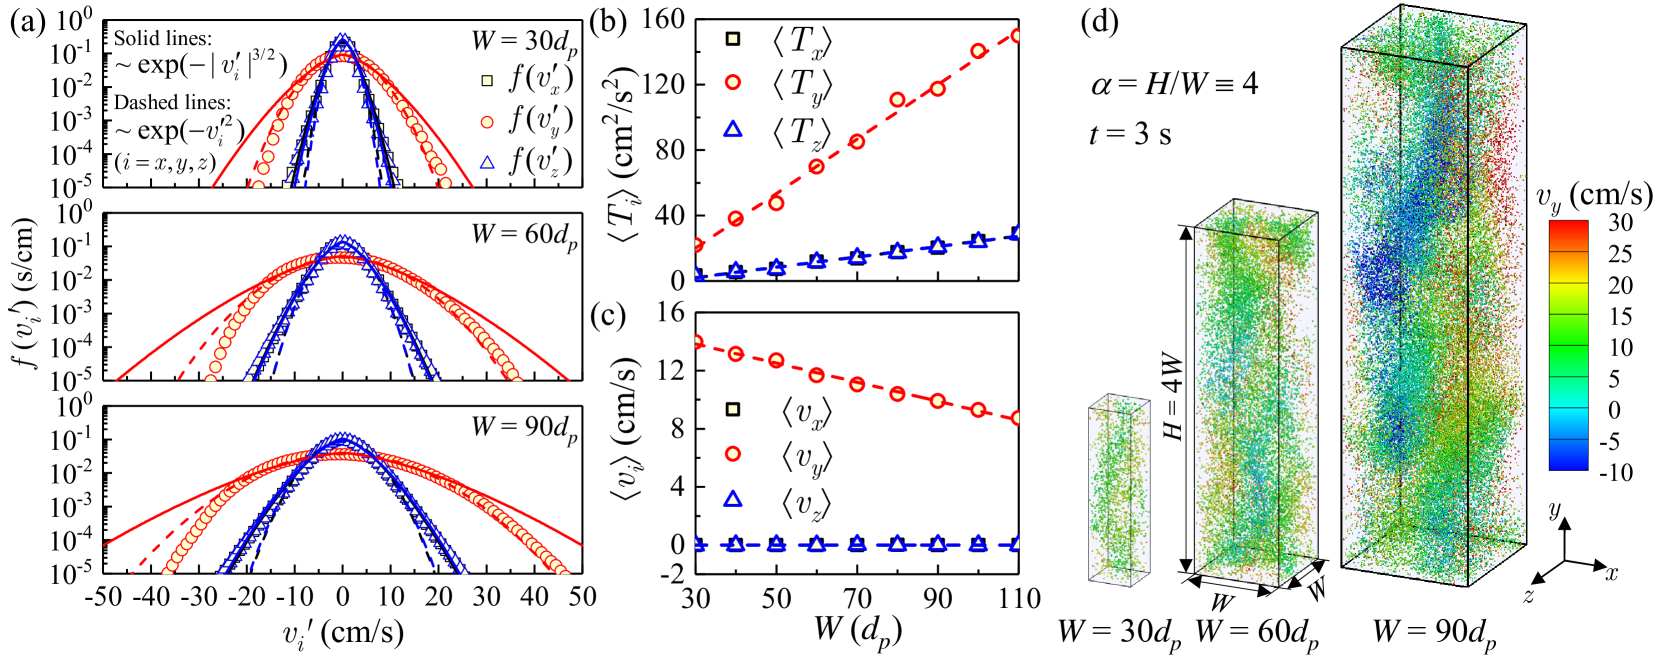
Fig. 2a shows the steady-state heterogeneity index increases linearly with system size (while ). Similar trends are reported for non-cohesive particles in granular Liss and Glasser (2001); Lasinski et al. (2004); Mitrano et al. (2011) and gas-solid flows Xiong et al. (2010); Capecelatro et al. (2016), where the higher level of heterogeneities in larger systems is explained by the increased space for hydrodynamic instabilities to develop Liss and Glasser (2001); Garzó (2005), analogous to the laminar-to-turbulent transition in single-phase pipe flows. For cohesive particles, in addition to increased clustering, an increased can also result from enhanced agglomeration. However, Fig. 2b shows the levels of agglomeration decreases with , in terms of both the steady-state fraction of particles in agglomerates and the agglomerate size (average number of particles in each agglomerate). To obtain and , we isolate agglomerates from the overall system heterogeneity by tracking enduring contacts between particles. We associate particles with an agglomerate when their contact duration exceeds a critical value s, considerably longer than the typical contact durations for non-agglomerating collisions Kellogg et al. (2017). Agglomerate breakage is recorded when particles lose physical contact with the agglomerate/particle. In all systems, agglomerates are dominated by doublets () ( on inset of Fig. 2b), consistent with Fig. 1, where we zoom in on the flow pattern at s to find a few doublets and only one triplet (). Since agglomeration decreases as increases, the increase in with can only be attributed to an increased clustering. Thus, in contrast to granular flows where the reduced impact velocities within clusters enhance agglomeration, clustering in gas-solid flows appears to inhibit agglomeration. To probe the mechanism for this counterintuitive behavior, the particle velocity distributions are examined next since they dictate whether or not agglomeration occurs Thornton and Yin (1991); Donahue et al. (2010).
Fig. 3a shows steady-state distributions for the three components of particle fluctuating velocities , where and are instantaneous and mean particle velocities, respectively. In transverse directions, the distributions and deviate from Gaussian (dashed lines) and exhibit overpopulated tails (solid lines), which is the signature of driven, non-cohesive granular gases identified theoretically Puglisi et al. (1998); van Noije and Ernst (1998), numerically Moon et al. (2004); van Zon and MacKintosh (2005) and experimentally Losert et al. (1999); Olafsen and Urbach (1999); Rouyer and Menon (2000); Blair and Kudrolli (2003b); Reis et al. (2007); Scholz and Pöschel (2017). The consistency with granular systems is reasonable since particle-particle interactions dominate the dynamics in the transverse directions with zero mean flow (, on Fig. 3c). On the other hand, the streamwise distributions are flatter and better described by Gaussians with positive skewness, which is attributed to the stronger gas-solid interactions (larger input of granular energy Warr et al. (1995); Grossman et al. (1997)) in the streamwise direction Ye et al. (2004); Ma et al. (2006); Capecelatro et al. (2015); Liu et al. (2017b); Vaidheeswaran et al. (2017). As increases, the distributions get wider in all directions. Accordingly, the steady-state granular temperatures , defined as the variances of the three components of particle fluctuating velocity Jenkins and Savage (1983), increase with (Fig. 3b), consistent with gas-solid flows of non-cohesive particles Capecelatro et al. (2016); Liu et al. (2017b). The increased with system size can be traced to increased clustering. The physical picture is that clusters tend to fall down as a result of “jet-bypassing” Capecelatro et al. (2015): the gas bypasses clusters, leading to reduced drag, whereas an increased pressure drop is needed for the gas to squeeze through clusters (higher flow resistance in clusters). The falling clusters then collide with individual particles or small clusters/agglomerates entrained by the gas flowing upwards. These “cluster-induced” collisions provide an added source of granular energy, which increases with the clustering level and results in higher in larger domains. In Fig. 3d, falling clusters are increasingly visible with increasing , i.e., more particles with lower or negative streamwise velocities are seen, leading to decreased with (Fig. 3c).
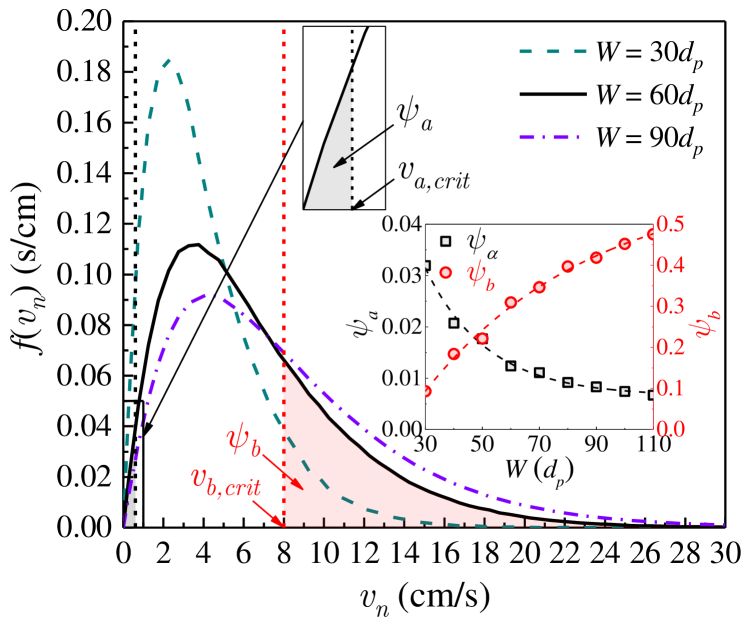
Due to the increased , both the impact velocity and frequency of collisions increase, analogous to molecular gases at elevated thermal temperatures. Correspondingly, as shown in Fig. 4, the steady-state distributions of the normal impact velocities (magnitude of the normal relative velocity right before a collision) shift to higher values with increasing . Since agglomeration occurs at lower impact velocities Thornton and Yin (1991); Donahue et al. (2010), the increased is responsible for the decreasing agglomeration shown in Fig. 2b.
To explain “cluster-induced deagglomeration” with more mathematical rigor, we propose an analytical model to relate to the impact velocity distribution . First, recall in current system with light cohesion, the agglomerates are largely doublets (Fig. 1). Thus, at statistical steady state, the generation and breakage rates of doublet are assumed equal, such that , where and are, respectively, the frequencies of singlet-singlet and singlet-doublet collisions. and are, respectively, the probabilities (success factors Fan et al. (2004)) of collisions resulting in agglomeration of singlets (from singlet-singlet collisions) and breakage of doublets (from singlet-doublet collisions). The collision frequencies and Gidaspow (1994); Kumaran (2009), where and are number densities of singlets and doublets, is the radial distribution function at contact, and are, respectively, the collisional cross section areas for singlet-singlet and singlet-doublet collisions, and is the mean particle relative velocity magnitude. Since , , where is the system volume, combining the above relations gives
| (1) |
For singlet-singlet collisions, . The singlet-doublet collisional cross section depends on the orientation of doublets. In Supplemental Materials, we derive the average collisional cross section over possible doublet orientations in the current system, and obtain . Next, we evaluate and . For singlet-singlet collisions, agglomeration occurs when is below the critical agglomeration velocity . Using a dimensional analysis, we recently Liu et al. (2017c) derived an expression relating to particle material properties: , where is a dimensionless parameter dependent on particle restitution coefficient . In this work, and Liu et al. (2017c), giving cm/s. In this same work Liu et al. (2017c), we conducted controlled simulations of singlet-doublet collisions for particles used here. We found the critical breakage velocity (i.e. when , the doublet breaks and the collision results in three singlets) depends on the relative position of the singlet and doublet before colliding (pre-collisional configurations). For simplification in the current analytical model, we use cm/s, which is the averaged collected in controlled simulations sweeping all possible pre-collisional configurations Liu et al. (2017c). Therefore, we compute and . For example, and corresponding to at are marked on Fig. 4 as shaded areas. As increases, shifts towards higher values, causing to decrease and to increase (inset of Fig. 4). Plugging , , and in Eq. (1), we find the decreasing with increasing is well captured by Eq. (1) (solid line on Fig. 2b). Quantitative agreement is observed except at , possibly due to the increasing number of agglomerates larger than doublets (more rapid growth of when on inset of Fig. 2b), which are not considered in current model.
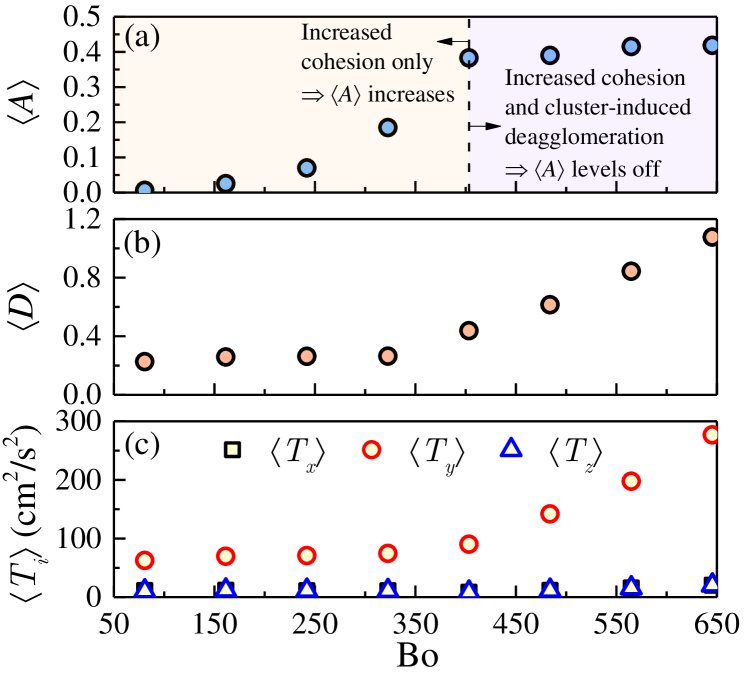
As additional evidence of cluster-induced deagglomeration beyond the lightly-cohesive systems ( nN) examined thus far, we plot steady-state flow properties in Fig. 5 for systems with increasing granular Bond number Bo (Bo = , where is the mass of a single grain and varies from 340 nN to 2720 nN) for a fixed system size. When Bo , stays relatively constant so that grows due to the increasing critical agglomeration and breakage velocities with increasing Bo. When Bo , the enhanced energy dissipation in collisions among particles with stronger cohesion leads to more prominent clustering as well as agglomeration ( increases evidently). However, the increasing level of clustering also triggers a rapid growth in , which contributes to deagglomeration. Consequently, instead of asymptotically approaching unity with increasing Bo as seen in gravity-free granular flows Weber et al. (2004), levels off at under the competing effects of increasing cohesion in gas-solid flows: i) increased agglomeration and (ii) increased cluster-induced deagglomeration.
In sum, an inverse response of clustering and agglomeration to increasing system size is identified in dilute gravity-driven gas-solid flows of lightly cohesive particles, which is explained by cluster-induced deagglomeration. Specifically, higher levels of clustering in larger systems enhance the relative velocities of particles, serving as a source of granular temperatures and higher collisional impact velocities that contribute to deagglomeration. The same mechanism explains the unexpected saturation of agglomeration levels as cohesion increases in gravity-driven gas-solid flows. Therefore, it is the gravity and the resulting increased collisional velocities between the falling (large) clusters and rising particles or (small) clusters that leads to the cluster-induced deagglomeration. Collectively, such interplay between clusters and agglomerates will impact numerous multiphase operations, where the interphase drag, heat transfer and chemical reactions rates are dependent on the nature of particle contacts (brief in clusters vs. enduring in agglomerates, etc.) Beetstra et al. (2006); Kosinski et al. (2013); Shah et al. (2013); Mehrabadi et al. (2016). The identification of the cluster-induced deagglomeration warrants its consideration in related population balance efforts Kim and Arastoopour (2002); Kantak et al. (2009); Murphy and Subramaniam (2015); Kellogg et al. (2017) for developing continuum models of cohesive particles. Beyond gas-solid flows, the findings may have ramifications for (high Stokes number) gravity-driven liquid-solid suspensions Guazzelli and Hinch (2011), colloids Barros and Luijten (2014), emulsions and foams Nagel (2017), where hydrodynamic instabilities and long-range interparticle attractions coexist.
Acknowledgements.
The authors are grateful for the financial support provided by the Dow Corning Corporation, a wholly owned subsidiary of the Dow Chemical Company, and National Science Foundation (CBET-1707046). The authors thank Kevin Kellogg and Casey LaMarche for stimulating discussions. This work utilized the RMACC Summit supercomputer, which is supported by the National Science Foundation (awards ACI-1532235 and ACI-1532236), the University of Colorado Boulder, and Colorado State University. The Summit supercomputer is a joint effort of the University of Colorado Boulder and Colorado State University.References
- Goldhirsch and Zanetti (1993) I. Goldhirsch and G. Zanetti, Phys. Rev. Lett. 70, 1619 (1993).
- Glasser et al. (1998) B. J. Glasser, S. Sundaresan, and I. G. Kevrekidis, Phys. Rev. Lett. 81, 1849 (1998).
- Wylie and Koch (2000) J. J. Wylie and D. L. Koch, Phys. Fluids 12, 964 (2000).
- Agrawal et al. (2001) K. Agrawal, P. N. Loezos, M. Syamlal, and S. Sundaresan, J. Fluid Mech. 445, 151 (2001).
- Brilliantov et al. (2004) N. Brilliantov, C. Saluena, T. Schwager, and T. Pöschel, Phys. Rev. Lett. 93, 134301 (2004).
- Aranson and Tsimring (2006) I. S. Aranson and L. S. Tsimring, Rev. Mod. Phys. 78, 641 (2006).
- Mitrano et al. (2013) P. P. Mitrano, S. R. Dahl, A. M. Hilger, C. J. Ewasko, and C. M. Hrenya, J. Fluid Mech. 729, 484 (2013).
- Yin et al. (2013) X. L. Yin, J. R. Zenk, P. P. Mitrano, and C. M. Hrenya, J. Fluid Mech. 727, R2 (2013).
- Fullmer and Hrenya (2017) W. D. Fullmer and C. M. Hrenya, Annu. Rev. Fluid Mech. 49, 485 (2017).
- Castellanos (2005) A. Castellanos, Adv. Phys. 54, 263 (2005).
- Herminghaus (2005) S. Herminghaus, Adv. Phys. 54, 221 (2005).
- Mitarai and Nori (2006) N. Mitarai and F. Nori, Adv. Phys. 55, 1 (2006).
- Pahtz et al. (2010) T. Pahtz, H. J. Herrmann, and T. Shinbrot, Nat. Phys. 6, 364 (2010).
- Lee et al. (2015) V. Lee, S. R. Waitukaitis, M. Z. Miskin, and H. M. Jaeger, Nat. Phys. 11, 733 (2015).
- Thornton and Yin (1991) C. Thornton and K. K. Yin, Powder Technol. 65, 153 (1991).
- Gollwitzer et al. (2012) F. Gollwitzer, I. Rehberg, C. A. Kruelle, and K. Huang, Phys. Rev. E 86, 011303 (2012).
- Royer et al. (2009) J. R. Royer, D. J. Evans, L. Oyarte, Q. Guo, E. Kapit, M. E. Mobius, S. R. Waitukaitis, and H. M. Jaeger, Nature 459, 1110 (2009).
- Waitukaitis et al. (2011) S. R. Waitukaitis, H. F. Grutjen, J. R. Royer, and H. M. Jaeger, Phys. Rev. E 83, 051302 (2011).
- Horio and Clift (1992) M. Horio and R. Clift, Powder Technol. 70, 196 (1992).
- Ulrich et al. (2009) S. Ulrich, T. Aspelmeier, K. Roeller, A. Fingerle, S. Herminghaus, and A. Zippelius, Phys. Rev. Lett. 102, 148002 (2009).
- Murphy and Subramaniam (2015) E. Murphy and S. Subramaniam, Phys. Fluids 27, 043301 (2015).
- Singh and Mazza (2018) C. Singh and M. G. Mazza, Phys. Rev. E 97, 022904 (2018).
- Blair and Kudrolli (2003a) D. L. Blair and A. Kudrolli, Phys. Rev. E 67, 021302 (2003a).
- Weber et al. (2004) M. W. Weber, D. K. Hoffman, and C. M. Hrenya, Granul. Matter 6, 239 (2004).
- Takada et al. (2014) S. Takada, K. Saitoh, and H. Hayakawa, Phys. Rev. E 90, 062207 (2014).
- Losert et al. (1999) W. Losert, D. G. W. Cooper, J. Delour, A. Kudrolli, and J. P. Gollub, Chaos 9, 682 (1999).
- Goldhirsch (2003) I. Goldhirsch, Annu. Rev. Fluid Mech. 35, 267 (2003).
- Kantak and Davis (2004) A. A. Kantak and R. H. Davis, J. Fluid Mech. 509, 63 (2004).
- Donahue et al. (2010) C. M. Donahue, C. M. Hrenya, and R. H. Davis, Phys. Rev. Lett. 105, 034501 (2010).
- Miller and Luding (2004) S. Miller and S. Luding, Phys. Rev. E 69, 031305 (2004).
- Capecelatro et al. (2016) J. Capecelatro, O. Desjardins, and R. O. Fox, J. Fluids Eng.-Trans. ASME 138, 041301 (2016).
- Liu et al. (2017a) P. Liu, C. Q. LaMarche, K. M. Kellogg, and C. M. Hrenya, Phys. Rev. Fluids 2, 054302 (2017a).
- Cundall and Strack (1979) P. A. Cundall and O. D. L. Strack, Geotechnique 29, 47 (1979).
- Brilliantov et al. (1996) N. V. Brilliantov, F. Spahn, J. M. Hertzsch, and T. Pöschel, Phys. Rev. E 53, 5382 (1996).
- Pöschel and Schwager (2005) T. Pöschel and T. Schwager, Computational granular dynamics: models and algorithms (Springer-Verlag, Berlin, 2005).
- Antypov and Elliott (2011) D. Antypov and J. A. Elliott, Europhys. Lett. 94, 50004 (2011).
- Liu et al. (2018) P. Liu, C. Q. LaMarche, K. M. Kellogg, and C. M. Hrenya, AIChE J. 64, 2329 (2018).
- Kobayashi et al. (2013) T. Kobayashi, T. Tanaka, N. Shimada, and T. Kawaguchi, Powder Technol. 248, 143 (2013).
- Hamaker (1937) H. C. Hamaker, Physica 4, 1058 (1937).
- Johnson et al. (1971) K. L. Johnson, K. Kendall, and A. D. Roberts, Proc. R. Soc. Lond. A 324, 301 (1971).
- Derjaguin et al. (1975) B. V. Derjaguin, V. M. Muller, and Y. P. Toporov, J. Colloid Interface Sci. 53, 314 (1975).
- Rumpf (1990) H. Rumpf, Particle technology (Chapman and Hall, London; New York, 1990).
- Rabinovich et al. (2000a) Y. I. Rabinovich, J. J. Adler, A. Ata, R. K. Singh, and B. M. Moudgil, J. Colloid Interface Sci. 232, 10 (2000a).
- Rabinovich et al. (2000b) Y. I. Rabinovich, J. J. Adler, A. Ata, R. K. Singh, and B. M. Moudgil, J. Colloid Interface Sci. 232, 17 (2000b).
- Tsuji et al. (1993) Y. Tsuji, T. Kawaguchi, and T. Tanaka, Powder Technol. 77, 79 (1993).
- Xu and Yu (1997) B. H. Xu and A. B. Yu, Chem. Eng. Sci. 52, 2785 (1997).
- van der Hoef et al. (2008) M. A. van der Hoef, M. V. Annaland, N. G. Deen, and J. A. M. Kuipers, Annu. Rev. Fluid Mech. 40, 47 (2008).
- Hill et al. (2001a) R. J. Hill, D. L. Koch, and A. J. C. Ladd, J. Fluid Mech. 448, 213 (2001a).
- Hill et al. (2001b) R. J. Hill, D. L. Koch, and A. J. C. Ladd, J. Fluid Mech. 448, 243 (2001b).
- Benyahia et al. (2006) S. Benyahia, M. Syamlal, and T. J. O’Brien, Powder Technol. 162, 166 (2006).
- Syamlal et al. (1993) M. Syamlal, W. Rogers, and T. J. O’Brien, MFIX documentation theory guide (1993).
- Garzó et al. (2012) V. Garzó, S. Tenneti, S. Subramaniam, and C. M. Hrenya, J. Fluid Mech. 712, 129 (2012).
- Tenneti and Subramaniam (2014) S. Tenneti and S. Subramaniam, Annu. Rev. Fluid Mech. 46, 199 (2014).
- Koch and Hill (2001) D. L. Koch and R. J. Hill, Annu. Rev. Fluid Mech. 33, 619 (2001).
- Caflisch and Luke (1985) R. E. Caflisch and J. H. C. Luke, Phys. Fluids 28, 759 (1985).
- Nicolai and Guazzelli (1995) H. Nicolai and E. Guazzelli, Phys. Fluids 7, 3 (1995).
- Segre et al. (1997) P. N. Segre, E. Herbolzheimer, and P. M. Chaikin, Phys. Rev. Lett. 79, 2574 (1997).
- Yin and Koch (2008) X. L. Yin and D. L. Koch, Phys. Fluids 20, 043305 (2008).
- Lick and Lick (1988) W. Lick and J. Lick, J. Gt. Lakes Res. 14, 514 (1988).
- Burban et al. (1989) P. Y. Burban, W. Lick, and J. Lick, J. Geophys. Res.-Oceans 94, 8323 (1989).
- Stolzenbach and Elimelech (1994) K. D. Stolzenbach and M. Elimelech, Deep-Sea Res. Part I-Oceanogr. Res. Pap. 41, 469 (1994).
- Winterwerp (1998) J. C. Winterwerp, J. Hydraul. Res. 36, 309 (1998).
- Higashitani et al. (2001) K. Higashitani, K. Iimura, and H. Sanda, Chem. Eng. Sci. 56, 2927 (2001).
- Grabowski et al. (2011) R. C. Grabowski, I. G. Droppo, and G. Wharton, Earth-Sci. Rev. 105, 101 (2011).
- Babler et al. (2015) M. U. Babler, L. Biferale, L. Brandt, U. Feudel, K. Guseva, A. S. Lanotte, C. Marchioli, F. Picano, G. Sardina, A. Soldati, and F. Toschi, J. Fluid Mech. 766, 104 (2015).
- Watanabe (2017) Y. Watanabe, Water Res. 114, 88 (2017).
- Njobuenwu and Fairweather (2018) D. O. Njobuenwu and M. Fairweather, Phys. Fluids 30, 063303 (2018).
- Winterwerp and Kesteren (2004) J. C. Winterwerp and W. G. M. v. Kesteren, Introduction to the physics of cohesive sediment in the marine environment (Elsevier, Amsterdam; Boston, 2004).
- Burchard et al. (2018) H. Burchard, H. M. Schuttelaars, and D. K. Ralston, Annu. Rev. Mar. Sci. 10, 371 (2018).
- Capecelatro et al. (2014) J. Capecelatro, O. Desjardins, and R. O. Fox, J. Fluid Mech. 747, R2 (2014).
- Capecelatro et al. (2015) J. Capecelatro, O. Desjardins, and R. O. Fox, J. Fluid Mech. 780, 578 (2015).
- Sato et al. (1981) Y. Sato, M. Sadatomi, and K. Sekoguchi, Int. J. Multiph. Flow 7, 167 (1981).
- Fessler et al. (1994) J. R. Fessler, J. D. Kulick, and J. K. Eaton, Phys. Fluids 6, 3742 (1994).
- Liss and Glasser (2001) E. D. Liss and B. J. Glasser, Powder Technol. 116, 116 (2001).
- Lasinski et al. (2004) M. E. Lasinski, J. S. Curtis, and J. F. Pekny, Phys. Fluids 16, 265 (2004).
- Mitrano et al. (2011) P. P. Mitrano, S. R. Dahl, D. J. Cromer, M. S. Pacella, and C. M. Hrenya, Phys. Fluids 23, 093303 (2011).
- Xiong et al. (2010) Q. G. Xiong, B. Li, F. G. Chen, J. S. Ma, W. Ge, and J. H. Li, Chem. Eng. Sci. 65, 5356 (2010).
- Garzó (2005) V. Garzó, Phys. Rev. E 72, 021106 (2005).
- Kellogg et al. (2017) K. M. Kellogg, P. Liu, C. Q. LaMarche, and C. M. Hrenya, J. Fluid Mech. 832, 345 (2017).
- Puglisi et al. (1998) A. Puglisi, V. Loreto, U. M. B. Marconi, A. Petri, and A. Vulpiani, Phys. Rev. Lett. 81, 3848 (1998).
- van Noije and Ernst (1998) T. van Noije and M. Ernst, Granul. Matter 1, 57 (1998).
- Moon et al. (2004) S. J. Moon, J. B. Swift, and H. L. Swinney, Phys. Rev. E 69, 011301 (2004).
- van Zon and MacKintosh (2005) J. S. van Zon and F. C. MacKintosh, Phys. Rev. E 72, 051301 (2005).
- Olafsen and Urbach (1999) J. S. Olafsen and J. S. Urbach, Phys. Rev. E 60, R2468 (1999).
- Rouyer and Menon (2000) F. Rouyer and N. Menon, Phys. Rev. Lett. 85, 3676 (2000).
- Blair and Kudrolli (2003b) D. L. Blair and A. Kudrolli, Phys. Rev. E 67, 041301 (2003b).
- Reis et al. (2007) P. M. Reis, R. A. Ingale, and M. D. Shattuck, Phys. Rev. E 75, 051311 (2007).
- Scholz and Pöschel (2017) C. Scholz and T. Pöschel, Phys. Rev. Lett. 118, 198003 (2017).
- Warr et al. (1995) S. Warr, J. M. Huntley, and G. T. H. Jacques, Phys. Rev. E 52, 5583 (1995).
- Grossman et al. (1997) E. L. Grossman, T. Zhou, and E. Ben-Naim, Phys. Rev. E 55, 4200 (1997).
- Ye et al. (2004) M. Ye, M. A. van der Hoef, and J. A. M. Kuipers, Powder Technol. 139, 129 (2004).
- Ma et al. (2006) J. S. Ma, W. Ge, X. W. Wang, J. W. Wang, and J. H. Li, Chem. Eng. Sci. 61, 7096 (2006).
- Liu et al. (2017b) X. Liu, L. Wang, and W. Ge, AIChE J. 63, 3 (2017b).
- Vaidheeswaran et al. (2017) A. Vaidheeswaran, F. Shaffer, and B. Gopalan, Phys. Rev. Fluids 2, 112301 (2017).
- Jenkins and Savage (1983) J. T. Jenkins and S. B. Savage, J. Fluid Mech. 130, 187 (1983).
- Fan et al. (2004) R. Fan, D. L. Marchisio, and R. O. Fox, Powder Technol. 139, 7 (2004).
- Gidaspow (1994) D. Gidaspow, Multiphase flow and fluidization: continuum and kinetic theory descriptions (Academic Press, Boston, 1994).
- Kumaran (2009) V. Kumaran, J. Fluid Mech. 632, 109 (2009).
- Liu et al. (2017c) P. Liu, K. M. Kellogg, C. Q. LaMarche, and C. M. Hrenya, Chem. Eng. J. 324, 380 (2017c).
- Beetstra et al. (2006) R. Beetstra, M. A. van der Hoef, and J. A. M. Kuipers, Comput. Fluids 35, 966 (2006).
- Kosinski et al. (2013) P. Kosinski, B. V. Balakin, P. Middha, and A. C. Hoffmann, Int. J. Heat Mass Transf. 58, 107 (2013).
- Shah et al. (2013) M. T. Shah, R. P. Utikar, M. O. Tade, G. M. Evans, and V. K. Pareek, Chem. Eng. Sci. 102, 365 (2013).
- Mehrabadi et al. (2016) M. Mehrabadi, E. Murphy, and S. Subramaniam, Chem. Eng. Sci. 152, 199 (2016).
- Kim and Arastoopour (2002) H. Kim and H. Arastoopour, Powder Technol. 122, 83 (2002).
- Kantak et al. (2009) A. A. Kantak, C. M. Hrenya, and R. H. Davis, Phys. Fluids 21, 023301 (2009).
- Guazzelli and Hinch (2011) E. Guazzelli and J. Hinch, Annu. Rev. Fluid Mech. 43, 97 (2011).
- Barros and Luijten (2014) K. Barros and E. Luijten, Phys. Rev. Lett. 113, 017801 (2014).
- Nagel (2017) S. R. Nagel, Rev. Mod. Phys. 89, 025002 (2017).