Synthesized Texture Quality Assessment via Multi-scale Spatial and Statistical Texture Attributes of Image and Gradient Magnitude Coefficients
Abstract
Perceptual quality assessment for synthesized textures is a challenging task. In this paper, we propose a training-free reduced-reference (RR) objective quality assessment method that quantifies the perceived quality of synthesized textures. The proposed reduced-reference synthesized texture quality assessment metric is based on measuring the spatial and statistical attributes of the texture image using both image- and gradient-based wavelet coefficients at multiple scales. Performance evaluations on two synthesized texture databases demonstrate that our proposed RR synthesized texture quality metric significantly outperforms both full-reference and RR state-of-the-art quality metrics in predicting the perceived visual quality of the synthesized textures111The source code of our proposed method will be available online at https://ivulab.asu.edu/software/IGSTQA/.
1 Introduction
Natural and artificial textures are important components in computer vision, image processing, multimedia, and graphics applications. A visual texture consists of a spatially repetitive pattern of visual properties. Visual textures are present in both natural and man-made objects (e.g., grass, flowers, ripples of water, floor tiles, printed fabrics) and help in characterizing and recognizing these objects. A natural image typically consists of several types of visual texture regions that are present in the image, while a texture image corresponds to one such visual texture region.
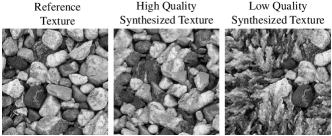
Texture synthesis is an important research topic; the use of an efficient synthesis algorithm can benefit many important applications in computer vision, multimedia, computer graphics, and image and video processing. Applications of texture synthesis include image/video restoration [39, 14, 46], image/video generation [22, 26, 9], image/video compression [27, 1], multimedia image processing [8, 44], texture perception and description [30, 37, 2, 15, 28, 18, 4, 20], texture segmentation and recognition [3, 21, 32, 5, 13], and synthesis [7, 29, 16, 36]. Given a reference texture image and two corresponding synthesized versions, a human observer can easily determine which version better represents the original texture (see Figure 1). However, automating this task is still very challenging . Over the past several decades, a large body of research has focused on developing accurate and efficient texture synthesis algorithms. Different texture synthesis methods produce different types of visual artifacts that lead to a loss in fidelity of the synthesized textures compared to the original. These artifacts include misalignment, blur, tiling, and loss in the periodicity of the primitives (see Figure 2). The introduced artifacts alter the statistical properties in addition to the granularity and regularity attributes as compared to the original reference texture. Despite advances in texture modeling and synthesis, there is little work on developing algorithms for assessing the visual quality of synthesized textures.
In natural image quality assessment, the assumption is that if a test image is high quality, the local structure of that test image should be very similar to the reference image. However, for synthesized texture quality assessment, the local structure of the synthesized texture may be different as compared to the reference texture, but the synthesized texture can still be perceived to be very similar to the reference texture if some main properties of the texture patterns are preserved. Therefore, in synthesized texture quality assessment, it is important to extract and quantify these texture attributes that convey the perceptually relevant information.
The objective of synthesized texture quality assessment is to provide computational models to measure the quality of a synthesized texture as perceived by human subjects. However, there are currently no satisfactory objective methods that can reliably estimate the perceived visual quality of synthesized textures. Based on the availability of a reference image, objective quality metrics can be divided into full-reference (reference available or FR), no-reference (reference not available or NR), and reduced-reference (RR) methods.

FR methods usually provide the most precise evaluation results for natural images. However, in many practical applications, the visual quality assessment (VQA) system does not have access to reference images. RR visual quality assessment (RRVQA) methods provide a solution when the reference image is not completely accessible. These methods generally operate by extracting a set of features from the reference image (RR features). The extracted RR features are later used with the distorted image (e.g., synthesized texture) to estimate quality. RRVQA systems generally include a feature extraction process at the sender side for the reference image and a feature extraction at the receiver side for the distorted image. The RR features that are extracted from the reference image, have a much lower data rate than the reference image data and are typically transmitted to the receiver through an ancillary channel [41].
Given two synthesized versions of a visual texture, a human observer can easily select which of the two synthesized versions represents the reference texture better. However, this task is extremely challenging from a computational standpoint. As it is shown later in this paper, existing modern objective VQA algorithms that are designed for natural images fail to accurately and reliably predict the quality of the synthesized textures. The process of automatically assessing the perceived visual quality of synthesized textures is ill-posed because of two reasons, namely, (i) the sizes of the synthesized and the original texture can be different and (ii) the synthesized textures are not required to have pixel-wise correspondences with the original texture but can still appear perceptually equivalent (see Figure 1).
Natural image statistics and structural similarity are used in existing popular objective image quality assessment (IQA) methods that are designed for natural images [40, 43, 42, 25, 24, 48]. SSIM [40] uses the mean, variance, and co-variance of pixels to compute luminance, contrast, and structural similarity, respectively. MS-SSIM [43] and CWSSIM [42] extended SSIM to the multiscale and complex wavelet domain, respectively. State-of-the-art RR metrics such as RRIQA [17] and RRSSIM [31] require training and/or tuning of parameters to optimize the IQA performance. Training-free RRIQAs [45, 23, 11] usually need a large number of RR features (side information) and their performance degrades with the reduction of the amount of side information. In [23], Soundararajan et al. developed a training-free RRIQA framework (RRED) based on an information theoretic framework. The image quality is computed via the difference between the entropies of wavelet coefficients of reference and distorted images. Golestaneh and Karam [10] proposed a training-free RRIQA based on the entropy of the divisive normalization transform of locally weighted gradient magnitudes. In [45], Xue et al. proposed a method (W-SCM) based on the steerable pyramid. The strongest component map (SCM) is constructed for each scale. Then, the Weibull distribution is employed to describe the statistics of the SCM. The Weibull scale parameters, one for each pyramid level, represent the RR features.
More specific to texture images, a FR structural texture similarity index (STSIM) was proposed in [50, 51]. Moreover, Swamy et al. [35] proposed an FR metric that uses Portilla’s constraints [29] along with the Kullback-Leibler Divergence (KLD). In [38], Varadarajan and Karam proposed a RR VQA metric for texture synthesis based on visual attention and the perceived regularity of synthesized textures. The perceived regularity is quantified through the characteristics of the visual saliency map and its distribution. Recently in [11], Golestaneh and Karam proposed a training-free RR metric which is based on measuring the spatial and statistical texture attributes in the wavelet domain, namely granularity, regularity, and kurtosis.
In this paper, we propose a training-free RR Synthesized Texture Quality Assessment method based on multi-scale spatial and statistical texture attributes that are extracted from both image-based and gradient-based wavelet coefficients at different scales. We show as part of this work that higher performance can be obtained in terms of correlation with the perceived texture similarity by extracting multiscale statistical properties as well as regularity and granularity attributes from both the texture image and its gradient magnitude. In the proposed method, the RR features are extracted from the considered texture image and its corresponding gradient magnitude image by first performing an -level multi-scale decomposition using an undecimated wavelet transform. The perceived granularity and regularity of the texture image are quantified by computing, respectively, the mean and the standard deviation of the locations of local extrema in wavelet subbands based on the distribution of the the absolute values of the wavelet coefficients in each subband [11]. In addition, statistical RR features are extracted by computing the standard deviation, skewness, kurtosis, and entropy of the wavelet coefficient magnitude’s distribution at each level of the multi-scale decomposition.
The rest of this paper is organized as follows. Section 2 presents the proposed RR synthesized texture quality assessment index. Performance results are presented in Section 3, followed by a conclusion in Section 4.
2 Proposed RR Visual Quality Assessment For Synthesized Textures
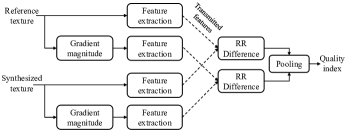
Given an input reference texture and a synthesized texture, Figure 3 shows the framework of our proposed method. In our proposed method, the RR features are extracted in the wavelet domain from both the spatial image and its gradient magnitude . Perceptually relevant structures are further enhanced by combining properties from both the spatial and gradient magnitude domains. The image gradient is a popular feature in IQA [45, 49, 19], since it can effectively capture local image structures, to which the HVS is highly sensitive. We compute the gradient magnitude of the input image as the root mean square of the image directional gradients along two orthogonal directions.
The introduced artifacts while synthesizing the texture alter the statistical properties in addition to the granularity and regularity attributes as compared to the original reference texture. Different types of artifacts would be altering properties more significantly at a given scale and given domain and therefore we extract multiscale attributes and incorporate these in our proposed metric. For example, changes in attributes due to the blur artifact would be more pronounced in the high-frequency bands at lower scales and would affect the granularity attributes of the texture. Tiling will also affect more significantly attribute in higher-frequency bands and would affect the regularity. Loss of periodicity of primitives affect significantly the regularity attribute.
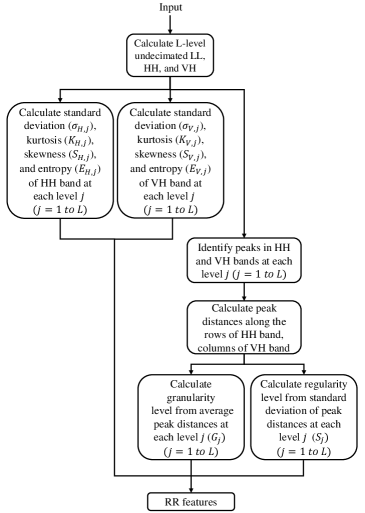
The wavelet-domain RR features are computed as shown in Figure 4. First an -level undecimated wavelet decomposition [47] of the input texture image is performed ( = 4 in our implementation), where the input is divided at each level into three subbands, namely low-low (LL), horizontal-high (HH) and vertical-high (VH) subbands. Our proposed quality index quantifies the perceived synthesized texture quality by extracting spatial features (granularity [34] and regularity [11]) and statistical features (standard deviation, kurtosis, skewness, and entropy) at each scale.
The HH and VH subbands at the scale are denoted by and , respectively. For computing the granularity, , and regularity, , features at the scale, local peaks are detected by locating (as in [34]) the local maxima of the wavelet coefficients’ magnitude along the rows and columns of the and subbands, respectively. Distances between adjacent located peaks are computed for every row (column) in the ( ) subband. Then the spatial features for the considered texture image, namely, the granularity, , and regularity, , are computed, respectively, as the mean and standard deviation of the computed distances.
Let and denote the granularity and regularity at the scale, where and , with denoting the reference texture, denoting the synthesized texture. indicates that the spatial image () is used to compute the RR features while indicates that the gradient magnitude image () is used to compute the RR features. Furthermore, let , , , denote, respectively, the standard deviation, kurtosis, skewness, and log energy entropy [6] of the level subband corresponding to and . Similarly, let , , , denote, respectively, the standard deviation, kurtosis, skewness, and log energy entropy of the level subband . We define as:
| (1) |
where denotes the distance between the kurtosis attributes and of the image () or gradient magnitude () wavelet coefficients’ distribution. Similarly, , , and can be defined using Eq. (1) by replacing with , , and , respectively. Also, let denote the granularity difference between the original and synthesized texture in the raw image domain () or gradient magnitude image domain (). can be defined as follows:
| (2) | |||
where () and () denote, respectively, the granularity of the reference texture and the synthesized texture at the scale for the HH (VH) subband. Similarly, can be defined using Eq. (2) by replacing the granularity with the regularity .
Finally, the proposed reduced-reference Image- and Gradient-based wavelet domain Syntheized Texture Quality Assessment (IGSTQA) index, is computed as follows:
| (3) |
In Eq. (3), a value of was found to yield good results across a wide variety of images. However, the selection of this value is not critical; the results are very close when is chosen within a range.
3 Results
This section analyses the performance of our proposed method (IGSTQA) in terms of qualitative and quantitative results.
3.1 Qualitative Results
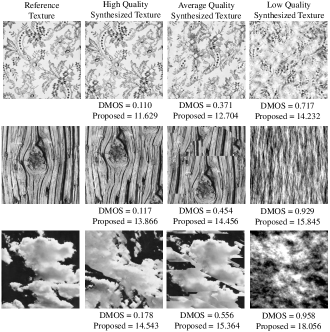
Figure 5 provides results of our algorithm on three images with different qualities. As shown in Figure 5, our algorithm can predict the quality of texture images over a range of different qualities in a manner that is consistent with human quality judgments (DMOS). Notice that as we move from left to right within each row, DMOS increases and IGSTQA follows a similar trend. In terms of the across-image quality assessment, as we move from top to bottom, DMOS increases and IGSTQA follows a similar trend.
3.2 Quantitative Results
In this section, the performance of the proposed IGSTQA index is analyzed in terms of its ability to predict subjective ratings of the synthesized texture quality. We evaluate the performance in terms of prediction accuracy, prediction monotonicity, and prediction consistency. To quantify the performance of our algorithm, we applied IGSTQA to two different synthesized texture quality databases including the SynTEX Granularity [12] and Parametric Quality Assessment [35] databases. The SynTEX Granularity [12] database contains 21 reference and 105 synthesized texture images that are generated by using five different texture synthesis algorithms, and the Parametric Quality Assessment [35] database contains 42 reference textures and 252 synthesized texture images generated by using 6 different texture synthesis algorithms.
| SynTEX Granularity database [12] | |||||||
| # Features | PLCC | SROCC | RMSE | ||||
| PSNR | FR | 0. | 237 | 0. | 345 | 1. | 210 |
| MS-SSIM [43] | FR | 0. | 293 | 0. | 122 | 1. | 105 |
| STSSIM [51] | FR | 0. | 215 | 0. | 135 | 1. | 213 |
| CWSSIM [42] | FR | 0. | 595 | 0. | 583 | 0. | 914 |
| Parametric [35] | FR | 0. | 487 | 0. | 328 | 1. | 087 |
| DIIVINE [25] | NR | 0. | 357 | 0. | 408 | 1. | 094 |
| NIQE[24] | NR | 0. | 253 | 0. | 218 | 1. | 154 |
| IL-NIQE [48] | NR | 0. | 543 | 0. | 512 | 0. | 985 |
| RRED [33] | 0. | 226 | 0. | 116 | 1. | 211 | |
| W-SCM [45] | 6 | 0. | 472 | 0. | 415 | 1. | 158 |
| STQA [11] | 7 | 0. | 770 | 0. | 777 | 0. | 792 |
| Proposed | 0. | 816 | 0. | 820 | 0. | 718 | |
| Parametric Quality Assessment database [35] | |||||||
| # Features | PLCC | SROCC | RMSE | ||||
| PSNR | FR | 0. | 083 | 0. | 075 | 0. | 952 |
| MS-SSIM [43] | FR | 0. | 087 | 0. | 053 | 0. | 921 |
| STSSIM [51] | FR | 0. | 045 | 0. | 054 | 0. | 964 |
| CWSSIM [42] | FR | 0. | 015 | 0. | 002 | 0. | 953 |
| Parametric [35] | FR | 0. | 412 | 0. | 481 | 0. | 253 |
| DIIVINE [25] | NR | 0. | 351 | 0. | 203 | 0. | 254 |
| NIQE [24] | NR | 0. | 185 | 0. | 054 | 0. | 315 |
| IL-NIQE [48] | NR | 0. | 432 | 0. | 403 | 0. | 253 |
| RRED [33] | 0. | 208 | 0. | 188 | 0. | 255 | |
| W-SCM [45] | 6 | 0. | 375 | 0. | 398 | 0. | 254 |
| STQA [11] | 7 | 0. | 532 | 0. | 520 | 0. | 250 |
| Proposed | 0. | 733 | 0. | 679 | 0. | 170 | |
We employ three commonly used performance metrics. We measure the prediction monotonicity of IGSTQA via the Spearman rank-order correlation coefficient (SROCC). We measure the Pearson linear correlation coefficient (PLCC) between MOS (DMOS) and the objective scores after nonlinear regression. The root mean squared error (RMSE) between MOS (DMOS) and the objective scores after nonlinear regression is also measured. Tables 1 and 2 provide the comparison between our results and popular FR, RR, and NR IQA algorithms using the SynTEX granularity database [12] and the Parametric Quality Assessment [35] databases, respectively. The results show that the modern FR, NR, and RR metrics do not perform well for quantifying the quality of synthesized textures. Moreover, it can be observed that our proposed quality index yields the highest correlation with the subjective quality ratings in terms of PLCC, SROCC, and RMSE.
Table 3 shows the performance of our proposed algorithm in terms of PLCC, SROCC, and RMSE when either the spatial or gradient magnitude domain is used to extract the wavelet coefficients. From Table 3 it can be seen that extracting attributes from only one domain only decreases the performance of the proposed method, as compared to incorporating attributes from both domains.
| Database | Criterion | PLCC | SROCC | RMSE | |||
|---|---|---|---|---|---|---|---|
| Parametric Quality | Using spatial domain | 0. | 682 | 0. | 651 | 0. | 213 |
| Assessment database | Using gradient magnitude domain | 0. | 702 | 0. | 664 | 0. | 197 |
| [35] | Proposed | 0. | 733 | 0. | 679 | 0. | 170 |
| SynTEX Granularity | Using spatial domain | 0. | 785 | 0. | 776 | 0. | 854 |
| database | Using gradient magnitude domain | 0. | 797 | 0. | 809 | 0. | 753 |
| [12] | Proposed | 0. | 816 | 0. | 820 | 0. | 718 |
4 Conclusion
Finding a balance between the number of RR features and the predicted image quality is at the core of the design of RR VQA methods. Moreover, estimating the quality of synthesized textures is a very challenging task. In this paper, we proposed an RR-training-free VQA method to assess the perceived visual quality of synthesized textures based on spatial and statistical features extracted from the wavelet transform of both the texture image and its gradient magnitudes. Our proposed RR index, IGSTQA, yields the highest prediction accuracy for measuring the perceived fidelity of synthesized textures and outperforms state-of-the-art quality metrics.
References
- [1] J. Balle, A. Stojanovic, and J.-R. Ohm. Models for static and dynamic texture synthesis in image and video compression. IEEE Journal of Selected Topics in Signal Processing, 5(7):1353–1365, 2011.
- [2] J. R. Bergen and E. H. Adelson. Early vision and texture perception. Nature, 333(6171):363–364, 1988.
- [3] B. B. Chaudhuri and N. Sarkar. Texture segmentation using fractal dimension. IEEE Transactions on Pattern Analysis and Machine Intelligence, 17(1):72–77, 1995.
- [4] D. Chetverikov and R. Péteri. A brief survey of dynamic texture description and recognition. Computer Recognition Systems, pages 17–26, 2005.
- [5] M. Cimpoi, S. Maji, and A. Vedaldi. Deep filter banks for texture recognition and segmentation. In Proceedings of the IEEE Conference on Computer Vision and Pattern Recognition, pages 3828–3836, 2015.
- [6] R. R. Coifman and M. V. Wickerhauser. Entropy-based algorithms for best basis selection. IEEE Transactions on Information Theory, 38(2):713–718, 1992.
- [7] A. A. Efros and W. T. Freeman. Image quilting for texture synthesis and transfer. In Proceedings of the 28th Annual Conference on Computer Graphics and Interactive Techniques, pages 341–346, 2001.
- [8] B. Furht, S. W. Smoliar, and H. Zhang. Video and Image Processing in Multimedia Systems, volume 326. Springer Science & Business Media, 2012.
- [9] G. Georgiadis, A. Chiuso, and S. Soatto. Texture representations for image and video synthesis. In CVPR, pages 2058–2066, 2015.
- [10] S. A. Golestaneh and L. J. Karam. Reduced-reference quality assessment based on the entropy of dnt coefficients of locally weighted gradients. In IEEE International Conference on Image Processing (ICIP),, pages 4117–4120, 2015.
- [11] S. A. Golestaneh and L. J. Karam. Reduced-reference synthesized-texture quality assessment based on multi-scale spatial and statistical texture attributes. In IEEE International Conference on Image Processing (ICIP),, pages 3783–3786, 2016.
- [12] S. A. Golestaneh, M. M. Subedar, and L. J. Karam. The effect of texture granularity on texture synthesis quality. In SPIE Optical Engineering+ Applications, pages 959912–959912. International Society for Optics and Photonics, 2015.
- [13] M. Jaderberg, K. Simonyan, A. Zisserman, et al. Spatial transformer networks. In Advances in Neural Information Processing Systems, pages 2017–2025, 2015.
- [14] S. Kamel, H. Ebrahimnezhad, and A. Ebrahimi. Moving object removal in video sequence and background restoration using kalman filter. In International Symposium on Telecommunications, pages 580–585. IEEE, 2008.
- [15] J. M. Keller, S. Chen, and R. M. Crownover. Texture description and segmentation through fractal geometry. Computer Vision, Graphics, and Image Processing, 45(2):150–166, 1989.
- [16] V. Kwatra, A. Schödl, I. Essa, G. Turk, and A. Bobick. Graphcut textures: image and video synthesis using graph cuts. In ACM Transactions on Graphics (ToG), volume 22, pages 277–286, 2003.
- [17] Q. Li and Z. Wang. Reduced-reference image quality assessment using divisive normalization-based image representation. IEEE Journal of Selected Topics in Signal Processing, 3(2):202–211, 2009.
- [18] H.-C. Lin, C.-Y. Chiu, and S.-N. Yang. Finding textures by textual descriptions, visual examples, and relevance feedbacks. Pattern Recognition Letters, 24(14):2255–2267, 2003.
- [19] A. Liu, W. Lin, and M. Narwaria. Image quality assessment based on gradient similarity. IEEE Transactions on Image Processing, 21(4):1500–1512, 2012.
- [20] H. Luo, P. L. Carrier, A. Courville, and Y. Bengio. Texture modeling with convolutional spike-and-slab rbms and deep extensions. In Artificial Intelligence and Statistics, pages 415–423, 2013.
- [21] B. S. Manjunath, J.-R. Ohm, V. V. Vasudevan, and A. Yamada. Color and texture descriptors. IEEE Transactions on Circuits and Systems for Video Technology, 11(6):703–715, 2001.
- [22] T. Matsuyama and T. Takai. Generation, visualization, and editing of 3d video. In First International Symposium on 3D Data Processing Visualization and Transmission, pages 234–245. IEEE, 2002.
- [23] A. Mittal, A. K. Moorthy, and A. C. Bovik. No-reference image quality assessment in the spatial domain. IEEE Transactions on Image Processing, 21(12):4695–4708, 2012.
- [24] A. Mittal, R. Soundararajan, and A. C. Bovik. Making a “completely blind” image quality analyzer. IEEE Signal Processing Letters, 20(3):209–212, 2013.
- [25] A. K. Moorthy and A. C. Bovik. Blind image quality assessment: From natural scene statistics to perceptual quality. IEEE transactions on Image Processing, 20(12):3350–3364, 2011.
- [26] K. Olszewski, Z. Li, C. Yang, Y. Zhou, R. Yu, Z. Huang, S. Xiang, S. Saito, P. Kohli, and H. Li. Realistic dynamic facial textures from a single image using gans. In IEEE International Conference on Computer Vision (ICCV), pages 5429–5438, 2017.
- [27] T. N. Pappas, J. Zujovic, and D. L. Neuhoff. Image analysis and compression: Renewed focus on texture. In Visual Information Processing and Communication, volume 7543, page 75430N. International Society for Optics and Photonics, 2010.
- [28] R. W. Picard and T. P. Minka. Vision texture for annotation. Multimedia Systems, 3(1):3–14, 1995.
- [29] J. Portilla and E. P. Simoncelli. A parametric texture model based on joint statistics of complex wavelet coefficients. International Journal of Computer Vision, 40(1):49–70, 2000.
- [30] A. R. Rao. A taxonomy for texture description and identification. Springer Science & Business Media, 2012.
- [31] A. Rehman and Z. Wang. Reduced-reference ssim estimation. In IEEE International Conference on Image Processing (ICIP),, pages 289–292, 2010.
- [32] E. Salari and Z. Ling. Texture segmentation using hierarchical wavelet decomposition. Pattern Recognition, 28(12):1819–1824, 1995.
- [33] R. Soundararajan and A. C. Bovik. Rred indices: Reduced reference entropic differencing for image quality assessment. IEEE Transactions on Image Processing, 21(2):517–526, 2012.
- [34] M. M. Subedar and L. J. Karam. A no reference texture granularity index and application to visual media compression. In IEEE International Conference on Image Processing (ICIP),, pages 760–764, 2015.
- [35] D. S. Swamy, K. J. Butler, D. M. Chandler, and S. S. Hemami. Parametric quality assessment of synthesized textures. In IS&T/SPIE Electronic Imaging, pages 78650B–78658B. International Society for Optics and Photonics, 2011.
- [36] D. Ulyanov, V. Lebedev, A. Vedaldi, and V. S. Lempitsky. Texture networks: Feed-forward synthesis of textures and stylized images. In International Conference on Machine Learning (ICML), pages 1349–1357, 2016.
- [37] S. Varadarajan and L. J. Karam. A no-reference perceptual texture regularity metric. In IEEE International Conference on Acoustics, Speech and Signal Processing (ICASSP),, pages 1894–1898, 2013.
- [38] S. Varadarajan and L. J. Karam. A reduced-reference perceptual quality metric for texture synthesis. In IEEE International Conference on Image Processing (ICIP),, pages 531–535, 2014.
- [39] M. Wang, B. Yan, and K. N. Ngan. An efficient framework for image/video inpainting. Signal Processing: Image Communication, 28(7):753–762, 2013.
- [40] Z. Wang, A. C. Bovik, H. R. Sheikh, and E. P. Simoncelli. Image quality assessment: from error visibility to structural similarity. IEEE Transactions on Image Processing, 13(4):600–612, 2004.
- [41] Z. Wang, H. R. Sheikh, A. C. Bovik, et al. Objective video quality assessment. The handbook of video databases: design and applications, 41:1041–1078, 2003.
- [42] Z. Wang and E. P. Simoncelli. Translation insensitive image similarity in complex wavelet domain. In IEEE International Conference on Acoustics, Speech, and Signal Processing (ICASSP)., volume 2, pages ii–573, 2005.
- [43] Z. Wang, E. P. Simoncelli, and A. C. Bovik. Multiscale structural similarity for image quality assessment. In Conference Record of the Thirty-Seventh Asilomar Conference on Signals, Systems and Computers,, volume 2, pages 1398–1402. IEEE, 2003.
- [44] R. B. Wolfgang and E. J. Delp. Overview of image security techniques with applications in multimedia systems. In Proceedings of the SPIE International Conference on Multimedia Networks: Security, Displays, Terminals, and Gateways, volume 3228, pages 297–308, 1997.
- [45] W. Xue and X. Mou. Reduced reference image quality assessment based on weibull statistics. In Second International Workshop on Quality of Multimedia Experience (QoMEX), pages 1–6, 2010.
- [46] H. Yamauchi, J. Haber, and H.-P. Seidel. Image restoration using multiresolution texture synthesis and image inpainting. In Computer Graphics International, pages 120–125. IEEE, 2003.
- [47] C. Q. Zhan and L. J. Karam. Wavelet-based adaptive image denoising with edge preservation. In IEEE International Conference on Image Processing (ICIP),, volume 1, pages I–97, 2003.
- [48] L. Zhang, L. Zhang, and A. C. Bovik. A feature-enriched completely blind image quality evaluator. IEEE Transactions on Image Processing, 24(8):2579–2591, 2015.
- [49] L. Zhang, L. Zhang, X. Mou, and D. Zhang. Fsim: A feature similarity index for image quality assessment. IEEE Transactions on Image Processing, 20(8):2378–2386, 2011.
- [50] X. Zhao, M. G. Reyes, T. N. Pappas, and D. L. Neuhoff. Structural texture similarity metrics for retrieval applications. In IEEE International Conference on Image Processing (ICIP),, pages 1196–1199, 2008.
- [51] J. Zujovic, T. N. Pappas, and D. L. Neuhoff. Structural texture similarity metrics for image analysis and retrieval. IEEE Transactions on Image Processing, 22(7):2545–2558, 2013.