Resonant and random excitations on the proton beam in the Large
Hadron Collider for
active halo control with pulsed hollow
electron lenses
Abstract
We present the results of numerical simulations and experimental studies about the effects of resonant and random excitations on proton losses, emittances, and beam distributions in the Large Hadron Collider (LHC). In addition to shedding light on complex nonlinear effects, these studies are applied to the design of hollow electron lenses (HEL) for active beam halo control. In the High-Luminosity Large Hadron Collider (HL-LHC), a considerable amount of energy will be stored in the beam tails. To control and clean the beam halo, the installation of two hollow electron lenses, one per beam, is being considered. In standard electron-lens operation, a proton bunch sees the same electron current at every revolution. Pulsed electron beam operation (i.e., different currents for different turns) is also considered, because it can widen the range of achievable halo removal rates. For an axially symmetric electron beam, only protons in the halo are excited. If a residual field is present at the location of the beam core, these particles are exposed to time-dependent transverse kicks and to noise. We discuss the numerical simulations and the experiments conducted in 2016 and 2017 at injection energy in the LHC. The excitation patterns were generated by the transverse feedback and damping system, which acted as a flexible source of dipole kicks. Proton beam losses, emittances, and transverse distributions were recorded as a function of excitation patterns and strengths. The resonant excitations induced rich dynamical effects and nontrivial changes of the beam distributions, which, to our knowledge, have not previously been observed and studied in this detail. We conclude with a discussion of the tolerable and achievable residual fields and proposals for further studies.
I Introduction
| Collider | Tevatron (protons) Holmes et al. (2011) | LHC 2016 Wenninger (2017) | LHC nominal Brüning et al. (2004) | HL-LHC Apollinari et al. (2017) | FCC Benedikt and Zimmermann (2016, 2018) |
|---|---|---|---|---|---|
| Beam energy [TeV] | 0.98 | 6.5 | 7.0 | 7.0 | 50.0 |
| Number of bunches | 36 | 2220 | 2808 | 2748 | 10600 |
| Number of particles per bunch | |||||
| Stored beam energy [MJ] | 1.6 | 265.9 | 362.2 | 678.0 | 8480 |

In circular accelerators and storage rings, beam quality can be affected by the interplay of external excitations with machine lattice. This work, through calculations and experiments, focuses on how a certain class of resonant excitations influences beam dynamics and to which extent these excitations can cause beam losses, emittance growth, or changes in the particle beam distributions. Besides their general relevance to the topic of complex nonlinear dynamics, these studies were motivated by the need to assess the effects of a pulsed hollow electron lens for active beam halo control.
Considering past, current and future high energy colliders, each new machine has represented a considerable leap in stored beam energy (Table 1). Furthermore, recent measurements at the LHC show that the tails of the transverse beam distribution are overpopulated compared to a Gaussian distribution. This results in a considerable amount of energy being stored in the beam tails. In particular, in the case of the LHC, about 5% of the beam population is stored in the tails (i.e., above 3.5, where is the standard deviation of the Gaussian beam core), compared to 0.22% in an ideal Gaussian distribution, leading to 19 MJ of stored energy for nominal LHC parameters and 34 MJ in the case of HL-LHC Valentino (2016). This leads to the conclusion that a mechanism is needed to deplete the beam tails in a controlled manner. Further information on the needs for halo control in LHC can be found in Ref. Brüning (2016).
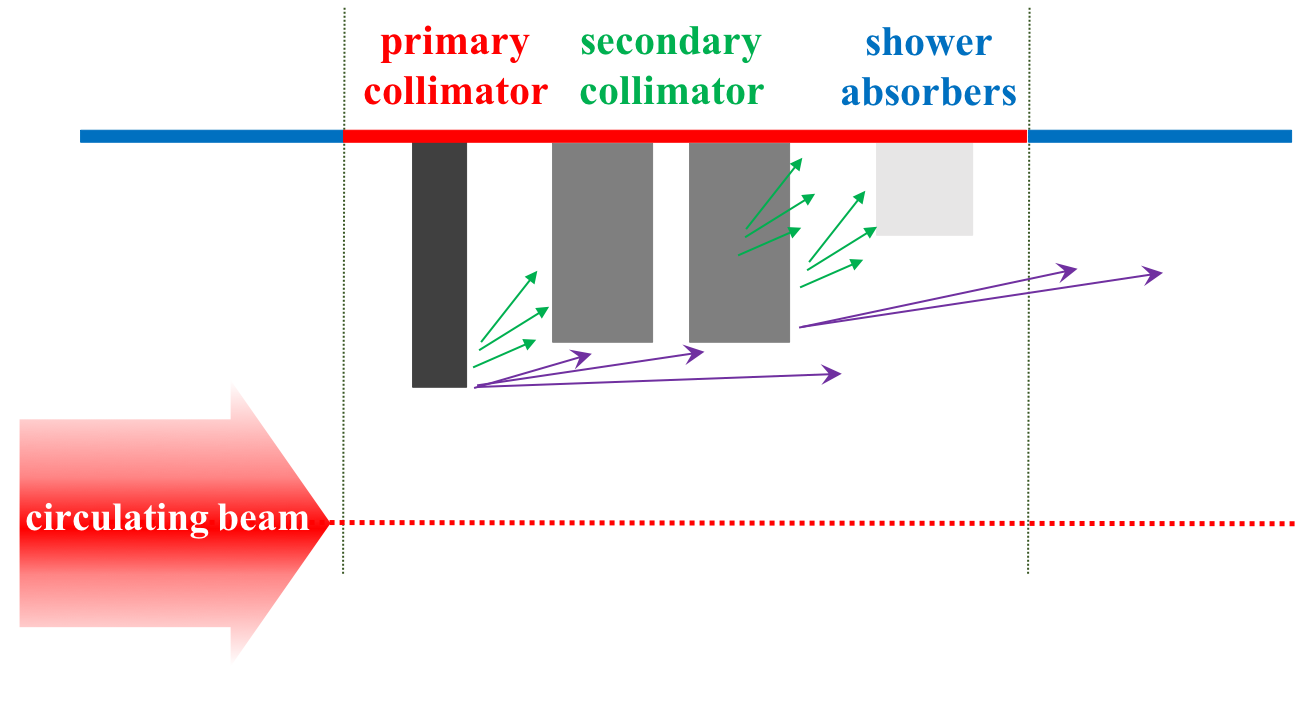
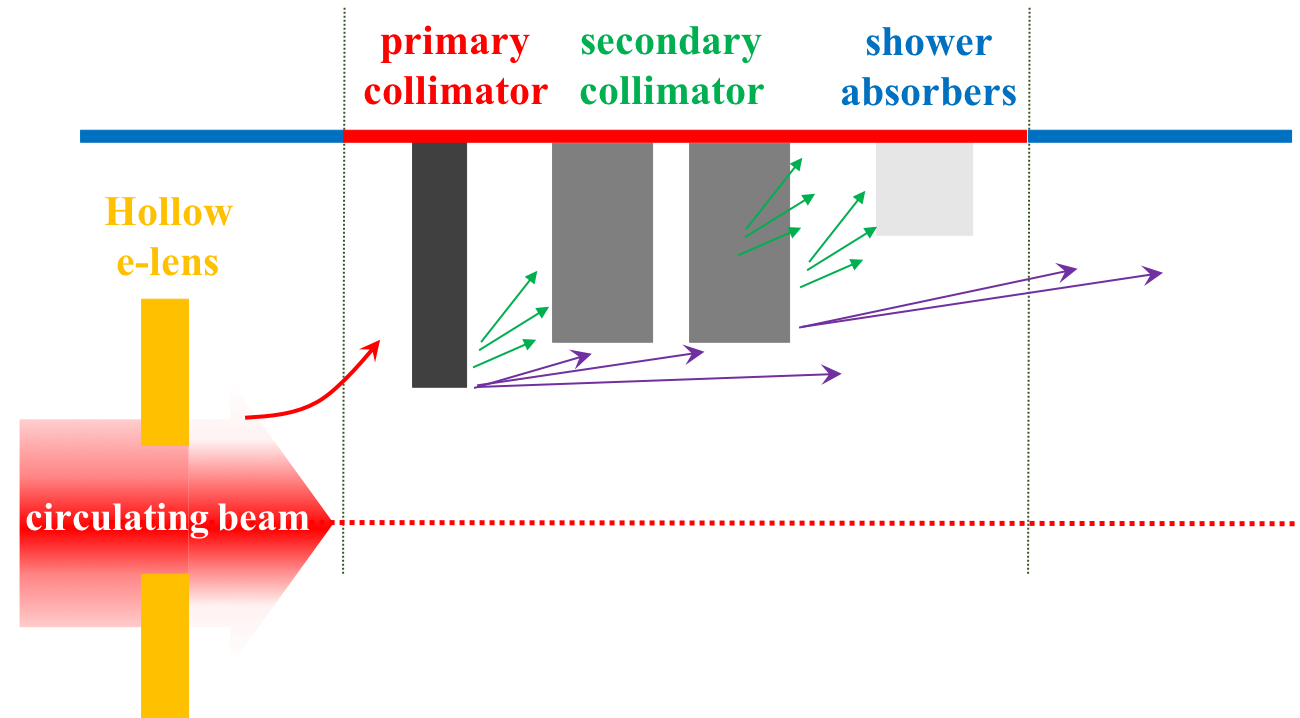
The most direct approach is to decrease the collimator gaps or to periodically scrape the tails. However, this is not feasible, as it would generate unacceptably large loss spikes and possibly component damage. Most promising are methods which increase the diffusion speed in the region of the halo particles, resulting in a smooth and continuous removal of the high amplitude tails, while leaving the core of the beam unperturbed. The diffusing halo particles are then intercepted by the collimation system and removed. This concept is also referred to as active halo control, designed to enhance a conventional passive system, which is still needed to robustly intercept the halo particles. An illustration of the concept is shown in Fig. 1.
In a recent review, the need for such an active halo control system for HL-LHC has been assessed, with the conclusion that it would considerably increase the operational margins and reduce the risks for machine protection Brüning (2016). In view of the need of active halo control for HL-LHC and for future high power accelerators, like HE-LHC and FCC-hh Brüning et al. (2011); Molson et al. (2017), different active halo control methods have been studied Bruce (2016). The hollow electron lens (HEL) is considered the most established, flexible and suitable technology for the HL-LHC Stancari et al. (2011); Brüning (2016).
However, the beneficial effects of an HL-LHC HEL for machine protection and for collimation cannot come at the expense of performance degradation due to losses or emittance growth in the beam core. In standard electron-lens operation, a proton bunch sees the same electron current at every revolution. It is also possible to have different currents for different groups of bunches. Under these conditions, the imperfections of the hollow beam have a negligible effect. On the other hand, in order to extend the range of achievable removal rates, pulsed operation is also being considered. In this case, different currents can be set to act on the same bunch at each turn. If a residual field is present at the location of the beam core, core particles can be exposed to resonant transverse kicks and to noise.
In this paper, we concentrate on the experimental and numerical assessment of possible detrimental effects on the beam core of a pulsed electron lens. Section II gives an introduction to the concept of HELs and summarizes the design parameters of the HL-LHC HELs. Section III is dedicated to the sources of residual fields from the HEL in the core region. Sections IV and V describe the experimental conditions and the setup of the numerical tracking simulations. Results and comparisons between simulations and measurements are given in Section VI, with discussion and summary in Section VII.
II Hollow electron lens for HL-LHC

| Beam parameters | Value | Unit | |
|---|---|---|---|
| B1 | B2 | ||
| Beam energy, | 7 | TeV | |
| Number of bunches, | 2748 | ||
| Bunch population, | |||
| Normalized emittance, | 2.5 | m | |
| Bunch spacing | 25 | ns | |
| Optics parameters at HEL (B1)111As the Twiss parameters at IP4 do not change during the entire squeeze of the optical functions, and IP4 and the HEL are only separated by a drift space, the Twiss parameters stay constant also at the HEL during the squeeze. | |||
| at HEL | 197.5 | 280.6 | m |
| at HEL | 211.9 | 262.6 | m |
| Dispersion at HEL | 0.0 | 0.0 | m |
| Dispersion at HEL | 0.0 | 0.0 | m |
| Proton beam size at HEL | 0.26 | 0.31 | mm |
| Proton beam size at HEL | 0.27 | 0.30 | mm |
| Scale of scraping positions | |||
| 0.27 | 0.31 | mm | |
| Geometry | Value | Unit |
| Length, | 3 | m |
| Desired range of scraping positions | 3.5–9.5 | |
| Magnetic fields | ||
| Gun solenoid, | 0.2–0.4 | T |
| Main solenoid, | 2–6 | T |
| Collector solenoid, | 0.2–0.4 | T |
| Compression factor, | 2.2–5.5 | |
| Electron gun | ||
| Peak yield at 10 keV | 5.0 | A |
| Gun perveance, | 5 | |
| Inner/outer cathode radii, | 6.75/12.7 | mm |
| High-voltage modulator | ||
| Cathode-anode voltage | 10.0 | kV |
| Rise time (10%-90%) | 200 | ns |
| Repetition rate | 35 | kHz |
II.1 General overview
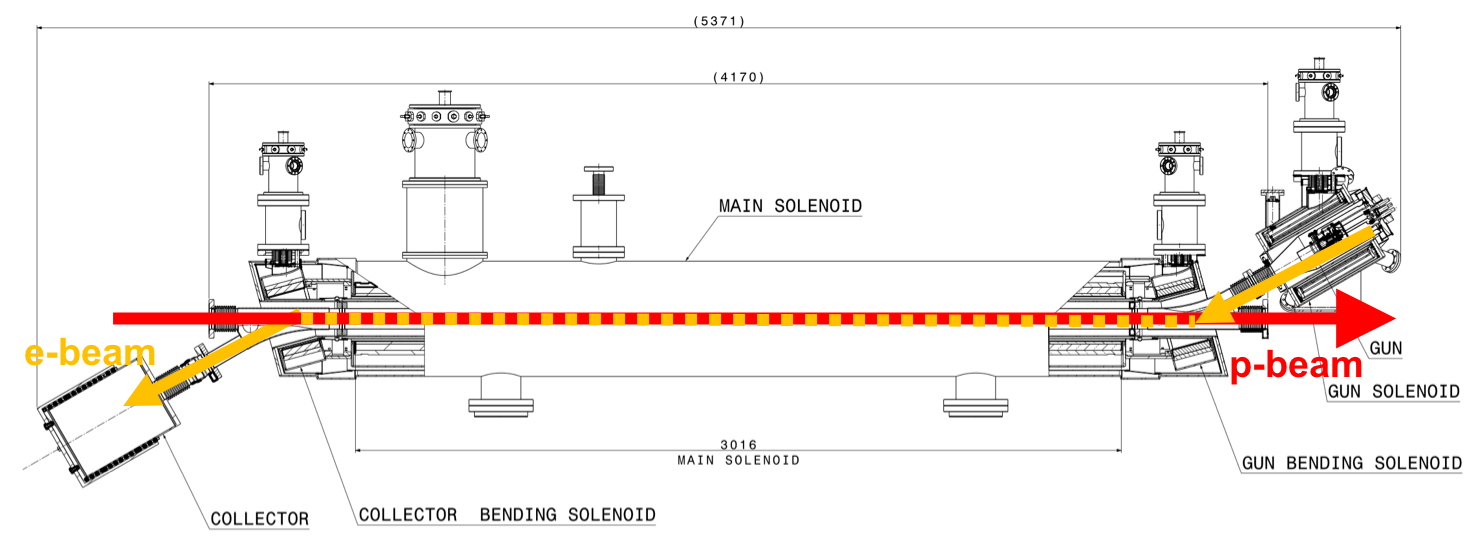
Electron lenses are based upon continuous or pulsed low-energy, magnetically confined electron beams Shiltsev et al. (2008); Fischer et al. (2015); Gu et al. (2017); Shiltsev (2016). The electron beam is generated in an electron gun, guided and confined by strong solenoids and finally dumped in a collector. As an example, the conceptual design of the HL-LHC HEL is shown in Fig. 2.
The circulating beam (protons in the LHC case) is affected by the electromagnetic field of the electron beam. For the application of active halo control, the electron beam needs to generate an electromagnetic field only at the location of the halo particles. This field distribution can be achieved, for instance, by using a hollow charge distribution in radius , uniformly distributed between inner radius and outer radius (Fig. 3). In this case, the circulating proton beam experiences the following radial kick :
| (1) |
where is a shape function with
| (2) |
and is the maximum kick angle given by
| (3) |
with the length of the HEL, the total electron beam current, and the relativistic velocity parameters of electrons and protons, the magnetic rigidity for the proton beam reference particle, the speed of light and the vacuum permittivity. The -sign in Eq. 3 represents the two cases of the electron beam traveling in the direction of the proton beam () leading to “" or in the opposite direction () leading to “". For hollow electron beam collimation, electrons and protons are chosen to counterrotate, so that the magnetic and electric kicks add up. (For simplicity, the dependence of the electron axial velocity on radius is neglected in Eq. 3.)
II.2 Operation modes and effects on the beam core
For the HEL, two modes of operation are currently under consideration: the continuous mode (also referred to as ‘DC’, or direct current, in this paper) as standard operation mode, described above; and the pulsed mode. The main benefit of pulsed HEL operation is the increase in halo removal rates. A wider range of removal rates may become important under operating conditions with small nonlinearities, in particular low chromaticity and octupole current, when the DC mode may be too slow Fitterer et al. (2016a, 2017).
Two different pulsing patterns are considered for the HL-LHC. In both cases, at each passage, a given bunch sees a different electron-lens current and, therefore, experiences a different transverse kick. The patterns are defined as follows:
-
•
random excitation: The extraction voltage in the electron gun is modulated according to the following expression:
(5) where is the maximum voltage, is the modulation strength, with , and is a uniformly distributed random number in the interval . Simulations and experiments, discussed below, were usually conducted with .
-
•
resonant excitation: The electron beam is switched on only every th turn. The excitation can be represented by the following expression:
(6) where is the turn number and is the revolution period. Its Fourier representation is
(7) with and where kT is the Dirac comb. In general, th-turn pulsing drives th-order resonances Fitterer et al. (2016b). This type of pulsing pattern was used in the Tevatron during regular collider operations for abort-gap cleaning Zhang et al. (2008).
For an axially symmetric electron lens, the field at the beam core vanishes. Effects on the proton core arise from imperfections, with two main sources: the injection and extraction bends of the HEL (discussed below in Section III.1), where the electron beam crosses the proton beam; and distortions of the electron beam profile during its propagation under magnetic focusing and space charge (Section III.2). Both sources result in nonlinear kicks Stancari (2014); Morozov et al. (2012). In continuous operation, these nonlinear kicks are usually much smaller than the machine nonlinearities. Tolerances on imperfections are therefore not particularly stringent. The picture changes significantly in case of pulsed operation. If the electromagnetic field does not vanish at the proton beam core, noise or resonant kicks are transferred not only to the halo particles, as intended, but also to the beam core. Tolerances on the residual fields in this case become much more stringent. Studies of the effects of the HEL on the beam core therefore focus on this mode of operation, which is also the main subject of this paper.
III Sources and estimates of residual fields
 |
 |
 |
 |
Parasitic kicks on the proton beam core can be due to electron-beam profile imperfections in the overlap region, or to the injection and extraction toroidal bends, where electrons and protons overlap, as shown in the layout of Fig. 2.
Because no HEL is currently installed in the LHC, the kicks on the proton beam core must be emulated by other devices to determine their effects experimentally in a given machine and to guide design and tolerances. In particular, during the experiments presented in this paper, the LHC transverse damper system (described in detail in Section IV.2) was used for this purpose. This system can generate transverse dipole kicks with a wide range of excitation patterns.
For comparison with experiments and simulations, here we estimate to first order the magnitude of the dipole kicks that may be expected from the HEL. As one can see below, the contribution from the central region is in general dominating.
III.1 Kicks from injection and extraction bends
To estimate the dipole component of the kicks that originate from the injection and extraction bends, we used the approach described in Ref. Stancari (2014). The bends are modeled as a bent cylindrical pipe with a static charge distribution of electrons. The resulting electric field is calculated, with the vacuum pipe as boundary, using the solvers of the warp particle-in-cell code war ; Friedman et al. (2014). (The contribution of the magnetic field generated by the electron current was neglected in this study.) The field, integrated over the trajectory of the protons, is then translated into a symplectic kick map.
In case of a U-shaped electron lens, where electron gun and collector are on the same side, the transverse (and possibly pulsed) dipole kicks generated by the electron charge at the entrance and exit add up. For an S-shaped electron lens, on the other hand, where gun and collector are on opposite sides, these kicks compensate each other. For this reason, an S-shape was chosen for the HL-LHC HEL (Fig. 2). A disadvantage of the S-shape is that the static magnetic kicks due to the toroidal sections do add up, but they can be compensated by conventional dipole correctors, especially in a high-energy machine.
In the case under study of an S-shaped electron lens, residual uncompensated kicks arise from differences in electron charge distribution between the injection and extraction bends. Here we conservatively assume 10% fluctuations between the entrance and exit and, furthermore, that these differences add up.
The maximum values of the integrated electric fields calculated in Ref. Stancari (2014), based upon an electron beam of 1 A at 5 keV, are
| (8) |
Scaling to HL-LHC and HEL design parameters (Table 2 and Table 3) yields the following integrated field and corresponding kick:
| (9) |
as described in detail in Ref. Fitterer et al. (2016b). Assuming a residual difference of 10% between entrance and exit, the expected kick is approximately
| (10) |
III.2 Kicks in the central overlap region
For a perfectly annular and axially symmetric electron beam profile, the electromagnetic field in the region of the proton beam core vanishes. This is expressed by Eq. 2 and is illustrated in Fig. 3. Fields at the location of the proton beam core can arise if the axial symmetry is broken.
Recently, a hollow electron gun prototype for the LHC (called CHG1b) was characterized at the Fermilab electron lens test stand hel . An example of a measurement of the electron beam current density is shown in Fig. 4.
In the test stand, only resistive solenoids are available. One can estimate the fields generated by the compressed electron beam profile in the superconducting solenoids of the HL-LHC HEL using a combination of experimental measurements and calculations.
Experimentally, it was verified that the current-density profiles scale with electron beam current and confining axial field according to space-charge evolution Jo et al. (2018); Stancari (2018). Specifically, the same profile is obtained for a given family of experimental conditions with constant ratio , where is the accelerating voltage and is the axial field. This ratio is proportional to the space-charge evolution number , representing the number of rotations in the propagation time , with the diocotron frequency, the plasma frequency, and the cyclotron frequency of the magnetically confined electrons in the solenoid Davidson (2001).
For a given HL-LHC HEL configuration, the corresponding current-density profile measured in the Fermilab test stand is used as input to calculate the electromagnetic fields. For the purpose of estimating the residual fields, the measured distribution is compressed to the inner electron beam radius of 1.24 mm, corresponding to , as described in Table 2 and Table 3. A distribution with about particles is generated according to the measured current-density profile. As boundary condition, the LHC inner beam pipe radius is used. The potential and fields are then calculated with warp war ; Friedman et al. (2014). The resulting relative electric field strengths are shown in Fig. 5. The electric field is obviously proportional to the charge density of electrons. Its relative strength is rather insensitive to the hollow beam radii, as long as these remain small compared to the beam pipe radius. Further details on the measurements and warp simulations can be found in Ref. Stancari (2018).
Using these measurements and calculations of the relative electric field strengths in the transverse plane (Fig. 5), we obtain a median field in the hole of
| (11) |
For a maximum kick of 392 nrad, as derived in Eq. 4, the estimated dipole kick amplitude at the proton beam core is therefore approximately
| (12) |
The relative magnitude of the residual field depends on several factors, including cathode quality, electron gun geometry, solenoid field configuration, space-charge evolution, etc. It can be improved, if needed.
For the purposes of this paper, only the approximate magnitude of the residual dipole kick is considered. In general, the field map, including its multipolar components, can be parameterized in symplectic form, as described for instance in Ref. Stancari (2014), and used in tracking codes to estimate the effects on the circulating beam.
IV Experimental setup
| Parameter | Experiment 2016 | Experiment 2017 |
|---|---|---|
| beam | Beam 1 | |
| beam energy | injection energy, 450 GeV | |
| single bunch intensity | ||
| normalized emittance | – | |
| bunch length | 1.3 ns | |
| bunch length | 9.7 cm | |
| number of bunches | ||
| (+ 1 pilot + 12 nominal) | ||
| injection optics, | standard optics 2016 | standard optics 2017 |
| Landau-damping octupoles | for MOF circuit and | |
| for MOD circuit (standard 2016 settings) | ||
| working point | (64.28, 59.31) | (62.27, 60.295) |
| chromaticity | (+15, +15) | |
| pulsing patterns | 7th turn H | 7th turn H, V, H+V |
| 10th turn V | 8th turn H, V, H+V | |
| random H, V, H+V | ||
| 2016 experiment |
 |
| 2017 experiment |
 |
IV.1 Overview
The purpose of the experiments at the LHC is to quantify the effects of a pulsed excitation on the proton beam core. In addition, these measurements provide an experimental basis to guide the design and tolerances on the residual HEL fields at the location of the beam core, in case resonant excitation is needed for HL-LHC.
Two experiments were conducted, one in 2016 Fitterer et al. (2016c) and one in 2017 Fitterer et al. (2018). Beam and machine parameters are summarized in Table 4.
During the experiments, losses were measured with the fast beam current transformers (FBCTs). Transverse beam profiles and emittances were provided by the beam synchrotron radiation telescope (BSRT) Trad (2015). All instruments were capable of delivering bunch-by-bunch data. The data analysis of the BSRT profiles is quite involved. In this paper, we focus on the direct comparison of the resulting profiles. A detailed description of the profile analysis can be found in Ref. Fitterer and Stancari (2017), with individual experiments reported in Refs. Fitterer et al. (2016c, 2018).
The choice of excitation patterns for the experiments was guided by losses and emittance growths calculated in numerical tracking simulations, described below. It was chosen to study experimentally the two pulsing patterns with the largest calculated effects on the beam (7th- and 10th-turn pulsing), one pattern with no effect (8th-turn pulsing), and the random excitation. In order to quantify the reproducibility of the results under different machine configurations, one pulsing pattern (7th-turn pulsing) was tried first in 2016 and then repeated in 2017.
IV.2 Excitations with the transverse damper and bunch filling schemes
The primary function of the LHC transverse damping and feedback system, also known as ADT, is to mitigate injection oscillations and to actively damp the coupled-bunch instabilities driven by machine impedance Linnecar et al. (2008); Höfle et al. (2011). The main building blocks of the system are the following: strip-line pickups at positions Q7 and Q9 near Interaction Point 4 (IP4) of the LHC, which are connected to the beam position measurement modules at the surface; the digital signal processing modules (mDSPU); and a set of tetrode power amplifiers feeding electrostatic kickers in the same radio-frequency sector of the LHC (IP4).
Because of its flexibility and state-of-the-art hardware, the system is being routinely used for sophisticated beam excitations. These include abort- and injection-gap cleaning, excitation of individual bunches for tune and linear-coupling measurements, and other special modes of operation for dedicated experiments in the LHC.
The transverse feedback is in general active during all phases of LHC operation. The typical machine cycle requires a short damping time of 10–20 turns (high feedback gain) for injection oscillation damping. During the acceleration ramp and during collisions, the damping time is increased to 50–100 turns (lower feedback gain).
Because the damper is always active in operations, it is critical that the noise introduced by the system does not cause any measurable emittance growth, and this fact was verified experimentally Buffat et al. (2017a). All excitation signals described in this paper were digitally synthesized in the ADT’s digital signal processing units and are therefore assumed to be ‘noise-free.’ The observed effects on the beam are attributed to the applied excitations and the effects of unwanted residual noise are assumed to be negligible.
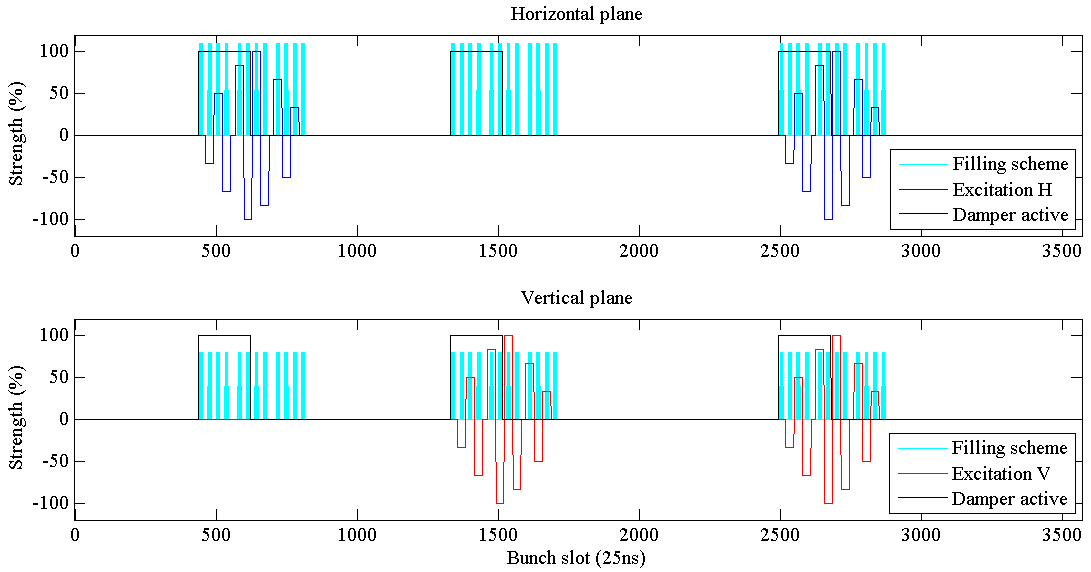
The resonant excitation experiment in 2017 involved simultaneous measurements on 3 groups of 72 bunches, with dedicated excitation patterns and transverse feedback configurations (i.e., damper active or damper off) on each subset of 6 bunches. In 2016, a similar configuration was used, with 48 bunches in total and subsets of 4 bunches. Both schemes are illustrated in Fig. 6. A total of 5 different amplitudes could be applied simultaneously to different subsets of bunches, denoted as , with . In addition, there were reference bunches without excitation for each transverse feedback configuration and excitation plane. Observables (losses, emittances, etc.) were averaged over each subset of bunches experiencing the same excitation and damping conditions.
In 2017, the excitations in the horizontal and vertical planes were generated by a different set of signal-processing devices, but synchronized at a turn-by-turn level. Therefore, the bunches of the third group of 72 bunches (see Fig. 6) were affected by the kicks in both horizontal and vertical planes during the same turn.
The experiments were usually split in time into 3 different periods:
- Period 1
-
No excitation was applied, to allow the beam to reach an equilibrium state after injection.
- Period 2
-
The excitation was applied with a first maximum excitation amplitude of .
- Period 3
-
The maximum excitation amplitude was further increased to .
Each period lasted approximately 10–15 minutes, which was considered long enough to allow the beam to reach its new equilibrium state. In the discussion of the experimental results (Section VI below), the 3 periods are labeled according to the maximum excitation amplitude , and subsets of bunches with the same excitation amplitude () are grouped by color.
The proton deflection angle generated by the ADT kicker was calculated from the kicker geometry and from the excitation voltage on the deflection plates. The voltage depends on a complex chain of hardware (digital signal processor, transmission lines, low- and high-power amplifiers, etc.). In 2016, the kick was estimated from the operational system parameters and it was assigned an uncertainty of 50%. In 2017, the excitation voltage could be indirectly measured once, using the probes mounted on the kickers, with an estimated uncertainty of 10–15%. A precise in-situ calibration was not possible due to the limited machine availability for dedicated studies.
The maximum ADT kick strength that could be obtained at injection without risking saturation was approximately 100 nrad. For the experiments, a maximum nominal kick strength of 96 nrad was chosen.
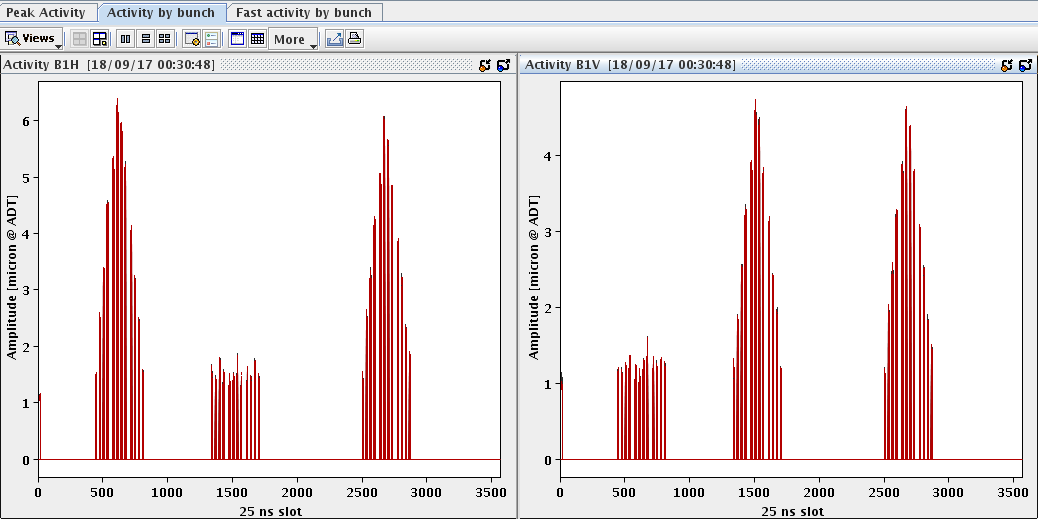
Figure 7 shows an example of the oscillation amplitude of each bunch centroid in both horizontal and vertical planes, captured by the LHC real-time transverse activity monitor during the 2017 experiments, when the beam was excited every 8th turn. The measured activity shows the typical amplitude of bunch centroid excursions and reflects the expected excitation pattern.
V Numerical tracking simulations
| Parameter | distribution | FMA |
|---|---|---|
| beam | Beam 1 | |
| beam energy | 450 GeV | |
| normalized emittance | ||
| bunch length | 1.3 ns | |
| bunch length | 9.7 cm | |
| particle distribution | 6D Gaussian distribution with particles | equally spaced grid in up to , with |
| turns tracked | ||
| optics | 2016 or 2017 injection optics, with at IP1 and IP5 | |
| machine imperfections | standard errors, with 222Orbit errors are disabled due to different implementation of the coefficients in lifetrac and mad-x. errors are adjusted to yield an average peak -beat of 15% over 60 seeds, as observed in optics measurements in the LHC. | no errors |
| octupoles | , | |
| tunes | (64.28, 59.31) for 2016, (62.27, 60.295) for 2017 | |
| chromaticities | (+15, +15) | |
| transverse aperture | ||
| longitudinal aperture | ||
For the preparation and interpretation of the experiments, two different types of simulations were performed:
-
•
tracking of a Gaussian distribution, referred to as ‘distribution tracking’ in this paper, to obtain particle loss rates and emittance evolution;
-
•
frequency-map analysis (FMA), to visualize the location and intensity of resonances Laskar (2003).
For both simulation types, the tracking code lifetrac Shatilov et al. (2005) was used. The simulation parameters are summarized in Table 5. Further details are given in Refs. Fitterer et al. (2016b, 2018).
Quantitative predictions of loss rates and emittance growth are in general challenging, as both observables are influenced by several factors. For instance, the natural noise present in the machine (originating from mechanical vibrations, current ripple in the magnet power supplies, etc.) may have complex interactions with the external excitations. In the LHC, noise sources at top energy are well characterized, whereas they are not well known at injection, presenting an influential but undefined input for simulations. An estimate is obtained by scaling the value at 6.5 TeV Buffat et al. (2017b); Barranco Garcia et al. (2016) with proton magnetic rigidity to the injection energy of 450 GeV. This yields a maximum kick amplitude at the transverse damper of approximately
| (13) |
Collective effects, such as intra-beam scattering and electron cloud, influence the time evolution of losses and emittance as well. To minimize their effects, experiments were done at low bunch intensities ( protons per bunch). The presence of collective effects was neglected in these simulations.
The results of tracking simulations are discussed below in Section VI together with the experimental results, to enhance the understanding and interpretation of the models and observations.
VI Results
In this Section, we present the experimental observations and compare them with the results of numerical simulations. In Section VI.1, we show which pulsing patterns are predicted to be the most efficient in the LHC. Next, we present results for each of the specific excitation patterns that could be tested experimentally, namely pulsing every 10th turn (Section VI.2), 7th turn (Section VI.3), 8th turn (Section VI.4), and the random excitation (Section VI.5). In Section VI.6, we describe how the transverse damping system influenced the effects of the external excitation sources on losses, beam distributions, and emittances.
VI.1 Dependence on the pulsing pattern
 |
 |
 |
 |
| No excitation | 10th, H+V |
 |
 |
| 7th, H | 7th, V |
 |
 |
| No excitation | 10th, H+V |
 |
 |
| 10th, H | 10th, V |
 |
 |
| No excitation | Random, H+V |
 |
 |
| 7th, H+V | 10th, H+V |
 |
 |
The effect of each pulsing pattern is characterized in terms of the resulting losses and emittance growth, calculated in distribution-tracking simulations.
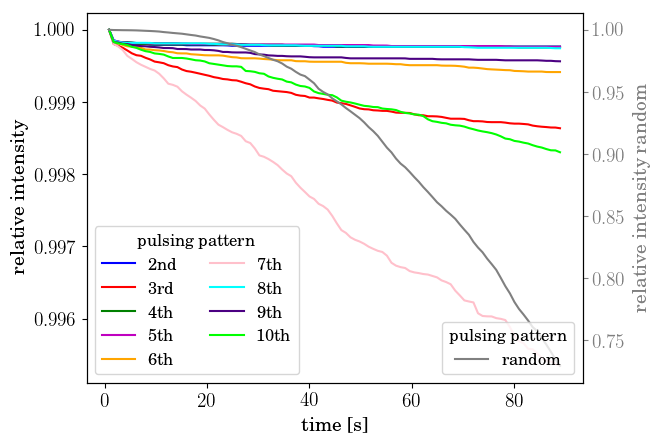
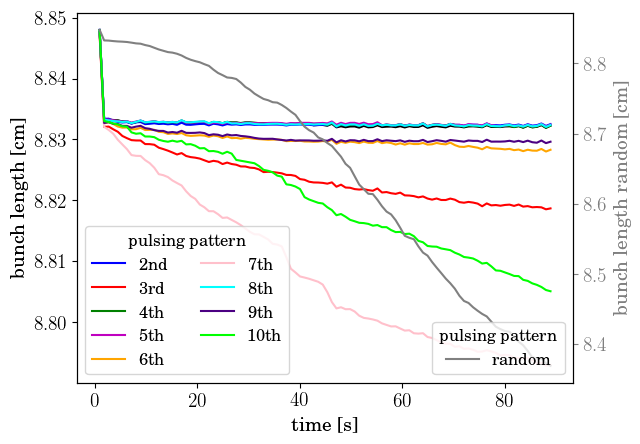
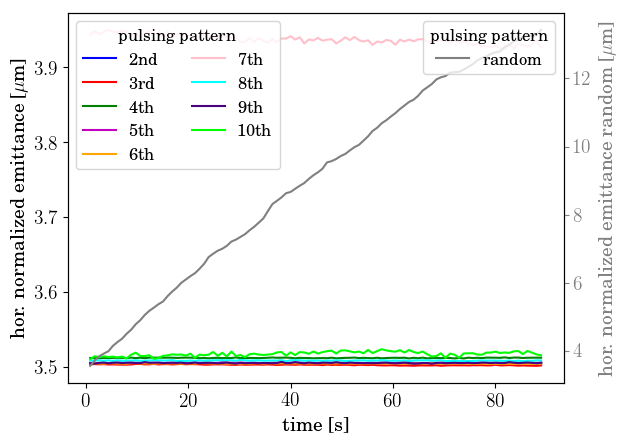
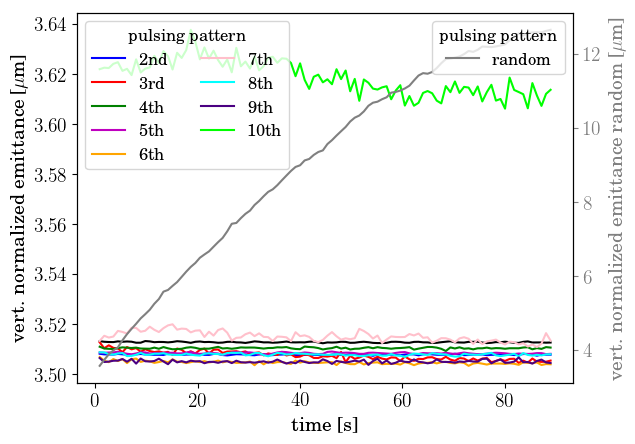
As an example, the simulation results for the 2016 experiment are shown in Fig. 8. A clear dependence of both losses and emittances on the pattern can be seen. The largest losses are predicted for 3rd-, 7th- and 10th-turn pulsing, and for a uniform random excitation. Because the bunch length decreases with the number of lost particles, losses are attributed to off-momentum particles hitting the transverse aperture. Significant emittance growth is visible only for 7th- and 10th-turn pulsing and for the random excitation. Compared to any resonant excitation, the random excitation shows by far the strongest effect.
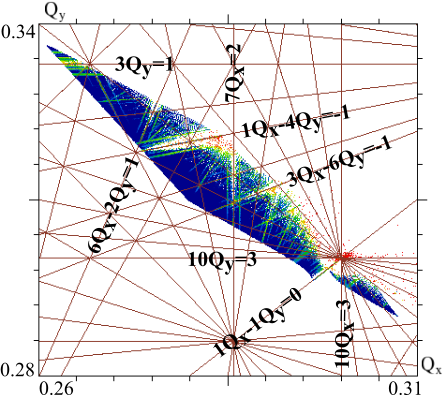
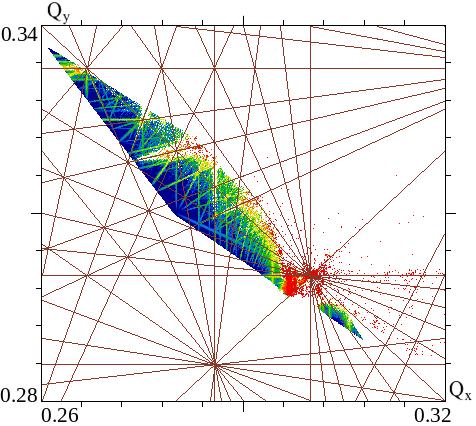
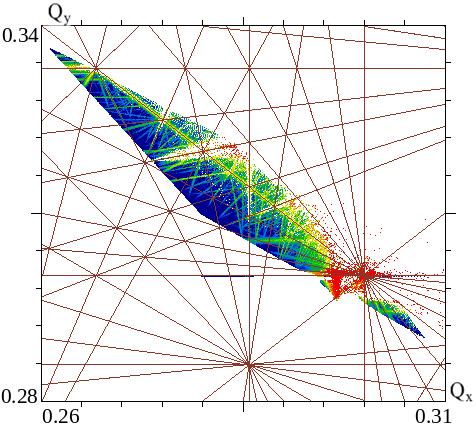
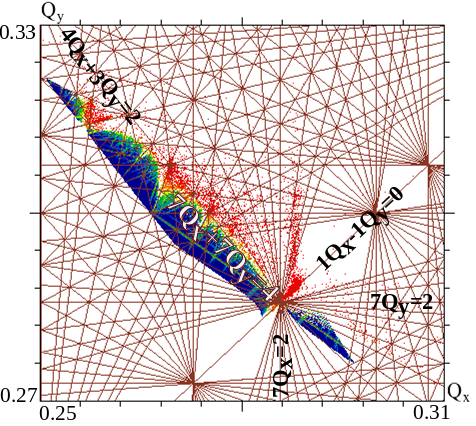
The effects of 7th- and 10th-turn pulsing are also observed in the absence of machine lattice errors. In this case, the only sources of nonlinearity are sextupoles and octupoles Fitterer et al. (2016b), suggesting that these nonlinearities are responsible for the pronounced beam sensitivity. The driven resonances are revealed by the frequency-map analysis, shown in Fig. 9. The resonance is excited by the 7th-turn pulsing, and the and resonances by the 10th-turn pulsing. As octupoles can only drive even resonances, the sources of the resonances are the sextupoles, while the octupoles generate the tune footprint. The other pulsing patterns do not exhibit any increase in losses or emittance growth without magnetic errors. Their effect can thus be attributed to an interaction of the excitation with the machine errors, implying also a sensitivity to the chosen random seed in simulations and to the specific error distribution in experiments.
In Fig. 8, one can see that, in the cases of 7th- and 10th-turn pulsing, the emittances start from an increased initial value and then stay almost constant for the duration of the simulation. This behavior is typical of the resonant excitation and it is not an artifact of the simulation. It was verified that it is due to the adjustment of the input beam distribution to a new equilibrium during the first turns. In all long-term simulations ( turns, corresponding to 89 s) presented in this paper, the beam distribution is saved every turns. Therefore, this initial fast adjustment manifests itself in an increased initial emittance value.
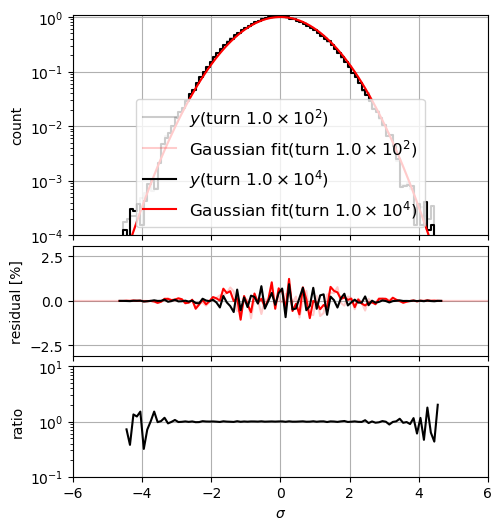
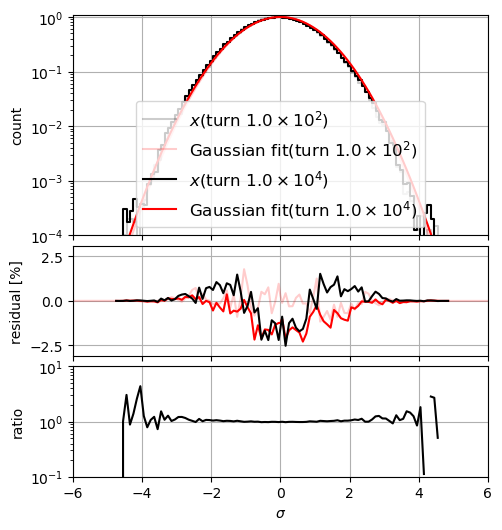
Besides having a larger emittance, the new distribution also differs from a Gaussian distribution. This is illustrated in Fig. 11, which shows, for different excitation patterns, two snapshots of the normalized transverse beam distributions, the ‘initial’ one at turns and the ‘final’ one at turns, and how they differ from each other and from a Gaussian distribution. For instance, for 7th-turn pulsing (bottom left plot in Fig. 11), simulations indicate a clear shift in beam population from the core () towards the regions at and towards the tails at .
Although on a different time scale (minutes instead of seconds), a similar re-adjustment of the beam distribution was directly observed for the first time, to our knowledge, during the 2016 and 2017 LHC experiments presented in this paper, as discussed below.
If only the resonant excitation is present, without noise, simulations show that the modified distribution is stable, with constant emittance. By adding a random noise component, representative of the natural noise present in the LHC, one calculates, after the initial adjustment phase, emittance-growth rates that increase with the amplitude of the excitation. As discussed below, an increase of the emittance-growth rates with the applied excitation amplitude was also observed experimentally.
In the case of random excitation, there is constant emittance growth, without any initial adjustment phase. The interaction with the natural noise sources in the machine results in increased losses and emittance growth, as it is basically equivalent to the application of a random excitation with an increased amplitude. In addition to the experiments presented in this paper, the effect of a random excitation was also studied in a separate experiment at the LHC for the case of colliding beams Buffat et al. (2017b); Barranco Garcia et al. (2016).
VI.2 Pulsing every 10th turn
 |
 |
 |
| Reference bunch, no excitation | Excited bunch, maximum amplitude |
|---|---|
 |
 |
 |
 |
 |
 |
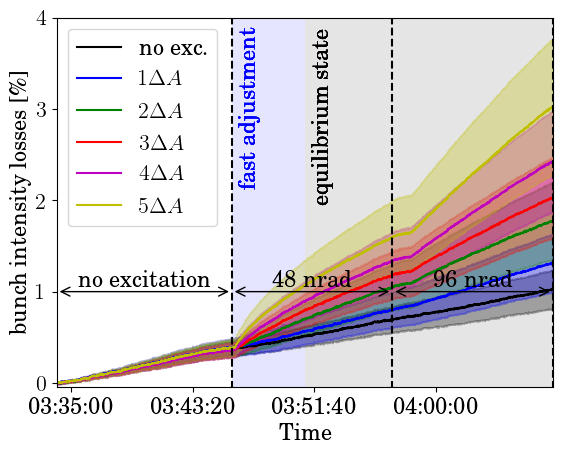
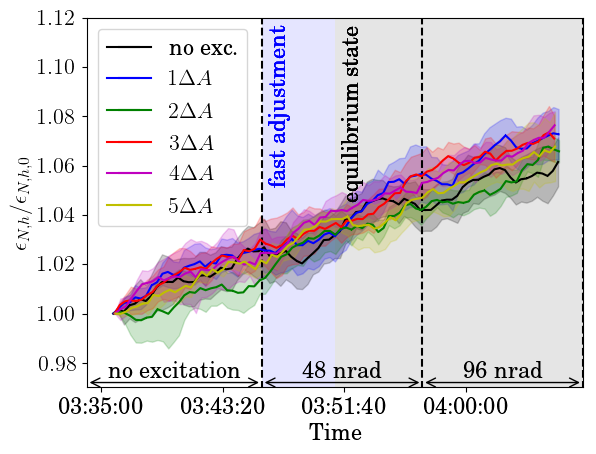
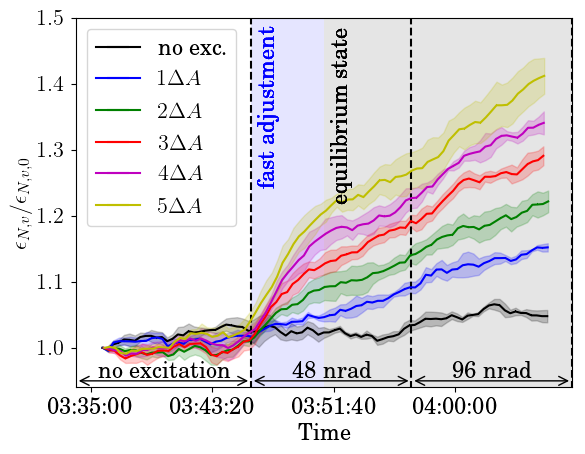
The 10th-turn pulsing pattern was tested in 2016 with an excitation in the vertical plane only. As this was the first time a resonant excitation was tested in the LHC, only 48 bunches were injected, in order to guarantee safe operation of the machine. To test different excitation amplitudes during one fill and have enough statistics, the excitation was only applied in one plane. The experiment started with a period of 12 minutes without excitation, to let the beam distribution fully adjust to its equilibrium state after injection. The excitation was then applied for 11 minutes, with the excitation scheme shown in Fig. 6 and a maximum excitation amplitude of . The excitation was then further increased to the maximum value of and kept for another period of 11 minutes.
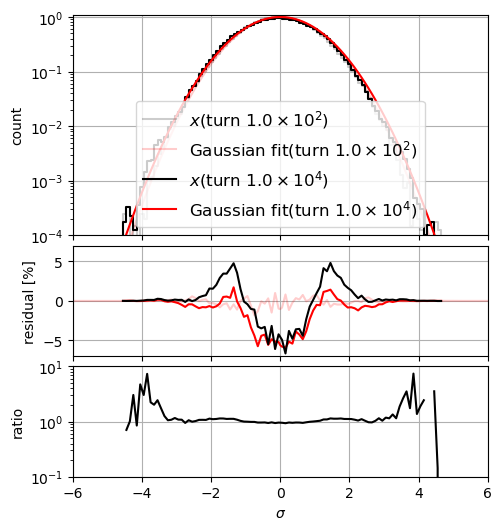
The main observations are collected in Figures 12 and 13. In Fig. 12, one can see the evolution in time of losses and emittances for the control bunches and for the affected bunches, as a function of excitation amplitude. In brief, during both phases of the experiment, the excitation induced the following changes:
As loss rates, emittance-growth rates and beam distributions of the 4 reference bunches were unchanged, the above observations can be directly attributed to the pulsing pattern. The quantitative dependence of the loss rates and emittance-growth rates on excitation amplitude measured in these experiments provides an estimate of the effects of external resonant excitations, such as the residual fields of a pulsed hollow electron lens.
The vertical emittance features a behavior similar to that predicted in simulations: a fast adjustment phase of the beam distribution, which manifests itself as a rapid increase of the emittance, followed by a new equilibrium, inferred from a slower and continuous emittance growth. In Fig. 12, these two phases are indicated in blue and black.
Distribution changes could also be directly observed, thanks to the performance of the Beam Synchrotron Radiation Telescope (BSRT) Trad (2015); Fitterer and Stancari (2017). As an example, Fig. 13 shows the vertical profile of a reference bunch and of a bunch experiencing the maximum excitation and later 96 nrad. While the reference bunch stays unchanged, the distribution of the excited bunch clearly changes and re-adjusts to a non-Gaussian shape, with particles shifting from the core towards the regions at approximately . This behavior is similar to what was calculated in simulations, as discussed in Section VI.1 and in Fig. 11.
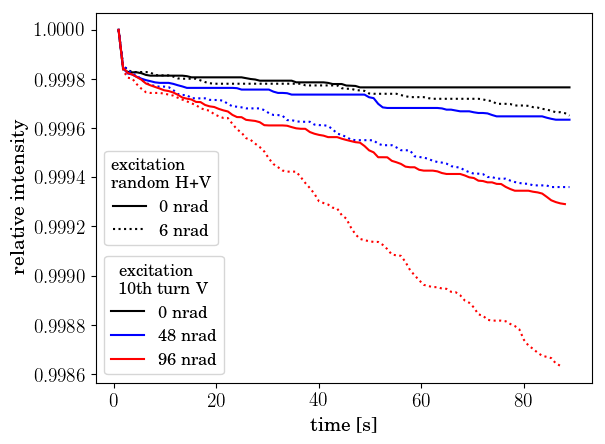
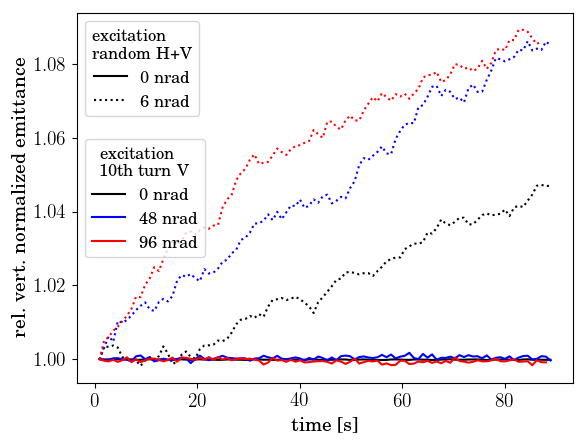
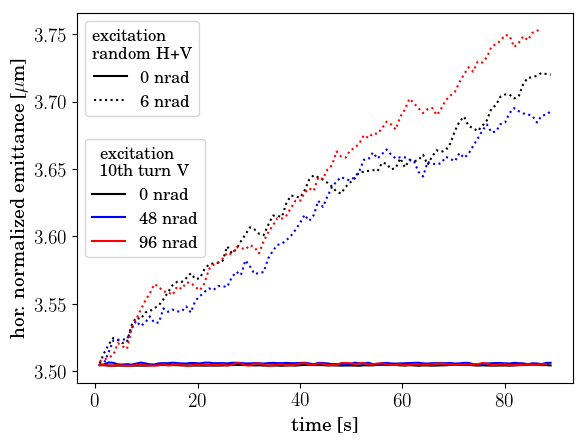
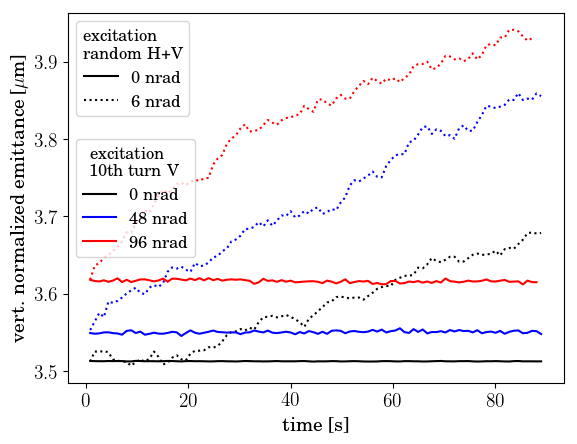
Numerical simulations of intensities and emittances for this experiment are shown in Fig. 14. They are the results of distribution tracking for 10th-turn pulsing without additional noise (solid lines) and with an additional noise component (dotted lines), to emulate the natural noise present in the LHC (Eq. 13). The presence of noise significantly changes the calculated effect of the resonant excitation on both losses and emittances.
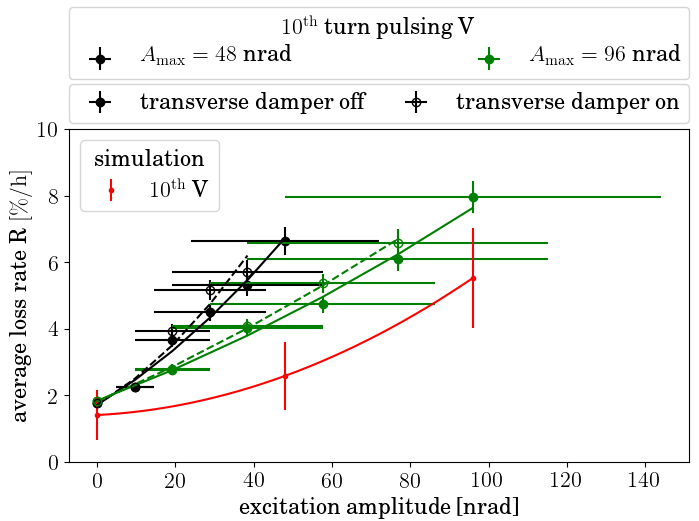
A direct comparison of measured and predicted loss rates is presented in Fig. 15. As experiments and simulations were conducted on different time intervals (11 minutes vs. 90 s), we compare the relative average loss rate :
| (14) |
where is the beam intensity and is the time interval during which the excitation with given amplitude is applied. Uncertainties on the excitation amplitude arise from the calibration of the transverse damping system (Section IV.2). For both experiments and simulations, the error bars on the loss rate are statistical. The magnitude of the random noise component introduces a systematic uncertainty in the calculations, which was not evaluated for the scope of this paper. The systematic uncertainty on the measurements can be inferred from the difference between the 2 periods of the experiment, which should in principle be the same. Part of this systematic effect could be due to the fact that the second set of excitations with double amplitude started with a modified beam distribution. The magnitude of this effect could be verified in future experiments in which the excitations are reversed or where a new beam fill is used for each set of measurements. Overall, we conclude that the effects of this resonant excitation on loss rates could be measured in the LHC within a factor 2 and could be predicted with similar accuracy.
VI.3 Pulsing every 7th turn
| no excitation | 7th, H+V |
 |
 |
| 7th, H | 7th, V |
 |
 |
 |
 |
 |
 |
| 2016 experiment, 7th, H | ||
 |
 |
 |
| 2017 experiment, 7th, H+V | ||
 |
 |
 |
 |
 |
 |
| Reference bunch, no excitation | Excited bunch, 7th, H+V |
|---|---|
 |
 |
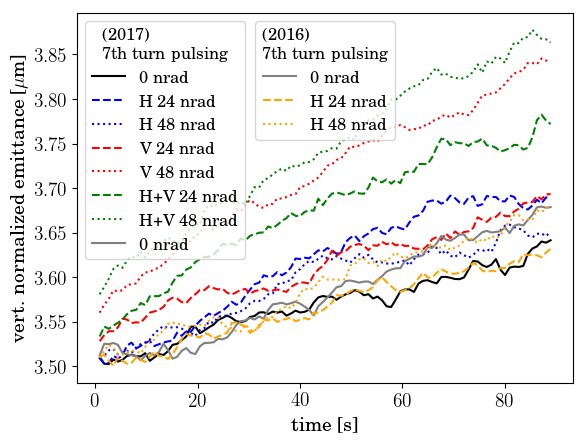
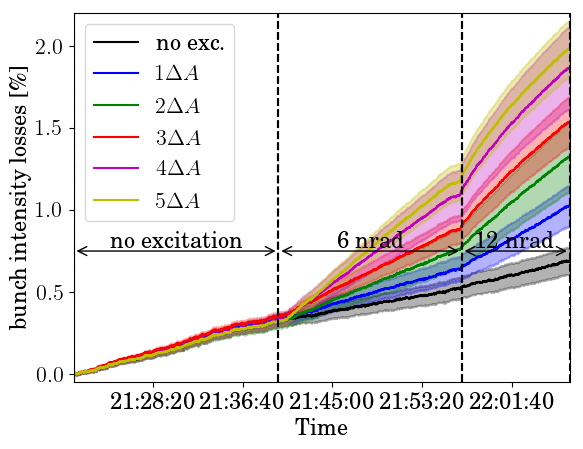
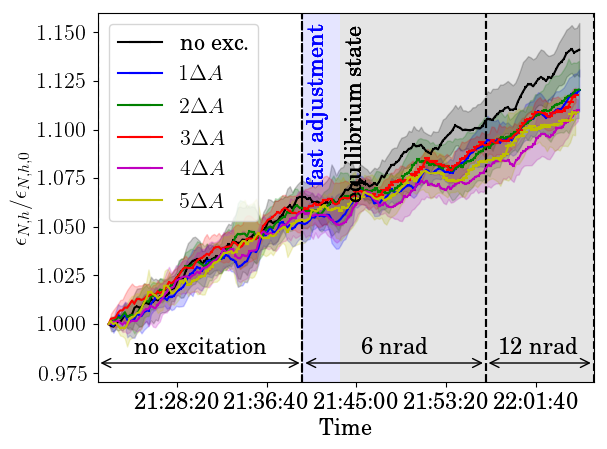
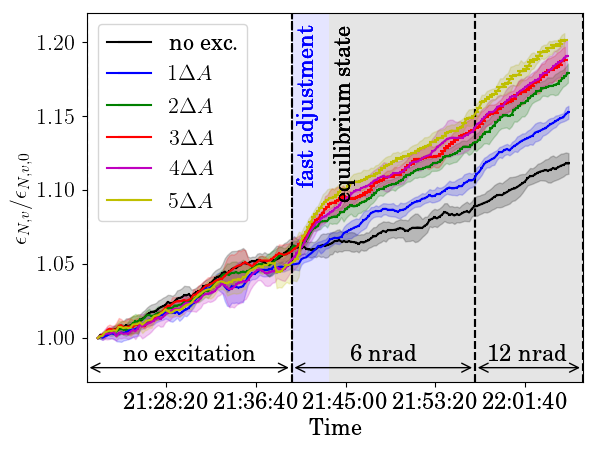
The 7th-turn pulsing pattern was tested during both the 2016 and 2017 experiments. In 2016, the resonant excitation was employed for the first time in the LHC and the experiments were therefore still in an exploratory stage. Based on the experience gained in 2016, the experiments were then repeated more systematically, with more bunches and on both excitation planes.
The experiments were divided into different periods: the first period without excitation; the second period with a resonant excitation with a maximum amplitude of ; and a third period in which the excitation amplitude was further increased to . In 2016, experiments included a fourth period at .
The machine tunes were changed in standard operations from (64.28, 59.31) in 2016 to (62.27, 60.295) in 2017. This change was accompanied by a small change in optics, considered negligible for these measurements. A direct comparison of the two experiments is therefore not possible. However, these differences show how the effects of resonant excitations are affected by small changes in fractional tune.
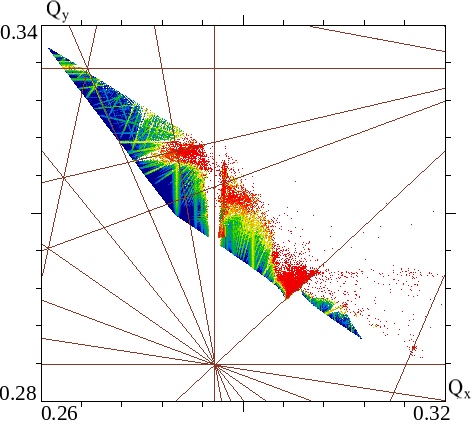
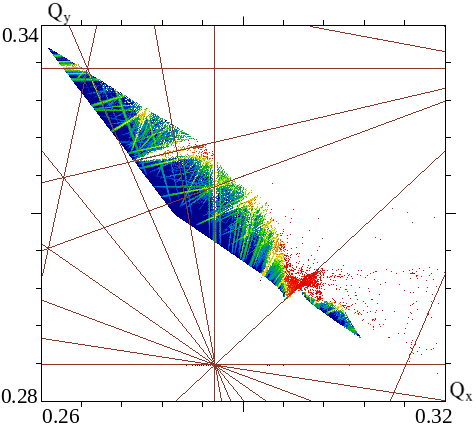
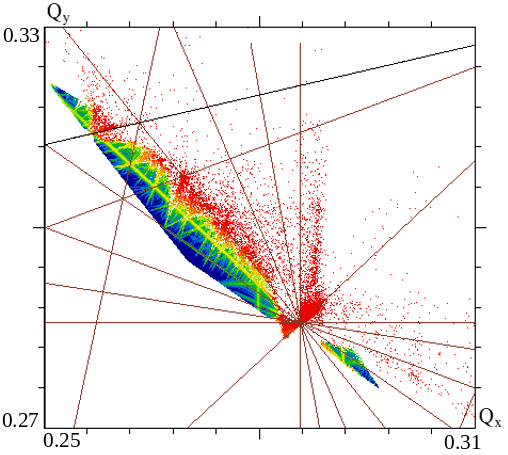
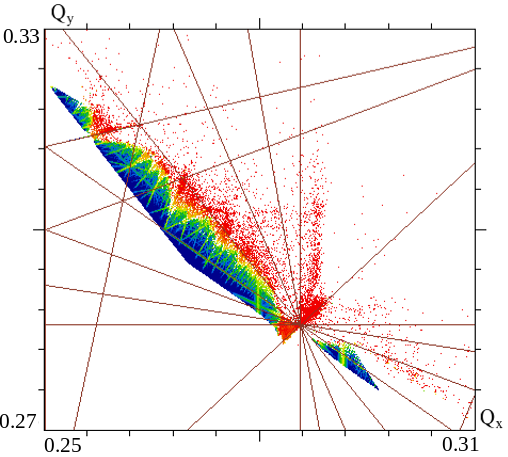
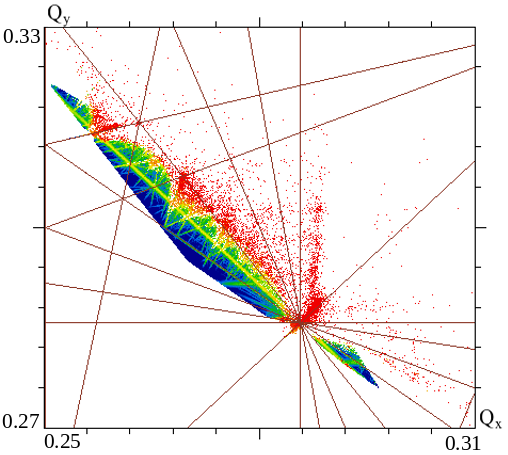
An insight on how the change in tune entails a change in driving resonances is provided by frequency-map analysis. Figure 9 (bottom left and bottom right plots), which was described previously, shows a strong increase in diffusion for 7th-turn pulsing in the horizontal plane around the resonances, and only small changes for pulsing in the vertical plane. In the case of the 2017 optics and tune, both the and the resonances cross the tune footprint (Fig. 16, top left). Both of these resonances are excited by 7th-turn pulsing, as one can see from the increase in tune jitter around the corresponding resonance lines for each excitation plane separately, and thus also for their combined action (Fig. 16, bottom left, bottom right, and top right plots). Although much weaker, an increase in tune diffusion is also observed around the line when pulsing in the vertical plane or in both planes (diagonal yellow-green line in Fig. 16, top right and bottom right plots). This suggests an excitation of the 14th-order resonance. The reason why this phenomenon is much less pronounced for horizontal excitations is not understood.
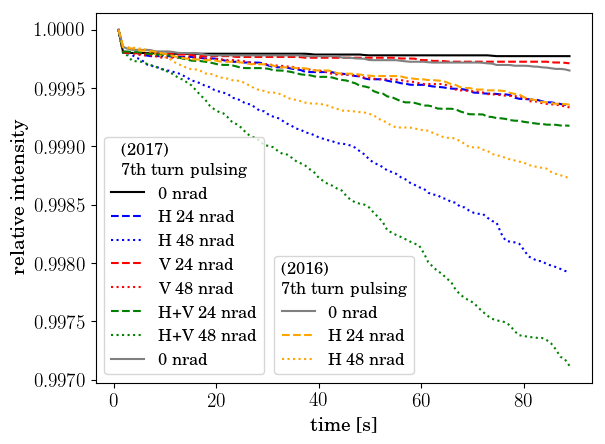
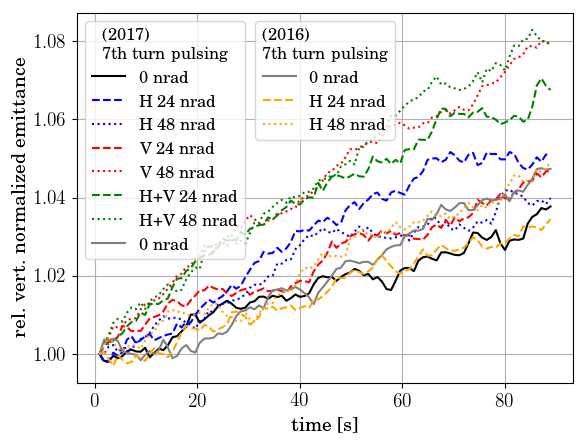
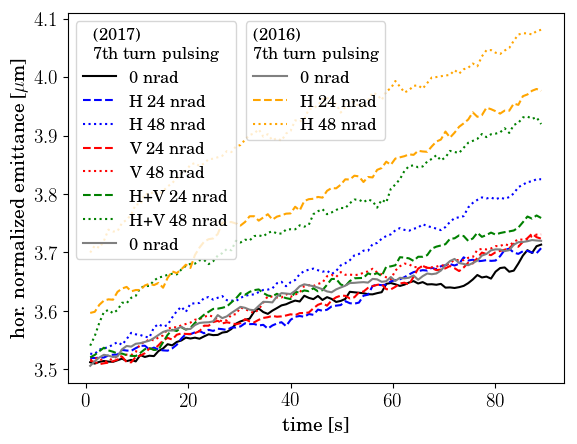
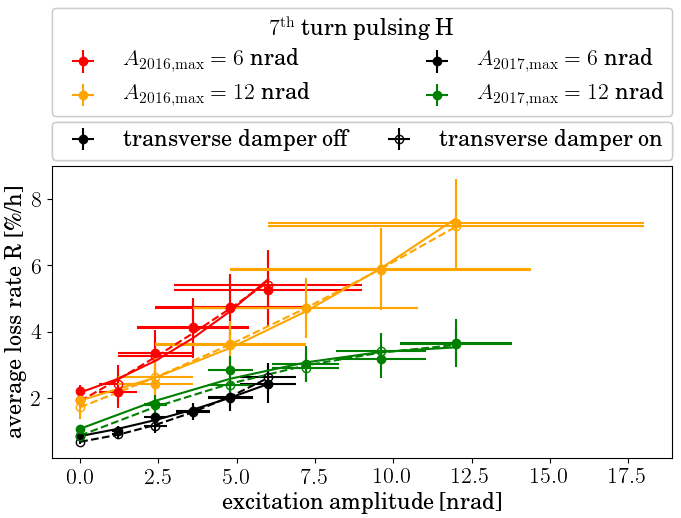
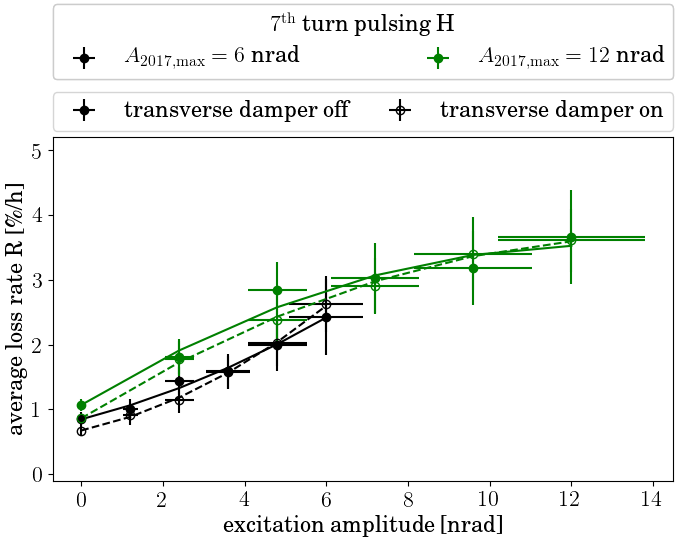
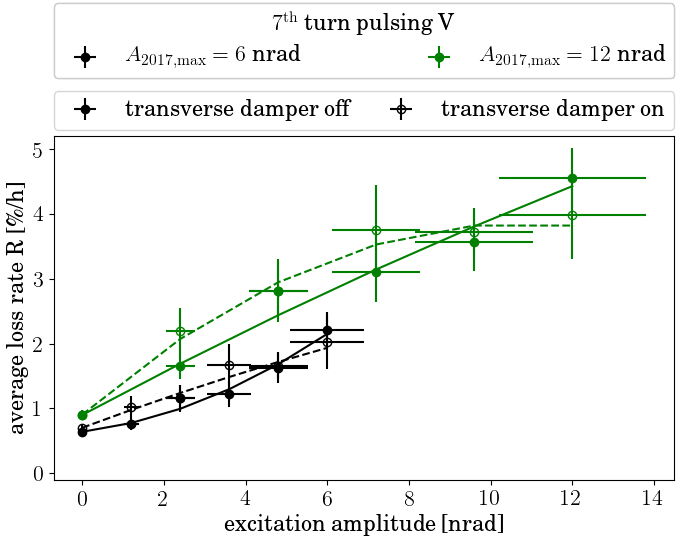
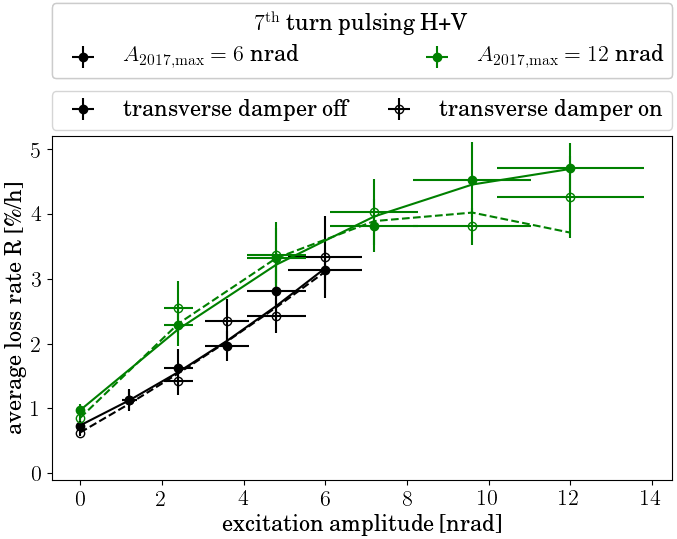
The simulated losses and emittances for both 2016 and 2017 conditions are shown in Fig. 17. The experimental results are summarized in Figures 18, 19, 20, and 21.
Calculated losses for 2016 and 2017 are similar at 24 nrad and increase more rapidly with amplitude for 2017 conditions (Fig. 17, top left). Horizontal pulsing is a few times stronger than vertical pulsing, and the combined H+V action appears slightly more effective than the sum of H and V separately.
Experimental losses are plotted as a function of time in Fig. 18 and as a function of excitation amplitude in Figs. 19 and 20. Figure 19 shows that measured losses were actually larger in 2016 than they were in 2017. They were also a few times larger than those predicted by simulations. Another discrepancy was observed in the excitation plane: horizontal, vertical, and combined pulsing had similar effects (Fig. 20). The same considerations on systematic effects discussed in Section VI.2 apply in this case.
This pulsing pattern generated stronger losses than expected. In this case, we conclude that predictions are difficult, due to their sensitivity to lattice configuration, noise sources, and beam distributions.
The simulated emittances from distribution tracking are shown in Fig. 17 (bottom left and right). The main calculated results are the following, for the two experimental conditions:
- 2016 conditions
-
In this case, excitations were only in the horizontal plane. There is a fast increase of the horizontal emittance, dependent on the excitation amplitude, after which a constant emittance growth is observed. Vertical emittance growth is almost negligible.
- 2017 conditions
-
Horizontal emittances are mostly affected by the amplitude of H+V excitations and, to a much smaller extent, by H excitations; no effect is observed from V excitations. Vertical emittances are mostly affected by the amplitude of H+V and V excitations; the effect of H excitations is much smaller, if any, with no clear dependence on amplitude.
A set of measured emittances is plotted in Fig. 18 (middle and right plots). In 2016, with only horizontal excitations, amplitude-dependent horizontal emittance growth was observed, with no effect on the vertical emittance. In 2017, V and H+V excitations generated vertical emittance growth, while horizontal excitations had no effect. These observations are consistent with the predicted behavior.
During these experiments, emittances changed in two phases, as they did during the 10th-turn pulsing studies (Section VI.2) and in simulations: a fast adjustment phase (shaded in blue in Fig. 18) followed by a new equilibrium (in gray). Changes in the transverse beam distribution could be observed directly through changes in the synchrotron-light (BSRT) profiles (Fig. 21).
VI.4 Pulsing every 8th turn
 |
 |
 |
 |
| No excitation | 8th, H+V |
|---|---|
 |
 |
 |
 |
 |
| Reference bunch, no excitation | Excited bunch, 8th, H |
|---|---|
 |
 |
Excitation patterns that have little effect on the beam core and a large effect on the halo are good candidates for extending the range of hollow electron lens operation. In principle, this is possible because of the highly nonlinear fields generated by the HEL at the transverse locations of the beam halo and the small fields at the beam core. For this reason, the 8th-turn pulsing pattern was chosen for the experimental studies, as simulations indicated much smaller core effects compared to 7th- and 10th-turn pulsing, as discussed in Section VI.1.
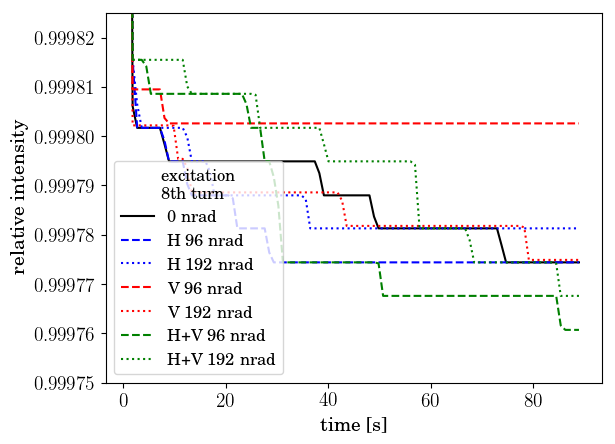
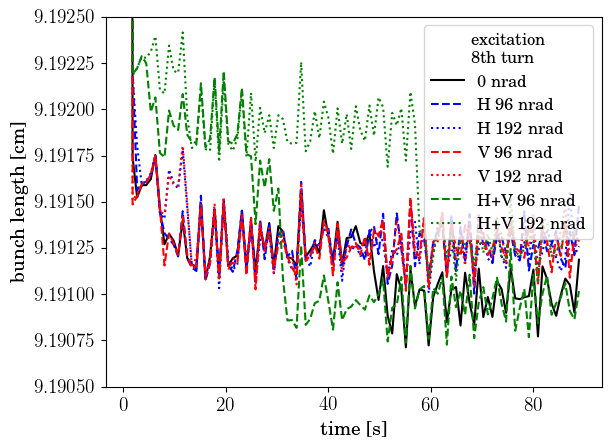
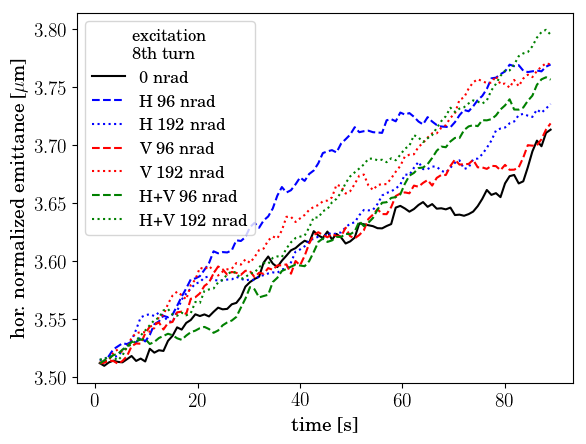
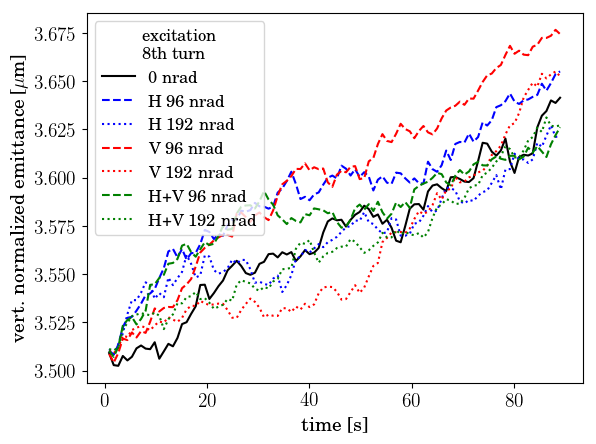
Simulations of intensities, emittances, and bunch lengths for different amplitudes of the 8th-turn excitation are shown in Fig. 22. No significant effects are predicted for excitation amplitudes up to 192 nrad. Horizontal and vertical emittances show small changes in growth rate, but without a clear dependence on the amplitude or plane of the excitation.
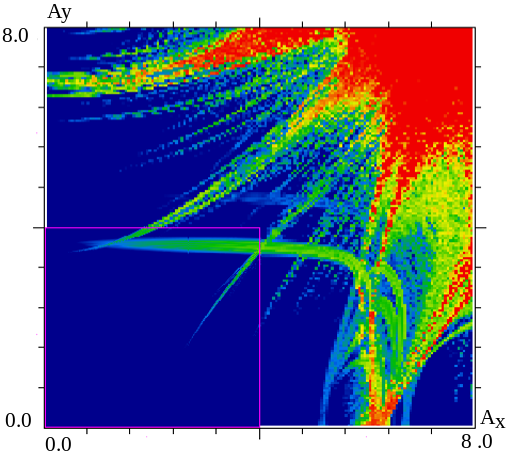
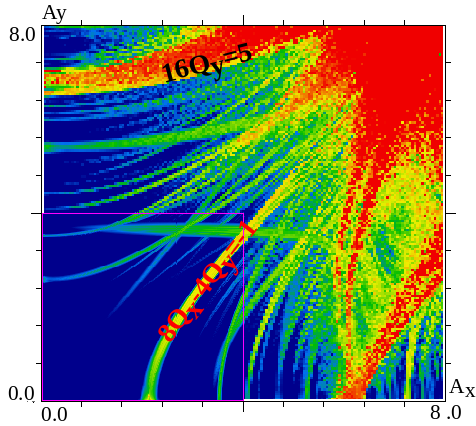
The frequency-map analysis in amplitude space is shown in Fig. 23. It reveals that the driven resonances are of high order, mainly and , and their effect is therefore expected to be small.
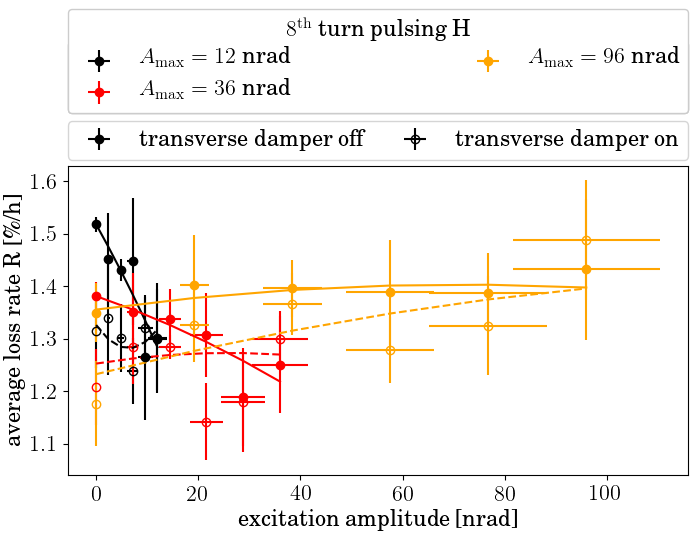
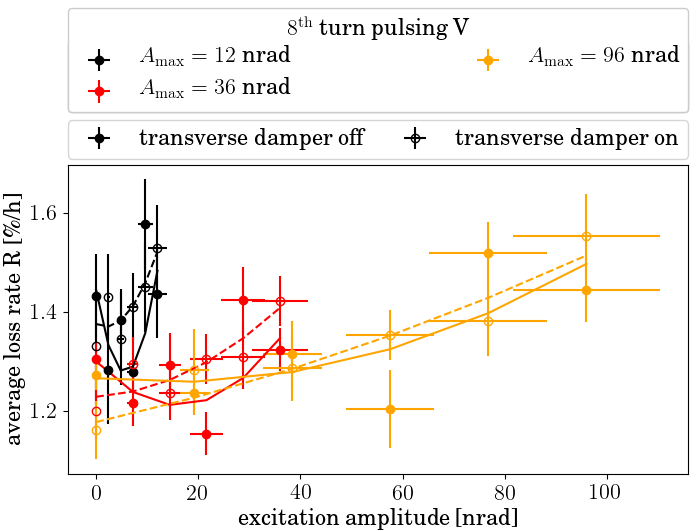
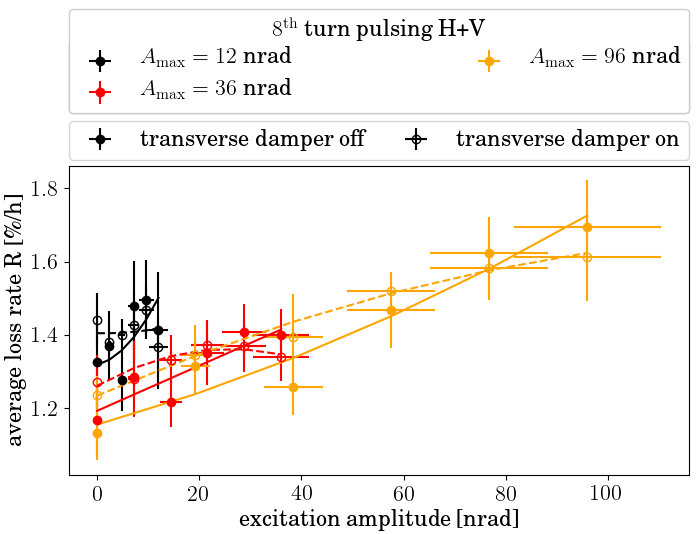
The effects on the beam were tested during the 2017 experiment. The excitation amplitude was increased to a maximum of 96 nrad. The loss rates as a function of excitation amplitude are presented in Fig. 24. For H and V excitations, no significant increase of the loss rate was observed. A weak increase with amplitude was seen in the case of H+V excitation. Observed and predicted loss rates were roughly of the same magnitude (about 0.1–0.4%/h).
Changes in beam distributions were also detected (Fig. 25). The horizontal distribution responded to the H excitation with a slight depletion of the core and a corresponding increase around . For an H+V excitation, one would expect a similar distribution change. However, this change could not be detected directly, because, in this case, the emittance of the control bunches was much smaller () than the emittance of the excited bunches (), and intra-beam scattering masked the effects of the excitation Fitterer et al. (2018). In the vertical plane, beam distributions and emittances were not affected by the resonant excitation.
VI.5 Random excitation
| No excitation | Random excitation, H+V |
|---|---|
 |
 |
 |
 |
 |
 |
| Random excitation, V | ||
 |
 |
 |
| Random excitation, H+V | ||
 |
 |
 |
| Reference bunch, no excitation | Excited bunch, random excitation, V |
|---|---|
 |
 |
 |
 |
 |
The random excitation is a powerful and flexible halo-cleaning pattern, but it is also potentially harmful for the proton beam core. The effects of random noise in various machines have been studied extensively in the past (see, for instance, Refs. Lebedev (1995); Alexahin (1997); Ohmi et al. (2007); Ohmi (2014); Barranco Garcia et al. (2016)).
A random pattern can be employed at full strength or added as a modulation to a continuous mode of operation (depending on the parameter in Eq. 5). During the 2017 experiment, we tested the effects of the random excitation at full strength () and compared it with the resonant excitations.
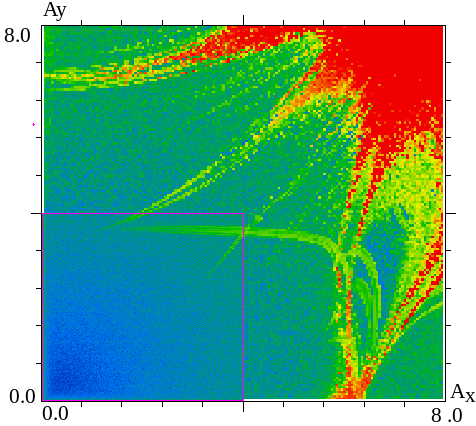
The random excitation excites practically all resonant frequencies in the beam. This can be clearly seen in the FMA example in amplitude space illustrated in Fig. 26. Tune diffusion is increased rather uniformly at all particle amplitudes, and not on specific resonant lines, as it happens for th-turn pulsing.
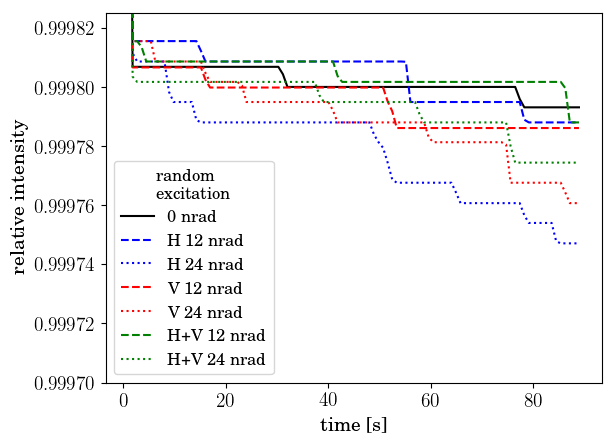
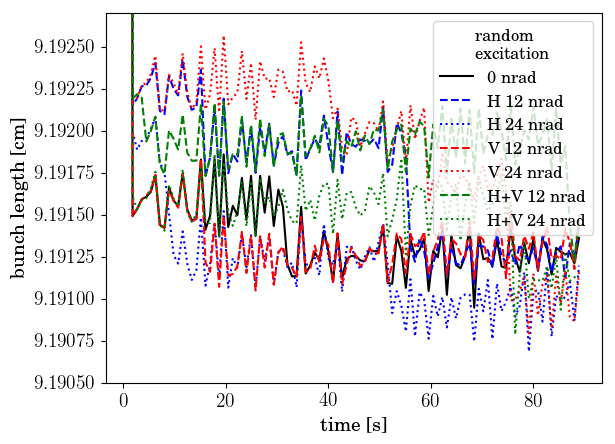
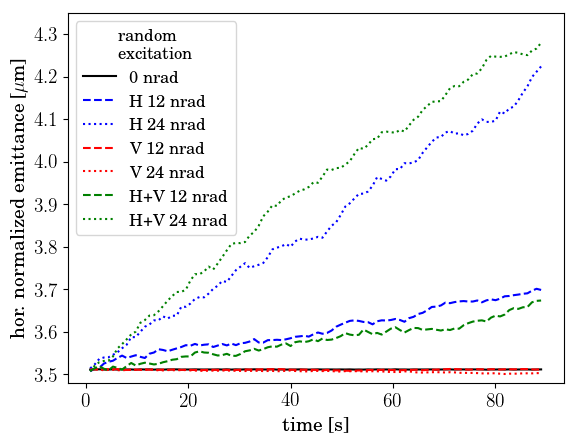
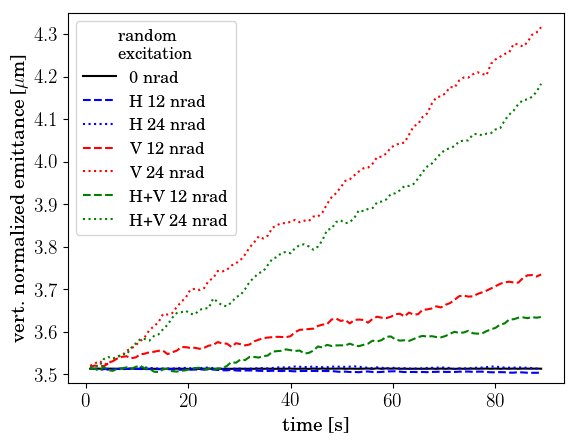
The calculated results of distribution tracking, with excitation amplitudes up to 24 nrad, are shown in Fig. 27. They show the following features:
-
•
negligible losses are observed, independent of the plane of excitation;
-
•
there is no significant change in bunch length;
-
•
emittance growth is only generated by excitations in the same plane (or in both planes);
-
•
horizontal and vertical emittance growth rates are large and comparable in magnitude;
-
•
when the excitation is applied in both planes, a small increase or decrease in the emittance growth rate is observed with respect to the cases of separate excitations, an effect likely due to lattice coupling;
-
•
emittance growth takes place at a constant rate, without the initial adjustment phase characteristic of th-turn pulsing.
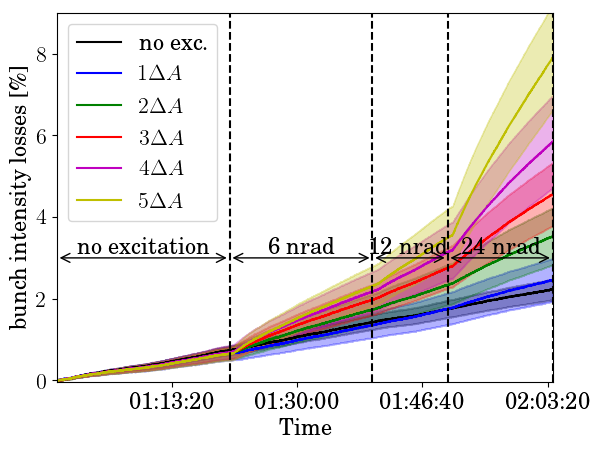
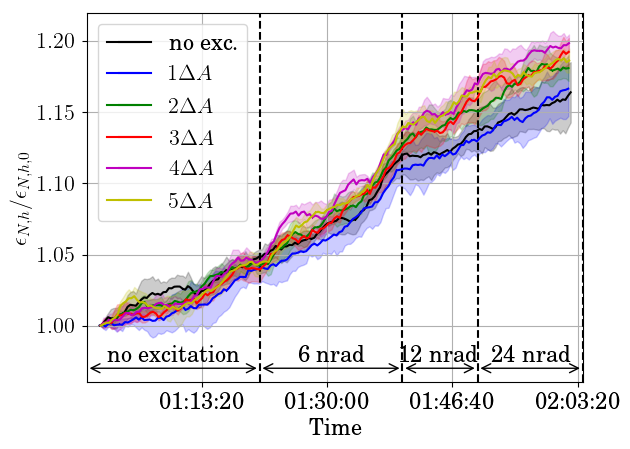
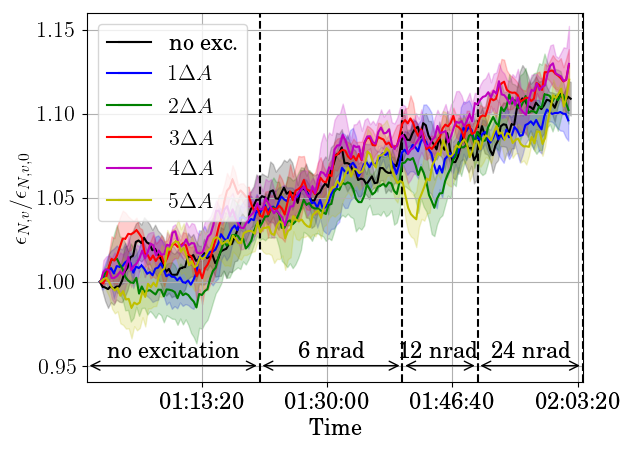
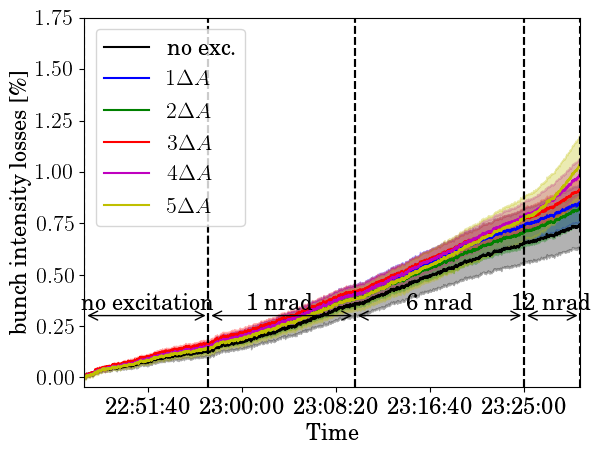
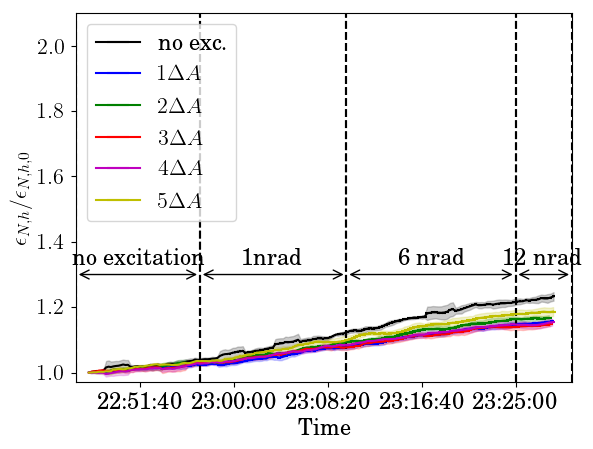
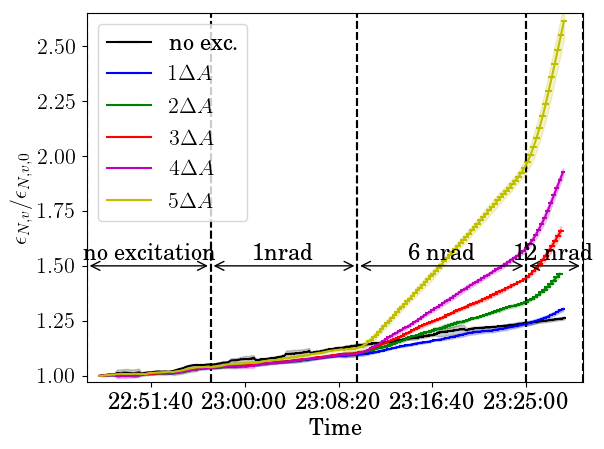
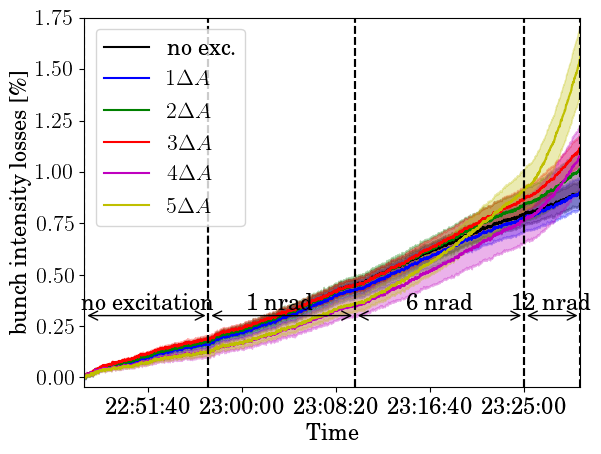
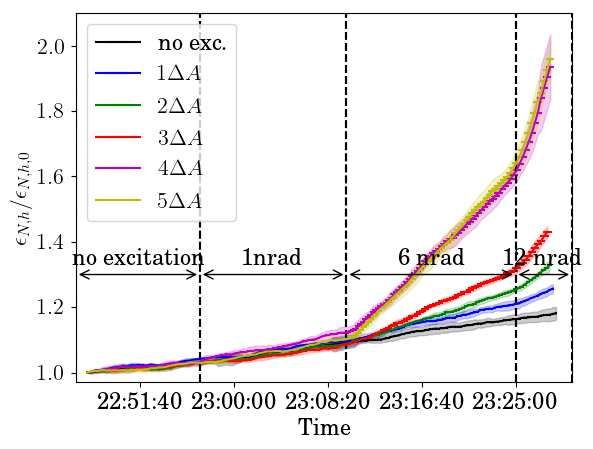
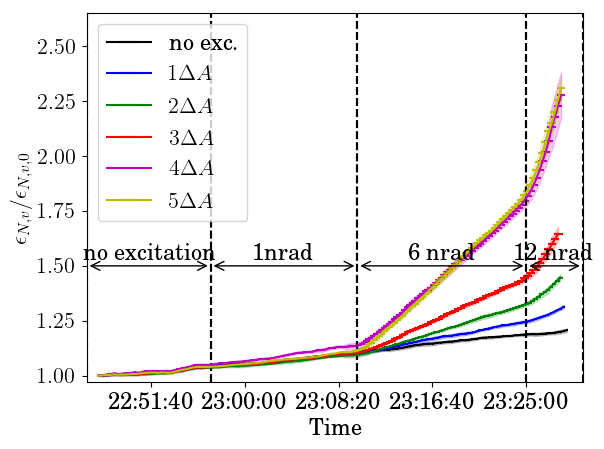
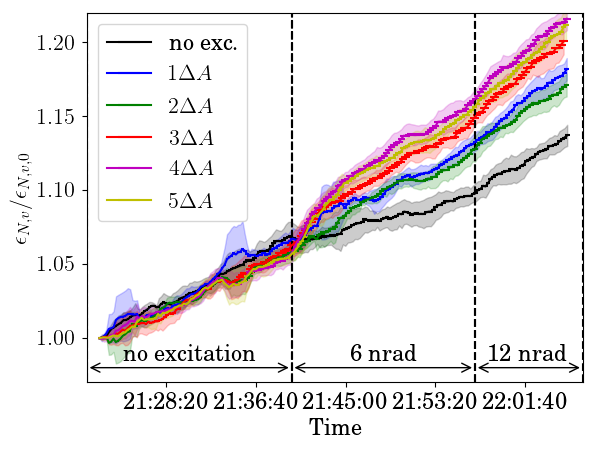
The effects of random excitation were measured during the 2017 experiments. Increasing emittance growth with excitation amplitude was recorded only in the plane of excitation. Horizontal and vertical emittance growth rates for a given amplitude were comparable. As an example, the relative horizontal and vertical emittances during V and H+V pulsing are illustrated in Fig. 28. In addition, the excitations translated into constant growth rates. In particular, there was no adjustment phase followed by an equilibrium state, as observed during 7th- and 10th-turn pulsing. The qualitative behavior of emittances predicted in simulations was therefore confirmed. Calculations could also reproduce the magnitude of the measured effects. For instance, at 6 nrad, the calculated emittance growth rates were 3.6%/min in the horizontal plane and 2.7%/min vertically, whereas in experiments we measured 5.0%/min.
The changes in beam distributions were also directly detected in the BSRT profiles. As an example, Fig. 29 shows the profiles induced by a vertical random excitation, compared to those of a reference bunch. In this case, the distribution widens, but it retains a Gaussian form, in contrast to the case of 10th-turn pulsing, when it assumed a non-Gaussian shape (see Fig. 13, for instance).
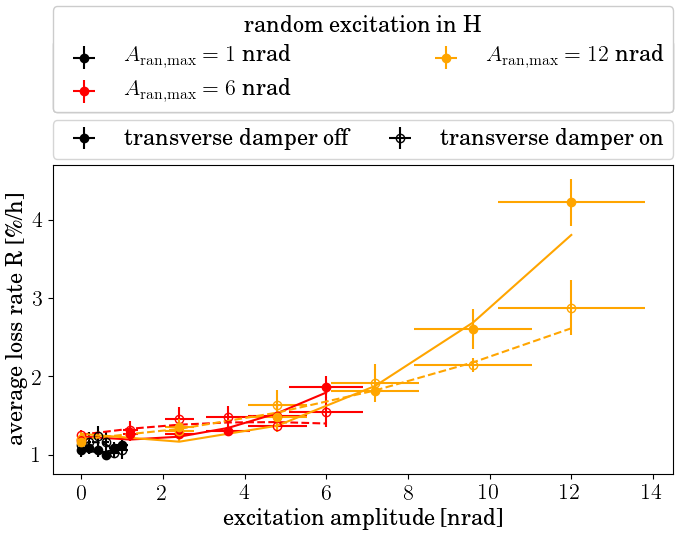
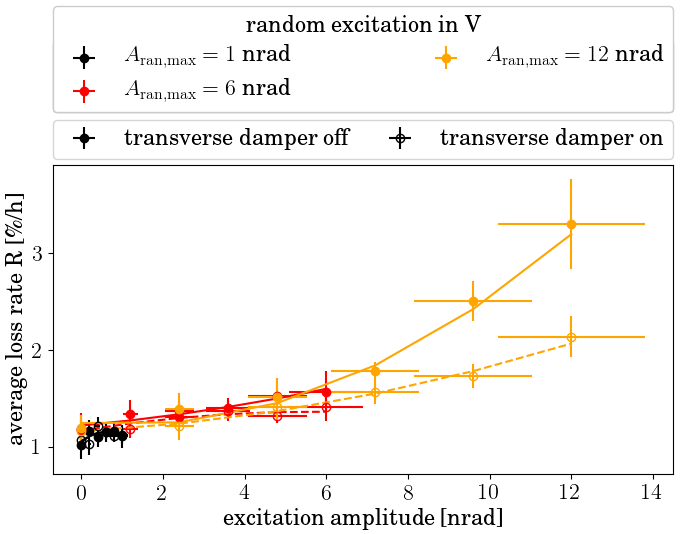
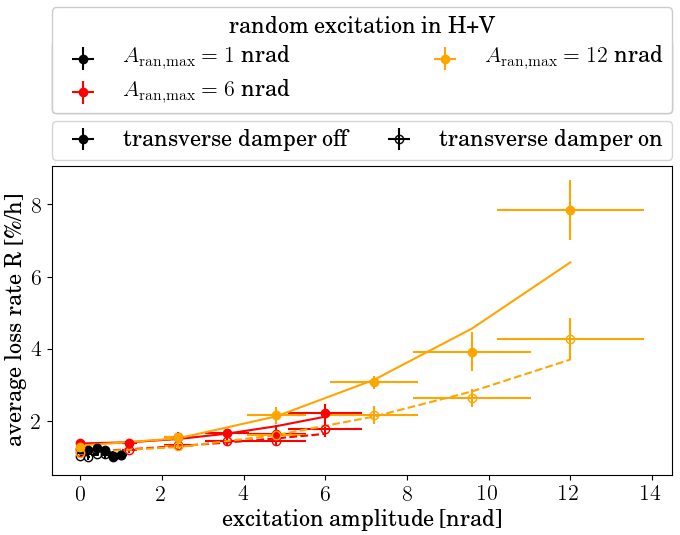
The measured loss rates are presented in Fig. 30 as a function of random excitation amplitude in H, V, and H+V planes. Losses increased quadratically with excitation amplitude, contributing approximately 3%/h at 12 nrad. In simulations, the qualitative behavior was the same; however, the predicted magnitude was much lower (0.1%/h at 12 nrad). Moreover, the measured effect of the combined H+V excitation was approximately the sum of H and V separately.
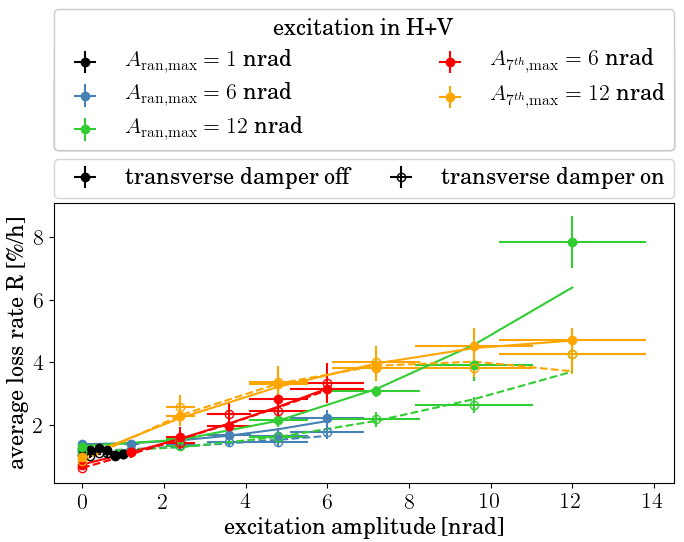
The systematic effects on losses during random excitations were smaller than during resonant pulsing, as shown by the agreement between the 3 data sets (black, red, yellow) within each of the excitation modes in Fig. 30. This fact may be an indication of the random excitation affecting the whole beam, whereas, in the cases under study, resonant pulsing patterns excited specific amplitude regions and were therefore more susceptible to their population and to the order in which experiments were performed. Another indication comes from the direct comparison of loss rates vs. excitation amplitude for random and 7th-turn pulsing (Fig. 31). The first time it is applied (red points), the 7th-turn excitation grows quadratically with amplitude, whereas the second time it shows signs of saturation (yellow). In any case, although the dynamics of their action may be different, these two pulsing patterns were the most powerful, generating losses at the level of several percent per hour at an amplitude of 12 nrad.
Another feature of random excitation was that the loss rates were reduced by about a factor 2 when the transverse damping system was active (dashed vs. solid lines in Fig. 30). This was true for all three modes of excitation (H, V, and H+V). On the other hand, for the resonant pulsing modes, the transverse damper seemed to have a negligible effect. This observation is discussed in more detail in Section VI.6.
VI.6 Effect of the transverse damper
| Transverse damper off | ||
| Random excitation, V (2017) | 7th-turn pulsing, V (2017) | 10th-turn pulsing, V (2016) |
 |
 |
 |
| Transverse damper active | ||
| Random excitation, V (2017) | 7th-turn pulsing, V (2017) | 10th-turn pulsing, V (2016) |
 |
 |
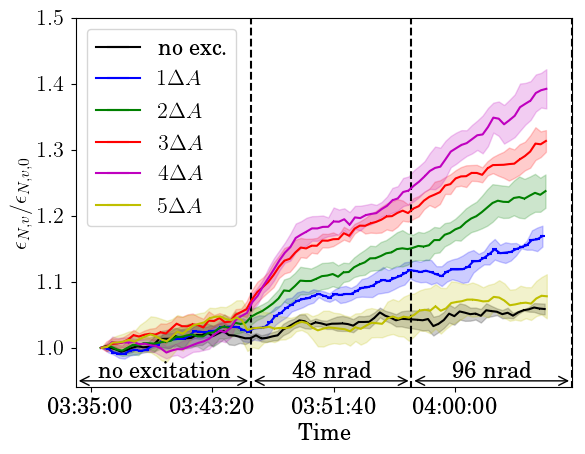 |
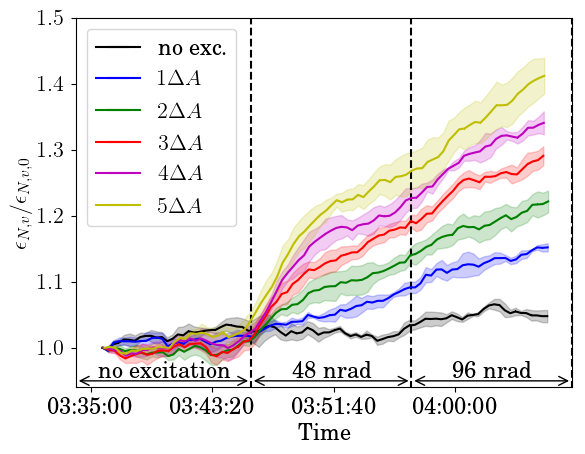
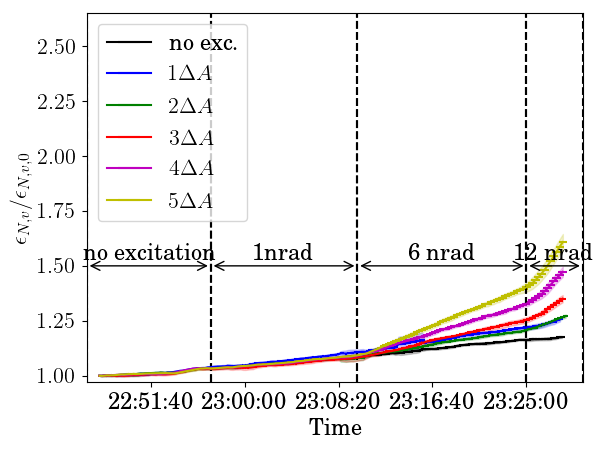
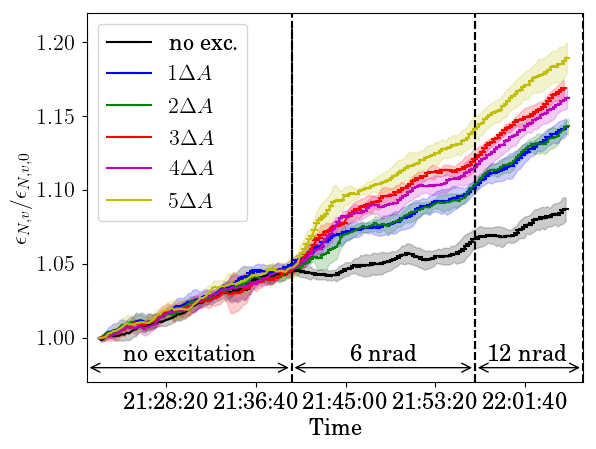
During th-turn pulsing experiments, the action of the transverse feedback and damping system (ADT) did not significantly change any of the observables, namely losses, emittances, and beam distributions. On the other hand, the ADT considerably reduced any changes of the above parameters in case of random excitations.
An example is shown in Fig. 31, where losses from 7th-turn pulsing in H+V are compared with those measured during random excitations in H+V. For 7th-turn pulsing, the results with and without damper almost coincide, whereas a significant reduction was observed for random excitations. As another example, vertical emittances for 7th- and 10th-turn pulsing in V are compared to those obtained during vertical random excitations in Fig. 32.
The reason why the transverse damper appeared to be capable of damping random but not resonant excitations is unknown. In principle, it fulfills the requirements needed to detect and damp the resulting oscillations:
-
•
the closed-orbit distortion caused by the resonant excitations was large enough to be detectable by the ADT pickups;
-
•
in order to detect the orbit distortion, the system compares the position of each bunch with its position in the previous turn; therefore, an oscillation due to th-turn pulsing, with , should be detected and damped;
-
•
the transverse damper acts on each bunch individually, so it should be capable of applying the appropriate corrective kick to each group of bunches subject to the same excitation amplitude.
We report these observations in an attempt to advance the understanding of the interaction between resonant excitations and damping systems. Further studies are obviously needed.
VII Discussion and conclusions
We described the results of numerical simulations and experimental studies conducted in 2016 and in 2017 on the effects of random and resonant excitations on proton losses, emittances, and beam distributions in the Large Hadron Collider.
These studies were motivated in part by the need to assess the effects of a hollow electron lens (HEL), which is being proposed for active halo control in HL-LHC. Hollow electron beam collimation was demonstrated in the Tevatron in continuous mode Stancari et al. (2011), i.e., with the same electron beam current acting on a given bunch every turn. In this case, the unwanted residual kicks, which arise from profile asymmetries, injection and extraction bends, solenoid field misalignments, etc. have a negligible effect on the circulating beam. An electron lens that is pulsed resonantly can have much stronger effects, and this fact was used in the Tevatron for abort-gap cleaning Zhang et al. (2008). The resonant-pulsing capability (having different currents every turn for a given set of bunches) will be incorporated in the HL-LHC hollow electron lens to enhance its range of achievable removal rates. However, due to time constraints, only a very limited set of experimental tests with resonant kicks could be done in the Tevatron. More studies are currently being planned using the electron lenses in the Relativistic Heavy Ion Collider (RHIC) at Brookhaven National Laboratory Fischer et al. (2015); Gu et al. (2017).
The effects of resonant excitations depend on several factors, including machine optics and the distribution of the beam in phase space and in betatron tunes. For this reason, we decided to study resonant transverse kicks on proton beams directly in the LHC. We relied on the flexibility of the LHC transverse feedback and damping system (ADT) to emulate the nonlinear residual kicks of a hollow electron lens with transverse dipole kicks, using various excitation patterns. We focused on the effects on the beam core, namely losses, emittances and beam distributions, as these determine the magnitude of the residual fields that can be tolerated. Obviously, the choice of pulsing patterns to be used in operations depends also on their effects on the beam halo. These effects are outside the scope of the present work (and they are challenging to measure directly).
The dipolar component of the residual kick from the electron lens is approximately 0.5 nrad from the injection/extraction bends and about 20 nrad from profile imperfections in the main overlap region. These estimates are based on current HL-LHC parameters and on electron-beam measurements on a test stand. These values can be reduced by improving cathode emission, solenoid-field uniformity, and transport of the intense magnetized electron beams.
The effects of the pulsing patterns were evaluated by numerical tracking simulations and by frequency-map analysis. These calculations provided insights on the rich nonlinear dynamics of resonant excitations. Kicking the beam every 7th turn and every 10th turn were chosen as examples of strong excitations, whereas 8th-turn pulsing had very weak consequences.
These patterns were tested in experiments and compared with random excitations. Bunch filling schemes were devised so that reference bunches and different excitation amplitudes could be measured at the same time, including the presence or absence of transverse feedback. The influence of collective effects was minimized by reducing the bunch charge. Because these were the first LHC experiments on resonant excitations, and to reduce turn-around time, all studies were conducted at injection energy.
The experiments confirmed the relative strength of the pulsing modes. For instance, random and 7th-turn pulsing generated losses at the level of a few percent per hour at 12 nrad, whereas the same level of losses was obtained at 96 nrad for 10th-turn pulsing; even at 96 nrad, losses from 8th-turn pulsing did not exceed 0.6%/h. A similar hierarchy was observed with respect to emittance growth; in this case, 10th-turn pulsing was stronger than 7th-turn pulsing. In many cases, simulations underestimated losses and emittance growth. One important unknown factor was the magnitude of machine noise and its sources, which had to be extrapolated from collision to injection energy. Other factors were collective effects such as intra-beam scattering and electron cloud, which were minimized in experiments but could not be entirely avoided. The comparison between 7th-turn pulsing in 2016 and 2017 emphasized the sensitivity of horizontal and vertical excitations to working point and tune footprint.
A clear distinction between resonant and random excitations was their effect on beam distributions. Random noise caused smooth emittance growth and widening Gaussian distributions. Resonant excitations generated a fast adjustment of the beam distribution to a new, non-Gaussian form, followed by a phase of steady evolution. This behavior was predicted in simulations and was clearly observed in measured synchrotron-radiation profiles. Potential systematic effects due to the synchrotron-radiation detection system were mitigated by directly comparing excited bunches with unaffected bunches used as controls. Another difference between the two types of excitation was the repeatability of the strength of the random excitation vs. the dependence of th-turn pulsing on the order in which the excitations were implemented — later applications being weaker. This confirmed the hypothesis, emphasized by frequency-map analysis, that random kicks excite most of the beam, whereas resonant pulsing drives specific subsets of particles in tune or amplitude space. Finally, the transverse damping system strongly mitigated losses and emittance growth generated by random excitations, but had negligible effect on resonant pulsing patterns.
For active halo control in HL-LHC, resonant pulsing of the electron lenses, or the addition of a random noise component to continuous operation, may significantly extend the achievable range of halo removal rates. In these studies, we identified candidate excitation patterns (such as 8th-turn pulsing) that preserve the beam core, and their effects were quantified. As mentioned above, complementary calculations and experiments are needed to evaluate their efficacy for halo removal. Because of the complex dynamics, tolerances on residual kicks vary widely, from a few nanoradians for the most powerful (such as random at full strength or 7th-turn pulsing) to about a hundred nanoradians for the more benign (such as 8th-turn pulsing). The magnitude of the acceptable kicks depends on the excitation pattern, on machine lattice, and on the type of application (fast scraping before collisions vs. long-term tail suppression during the course of a physics fill, for instance). Of course, sensitivity to the experimental conditions may make resonant patterns less attractive than a small random noise component added to a constant kick.
These studies are the first systematic investigation of the effects of resonant excitations on the proton beam in the LHC. For practical reasons, the studies were done at injection energy. Because of the different lattices, working point, noise sources, etc. results at collision energy may be different and should be investigated.
Because of their flexibility, the experimental methods and modeling tools developed in this work can be applied more generally to the investigation of other classes of resonant excitations, beyond pulsed hollow electron lenses for active halo control.
Acknowledgements.
There are several people we would like to acknowledge for their support, insights, participation in studies, and assistance in data collection. In particular, Giulia Papotti offered essential support for machine operations and helped prepare the 2016 experiments. Roderik Bruce and Gianluca Valentino made important suggestions on the design of the experiments. Dmitry Shatilov shared his deep understanding of numerical tracking simulations with the lifetrac code. Stéphane Fartoukh, Riccardo De Maria and Rogelio Tomás offered invaluable assistance in generating the appropiate accelerator lattice models. We wish to thank Sergei Nagaitsev for the insightful discussions on the interaction between the transverse damping system and resonant excitations. We are grateful to Enrico Bravin, Georges Trad, and the whole beam instrumentation team for their crucial support on synchrotron-radiation diagnostics. We thank Stefania Papadopoulou and Fanouria Antoniou for the fruitful collaboration on the analysis of the synchrotron-radiation profiles. This manuscript has been authored by Fermi Research Alliance, LLC under Contract No. DE-AC02-07CH11359 with the U.S. Department of Energy (DOE), Office of Science, Office of High Energy Physics. This work was partially supported by the U.S. DOE LHC Accelerator Research Program (LARP), by the European FP7 HiLumi LHC Design Study, Grant Agreement 284404, and by the High Luminosity LHC (HL-LHC) Project.References
- Holmes et al. (2011) S. Holmes, R. S. Moore, and V. Shiltsev, “Overview of the Tevatron collider complex: Goals, operations and performance,” JINST 6, T08001 (2011).
- Wenninger (2017) J. Wenninger, “Approaching nominal performance at LHC,” in Arduini et al. (2017), pp. 13–18.
- Brüning et al. (2004) O. S. Brüning, P. Collier, P. Lebrun, S. Myers, R. Ostojic, J. Poole, and P. Proudlock, eds., LHC Design Report, Yellow Reports: Monographs, Vol. 1 (CERN, Geneva, Switzerland, 2004).
- Apollinari et al. (2017) G. Apollinari, I. Béjar Alonso, O. Brüning, P. Fessia, M. Lamont, L. Rossi, and L. Tavian, eds., High-Luminosity Large Hadron Collider (HL-LHC): Technical Design Report V. 0.1, Yellow Reports: Monographs No. CERN-2017-007-M (CERN, Geneva, Switzerland, 2017).
- Benedikt and Zimmermann (2016) M. Benedikt and F. Zimmermann, “Towards future circular colliders,” J. Korean Phys. Soc. 69, 893 (2016).
- Benedikt and Zimmermann (2018) M. Benedikt and F. Zimmermann, “FCC: Colliders at the energy frontier,” in Proceedings of the 2018 International Particle Accelerator Conference (IPAC18), edited by S. Koscielniak, T. Satogata, V. R. W. Schaa, and J. Thomson (JACoW, Geneva, Switzerland, 2018) pp. 2908–2913.
- Valentino (2016) G. Valentino, “What did we learn about halo population during MDs and regular operation?” in Brüning (2016), https://indico.cern.ch/event/567839 [Online; accessed 21-Mar-2018].
- Brüning (2016) O. S. Brüning, ed., Review of the Needs for a Hollow E-lens for the HL-LHC (CERN, Geneva, Switzerland, 2016) https://indico.cern.ch/event/567839 [Online; accessed 21-Mar-2018].
- Brüning et al. (2011) O. Brüning, O. Dominguez, S. Myers, L. Rossi, E. Todesco, and F. Zimmermann, “HE-LHC beam parameters, optics and beam-dynamics issues,” in EuCARD-AccNet-EuroLumi Workshop: The High-Energy Large Hadron Collider (HE-LHC10), Yellow Reports: Conference Proceedings No. CERN-2011-003, edited by E. Todesco and F. Zimmermann (CERN, Geneva, Switzerland, 2011) pp. 7–12, arXiv:1108.1617 [physics.acc-ph] .
- Molson et al. (2017) J. Molson, R. Bruce, A. Faus-Golfe, M. Fiascaris, A. M. Krainer, and S. Redaelli, “Status of the FCC-hh collimation system,” in Arduini et al. (2017), pp. 64–67.
- Bruce (2016) R. Bruce, “Alternative methods for halo depletion (damper, tune modulation, and wire), long-range beam-beam and comparison of their performance / reliability to that of a hollow electron lens,” in Brüning (2016), https://indico.cern.ch/event/567839 [Online; accessed 21-Mar-2018].
- Stancari et al. (2011) G. Stancari, A. Valishev, G. Annala, G. Kuznetsov, V. Shiltsev, D. A. Still, and L. G. Vorobiev, “Collimation with hollow electron beams,” Phys. Rev. Lett. 107, 084802 (2011).
- (13) “LHC optics web: HLLHCV1.3 — collision round 15 cm optics,” http://abpdata.web.cern.ch/abpdata/lhc_optics_web/www/hllhc13/round15/index.html [Online; accessed 22-Mar-2018].
- Stancari et al. (2015) G. Stancari, V. Previtali, A. Valishev, R. Bruce, S. Redaelli, A. Rossi, and B. Salvachua Ferrando, Conceptual Design of Hollow Electron Lenses for Beam Halo Control in the Large Hadron Collider, Tech. Rep. FERMILAB-TM-2572-APC, CERN-ACC-2014-0248 (Fermilab and CERN, 2015) arXiv:1405.2033 [physics.acc-ph] .
- Shiltsev et al. (2008) V. Shiltsev, K. Bishofberger, V. Kamerdzhiev, S. Kozub, M. Kufer, G. Kuznetsov, A. Martinez, M. Olson, H. Pfeffer, G. Saewert, V. Scarpine, A. Seryi, N. Solyak, V. Sytnik, M. Tiunov, L. Tkachenko, D. Wildman, D. Wolff, and X.-L. Zhang, “Tevatron electron lenses: Design and operation,” Phys. Rev. ST Accel. Beams 11, 103501 (2008).
- Fischer et al. (2015) W. Fischer, X. Gu, Z. Altinbas, M. Costanzo, J. Hock, C. Liu, Y. Luo, A. Marusic, R. Michnoff, T. A. Miller, A. I. Pikin, V. Schoefer, P. Thieberger, and S. M. White, “Operational head-on beam-beam compensation with electron lenses in the Relativistic Heavy Ion Collider,” Phys. Rev. Lett. 115, 264801 (2015).
- Gu et al. (2017) X. Gu, W. Fischer, Z. Altinbas, M. Anerella, E. Bajon, M. Bannon, D. Bruno, M. Costanzo, A. Drees, D. M. Gassner, R. C. Gupta, J. Hock, M. Harvey, A. K. Jain, J. P. Jamilkowski, P. Kankiya, R. Lambiase, C. Liu, Y. Luo, M. Mapes, A. Marusic, C. Mi, R. Michnoff, T. A. Miller, M. Minty, S. Nemesure, W. Ng, D. Phillips, A. I. Pikin, P. J. Rosas, G. Robert-Demolaize, T. Samms, J. Sandberg, V. Schoefer, T. C. Shrey, Y. Tan, R. Than, C. Theisen, P. Thieberger, J. Tuozzolo, P. Wanderer, W. Zhang, and S. M. White, “Electron lenses for head-on beam-beam compensation in RHIC,” Phys. Rev. Accel. Beams 20, 023501 (2017).
- Shiltsev (2016) Vladimir D. Shiltsev, Electron Lenses for Super-Colliders (Springer, 2016).
- Fitterer et al. (2016a) M. Fitterer, G. Stancari, A. Valishev, and S. Redaelli, Simulation Study of Hollow Electron Beam Collimation in HL-LHC, Tech. Rep. FERMILAB-TM-2636-AD (Fermilab, 2016).
- Fitterer et al. (2017) M. Fitterer, G. Stancari, a. Valishev, R. De Maria, S. Redaelli, K. Sjobak, and J. F. Wagner, “Implementation of hollow electron lenses in sixtrack and first simulation results for the HL-LHC,” in Arduini et al. (2017), pp. 3795–3798.
- Fitterer et al. (2016b) M. Fitterer, G. Stancari, and A. Valishev, Effect of Pulsed Hollow Electron-Lens Operation on the Proton Beam Core in LHC, Tech. Rep. FERMILAB-TM-2635-AD (Fermilab, 2016).
- Zhang et al. (2008) X.-L. Zhang, K. Bishofberger, V. Kamerdzhiev, V. Lebedev, V. Shiltsev, R. Thurman-Keup, and A. Tollestrup, “Generation and diagnostics of uncaptured beam in the Fermilab Tevatron and its control by electron lenses,” Phys. Rev. ST Accel. Beams 11, 051002 (2008).
- Stancari (2014) G. Stancari, Calculation of the Transverse Kicks Generated by the Bends of a Hollow Electron Lens, Tech. Rep. FERMILAB-FN-0972-APC (Fermilab, 2014) arXiv:1403.6370 [physics.acc-ph] .
- Morozov et al. (2012) I. A. Morozov, G. Stancari, A. Valishev, and D. N. Shatilov, “Simulation of hollow electron beam collimation in the Fermilab Tevatron collider,” in Proceedings of the 3rd International Particle Accelerator Conference (IPAC12), FERMILAB-CONF-12-126-APC (IPAC’12 / IEEE, 2012) pp. 94–96, http://accelconf.web.cern.ch/AccelConf/IPAC2012 [Online; accessed 21-Mar-2018].
- Stancari (2018) G. Stancari, “Electron-beam simulations: Electron-gun emission and residual fields from measured profiles,” https://indico.cern.ch/event/698949 [Online; accessed 22-Mar-2018] (2018), CERN meeting on hollow electron lens beam results.
- (26) The warp particle-in-cell code, Lawrence Berkeley National Laboratory, http://warp.lbl.gov [Online; accessed 21-Mar-2018].
- Friedman et al. (2014) A. Friedman, R. H. Cohen, D. P. Grote, S. M. Lund, W. M. Sharp, J. L. Vay, I. Haber, and R. A. Kishek, “Computational methods in the Warp code framework for kinetic simulations of particle beams and plasmas,” IEEE Trans. Plasma Sci. 42, 1321–1334 (2014).
- (28) “The Fermilab electron-lens test stand,” https://cdcvs.fnal.gov/redmine/projects/elens/wiki/Test_Stand [Online; accessed 22-Mar-2018].
- Jo et al. (2018) Y. H. Jo, J. S. Kim, G. Stancari, M. Chung, and H. J. Lee, “Control of the diocotron instability of a hollow electron beam with periodic dipole magnets,” Physics of Plasmas 25, 011607 (2018).
- Davidson (2001) Ronald C. Davidson, Physics of Nonneutral Plasmas (World Scientific, 2001).
- Fitterer et al. (2016c) M. Fitterer, G. Stancari, A. Valishev, R. Bruce, P. S. Papadopoulou, G. Papotti, D. Pellegrini, S. Redaelli, G. Trad, D. Valuch, G. Valentino, J. Wagner, and C. Xu, Effect of a Resonant Excitation on the Evolution of the Beam Emittance and Halo Population, Tech. Rep. CERN-ACC-NOTE-2017-0037 (CERN, 2016).
- Fitterer et al. (2018) M. Fitterer, G. Stancari, A. Valishev, R. Bruce, S. Redaelli, B. M. Salvachua Ferrando, D. Valuch, G. Valentino, J. Wagner, and C. Xu, Effect of a Resonant Excitation on the Evolution of the Beam Emittance and Halo Population, Tech. Rep. CERN-ACC-NOTE-2018-0007 (CERN, 2018).
- Trad (2015) G. Trad, Development and Optimisation of the SPS and LHC Beam Diagnostics Based on Synchrotron Radiation Monitors, Ph.D. thesis, Université de Grenoble, France (2015).
- Fitterer and Stancari (2017) M. Fitterer and G. Stancari, Analysis of BSRT Profiles in the LHC at Injection, Tech. Rep. FERMILAB-TM-2657-AD-APC (Fermilab, 2017).
- Linnecar et al. (2008) T. Linnecar, M. E. Angoletta, L. Arnaudon, P. Baudrenghien, T. Bohl, O. Brunner, A. Butterworth, E. Ciapala, F. Dubouchet, J. Ferreira Bento, D. Glenat, G. Hagmann, W. Höfle, C. Julie, F. Killing, G. Kotzian, D. Landre, R. Louwerse, P. Maesen, P. Martinez Yanez, J. Molendijk, E. Montesinos, C. Nicou, J. Noirjean, G. Papotti, A. Pashnin, G. Pechaud, J. Pradier, V. Rossi, J. Sanchez Quesada, M. Schokker, E. Shaposhnikova, R. Sorokoletev, D. Stellfeld, J. Tückmantel, D. Valuch, U. Wehrle, and F. Weierud, Hardware and Initial Beam Commissioning of the LHC RF Systems, Tech. Rep. LHC-PROJECT-Report-1172 (CERN, 2008).
- Höfle et al. (2011) W. Höfle, G. Kotzian, M. Schokker, and D. Valuch, LHC Damper Beam Commissioning in 2010, Tech. Rep. CERN-ATS-2011-033 (CERN, 2011).
- Buffat et al. (2017a) X. Buffat, J. Barranco García, T. Pieloni, C. Tambasco, and D. Valuch, “Observations of emittance growth in the presence of external noise in the LHC,” in Arduini et al. (2017), pp. 2117–2120.
- Laskar (2003) J. Laskar, “Frequency map analysis and particle accelerators,” in Proceedings of the 2003 Particle Accelerator Conference (PAC03), edited by J. Chew, P. Lucas, and S. Webber (IEEE, 2003) p. 378.
- Shatilov et al. (2005) D. N. Shatilov, Y. Alexahin, V. Lebedev, and A. Valishev, “lifetrac code for the weak-strong simulation of the beam-beam effects in Tevatron,” in Proceedings of the 2005 Particle Accelerator Conference (PAC05), FERMILAB-CONF-05-246-AD, edited by C. Horak (IEEE, 2005) p. 4138.
- Buffat et al. (2017b) X. Buffat, N. Biancacci, S. V. Furuseth, D. Jacquet, E. Metral, D. Pellegrini, M. Pojer, G. Trad, D. Valuch, J. Barranco Garcia, T. Pieloni, C. Tambasco, and Q. Li, Probing the Behaviour of High Brightness Bunches in Collision at 6.5 TeV and the Interplay with an External Source of Noise (MD 1433), Tech. Rep. CERN-ACC-NOTE-2017-0030 (CERN, 2017).
- Barranco Garcia et al. (2016) J. Barranco Garcia, X. Buffat, T. Pieloni, C. Tambasco, G. Trad, D. Valuch, M. Betz, M. Wendt, M. Pojer, M. Solfaroli Camillocci, B. M. Salvachua Ferrando, K. Fuchsberger, M. Albert, and J. Qiang, MD 400: LHC Emittance Growth in Presence of an External Source of Noise during Collision, Tech. Rep. CERN-ACC-NOTE-2016-0020 (CERN, 2016).
- Lebedev (1995) V. A. Lebedev, “Emittance growth due to noise and its suppression with the feedback system in large hadron colliders,” AIP Conf. Proc. 326, 396–423 (1995).
- Alexahin (1997) Y. I. Alexahin, “On the emittance growth due to noise in hadron colliders and methods of its suppression,” Nucl. Instrum. Methods Phys. Res. A 391, 73–76 (1997).
- Ohmi et al. (2007) K. Ohmi, R. Calaga, R. Tomás, W. Höfle, and F. Zimmermann, “Beam-beam effects with an external noise in LHC,” in Proceedings of the 22nd Particle Accelerator Conference (PAC07), edited by C. Petit-Jean-Genaz (2007) p. 1496.
- Ohmi (2014) K. Ohmi, “Beam-beam effects under the influence of external noise,” in Proceedings of the ICFA Mini-Workshop on Beam-Beam Effects in Hadron Colliders (BB2013), Yellow Reports: Conference Proceedings No. CERN-2014-004, edited by W. Herr and G. Papotti (CERN, Geneva, Switzerland, 2014) pp. 69–74, arXiv:1410.4092 [physics.acc-ph] .
- Arduini et al. (2017) G. Arduini, M. Lindroos, J. Pranke, V. R. W. Schaa, and M. Seidel, eds., Proceedings of the 2017 International Particle Accelerator Conference (IPAC17) (JACoW, Geneva, Switzerland, 2017).