A Light Curve Analysis of Gamma-ray Nova V959 Mon – Distance and White Dwarf Mass
Abstract
V959 Mon is one of the gamma-ray detected novae. It was optically discovered about 50 days after the gamma-ray detection due to proximity to the Sun. The nova speed class is unknown because of lack of the earliest half of optical light curve and short supersoft X-ray phase due to eclipse by the disk rim. Using the universal decline law and time-stretching method, we analyzed the data of V959 Mon and obtained nova parameters. We estimated the distance modulus in the band to be for the reddening of by directly comparing with the similar type of novae, LV Vul, V1668 Cyg, IV Cep, and V1065 Cen. The distance to V959 Mon is kpc. If we assume that the early phase light curve of V959 Mon is the same as that of time-stretched light curves of LV Vul, our model light curve fitting suggests that the white dwarf (WD) mass is , being consistent with a neon nova identification. At the time of gamma-ray detection the photosphere of nova envelope extends to (about two or three times the binary separation) and the wind mass-loss rate is yr-1. The period of hard X-ray emission is consistent with the time of appearance of the companion star from the nova envelope. The short supersoft X-ray turnoff time is consistent with the epoch when the WD photosphere shrank to behind the elevating disk rim, that occurs 500 days before nuclear burning turned off.
1 Introduction
Recently, GeV gamma-rays have been detected in several classical and symbiotic novae with the Fermi/Large Area Telescope (LAT) (e.g., Ackermann et al., 2014). These gamma-ray novae show wide varieties in the speed class (fast and slow), nova type (CO and ONe), and companion type (a close binary with a red dwarf companion and a wide binary with a red giant companion). In some gamma-ray novae hard X-ray emission was also detected. Gamma-ray could be produced in shock interaction between ejecta and companion or circumbinary matter, or collision between ejecta shells (internal shock). The exact origin of gamma-ray and relation with hard X-ray emission in the individual objects are not known.
Although gamma-rays were detected in various types of novae, the gamma-ray properties appear similar to one another. Therefore, it has been argued that there is a common mechanism of gamma-ray emission independent of nova type, thus, all novae are potential gamma-ray emitters (e.g., Ackermann et al., 2014). If this is the case, the gamma-ray detection is due to close proximity and non-detected novae should be more distant. Ackermann et al. (2014) concluded that all the Fermi/LAT-detected novae have estimated distances of to 5 kpc, i.e., V407 Cyg (2.7 kpc), V1324 Sco (4.5 kpc), V959 Mon (3.6 kpc), and V339 Del (4.2 kpc).
The distances of novae, however, are always debated. For example, Finzell et al. (2015) derived the distance of V1324 Sco to be kpc based on their estimated reddening of . This is much larger than the above distance, kpc, that Ackerman et al. derived from various Maximum Magnitude vs. Rate of Decline (MMRD) relations. As well known, the MMRD relations are statistical relations and not a good indicator for individual novae (see, e.g., Downes & Duerbeck, 2000; Kasliwal et al., 2011; Shara et al., 2017). For V407 Cyg, Hachisu & Kato (2018) recently redetermined the distance to be kpc from the revised period-luminosity relation of Miras (Ita & Matsunaga, 2011). This value is larger than kpc that Ackerman et al. adopted. To elucidate the nature of gamma-ray detected novae, we need an accurate distance of each nova. One of the aims of this work is to obtain the distance of V959 Mon.
The classical nova V959 Mon was optically discovered by S. Fujikawa on UT 2012 August 9.8 (JD 2456149.3) at mag 9.4 (Fujikawa et al., 2012). Due to solar conjunction, the nova already entered the nebular decline phase when it was discovered. The optical peak was possibly substantially (more than 50 days) before the discovery (e.g., Munari et al., 2013). Greimel et al. (2012) identified the progenitor of V959 Mon using images from the INT Photometric H-Alpha Survey (IPHAS) at and mag.
Fermi J0639+0548 is a gamma-ray source detected on UT 2012 June 22 (JD 2456100.5) (Ackermann et al., 2014), 48 days before the optical discovery of V959 Mon. Cheung et al. (2012) reported that the position of V959 Mon is consistent with that of the gamma-ray object Fermi J0639+0548 and the spectra of V959 Mon show striking resemblance to that of the fast ONe nova V382 Vel 1999 well after optical peak. Munari (2013) suggested that V959 Mon is a neon nova because of very strong lines of [Ne III], [Ne IV], and [Ne V] in the spectrum obtained on UT 2013 January 5.938 (JD 2456298.438). Thus, V959 Mon was identified as a gamma-ray nova and also as a neon nova.
V959 Mon entered the supersoft X-ray source (SSS) phase on UT 2012 November 18 (JD 2456249.5) (Nelson et al., 2012). The UV and X-ray emission observed with Swift showed modulation that indicates 7.1 hr orbital period (Osborne et al., 2013). Osborne et al. (2013) argued that the orbital variation of the X-ray light curve is caused by a partial eclipse of extended emission by an accretion disk rim which is raised at the point of impact of the stream from the secondary star (see also Page et al., 2013).
Munari et al. (2013) presented the detailed photometric and spectroscopic data of V959 Mon and showed the orbital light curves of the 7.1 hr period. Ribeiro et al. (2013) presented a model of the morphology of the ejected shell to reproduce line profile spectra of the [O III] 4959, 5007 and derived a probable orbital inclination angle of .
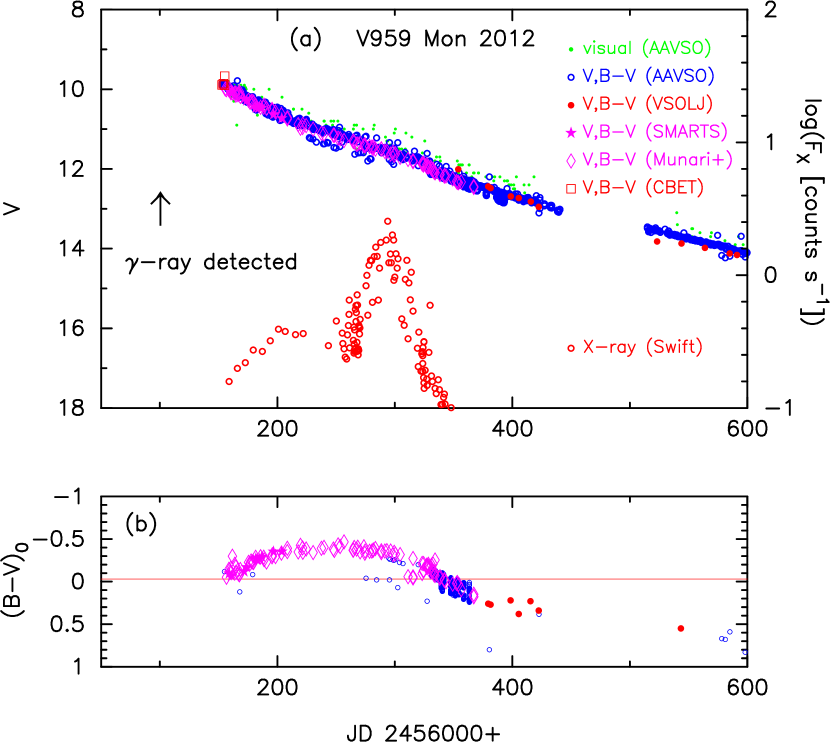
Figure 1(a) summarizes the visual, , and X-ray light curves of V959 Mon, and Figure 1(b) shows , which are dereddened with after Munari et al. (2013). The lack of optical peak and following light curve data makes this nova difficult to be categorized into a particular speed class. Moreover, the supersoft X-ray phase is interrupted in the mid way, possibly due to occultation by the disk rim, which prevents the WD mass from being estimated by the SSS duration (e.g., Hachisu & Kato, 2010).
In the present work, we analyze the data in Figure 1, in the context of our nova light curve analysis for more than 60 objects (e.g., Hachisu & Kato, 2006, 2010, 2014, 2015, 2016a, 2016b, 2018), and derive outburst parameters of V959 Mon as much as possible. Our paper is organized as follows. First we describe the time-stretching method of nova light curves, and derive the distance modulus in the band, , toward V959 Mon in Section 2. In Section 3, we show similarity in the color-magnitude diagram between V959 Mon and LV Vul (as well as IV Cep and V1065 Cen) and confirm that our obtained values of and are reasonable. Section 4 describes our model light curves that fit with the and X-ray data of V959 Mon. We derive the WD mass, , and present models for hard X-ray and short duration of the SSS phase. We discuss the distance modulus , extinction , and distance in Section 5. Conclusions follow in Section 6.
2 Time-stretching Method of Nova Light Curves
Novae show rich varieties in their optical/IR light curves, but there is a strong similarity in the main decline behavior. Kato & Hachisu (1994) theoretically explained the main trend of nova light curves, i.e., a more massive WD shows a faster evolution in the decay phase of light curve based on the optically thick wind theory. Hachisu & Kato (2006) calculated free-free emission light curves of various WD masses and chemical compositions, and found that these theoretical light curves overlap with each other by time-stretch. They call this property the universal decline law. After that, these authors have analyzed a number of nova light curves and showed that observed light curves basically decay along with the free-free model light curves (Hachisu & Kato, 2010, 2015, 2016a, 2018). Using this universal decline law and time-stretching method, they have determined the WD masses for a number of novae (e.g., Hachisu & Kato, 2007, 2009, 2014, 2015, 2016a, 2018; Kato et al., 2009, 2015).
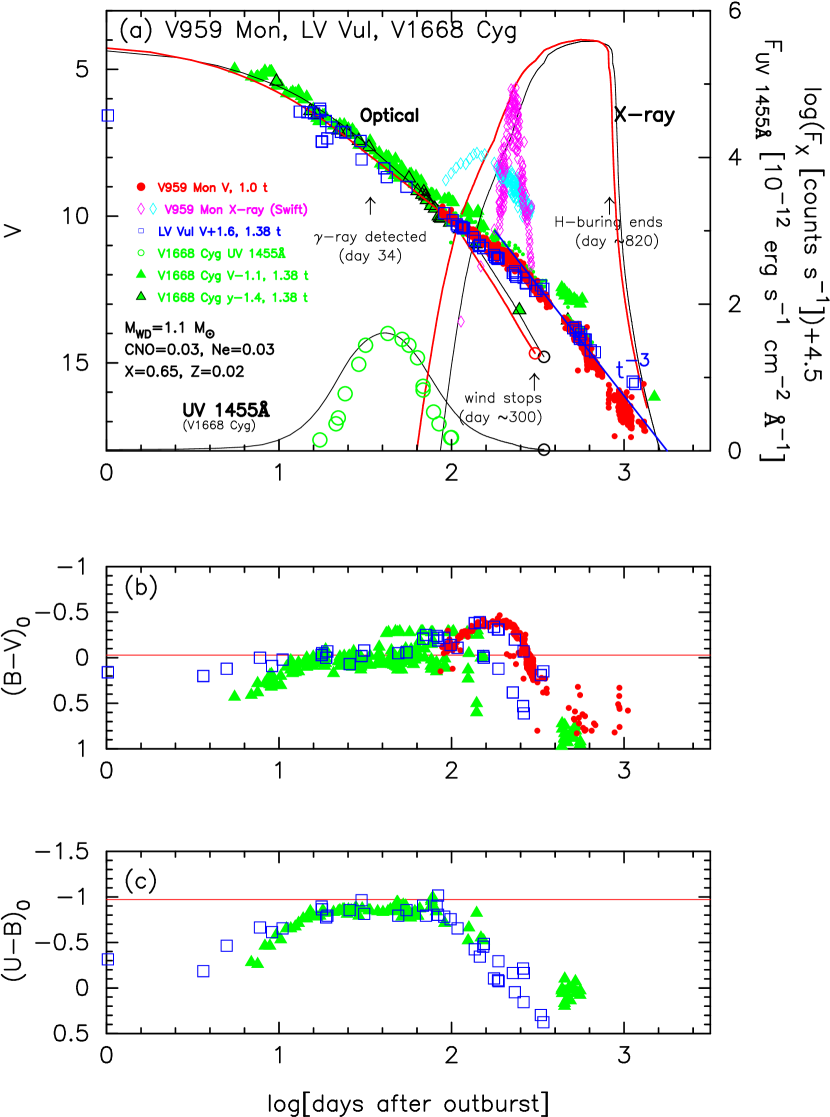
Figure 2(a) shows the , soft X-ray ( keV), and hard X-ray ( keV) light curves of V959 Mon on a logarithmic timescale. We added the light curves of two classical novae, LV Vul 1968#1 and V1668 Cyg 1978, that have the most similar decline among our 60 samples that we have ever analyzed. (We show two similar novae IV Cep and V1065 Cen later in Figures 3 and 4, respectively.)
The light curve data of V959 Mon shows a good agreement with the later phase of LV Vul and V1668 Cyg. Also the evolution is very similar to the upper branch of LV Vul. These similarities strongly suggest that V959 Mon follows the universal decline law, i.e., similar evolution to LV Vul and V1668 Cyg even in the early phase.
In the present paper, we regard that V959 Mon follows the universal decline law from the early phase, where we have no data, until the later nebular phase. We did this reproduction of the early light curve of V959 Mon in Figure 2. The V light curve decays along after days of the outburst. This strongly indicates that optically thick winds stopped on day (see, e.g., Figure 25 of Hachisu & Kato, 2016a). The slope of usually begins after the nebular phase starts in many novae. Therefore, this nova shows normal decline of novae.
Although the overall decline features are very similar to V959 Mon, LV Vul and V1668 Cyg evolve faster than V959 Mon by a factor of 1.38. Therefore, these two nova light curves are time-stretched by , i.e., they are shifted toward right by in the logarithmic time (see Section 2.1 for detail). In Figure 2, we assumed that the outburst day is JD 2456066.5 (UT 2012 May 19.0) as explained in Section 2.2. Thus, the optical light curve started from day 83.
2.1 Timescaling Factor
Now we show how to determine the timescaling (or time-stretching) factor of . We try to overlap these three novae as much as possible, by shifting in the vertical and horizontal directions. For the horizontal shift, we change by 0.01 or 0.02 steps and check whether the light/color curves overlap with each other. We select the best one by eye. In Figure 2(a), (b), and (c), we finally select a factor of both for LV Vul and V1668 Cyg. The shift in the vertical direction is also obtained by changing by 0.1 or 0.2 mag steps and select the best one by eye. In the present case, we select mag for LV Vul, and mag for V1668 Cyg. This is the first step of the time-stretching method explained below. Here, we regard V959 Mon as a target nova, and LV Vul and V1668 Cyg as template novae. It should be noted that there are two branches of color curve of LV Vul in Figure 2(b) after the nebular phase started and we fit the V959 Mon color curve with the bluer (upper) branch of LV Vul. We explain the two separated branches later in Section 3.
We have determined the time-shift of LV Vul (open blue squares) against V959 Mon by assuming that the 10 data points of LV Vul (upper branch) overlap to those of V959 Mon in the color curves in Figure 2(b). We shift the color curve of LV Vul in steps of or 0.02 and find best match by eye from the 10 data points between and 2.5. Its allowance is about by eye. We also estimated the error by a least square fit and obtained in the time-shift.
The vertical fit in the magnitude is also determined by eye. In the case of LV Vul and V959 Mon, we searched for a best fit by changing the vertical shift in steps of 0.1 or 0.2 mag between and 2.8 in Figure 2(a). Its allowance is about 0.1 mag by eye. We checked the error by a least square method (for steps of 0.1 mag vertical shift) and obtained . In this case, the difference between LV Vul and V959 Mon is relatively large around the break () of the V light curve. Thus, the determination errors are about and or mag unless and color data are largely scattered. This value is consistent with the eye fitting. The least square fit implicitly assumes that all the data have equal weight for deviation, which may not be real, because the data set observed at different observatories may not be uniform. Thus, in the later part of this paper, we use fitting by eye.
2.2 Outburst Day
We also explain how to determine the outburst day ( JD 2456066.5). The outburst day should be before the gamma-ray detection day ( JD 2456100.5). We time-stretch the LV Vul and V1668 Cyg light/color curves with on a linear timescale. Then, we overlap the light and color curves of LV Vul and V1668 Cyg to those of V959 Mon. We assumed the outburst day of V959 Mon to be the same as that of LV Vul which is time-stretched with .
It should be noted that the value of is slightly dependent on the value of and vice versa. Starting from a trial value of JD 2456100.5, we repeated twice the procedure of and determination and confirmed the convergence of (and ).
2.3 Time-stretched Light Curves
Figure 2(a) also shows theoretical free-free emission and blackbody X-ray light curves of a WD with the envelope chemical composition of Ne nova 3 for V959 Mon (red lines), which is explained in detail later in Section 4. We also add another model light curve of a WD with the envelope chemical composition of CO nova 3 for V1668 Cyg (black lines) and LV Vul, which is time-stretched by .
The magnitude of the two template novae, LV Vul and V1668 Cyg, decay along with these theoretical lines until day 90, when the two novae entered the nebular phase. In the nebular phase, strong emission lines contribute to the and bands, which are not included in our model light curves, so the observed magnitude deviates much from, and decay more slowly than, the model light curve.
After the optically thick winds stop, the observed magnitude decays like the straight solid blue line of . That shows the trend of homologously expanding ejecta, i.e., the ejecta mass is constant (see, e.g., Woodward et al., 1997; Hachisu & Kato, 2006). In Figure 2(a), the V light curve of V959 Mon decays along after day . This strongly indicates that optically thick winds stopped on day (see, e.g., Figure 41 of Hachisu & Kato, 2016a, for such an example). We suppose that optically thick winds stopped on day for V959 Mon.
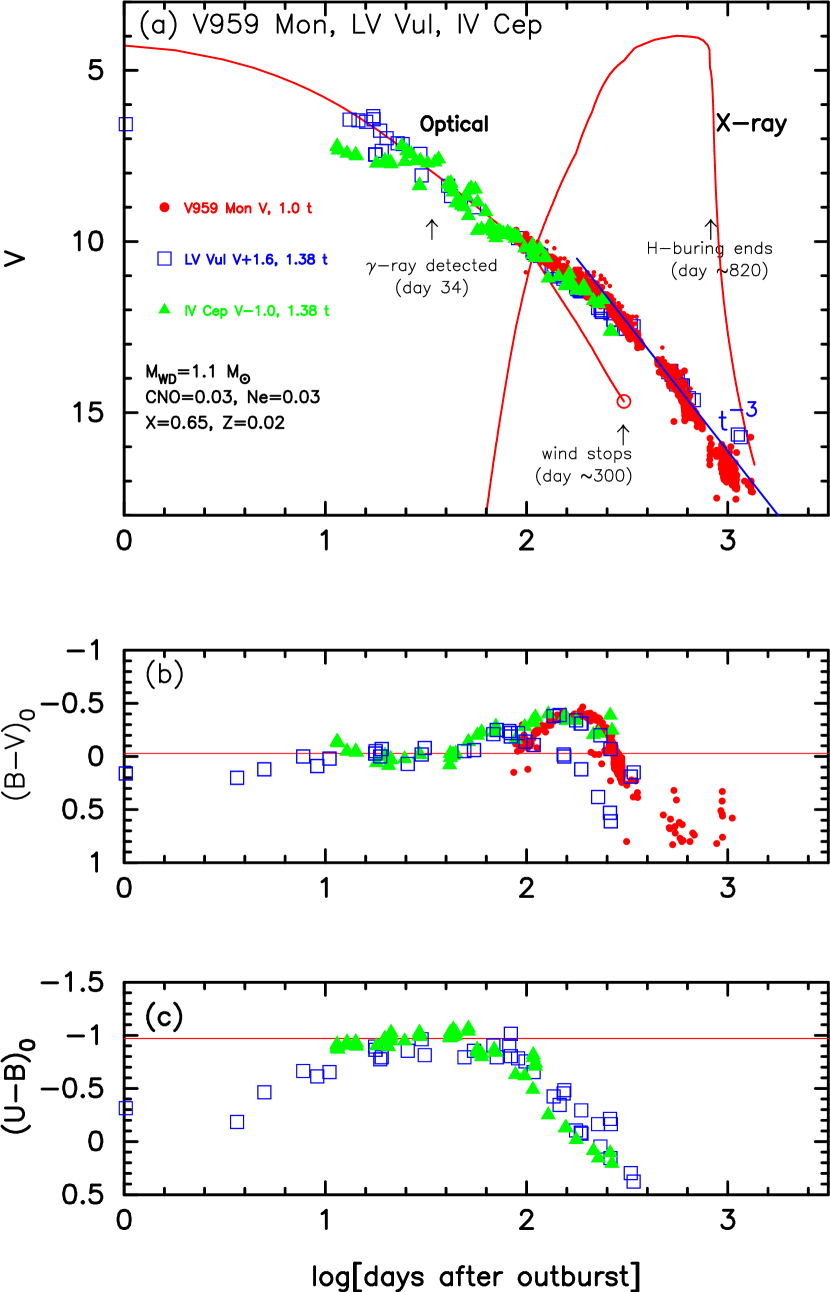
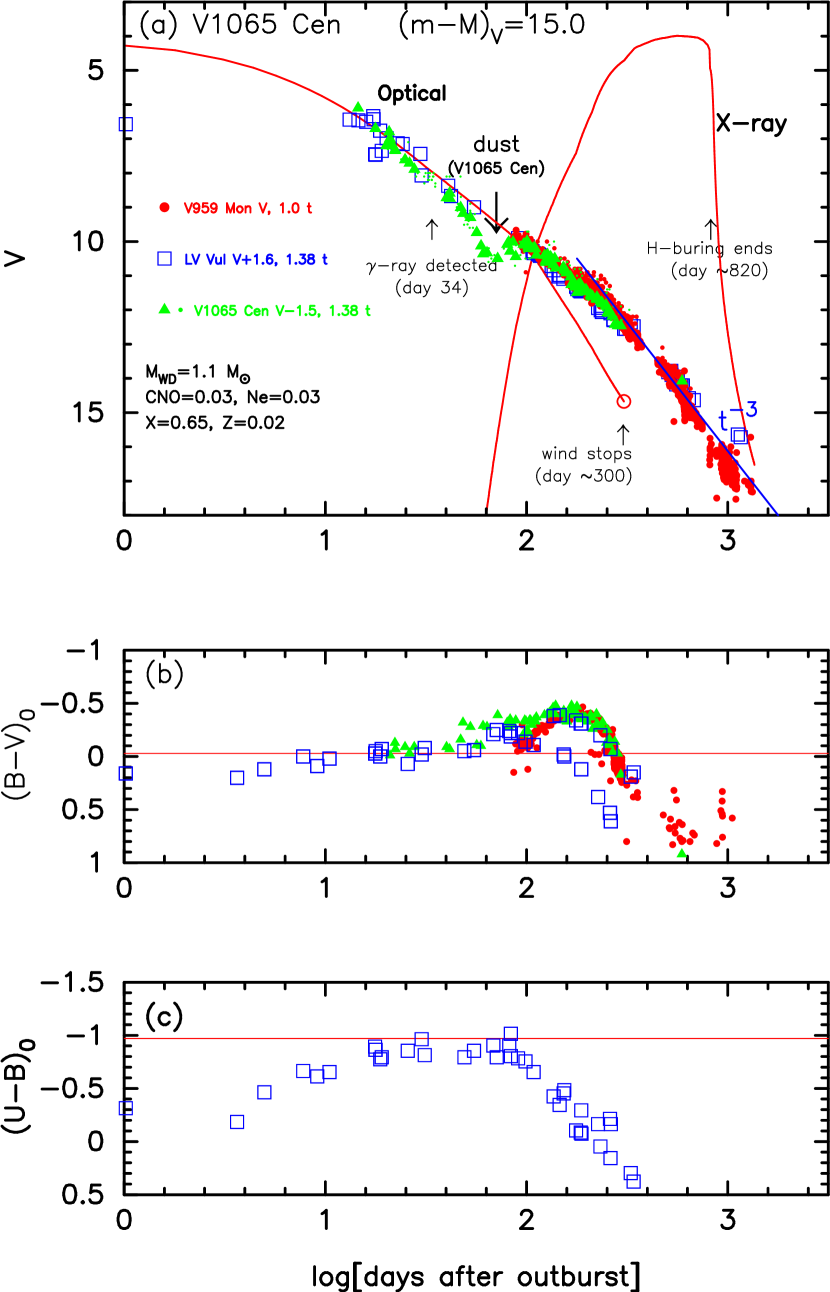
We also plot two more novae that show similar decay timescale and shape to V959 Mon, that is, IV Cep 1971 and V1065 Cen 2007, in Figures 3 and 4, respectively. The timescaling factor of these two novae are the same as that of LV Vul ( against LV Vul). V1065 Cen show a dip in the light curve as shown in Figure 4. This is because a dust shell formed (Helton et al., 2010). Even though, the light curve show similar decay shape to that of LV Vul in the nebular phase. IV Cep and V1065 Cen follow the bluer branch of the LV Vul color curve as shown in Figures 3(b) and 4(b), respectively. These figures mean that we cannot know in some detail how the V959 Mon light curve behaves in the early phase only from the information of the nebular phase and later. In other words, we do not know whether V959 Mon showed a smooth decline like LV Vul, dust dip (V1668 Cyg and V1065 Cen), or wavy structure (IV Cep). However, we may safely assume that the main trend of the light curve is well reproduced by the model light curve.
2.4 Time-stretching Factor and Distance Modulus
Here, we obtain the distance modulus of this nova based on the time-stretching method of nova light curves. Hachisu & Kato (2010, 2015, 2016a, 2018) showed that, if the two nova light curves, i.e., one is called the template and the other is called the target, and overlap each other after time-stretch by a factor of in the horizontal direction and vertical shift by , i.e.,
| (1) |
their distance moduli in the band satisfy
| (2) |
Here, and are the distance moduli in the band of the target and template novae, respectively. This is also written as
| (3) | |||||
| (4) |
This equation means that a target nova with a slower decline rate () than the template nova is fainter by , i.e., .
From Equation (2), we have the relation of
| (5) | |||||
| (6) | |||||
| (7) | |||||
| (8) |
Here, we take and for LV Vul and and for V1668 Cyg as depicted in the figure “LV Vul V+1.6, 1.38 t” and “V1668 Cyg V, 1.38 t” and adopt and from Hachisu & Kato (2016b). Thus, we obtain for V959 Mon. From Equations (4) and (8), we have the relation of
| (9) | |||||
| (10) | |||||
| (11) |
We adopt the reddening of after Munari et al.’s (2013) value of rather than Shore et al.’s (2013) value of (see discussion in Section 5 for detail). We also prefer to because it gives a good matching of the color curve to that of LV Vul in Figure 2(b). The distance is calculated from
| (12) |
where we adopt (e.g., Rieke & Lebofsky, 1985). We obtain kpc together with and . Table 1 summarizes these results.
| Object | Outburst | aa is the timescaling factor against LV Vul. | Distance | bb is the distance from the galactic plane. | |||
|---|---|---|---|---|---|---|---|
| Year | (kpc) | (pc) | |||||
| V1065 Cen | 2007 | 0.0 | 0.45 | 15.0 | 5.3 | 330 | 0.98cc is obtained for the envelope chemical composition of CO nova 3, i.e., , , , , (Hachisu & Kato, 2016a). |
| IV Cep | 1971 | 0.0 | 0.65 | 14.5 | 3.1 | 0.98cc is obtained for the envelope chemical composition of CO nova 3, i.e., , , , , (Hachisu & Kato, 2016a). | |
| V1668 Cygdd Various parameters are taken from Hachisu & Kato (2016a). | 1978 | 0.0 | 0.30 | 14.6 | 5.4 | 0.98cc is obtained for the envelope chemical composition of CO nova 3, i.e., , , , , (Hachisu & Kato, 2016a). | |
| V1974 Cygdd Various parameters are taken from Hachisu & Kato (2016a). | 1992 | 0.03 | 0.30 | 12.2 | 1.8 | 245 | 0.98cc is obtained for the envelope chemical composition of CO nova 3, i.e., , , , , (Hachisu & Kato, 2016a). |
| V959 Mon | 2012 | 0.14 | 0.38 | 13.15 | 2.5 | 3 | 0.95cc is obtained for the envelope chemical composition of CO nova 3, i.e., , , , , (Hachisu & Kato, 2016a). |
| V959 Mon | 2012 | 0.14 | 0.38 | 13.15 | 2.5 | 3 | 1.05ee is obtained for the envelope chemical composition of Ne nova 2, i.e., , , , , (Hachisu & Kato, 2010). |
| V959 Mon | 2012 | 0.14 | 0.38 | 13.15 | 2.5 | 3 | 1.1ff is obtained for the envelope chemical composition of Ne nova 3, i.e., , , , , (Hachisu & Kato, 2016a). |
| LV Vul | 1968#1 | 0.0 | 0.60 | 11.9 | 1.0 | 15 | 0.98cc is obtained for the envelope chemical composition of CO nova 3, i.e., , , , , (Hachisu & Kato, 2016a). |
Figures 3 and 4 show the light/color curves of IV Cep and V1065 Cen in comparison with LV Vul. The timescales and color curve shapes of these two novae are almost the same as those of LV Vul and V1668 Cyg. Therefore, we apply Equations (1) and (2) to Figure 3 and obtain the relation of
| (13) | |||||
| (14) | |||||
| (15) |
The value of is consistent with the previous estimate of in Hachisu & Kato (2016b). The distance is calculated to be kpc from Equation (12) together with (Hachisu & Kato, 2016b).
In the same way, we obtain
| (16) | |||||
| (17) | |||||
| (18) |
for V1065 Cen. This value of is slightly smaller than, but in reasonable agreement with the previous value of (Hachisu & Kato, 2016b). The distance is calculated to be kpc from Equation (12) together with (Hachisu & Kato, 2016b). These results are summarized in Table 1. Then, we have the relation of
| (19) | |||||
| (20) | |||||
| (21) | |||||
| (22) | |||||
| (23) |
In our method, there are two sources of ambiguity in : one is the error of the template nova and the other is the vertical fit error. For the vertical fit, we change in steps of 0.1 mag and search for the best overlap by eye. This error is typically 0.1 or 0.2 mag unless the data are scattered. The errors of templates are dependent on each template (typically 0.2 mag). We checked the fit with a least square method and obtained errors of or mag. Thus, the errors of distance modulus are 0.2 or 0.3 mag unless otherwise specified.
3 Color-magnitude Diagram
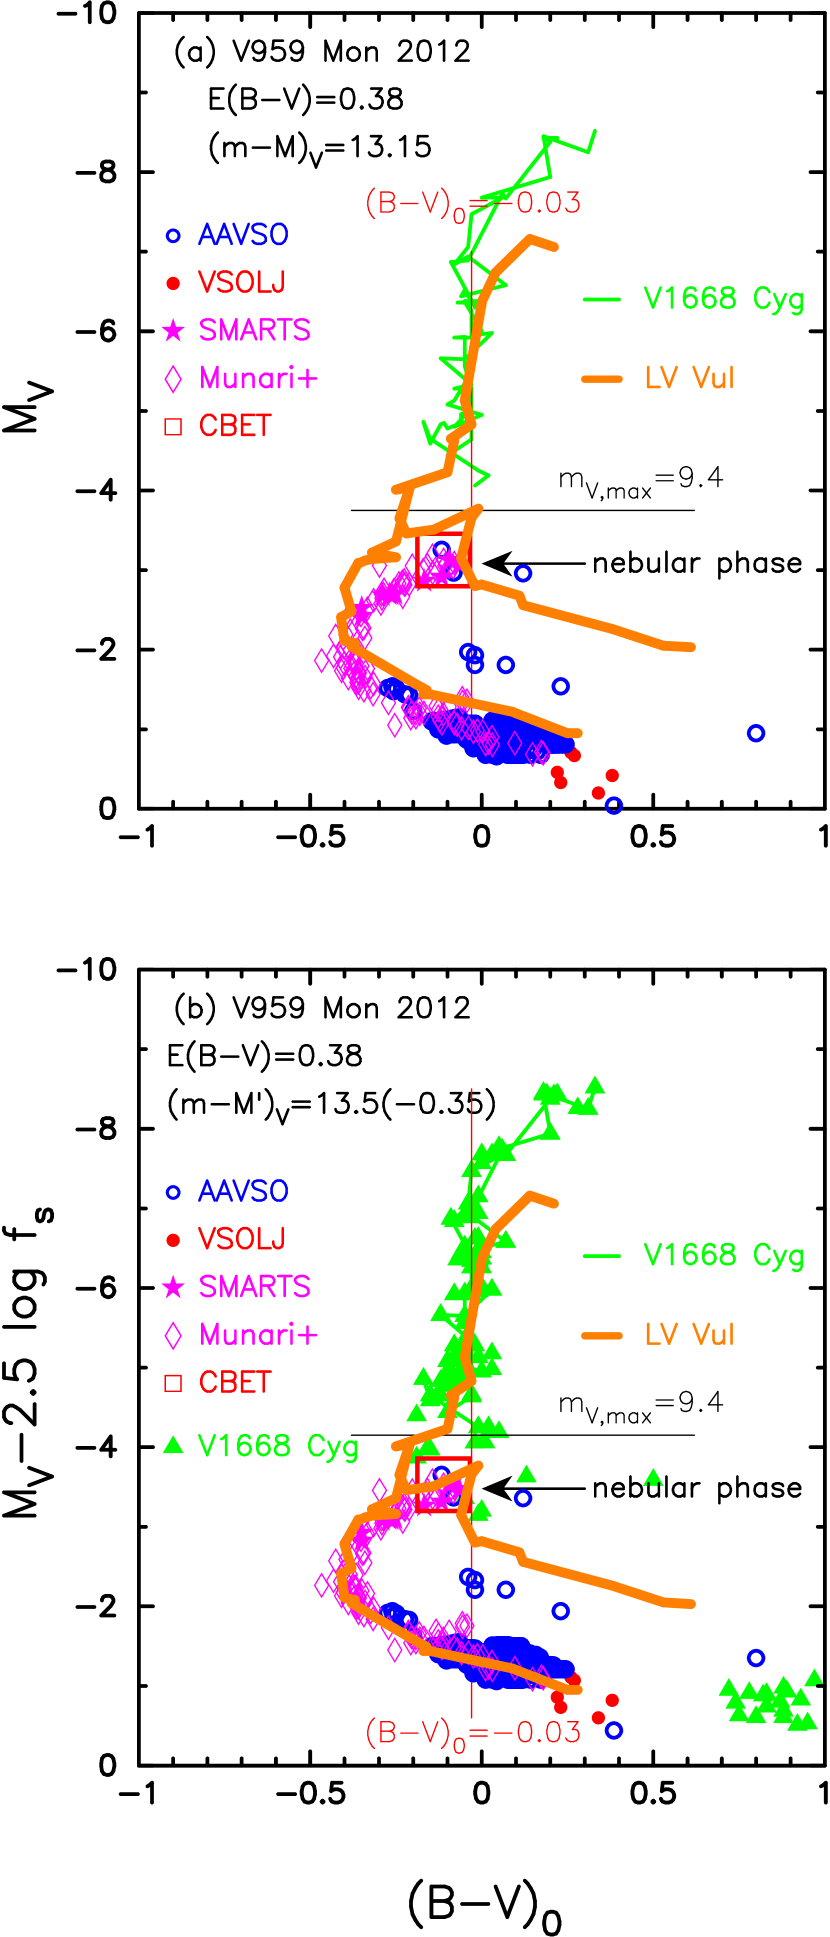
Hachisu & Kato (2016b) analyzed 48 novae in the color-magnitude diagram, and showed that a typical nova evolves down along with the line of in the early phase () of the outburst. This indicates that the optical flux is dominated by free-free emission because the intrinsic color of optically thick free-free emission is (Hachisu & Kato, 2014). The nebular phase begins when the nova becomes as faint as (more exactly Equation (5) or (6) of Hachisu & Kato, 2016b). Figure 5(a) shows the outburst evolution of V1668 Cyg and LV Vul in the color-magnitude diagram, in which they go down along with the line of . In the nebular phase, the data of LV Vul splits into two branches. This splitting is caused by slightly different response of V-band filters (see, e.g., Figure 1 of Munari et al., 2013). Slightly different response functions of different filters produce large differences in the magnitudes because of large contributions of strong emission lines of [O III] at the blue edge of the filter (see discussion of Hachisu & Kato, 2006, 2014, 2016b).
In this figure we also plot the V959 Mon data for and . The data follow the bluer branch of the LV Vul track, but slightly fainter. In the spectra of V959 Mon obtained by Munari et al. (2012) on UT 2012 August 20.14, [O III] 5007 line slightly exceeds that of H. Therefore, we identify the start of the nebular phase at this day, i.e., and , which is denoted by the large open red square in Figure 5(a).
The evolution of V959 Mon in Figure 5(a) does not exactly follow the LV Vul evolution, whereas the color evolutions of these two well agree in Figure 2(b). It is because we do not include time-stretching effect in Figure 5(a). Here, we make another color-magnitude diagram, Figure 5(b), taking into account the time-stretching effect. Remember that, in Figure 2, the V959 Mon data agree well with that of LV Vul only when we use the stretched time and the stretched magnitude, in Equation (4). In the same way, we use in the color-magnitude diagram, instead of , i.e., we shift the magnitude upward by mag. The text “” in the figure means that and .
Next, we obtain the intrinsic color with time-stretching effect. The stretched absolute and magnitudes of V959 Mon can be written against those of LV Vul as,
| (24) | |||||
| (25) |
and
| (26) | |||||
| (27) |
Thus, we obtain
| (28) | |||||
| (29) | |||||
| (30) | |||||
| (31) |
This means that the intrinsic color is unchanged after the time-stretching process.
Figure 5(b) shows that the resultant track of V959 Mon well overlaps with that of LV Vul. The onset of the nebular phase of LV Vul is close to that of V959 Mon in the stretched color-magnitude diagram (see Figure 6 of Hachisu & Kato, 2016b). Conversely, this agreement supports our values of , , . Thus, we confirm that the distance to V959 Mon is kpc from Equation (12) together with and .
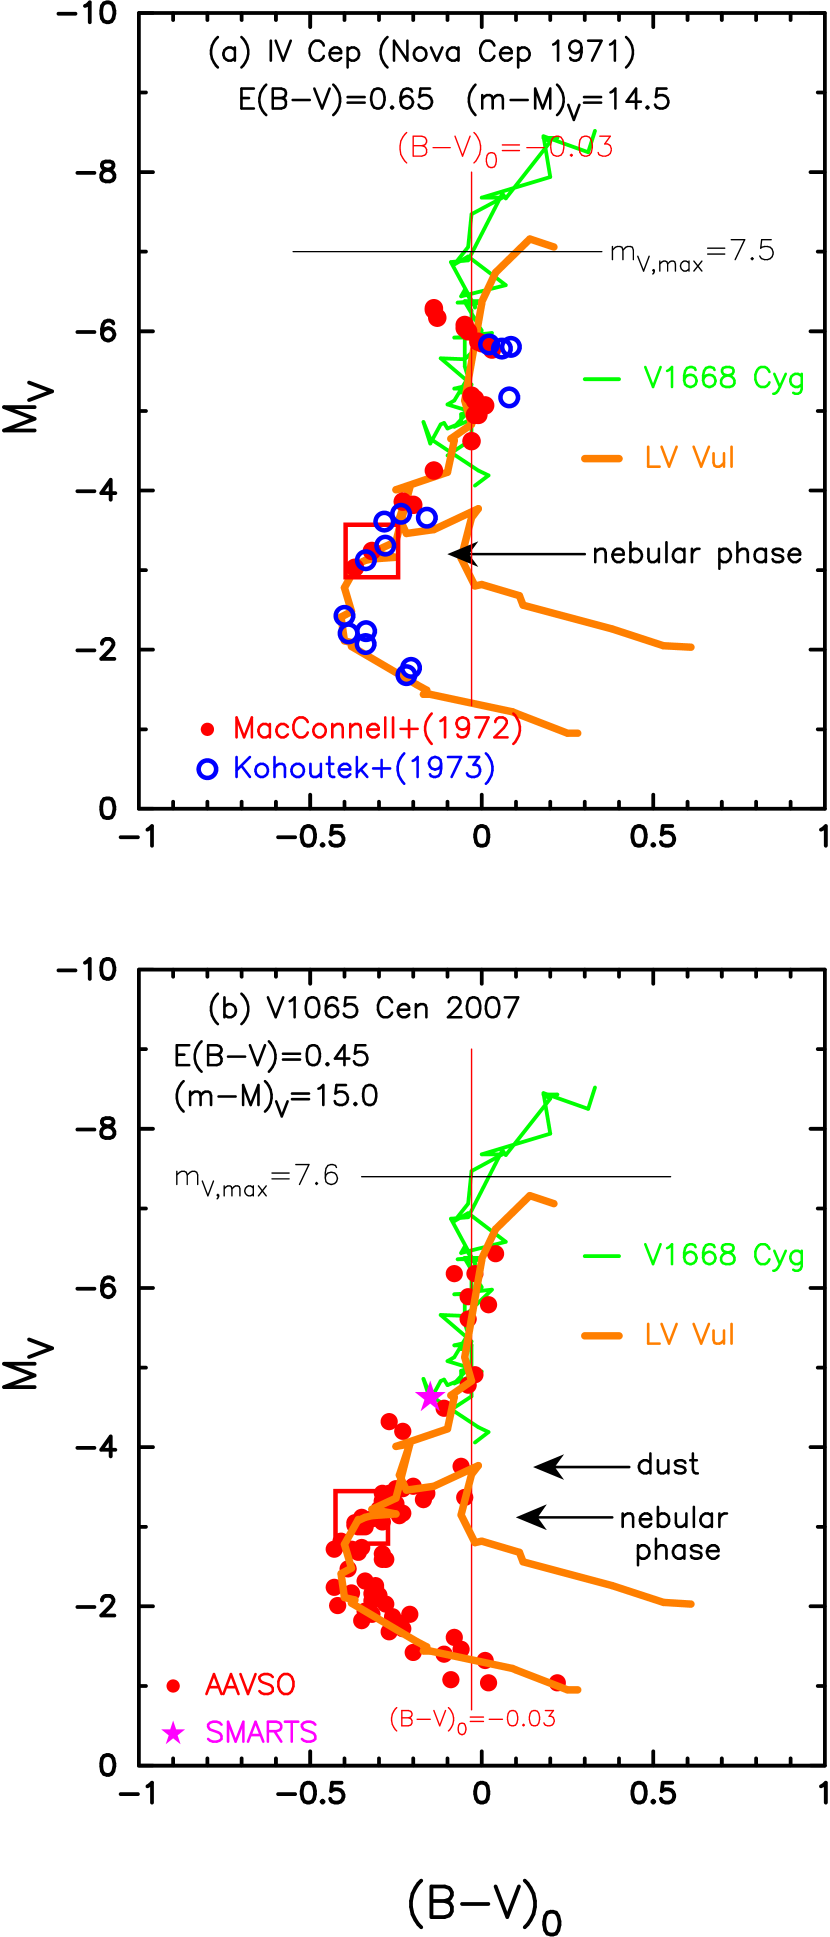
We plot the color-magnitude diagrams of IV Cep and V1065 Cen in Figure 6(a) and (b), respectively. The track of these two novae do not move after time-stretch because the timescaling factor is against that of LV Vul. These novae evolve down along with the bluer branch of LV Vul. In IV Cep, strong emission lines of [O III] appeared between UT 1971 September 12 and 22 (Rosino, 1975), which is an indication of the nebular phase. We identify the start of the nebular phase at and , denoted by the large open red square in Figure 6(a). This starting point is close to that of LV Vul. In V1065 Cen, we specify the starting point of dust blackout (Helton et al., 2010) at and , denoted by the black arrow in Figure 6(b). Helton et al. (2010) pointed out that the nova entered the early nebular phase at , about 70 days after maximum. We denote this phase by the large open red square, at and . This point is close to that of LV Vul.
We list our results in Table 1. These results are consistent with each other and confirm that our time-stretching method works among these nova systems.
4 Model Light Curve Fitting
4.1 WD masses of neon novae
Neon novae are a subclass of classical novae that show neon emission lines stronger than the permitted lines in the nebular phase. Such neon enrichment is considered to originate from the core material of an oxygen-neon (ONe) WD (e.g., Gehrz et al., 1998). A natal ONe WD is likely massive than (e.g., Umeda et al., 1999), or (e.g., Weidemann, 2000), and has a thin helium-rich layer above a carbon–oxygen(CO)-rich mantle, e.g., a CO mantle for a ONe core (Gil-Pons & García-Berro, 2001). Such a WD may undergo a number of nova explosions before the thin helium-rich layer is blown off. Subsequently, the WD further undergoes a number of nova explosions before the CO mantle on the ONe core is blown off. If the mass accretion rate is yr-1, the ignition mass is , and the same amount of WD material is dredged up in every nova outburst, we can expect that 3,000 to 4,000 outbursts (in a total time of at least 30 – 40 Myr) must occur before the WD is deprived of its CO-rich mantle and significant neon is detected in the ejecta. This could be a lower estimate because a CO-rich mantle is more massive for the lower mass limit of the ONe core (as massive as , Gil-Pons et al., 2003). Therefore, the minimum masses of naked ONe cores could be slightly smaller than .
4.2 Chemical composition of V959 Mon ejecta
The largest ambiguity in the WD mass determination is in the choice of the chemical composition. In many novae, chemical composition of ejecta is not well determined. In our previous work (e.g., Hachisu & Kato, 2016a), we chose several sets of chemical composition as templates (Ne nova 1, Ne nova 2, and Ne nova 3, which are basically calculated from the degree of mixing between hydrogen-rich envelope and WD core material).
Shore et al. (2013) obtained the chemical abundance of V959 Mon from their optical spectra. We converted their number-based abundance values to our mass-weighted values, that is, , , , , , , and by weight. Tarasova (2014) also estimated the chemical composition of V959 Mon from her optical spectra, which are converted to , , , , , and by weight, assuming because she did not obtain the carbon abundance. In the present work, we adopt Ne nova 3 as a standard case because it is close to the abundance obtained by Shore et al. (2013), and Ne nova 2 and CO nova 3 for comparison, to examine how the WD mass depends on the chemical composition.
4.3 Multiwavelength light curves of V959 Mon
Figure 2(a) shows the , visual, and X-ray data of V959 Mon. The X-ray data observed with Swift/XRT are divided into two bands, i.e., keV (supersoft) and keV (hard) (Page et al., 2013). In general, the main emitting wavelength region during a nova outburst shifts from optical, UV, and to supersoft X-ray, because the WD photosphere moves inward and the effective temperature rises with time. This figure also shows UV 1455 Å flux of V1668 Cyg observed with IUE. We have no UV 1455 Å observation for V959 Mon, but its UV phase should be the same. The supersoft X-ray flux of V959 Mon increases after the UV dominant phase. This is consistent with the general picture of nova evolutions that the main emitting wavelength region shifts to shorter one with time. Thus, we naturally regard that this supersoft X-ray is the emission from the WD surface.
Hachisu & Kato (2010) calculated a number of multiwavelength light curves with various WD masses and chemical compositions. The band fluxes are dominated by free-free emission. The UV 1455Å and SSS fluxes are obtained assuming blackbody emission at the photosphere. The decay timescale of their model light curves depend mainly on the WD mass and weakly on the chemical composition of the WD envelope. Assuming the chemical composition of Ne nova 3 (Hachisu & Kato, 2006, 2010, 2016a), we calculated four model light curves of 1.05, 1.1, 1.15, and WDs and chose a best-fit model of WD among these four model light curves as shown in Figure 7(a). We list our results in Table 1. We discuss the model light curve fitting in detail below in Section 4.4. With this WD model and for V959 Mon, we plot the model light curves of absolute (left solid red line) and arbitrarily scaled X-ray (right solid red line) in Figure 2(a). The light curve of V959 Mon is reproduced with our model light curve of WD until the early nebular phase.
4.4 Dependence of WD mass on chemical composition
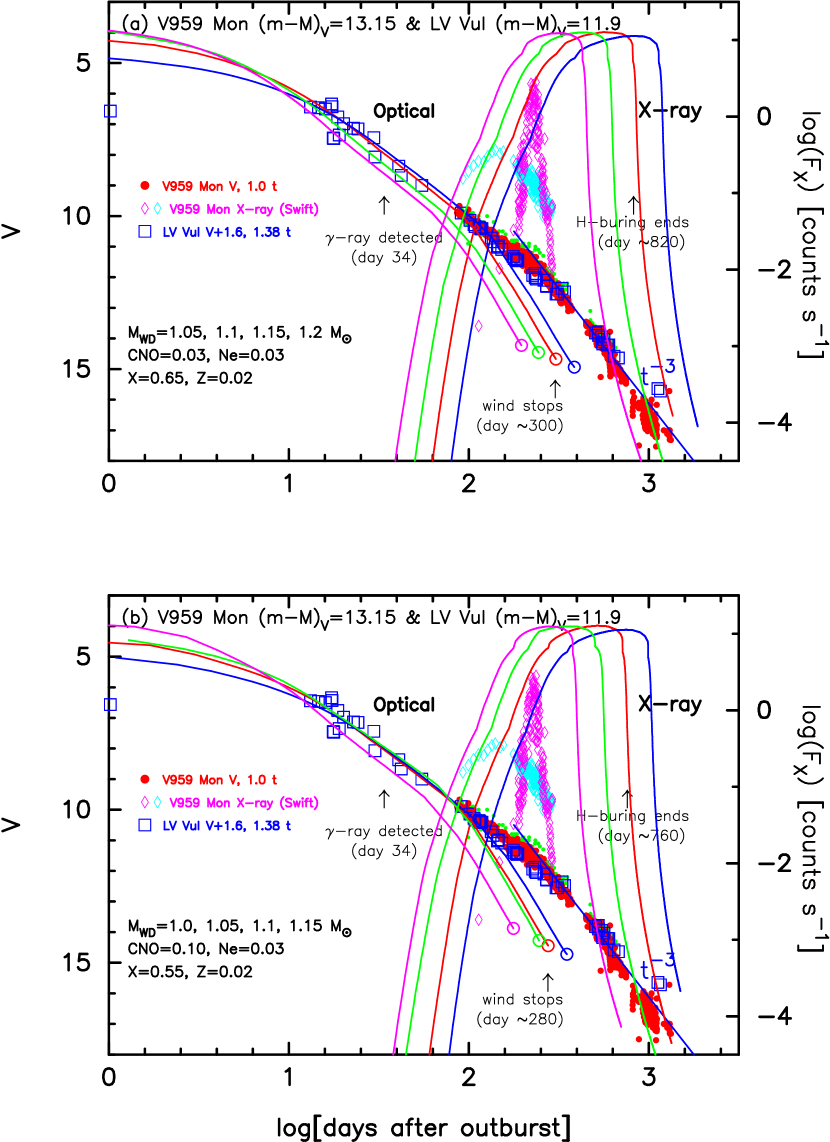
We examine the WD mass of V959 Mon in more detail, because the model light curves depend weakly on the chemical composition (Hachisu & Kato, 2006). Figure 7(a) shows the model dependence of and supersoft X-ray light curve on the WD mass for the chemical composition of Ne nova 3. Because the early phase of light curve was not observed, we use the stretched data of LV Vul. The model light curves of 1.15 and WDs decay too early and the supersoft X-ray light curve of rises too late compared with the observation.
The decay of light curve started about day after the outburst as discussed in Section 2.3. This epoch corresponds roughly to the epoch when the optically thick winds stopped. The optically thick winds of 1.15 and WDs stopped roughly on day 250 and 300, respectively. Thus, we select the WD for the chemical composition of Ne nova 3.
Figure 7(b) depicts four light curves of 1.0, 1.05, 1.1, and WDs for a different chemical composition of Ne nova 2 (Hachisu & Kato, 2010). The light curve of WD decays too early. The supersoft X-ray light curve rises too early in the and too late in the compared with the observation. Thus, we select the WD for the chemical composition of Ne nova 2, although the WD cannot be rejected.
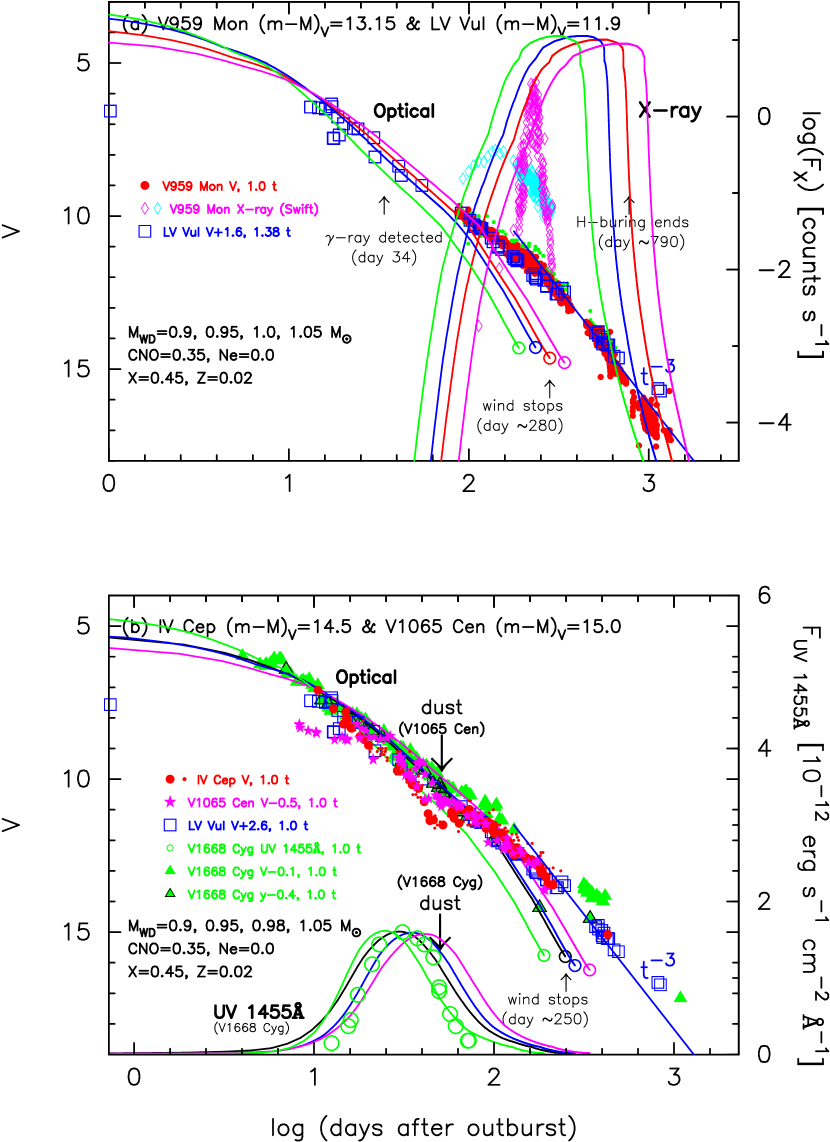
If we further decrease the hydrogen content by weight to (CO nova 3, see Hachisu & Kato, 2016a) from (Ne nova 2) and (Ne nova 3), we similarly obtain a WD mass of as a best-fit one among 0.9, 0.95, 1.0, and as shown in Figure 8(a). We summarize these results in Table 1.
It should be noted that the neon content hardly affects the timescales of model nova light curves mainly because neon is not included in the hydrogen burning (CNO-cycle) and does not much contributes to the opacity. In other words, the WD mass depends weakly on the chemical composition, especially for the hydrogen content .
We obtain for , for , and for , considering the relatively large ambiguity of soft X-ray fit. This kind of tendency of WD mass on was already discussed in Hachisu & Kato (2007). Our model light curve fitting gives WD masses between for the chemical compositions of . This result is consistent with the above discussion on the minimum mass of naked ONe cores.
4.5 Emergence of companion star
Hard X-ray ( keV) flux of V959 Mon was detected by Swift (Page et al., 2013) about 85 days after the outburst and reached maximum at day and then began to decrease until day (see Figure 2(a)). The origin of hard X-rays was interpreted as internal shocks (Friedjung, 1987) formed by collision between two ejecta shells (Mukai & Ishida, 2001), or the shock between nova winds (optically thick winds) and the companion star (see, e.g., Hachisu & Kato, 2005, 2006; Hachisu et al., 2008). If it is the second case, the hard X-ray emergence should be coincident with the emergence of the companion from the WD photosphere because hard X-ray is probably absorbed deep inside the nova photosphere.
Using the WD model for Ne nova 3, we estimate the epoch when the companion emerges from the nova envelope. The orbital period of days (7.1 hr) was derived by Osborne et al. (2013) and Munari et al. (2013) from the orbital modulations of X-ray and optical light curves, respectively. The mass of the donor star may be estimated from Warner’s (1995) empirical formula, i.e.,
| (32) |
that gives . With the WD mass , the separation is calculated to be , the effective Roche lobe radius is for the primary component (WD) and for the secondary component (main-sequence star). Our theoretical WD model predicts that the photosphere of the nova envelope shrinks to the orbital size, i.e., , at days and further shrinks to (orbit minus the companion’s radius, i.e., the companion entirely emerges from the WD envelope) at days.
In our model the companion emerges at days, which is roughly consistent with the hard X-ray detection at 85 days. The decay of the hard X-ray may be explained as the decrease of the wind mass-loss rate. In our model, the wind mass-loss rate monotonically decreases and stops at days. More exactly, the wind mass-loss rate quickly decreases after (see Hachisu & Kato, 2006). This is consistent with the hard X-ray behavior that peaks about days, and after that it monotonically decreased until days. From these coincidences, we suggest that the hard X-ray emission could originate from shock between the ejecta and companion.
For the chemical composition of Ne nova 2 (), the emerging time of the companion star from the WD photosphere is about days. For CO nova 3 (), the emerging time is about days. These values are still consistent with the above argument on hard X-ray emergence.
4.6 Epoch at gamma-ray detection
The gamma-ray was detected about 50 days before the hard X-ray count rate increased. Comparing with the theoretical light curve of the WD (Ne nova 3), the photospheric radius of nova envelope is ( times the separation) and the wind mass loss rate is yr-1 at the time of gamma-ray detection. This may be a clue for the emission mechanism of gamma-ray. For the chemical composition of Ne nova 2, we obtain a best-fit model of . The photospheric radius is , and the wind mass-loss rate is yr-1 at the gamma-ray detection (day 34). For CO nova 3 (), and yr-1 at the gamma-ray detection.
4.7 Short duration of supersoft X-ray phase
Figure 2(a) also shows the model light curve of the supersoft X-ray flux. It rises before the optically thick wind stops. We suppose that in the wind phase the SSS flux may be partly blocked due to self-absorption by the wind. For example, in V1974 Cyg, only weak SSS flux was observed before the optically thick wind stopped, and after the wind stops, the supersoft X-ray flux quickly increases (see Figure 41 of Hachisu & Kato, 2016a). Considering these rising relations between the observed soft X-ray flux and our model soft X-ray flux, the rise of the SSS flux in V959 Mon shortly before the wind stops is consistent with our model flux.
The supersoft X-ray flux of V959 Mon decays much earlier than the model prediction, in which the X-ray turnoff time is calculated from the end of hydrogen nuclear burning. This observed short SSS duration ( days) in V959 Mon is much shorter than the SSS duration of other classical novae with a similar timescale and WD mass. For example, V1974 Cyg shows the SSS duration of days and its WD mass is estimated to be for the chemical composition of CO nova 3 (and against LV Vul) (see, e.g., Hachisu & Kato, 2016a).
V959 Mon is a high inclination binary as mentioned in Section 1. The very short duration of the SSS phase may be naturally explained with eclipse by a flaring-up rim of the accretion disk. In other words, the WD continues to emit supersoft X-rays from its surface until the end of the nuclear burning but the WD surface was entirely obscured by a geometrically thick disk rim.
Hachisu & Kato (2003) presented a model to explain the light curve variation of the recurrent nova CI Aql 2000 outburst by flaring-up of the disk rim. During the optically thick wind phase, the disk rim is partially blown off in the wind, so the disk height at the rim is forced to remain small. When the wind gradually weakens and finally stops, the disk rim flares up because the wind shaping effect disappears. This change of the disk rim consistently explained the light curve variation of CI Aql.
As V959 Mon is a high inclination binary (: Ribeiro et al., 2013), the WD and its surrounding emission region could be perfectly shielded by the flaring-up disk rim when the wind stops (see, e.g., Sala et al., 2008, for similar X-ray eclipses of V5116 Sgr). This could cause the rapid decrease in the supersoft X-ray flux.
It should be noted that in the case of V5116 Sgr ( days or 2.97 hr) the SSS emission is still present during eclipse by the rim due to X-ray scattering in the surrounding material (e.g., Sala et al., 2017). The hardness of the X-ray emission hardly changed during the eclipse of V5116 Sgr (Sala et al., 2008). On the other hand, if the flux decrease is due to a turnoff of hydrogen burning, one would expect the spectrum to become softer, colder, during the decline of the SSS. For V959 Mon, Page et al. (2013) reported no substantial change of X-ray spectra in the decline phase. This may support our eclipse model by the disk rim.
4.8 WD masses of LV Vul, IV Cep, and V1065 Cen
The timescales of and color curves of LV Vul, IV Cep, and V1065 Cen are very similar to that of V1668 Cyg. We regard that the WD masses of LV Vul, IV Cep, and V1065 Cen are also similar to that of V1668 Cyg. A comprehensive analysis of the V1668 Cyg light curve was already presented in Hachisu & Kato (2016a), which showed that the WD mass is for the chemical composition of CO nova 3. We reproduce their light curve analysis and plot four model light curves for 0.9, 0.95, 0.98, and WDs in Figure 8(b).
5 Discussion
5.1 Reddening and distance
We examine the distances and reddenings toward the four novae based on various distance-reddening relations. We use the following four results: Marshall et al. (2006) published a three-dimensional (3D) extinction map of our galaxy in the direction of and with grids of and . Sale et al. (2014) calculated the reddening for a region of and based on the IPHAS photometry. Green et al. (2015) published data for the galactic extinction map, which covers a wider range of the galactic coordinates (over three quarters of the sky) with much finer grids of 34 to 137 and a maximum distance resolution of 25%. Their values of could have an error of 0.05 – 0.1 mag compared with other two-dimensional (2D) dust extinction maps. The distance-reddening relation was recently revised by Green et al. (2018). Özdörmez et al. (2016) obtained distance-reddening relations toward 46 novae based on the unique position of the red clump giants in the color-magnitude diagram.
5.1.1 V959 Mon
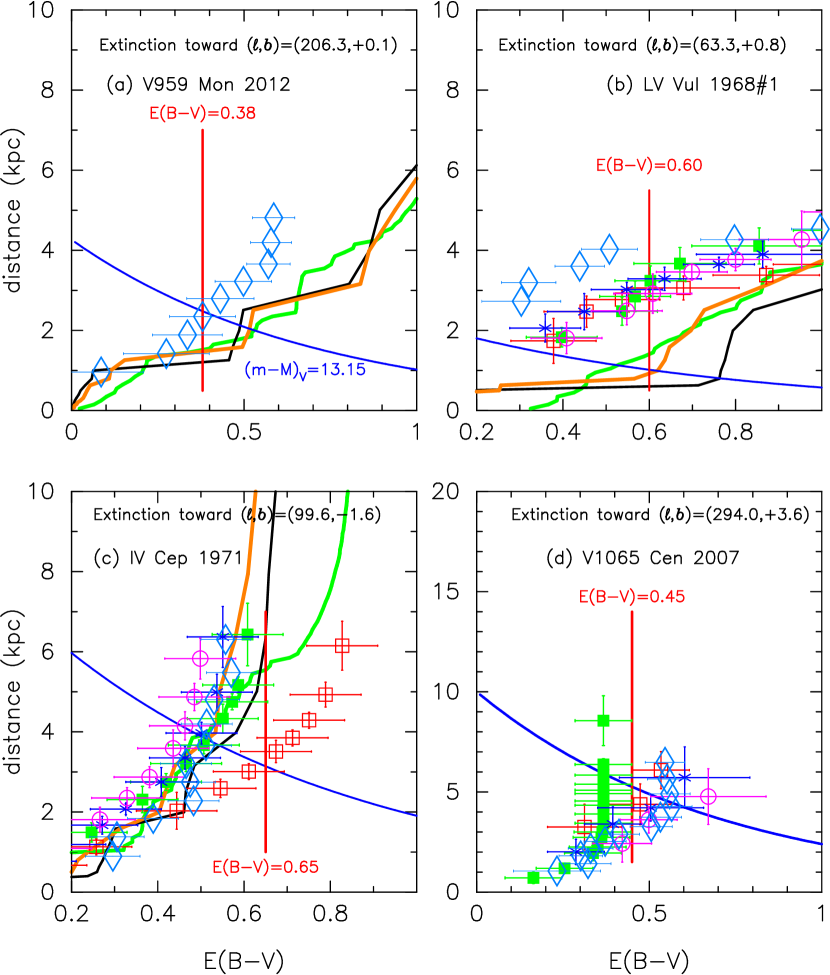
Figure 9(a) shows a few distance-reddening relations toward V959 Mon, whose galactic coordinates are . The reddening of and the distance modulus of cross at kpc. The green line of Sale et al. (2014) is the nearest line-of-sight reddening of . The solid black and orange lines denote the distance-reddening relations given by Green et al. (2015) and Green et al. (2018), respectively. The position of kpc and is consistent with that of Özdörmez et al. (2016) but slightly deviates from those of Green et al. (2015, 2018) and Sale et al. (2014).
Munari et al. (2013) estimated the reddening to be from the equivalent width of Na I 5890 Å line and derived the distance to be kpc by assuming that the companion is a K3 main-sequence star. Linford et al. (2015) obtained the distance, – kpc, with a most probable distance of kpc, using the expansion parallax method based on the VLA radio map. On the other hand, Shore et al. (2013) derived a large reddening of and the hydrogen column density of cm-2 by comparing the Na I absorption line with the Leiden/Argentine/Bonn (LAB) survey 21 cm profile of neutral hydrogen (Kalberla et al., 2005). They also obtained the distance of kpc from the direct comparison of UV and optical fluxes of V959 Mon with those of V1974 Cyg, assuming that the distance and reddening of V1974 Cyg are 3.6 kpc and . Tarasova (2014) also derived the reddening of from Balmer decrements. To summarize these previous studies, there are two distinct groups for the distance and reddening, one is kpc (e.g., Munari et al., 2013) and the other is kpc (e.g., Shore et al., 2013). The both sets of are close to the distance-reddening lines obtained by Green et al. (2015, 2018) and Sale et al. (2014).
As mentioned earlier, Linford et al. (2015) obtained the distance of V959 Mon based on the motion of the ejecta along the north-south axis. The distance depends on the assumed expansion velocity of the ejecta along the north-south axis. Their distance values are between the lower limit of kpc (assuming the expansion velocity of km s-1) and the upper limit of kpc ( km s-1) from the VLA radio map between day 126 and 199. Their upper limit is consistent with our distance of kpc. Linford et al. (2015) also obtained “a most probable distance of kpc,” assuming km s-1 based on the VLA map between day 615 and 703. Note that their day 0 is defined by UT 2012 June 19 (JD 2456097.5). This kpc is not consistent with kpc from the data between day 126 and 199 (using the same km s-1). If we adopt km s-1 instead, their most probable distance increases to kpc for the data between day 615 and 703. Taking the arithmetic average of these two expansion velocities, we obtain “a most probable distance of (1.4+3.5)/2=2.45 kpc,” which is close to our value of 2.5 kpc. Thus, we may conclude that the distance of kpc is consistent with Linford et al.’s expansion parallax method.
5.1.2 LV Vul
For the reddening toward LV Vul, Fernie (1969) determined from the color excesses of 14 B stars near the line of sight. Tempesti (1972) obtained from the color at optical maximum; i.e., . He adopted (Schmidt, 1957) instead of (van den Bergh & Younger, 1987). The distance toward LV Vul was obtained to be kpc by Slavin et al. (1995) from the expansion parallax method. Hachisu & Kato (2014) obtained by fitting with the typical color-color evolution track of nova outbursts. These are all consistent with our set of kpc and . Thus, our set of for LV Vul seems to be reasonable.
Figure 9(b) shows several distance-reddening relations toward LV Vul, . We plot Marshall et al.’s distance-reddening relations of four directions close to LV Vul: (red open squares), (green filled squares), (blue asterisks), and (magenta open circles). We added Green et al.’s, Sale et al.’s , and Özdörmez et al.’s distance-reddening relations. In this way, various distance-reddening relations are not converged.
The large discrepancies among the distance-reddening relations can be understood as follows. The 3D dust maps essentially give an averaged value of a relatively broad region, and thus the pinpoint reddening could be different from the value of the 3D dust maps, because the resolutions of these dust maps are considerably larger than molecular cloud structures observed in the interstellar medium. Özdörmez et al. (2016) used red clump giants. The number density of red clump giants is smaller than that of giants that Marshall et al. used. Therefore, the angular resolution of Özdörmez et al. (2016) could be less than that of Marshall et al. (2006), although Özdörmez et al. (2016) claimed the accuracy for the distance-reddening relation toward WY Sge which is not significantly different for the four resolutions of 03, 04, 05, and 08. (WY Sge is not included in the present analysis.) The angular resolution of the map of Marshall et al. is 025=150. Marshall et al. used only giants (or post main-sequence stars) in their analysis, and thus the dust map they produced has little information for the nearest kiloparsec. Among these relations, only the orange line (Green et al., 2018) is consistent with our estimates of kpc and .
5.1.3 IV Cep
The reddening toward IV Cep was estimated to be (Sato et al., 1973) from the interstellar absorption in the Cepheus region, and (Thomas et al., 1973) and (Kohoutek & Klawitter, 1973), both from the absorption–distance relation given by Neckel (1967). Hachisu & Kato (2016b) obtained by fitting with the typical color-color evolution track of nova outbursts. All these values are roughly consistent with our estimate of .
Figure 9(c) shows several distance-reddening relations toward IV Cep, We plot four relations given by Marshall et al. (2006) in directions close to IV Cep: (red open squares), (green filled squares), (blue asterisks), and (magenta open circles). We also add Green et al.’s, Sale et al.’s , and Özdörmez et al.’s relations. Among these relations, Marshall et al.’s relation of open red squares is consistent with our set of kpc and .
5.1.4 V1065 Cen
Figure 9(d) shows various distance-reddening relations toward V1065 Cen, . We plot Özdörmez et al.’s relation, and four distance-reddening relations given by Marshall et al. (2006): by red open squares, by filled green squares, by blue asterisks, and by open magenta circles. The closest ones of Marshall et al. (2006) are those denoted by filled green squares and open magenta circles. Our values of kpc and are midway between them.
The reddening for V1065 Cen was obtained as by Helton et al. (2010) from an average of three estimates, i.e., , , from the Balmer decrement (H/H). Helton et al. (2010) also estimated the apparent distance modulus in the band as from the MMRD relation together with days. This gives a distance of kpc. Note, however, that the distance estimate by the MMRD relation is not so accurate (see, e.g., Downes & Duerbeck, 2000). Hachisu & Kato (2016b) obtained , assuming that the intrinsic color evolution of V1065 Cen is identical with that for similar types of novae, i.e., LV Vul and V1668 Cyg. This value is consistent with the estimate of Helton et al.’s value.
To summarize, our obtained distances and reddenings for the four novae are broadly consistent with other estimates. We conclude that the distance of V959 Mon is kpc for .
6 Conclusions
Our main results are summarized as follows:
-
1.
The light curves of V959 Mon and LV Vul overlap each other, if we stretch the timescale of LV Vul by a factor of . Applying the time-stretching method to the light curves of V959 Mon and LV Vul, we obtain the distance modulus of V959 Mon in the band, . The distance is calculated to be kpc for the reddening of . We also apply the time-stretching method for other sets of V959 Mon vs. V1668 Cyg, IV Cep, and V1065 Cen, and obtain similar values for the distance modulus for V959 Mon.
-
2.
The stretched color-magnitude track of V959 Mon just overlaps with that of LV Vul in the - diagram. This strongly supports our adopted values of and . The color-magnitude tracks of IV Cep and V1065 Cen also overlap with that of LV Vul, which may indicate a common track in the stretched color-magnitude diagram.
-
3.
The various distance-reddening relations toward V959 Mon are consistent with our obtained values. Thus, we confirm kpc, , and .
-
4.
The model light curve fitting suggests the WD mass of , depending weakly on the assumed chemical composition. This range of the WD mass is consistent with the claim that V959 Mon is an ONe nova. If we adopt the model chemical composition of Ne nova 3, which is close to the abundance obtained by Shore et al. (2013), the WD mass is .
-
5.
The period of hard X-ray emission is consistent with the time of appearance of the companion star from the nova envelope. Thus, the hard X-rays could be shock-origin between the ejecta and companion.
-
6.
The supersoft X-ray flux increases in the later phase of a nova outburst when the extended WD envelope becomes transparent to soft X-rays. The X-ray turn-on time of V959 Mon is quite consistent with theoretical model, which is confirmed by a number of classical novae. In other words, no diagnostics can be found for the X-ray turn-on time. This is a typical event of a nova evolution.
-
7.
The very short supersoft X-ray phase in V959 Mon ( days) can be explained as the occultation by the disk rim. Our theoretical model indicates that the WD radius becomes as small as at the X-ray turnoff time that can be easily hidden by the disk rim (). In short, the X-ray turnoff is due to the occultation by the disk rim, instead of nuclear burning turnoff.
-
8.
Our WD models suggest that, at the time of gamma-ray detection, the photosphere of nova envelope extends to (about two or three times the binary separation) and the wind mass-loss rate is yr-1. This may be a clue for the emission mechanism of gamma-ray.
References
- Ackermann et al. (2014) Ackermann, M., Ajello, M., Albert, A., et al. 2014, Science, 345, 554
- Cheung et al. (2012) Cheung, C. C., Shore, S. N., De Gennaro Aquino, I., et al. 2012, ATel, 4310, 1
- Downes & Duerbeck (2000) Downes, R. A., & Duerbeck, H. W. 2000, AJ, 120, 2007
- Evans et al. (2009) Evans, P. A., Beardmore, A. P., Page, K. L., et al. 2009, MNRAS, 397, 1177
- Fernie (1969) Fernie, J. D. 1969, PASP, 81, 374
- Finzell et al. (2015) Finzell, T., Chomiuk, L., Munari, U., Walter, F. M. 2015, ApJ, 809, 160
- Friedjung (1987) Friedjung, M. 1987, A&A, 180, 155
- Fujikawa et al. (2012) Fujikawa, S., Yamaoka, H., Nakano, S. 2012, CBET, 3202, 1
- Gehrz et al. (1998) Gehrz, R. D., Truran, J. W., Williams, R. E., & Starrfield, S. 1998, PASP, 110, 3
- Gil-Pons & García-Berro (2001) Gil-Pons, P., & García-Berro, E. 2001, A&A, 375, 87
- Gil-Pons et al. (2003) Gil-Pons, P., García-Berro, E., José, J., Hernanz, M., & Truran, J. W. 2003, A&A, 407, 1021
- Green et al. (2015) Green, G. M., Schlafly, E. F., Finkbeiner, D. P., et al. 2015, ApJ, 810, 25
- Green et al. (2018) Green, G. M., Schlafly, E. F., Finkbeiner, D. P., et al. 2018, arXiv:1801.03555
- Greimel et al. (2012) Greimel, R., Drew, J., Steeghs, D., & Barlow, M. 2012, ATel, 4365, 1
- Hachisu & Kato (2003) Hachisu, I., & Kato, M. 2003, ApJ, 588, 1003
- Hachisu & Kato (2005) Hachisu, I., & Kato, M. 2005, ApJ, 631, 1094
- Hachisu & Kato (2006) Hachisu, I., & Kato, M. 2006, ApJS, 167, 59
- Hachisu & Kato (2007) Hachisu, I., & Kato, M. 2007, ApJ, 662, 552
- Hachisu & Kato (2009) Hachisu, I., & Kato, M. 2009, ApJ, 694, L103
- Hachisu & Kato (2010) Hachisu, I., & Kato, M. 2010, ApJ, 709, 680
- Hachisu & Kato (2014) Hachisu, I., & Kato, M. 2014, ApJ, 785, 97
- Hachisu & Kato (2015) Hachisu, I., & Kato, M. 2015, ApJ, 798, 76
- Hachisu & Kato (2016a) Hachisu, I., & Kato, M. 2016a, ApJ, 816, 26
- Hachisu & Kato (2016b) Hachisu, I., & Kato, M. 2016b, ApJS, 223, 21
- Hachisu & Kato (2018) Hachisu, I., & Kato, M. 2018, ApJ, submitted
- Hachisu et al. (2008) Hachisu, I., Kato, M., & Cassatella, A. 2008, ApJ, 687, 1236
- Helton et al. (2010) Helton, L. A., Woodward, C. E., Walter, F. M., et al. 2010, AJ, 140, 1347
- Ita & Matsunaga (2011) Ita, Y., & Matsunaga, N. 2011, MNRAS, 412, 2345
- Kalberla et al. (2005) Kalberla, P. M. W., Burton, W. B., Hartmann, D., et al.
- Kasliwal et al. (2011) Kasliwal, M. M., Cenko, S. B., Kulkarni, S. R., et al. 2011, ApJ, 735, 94
- Kato & Hachisu (1994) Kato, M., & Hachisu, I., 1994, ApJ, 437, 802
- Kato et al. (2009) Kato, M., Hachisu, I., & Cassatella, A. 2009, ApJ, 704, 1676
- Kato et al. (2015) Kato, M., Saio, H., & Hachisu, I. 2015, ApJ, 808, 52
- Kohoutek & Klawitter (1973) Kohoutek, L., & Klawitter, P. 1973, A&AS, 11, 347
- Linford et al. (2015) Linford, J. D., Ribeiro, V. A. R. M., Chomiuk, L., et al. 2015, ApJ, 805, 136
- MacConnell & Thomas (1972) MacConnell, D. J., & Thomas, J. C. 1972, Inf. Bull. Variable Stars, 706, 1
- Marshall et al. (2006) Marshall, D. J., Robin, A. C., Reylé, C., Schultheis, M., & Picaud, S. 2006, A&A, 453, 635
- Mukai & Ishida (2001) Mukai, K., & Ishida, M. 2001, ApJ, 551, 1024
- Munari et al. (2012) Munari, U., Dallaporta, S., & Valisa, P. 2012, ATel, 4320, 1
- Munari (2013) Munari, U. 2013, ATel, 4709, 1
- Munari et al. (2013) Munari, U., Dallaporta, S., Castellani, F., et al. 2013, MNRAS, 435, 771
- Neckel (1967) Neckel, Th. 1967, Veroeff. Landessternwarte Heidelberg-Koenigstuhl, 19, 1
- Nelson et al. (2012) Nelson, T., Mukai, K., Sokoloski, J., et al. 2012, ATel, 4590, 1
- Osborne et al. (2013) Osborne, J. P., Beardmore, A., & Page, K. 2013, ATel, 4727, 1
- Özdörmez et al. (2016) Özdörmez, A., Güver, T., Cabrera-Lavers, A., Ak, T. 2016, MNRAS, 461, 1177
- Page et al. (2013) Page, K. L., Osborne, J. P., Wagner, R. M., et al. 2013, ApJ, 768, L26
- Ribeiro et al. (2013) Ribeiro, V. A. R. M., Munari, U., & Valisa, P. 2013, ApJ, 768, 49
- Rieke & Lebofsky (1985) Rieke, G. H., & Lebofsky, M. J. 1985, ApJ, 288, 618
- Rosino (1975) Rosino, L. 1975, in Variable stars and stellar evolution, (Dordrecht, D. Reidel), 347
- Sala et al. (2008) Sala, G., Hernanz, M., Ferri, C., & Greiner, J. 2008, ApJ, 675, L93
- Sala et al. (2017) Sala, G., Ness, J. U., Hernanz, M., & Greiner, J. 2017, A&A, 601, A93
- Sale et al. (2014) Sale, S. E., Drew, J. E., Barentsen, G., et al. 2014, MNRAS, 443, 2907
- Sato et al. (1973) Sato, S., Maihara, T., & Okuda, H. 1973, PASJ, 25, 571
- Schlafly & Finkbeiner (2011) Schlafly, E. F., & Finkbeiner, D. P. 2011, ApJ, 737, 103
- Schmidt (1957) Schmidt, Th. 1957, Z. Astrophys., 41, 181
- Shara et al. (2017) Shara, M. M., Doyle, T., Lauer, T. R., et al. 2017, ApJ, 839, 109
- Shore et al. (2013) Shore, S. N., De Gennaro Aquino, I., Schwarz, G. J., et al. 2013, A&A, 553, A123
- Slavin et al. (1995) Slavin, A. J., O’Brien, T. J., & Dunlop, J. S. 1995, MNRAS, 276, 353
- Tarasova (2014) Tarasova, T. N. 2014, Astronomy Letters, 40, 309
- Tempesti (1972) Tempesti, P. 1972, A&A, 20, 63
- Thomas et al. (1973) Thomas, J. C., Cowley, A. P., MacConnell, D. J., & Toney, J. 1973, PASP, 85, 309
- Umeda et al. (1999) Umeda, H., Nomoto, K., Yamaoka, H., & Wanajo, S. 1999, ApJ, 513, 861
- van den Bergh & Younger (1987) van den Bergh, S., & Younger, P. F. 1987, A&AS, 70, 125
- Walter et al. (2012) Walter, F. M., Battisti, A., Towers, S. E., Bond, H. E., & Stringfellow, G. S. 2012, PASP, 124, 1057
- Warner (1995) Warner, B. 1995, Cataclysmic variable stars, Cambridge, Cambridge University Press
- Weidemann (2000) Weidemann, V. 2000, A&A, 363, 647
- Woodward et al. (1997) Woodward, C. E., Gehrz, R. D., Jones, T. J., Lawrence, G. F., & Skrutskie, M. F. 1997, ApJ, 477, 817