Spitzer Light Curves of the Young, Planetary-Mass TW Hya Members 2MASS J111932541137466AB and WISEA J114724.10204021.3
Abstract
We present Spitzer Space Telescope time-series photometry at 3.6 and 4.5 m of 2MASS J111932541137466AB and WISEA J114724.10204021.3, two planetary-mass, late-type (L7) brown dwarf members of the 10 Myr old TW Hya Association. These observations were taken in order to investigate whether or not a tentative trend of increasing variability amplitude with decreasing surface gravity seen for L3-L5.5 dwarfs extends to later-L spectral types and to explore the angular momentum evolution of low-mass objects. We examine each light curve for variability and find a rotation period of 19.39 hours and semi-amplitudes of 0.798% at 3.6 m and 1.108% at 4.5 m for WISEA J114724.10204021.3. For 2MASS J111932541137466AB, we find a single period of 3.02 hours with semi-amplitudes of 0.230% at 3.6 m and 0.453 0.037% at 4.5 m, which we find is possibly due to the rotation of one component of the binary. Combining our results with 12 other late-type L dwarfs observed with Spitzer from the literature, we find no significant differences between the 3.6 m amplitudes of low surface gravity and field gravity late-type L brown dwarfs at Spitzer wavelengths, and find tentative evidence (75% confidence) of higher amplitude variability at 4.5 m for young, late-type Ls. We also find a median rotation period of young brown dwarfs (10–300 Myr) of 10 hr, more than twice the value of the median rotation period of field age brown dwarfs (4 hr), a clear signature of brown dwarf rotational evolution.
1 Introduction
Several large-scale surveys have found that infrared variability is common in L, T, and Y-type brown dwarfs as evinced by ground-based (Radigan et al. 2014, Wilson et al. 2014) and space-based Spitzer and HST surveys (Buenzli et al. 2014, Metchev et al. 2015, Cushing et al. 2016). Such variability is typically attributed to the rotational modulation of inhomogeneous cloud cover. In the standard paradigm, the L to T transition is believed to arise from a rapid loss of the liquid iron and silicate clouds over a narrow range in effective temperature by some unknown mechanism. This loss could produce patchy surface coverage, which would result in photometric and spectroscopic variability (Ackerman & Marley 2001, Burgasser et al. 2002). Radigan et al. (2014) found that while variability can occur for a wide range of spectral types, high-amplitude variation (2%) is preferentially found at the L/T transition, evidence that supports this prediction. An alternative explanation, presented in Tremblin et al. (2016), shows that a temperature gradient reduction caused by fingering convection can reproduce the near-infrared colors of brown dwarfs across the L-T transition without the need for clouds, though Leconte (2018) argue that this mechanism cannot account for features across the L-T transition. Analyses of brown dwarf light curves have allowed for sophisticated modeling of brown dwarf surface features (e.g., Karalidi et al. 2015) and the identification of zonal bands with varying wind speeds (Apai et al., 2017).
Metchev et al. (2015) used Spitzer to investigate the cloud properties of a sample of 44 brown dwarfs with spectral types between L3 and T8 through a careful analysis of their [3.6] and [4.5] light curves. One intriguing finding from that study was the tendency of low surface gravity brown dwarfs with spectral types between L3 and L5.5 to have higher amplitude variability compared to counterparts with normal surfaces gravity (i.e., field ages) in the same spectral type bin. The three objects with the highest [3.6] amplitudes in this spectral type range all showed signatures of low surface gravity. Even when considering the variability amplitude upper limits of low surface gravity brown dwarfs for which no variability was detected, Metchev et al. (2015) found that the correlation between low surface gravity and enhanced variability amplitudes was significant at the 92% level, possibly indicating a link between low surface gravity and cloud structure/distribution. Whether or not this trend extends to other spectral types is yet unknown.
2MASS J111932541137466AB (hereafter 2MASS 11191137AB) was found in a targeted search for L and T dwarfs with unusually red colors, which are often a sign of youth for brown dwarfs (see e.g., Kirkpatrick et al. 2008, Faherty et al. 2013), using SDSS, 2MASS, and WISE (Kellogg et al., 2015). This object was subsequently found to be an approximately equal magnitude binary with a separation of 014 (3.6 0.9 AU) (Best et al., 2017). WISEA J114724.10204021.3 (hereafter WISEA 11472040) was found as part of a larger program focused on finding young, late-type L dwarfs based on their 2MASS and AllWISE colors (Schneider et al. 2016, Schneider et al. 2017). Both of these objects were found to have spectral types of L7, spectra with clear signs of low surface gravity (i.e., young ages), and kinematic properties consistent with membership in the TW Hya association (Kellogg et al. 2015, Kellogg et al. 2016, Schneider et al. 2016, Gagné et al. 2017a). Membership is further supported by their sky positions relative to other TW Hya association members (Schneider et al., 2016). The young (10 3 Myr – Bell et al. 2015) TW Hya association is one of the nearest regions of recent star formation. Its proximity (30-80 pc) and young age make it an excellent testbed for studying early phases of stellar and substellar evolution. Thus 2MASS 11191137AB and WISEA 11472040 provide vital anchor points for low-mass evolutionary models and unique testbeds for investigating the atmospheres of planetary-mass objects.
Faherty et al. (2016) estimated the mass of WISEA 11472040 to be 6 , while Best et al. (2017) finds the masses of each component of 2MASS 11191137AB to be 4 . These estimates make WISEA 11472040 and 2MASS 11191137AB the lowest mass free floating confirmed members of the TW Hya association and two of the lowest mass brown dwarfs in the Solar neighborhood. Only the planetary mass companion 2M1207b (5 ; Chauvin et al. 2004, Chauvin et al. 2005) and the exoplanets 51 Eri b (2 ; Macintosh et al. 2015) and HR 8799 b (5 ; Marois et al. 2008, Marois et al. 2010), and possibly the extremely cold (250 K), nearby (2 pc) brown dwarf WISE 08550714 (1.5–8 ; Leggett et al. 2017) have been imaged directly and have comparable masses. As such, 2MASS 11191137AB and WISEA 11472040 provide exceptional laboratories for investigating the chemistry and cloud structure in a mass and surface gravity regime not yet probed. We have monitored 2MASS 11191137AB and WISEA 11472040 with the Spitzer Space Telescope to measure variability and to attempt to determine whether or not the trend of large amplitude variability with low surface gravity extends to later-L spectral types.
2 Observations of 2MASS 11191137AB and WISEA 11472040
We used the Infrared Array Camera (IRAC; Fazio et al. 2004) aboard the Spitzer Space Telescope to monitor 2MASS 11191137AB and WISEA 11472040. 2MASS 11191137AB was observed on 2017 April 24 and WISEA 11472040 was observed on 2017 April 17 (PID: 13018). Both targets were observed for a total of 20 continuous hours; 10 hours with the 3.6 m filter and 10 with the 4.5 m filter (hereafter [3.6] and [4.5]) with 12 second exposures. Following the outlined procedures for obtaining high-precision photometry from the Spitzer Science Center111https://irachpp.spitzer.caltech.edu, science exposures were preceded by a 30 minute dither sequence to account for initial slew settling and were also followed by a 10 minute dither sequence. Science exposures were taken with the target located on the “sweet spot” of the detector, a region used to minimize correlated noise. Limiting our AOR lengths to 10 hours ensures that any Spitzer pointing system drift, which is typically 035/day (Grillmair et al., 2012, 2014), does not shift our targets away from the well-characterized detector sweet spot.
We use the photutils package (Bradley et al., 2016) for centroiding and aperture photometry. Each image is cropped to a pixel region around the sweet spot and a 2D Gaussian is fit to find the centroid. We then extract photometry for each pixel in the pixel region around the centroid. Background levels were found using the method described by Knutson et al. (2011). We adapt the pixel-level decorrelation (PLD) method used by Benneke et al. (2017) and originally developed by Deming et al. (2015) to account for intrapixel sensitivity variations in the Spitzer/IRAC photometry. The instrument sensitivity can be modeled with 25 time-independent pixel weights using
| (1) |
where are the number of electrons in each pixel at time , and is a linear slope. We then fit the raw Spitzer photometry using the log-likelihood function
| (2) |
where is the photometric scatter fit simultaneously with the instrument systematic model. This differs from Benneke et al. (2017) Equation 2 in that we do not include an astrophysical model. Since the shape of the astrophysical signal is not known beforehand, we do not want to introduce a spurious signal. Therefore, we fit the astrophysical model separately as described in the following section. We use the emcee package (Foreman-Mackey et al., 2013), which applies the affine-invariant ensemble sampler of Goodman & Weare (2010) to implement a Markov Chain Monte Carlo (MCMC) approach to find posterior distributions using the likelihood function above. For each fit we use 100 walkers with 30,000 steps, where the first 10,000 steps are burn-in. We apply the pixel weights to the input photometry to yield a corrected flux used in the analysis below.
3 Analysis
We analyzed the [3.6] and [4.5] observations for 2MASS 11191137AB and WISEA 11472040 with a probabilistic model defined as:
| (3) |
where is the number of electrons detected at time , is an additive constant to account for any shift in the Y direction, is the amplitude, is the period, is the phase, and is the measurement error. We again used the emcee package to fit each set of data and find posterior distributions for each of the above model parameters. We run 1000 walkers with 1000 steps for each fit, where the first 300 steps are treated as a burn-in sample.
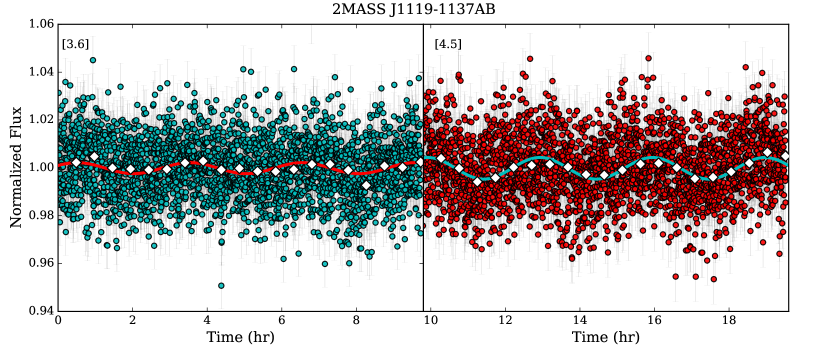
For 2MASS 11191137AB, we provide the priors used and all determined parameters from the resulting fits in Table 1 and show the fits to the data in Figure 1. Considering that the components of 2MASS 11191137AB are roughly equal mass and unresolved in our Spitzer images, it is impossible to determine how much each member of this binary is responsible for the observed variability. We checked for variability in the residuals of both the [3.6] and [4.5] data accounting for the measured periods and amplitudes in Table 1, and found no additional variations. We also attempted a two-component fit and were unable to identify a second rotation period. Best et al. (2017) estimate an orbital period for 2MASS 11191137AB of 90 yr, so tidal-locking is unlikely. It is possible that the variability we see originates from a single component as has been seen for the L7.5+T0.5 binary Luhman16AB (Burgasser et al., 2014). However, without resolved images, it is not possible to determine the degree to which the second component has affected the rotational parameters we have measured from this pair’s combined light curve. For this reason, we exclude the rotational parameters found for 2MASS 11191137AB from the analysis presented in Section 4.
| 2MASS 11191137AB | WISEA 11472040 | |||||
|---|---|---|---|---|---|---|
| Model Parameter | Prior | [3.6] | [4.5] | [3.6] | [4.5] | [3.6]+[4.5]bbWhile the purpose of the [3.6]+[4.5] fit was solely to determine the rotation period of WISEA 11472040, we include the results for the other parameters for completeness. |
| Y-Shift | (0.9,1.1) | 0.9999 0.0003 | 0.9998 0.0003 | 1.0051 0.0006 | 0.9930 0.0007 | 1.000 0.0002 |
| Amplitude (%) | (0,10) | 0.230 | 0.453 0.037 | 0.798 | 1.108 | 0.853 0.029 |
| Period (hours) | (2,25) | 3.02 | 3.02 | 19.39aaThe period of WISEA 11472040 was fixed to this value for the [3.6] and [4.5] fits. | 19.39aaThe period of WISEA 11472040 was fixed to this value for the [3.6] and [4.5] fits. | 19.39 |
| Phase (degrees) | (0,360) | 29 | 101 8 | 182 | 359 | 180 |
| Standard deviation | (0,0.5) | 0.0129 0.0002 | 0.0131 0.0002 | 0.0133 0.0002 | 0.0150 0.0002 | 0.0142 0.0001 |
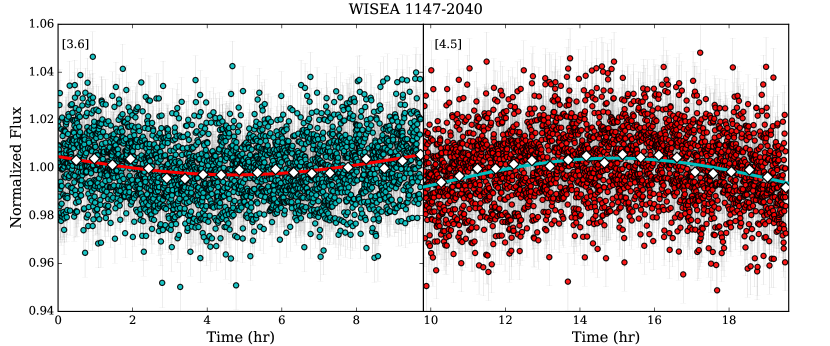
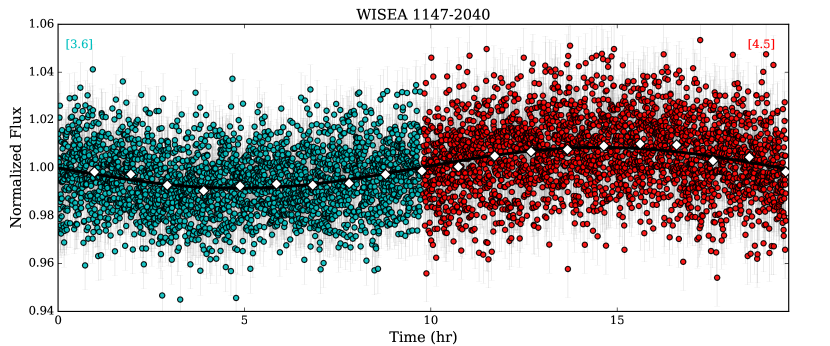
The measured periods for the [3.6] and [4.5] observations of WISEA 11472040 are longer than the total duration of the observations for each filter (10 hours) and the resulting posterior distributions are non-Gaussian with large uncertainties; 12.99 for [3.6] and 15.50 for [4.5]. To determine a more accurate rotation period for WISEA 11472040, we fit the [3.6] and [4.5] observation simultaneously. Note that for all objects with regular periods in their study, Metchev et al. (2015) found no evidence of phase shifts between [3.6] and [4.5] observations. We scale the [3.6] and [4.5] observations by setting the median value of a set of the final [3.6] observations to equal the median value of a set of the first [4.5] observations. We find a rotation period of 19.39 from the [3.6]+[4.5] fit. This period did not vary when the number of observations used to scale the [3.6] and [4.5] observations was between 50 and 500. To determine the variability amplitudes in the [3.6] and [4.5] wavelength regions, we then fix the period of WISEA 11472040 to the period determined from the [3.6]+[4.5] fit and rerun the emcee fitting procedure outlined above. The results of the fits to the [3.6] and [4.5] data are provided in Table 1. The individual fits to the [3.6] and [4.5] data with a fixed period of 19.39 are shown in Figure 2, and the [3.6]+[4.5] fit is shown in Figure 3.
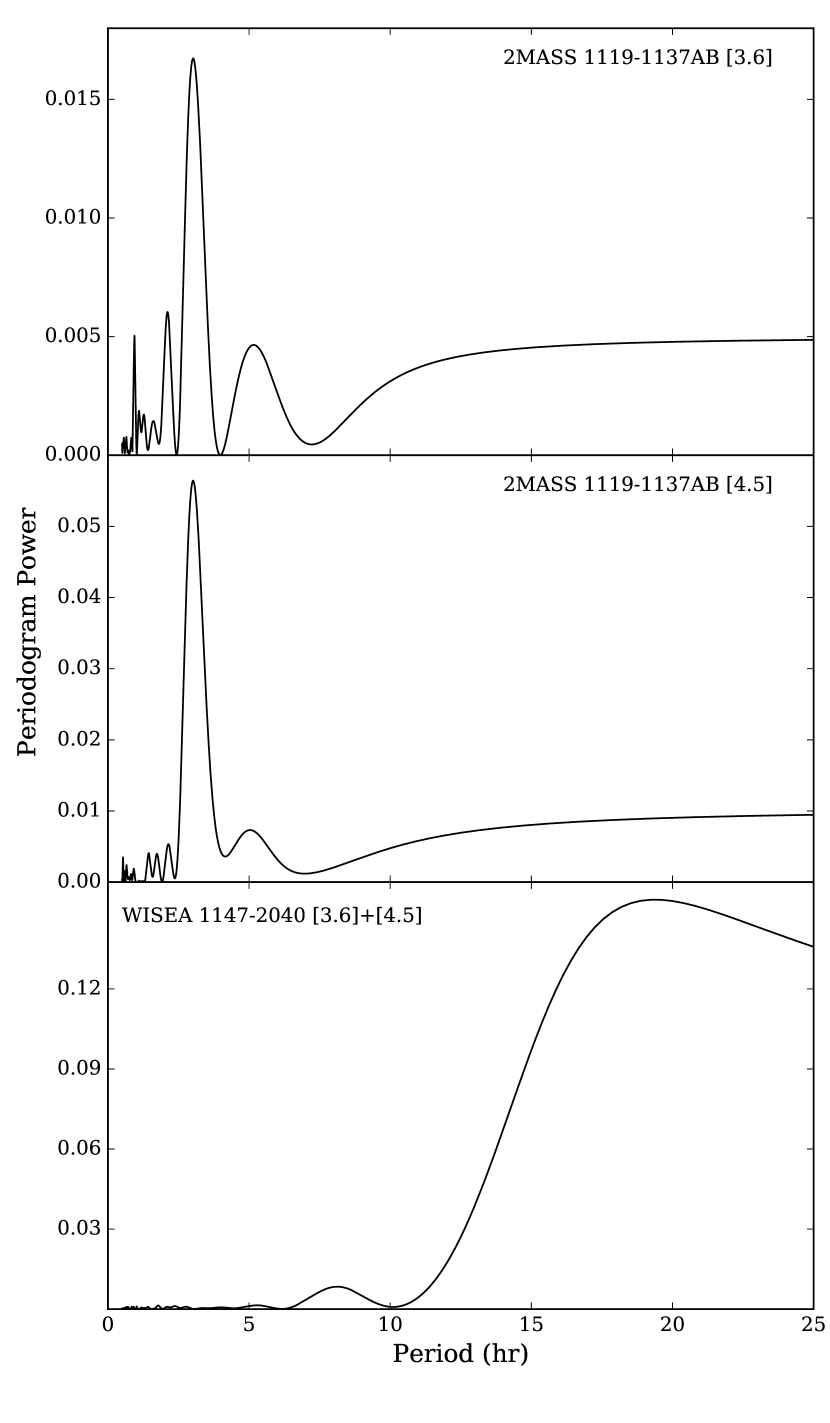
While the emcee analyses above are ideal for determining accurate rotational parameters and their uncertainties, the Lomb-Scargle periodogram (Lomb 1976, Scargle 1982) has proven to be a powerful tool for evaluating the significance of rotation periods found in light curves as encapsulated in the false alarm probability (FAP). We perform a period search by computing the Lomb-Scargle periodogram for the 2MASS 11191137AB [3.6] and [4.5] light curves and find peak powers at 3.02 hours for both datasets. For the WISEA 11472040 [3.6]+[4.5] combined light curve we find a peak power at 19.23 hours, consistent with our emcee fit above. The periodogram power distributions are shown in Figure 4. To calculate FAPs, we adopt the method of Herbst et al. (2002), whereby we generate 1000 artificial light curves from our data by keeping the dates the same but randomizing the measured flux values. The tenth highest peak periodogram power from these 1000 artificial curves then defines the 1% FAP, as only 1% of artificial light curves would have peak powers greater than that value. We find that no peak power of an artificial light curve approaches the peak value found for our actual light curves, which we find to be 2.5, 8.3, and 44.1 times the 1% FAP for the 2MASS 11191137AB [3.6], 2MASS 11191137AB [4.5], and WISEA 11472040 [3.6]+[4.5] combined light curves, respectively. Thus, we are confident that the rotation periods presented in Table 1 are significant.
4 Discussion
4.1 Variability amplitudes for L6-L9 brown dwarfs and surface gravity
To investigate whether or not the trend of higher amplitude variability with low surface gravity seen for L3-L5.5 dwarfs in Metchev et al. (2015) continues to later L spectral types (L6-L9), we compared our light curve analysis of WISEA 11472040 with published Spitzer light curves of other low surface gravity late-type Ls; PSO J318.533822.8603 (Biller et al., 2018), a member of the 233 Myr Pic association (Liu et al. 2013, Allers et al. 2016) and WISE J004701.06680352.1 and 2MASS J224431672043433 (Vos et al., 2018), members of the 150 Myr old AB Dor moving group (Gagné et al. 2014, Gizis et al. 2015). We also use the sample of late-type Ls from Metchev et al. (2015), which includes one low surface gravity object, 2MASSI J0103320193536 (Allers & Liu 2013, Martin et al. 2017), and eight late-type Ls with field gravities (ages). Table 2 lists all late-type Ls with Spitzer light curves. Note that peak-to-peak amplitudes have been converted to semi-amplitudes.
One object, 2MASS J214816284003593, has unusually red near-infrared colors compared to other brown dwarfs with similar spectral types. Looper et al. (2008) speculate that this is due to thick dust clouds in 2MASS J214816284003593’s atmosphere and find no clear evidence of youth for this object. Allers & Liu (2013) designate this object as a field gravity (FLD-G) source based on gravity-sensitive spectroscopic indices, though they do note that its H-band shape resembles that of low surface gravity Ls. Martin et al. (2017) used medium-resolution J-band spectra to measure surface gravity sensitive indices for a large sample of M, L, and T dwarfs and designate 2MASS J214816284003593 as having an intermediate surface gravity (INT-G). Because of the unusual cloud properties of 2MASS J214816284003593 and its uncertain surface gravity classification, we exclude it from further analysis.
| Name | Discovery | SpectralaaTypical spectral type uncertainties are 0.5 subtypes. | Period | A[3.6] | A[4.5] | Low | Variability |
|---|---|---|---|---|---|---|---|
| Ref. | Type | (hours) | (%) | (%) | Gravity? | Ref. | |
| WISE J004701.06680352.1 | 1 | L7 | 16.4 0.2 | 0.54 0.02 | … | Y | 15 |
| 2MASSI J0103320193536 | 2 | L6 | 2.7 0.1 | 0.28 0.02 | 0.44 0.05 | Y | 16 |
| SDSSp J010752.33004156.1 | 3 | L8 | 5.0bbIrregular variability or long period. | 0.64 0.07 | 0.5 0.1 | N | 16 |
| 2MASSI J0825196211552 | 2 | L7.5 | 7.6bbIrregular variability or long period. | 0.41 0.04 | 0.7 0.2 | N | 16 |
| SDSS J104335.08121314.1 | 4 | L9 | 3.8 0.2bbIrregular variability or long period. | 0.77 0.08 | 0.6 0.1 | N | 16 |
| 2MASS J111932541137466ABcc2MASS 11191137AB is included in this table for completeness, but not used in any of our analyses because of the unquantified effects of binarity on our determined rotational parameters. | 5 | L7 | 3.02 | 0.230 | 0.453 0.037 | Y | 17 |
| WISEA J114724.10204021.3 | 6 | L7 | 19.39 | 0.798 | 1.108 | Y | 17 |
| SDSS J141624.08134826.7 | 7,8,9,10 | L6+T7.5 | … | 0.08 | 0.11 | N | 16 |
| SDSS J154508.93355527.3 | 4 | L7.5 | … | 0.30 | 0.58 | N | 16 |
| 2MASSW J1632291190441 | 11 | L8 | 3.9 0.2 | 0.21 0.04 | 0.3 0.2 | N | 16 |
| SDSS J204317.69155103.4 | 4 | L9 | … | 0.36 | 0.37 | N | 16 |
| PSO J318.533822.8603 | 12 | L7 | 8.6 0.1 | … | 1.7 0.05 | Y | 18 |
| 2MASS J214816284003593 | 13 | L6 | 19 4 | 0.67 0.04 | 0.52 0.05 | N?dd2MASS J214816284003593 is thought to have an exceptionally cloudy atmosphere (Looper et al., 2008), and its gravity classification is unclear, with a FLD-G gravity classification in Allers & Liu (2013) and an INT-G gravity classification in Martin et al. (2017). | 16 |
| 2MASS J224431672043433 | 14 | L6 | 11.0 2.0 | 0.4 0.1 | … | Y | 15 |
References. — (1) Gizis et al. (2012), (2) Kirkpatrick et al. (2000), (3) Geballe et al. (2002), (4) Chiu et al. (2006), (5) Kellogg et al. (2015), (6) Schneider et al. (2016), (7) Burningham et al. (2010), (8) Scholz (2010), (9) Bowler et al. (2010), (10) Schmidt et al. (2010), (11) Kirkpatrick et al. (1999), (12) Liu et al. (2013), (13) Looper et al. (2008), (14) Dahn et al. (2002), (15) Vos et al. (2018), (16) Metchev et al. (2015), (17) This work, (18) Biller et al. (2018)
We note that low surface gravity (young) and field age late-type L brown dwarfs have different masses. Filippazzo et al. (2015) find a mass range for L6-L9 objects of 40-60 , while low-gravity late-type Ls have estimated masses of 5-15 (Filippazzo et al. 2015, Faherty et al. 2016). However, the effective temperatures () of low surface gravity and field gravity late-type Ls are found to be similar. Filippazzo et al. (2015) determined semi-empirical estimates by combining spectral energy distributions made with optical and infrared spectra and photometry with parallaxes and radius estimates from evolutionary models. For field-age late-type Ls in their sample, they find a range of 1139-1518 K, while the four low surface gravity late-type Ls they studied have estimated values between 1200 and 1250 K. Thus a comparison of these samples provides information about how cloud properties do or do not change for brown dwarfs with similar effective temperatures and different surface gravities.
One additional consideration when discussion variability amplitudes is inclination angle, as brown dwarfs inclined such that we view them pole-on (=0) would not show variations due to rotation. Vos et al. (2017) investigated the relationship between inclination angle and variability amplitude for a sample of 19 brown dwarfs with measured variability and found a clear trend of increasing of -band variability amplitudes with larger inclination angles. For Spitzer wavelengths, however, the differences between variability amplitudes of objects viewed close to equator-on (90) was marginal compared to objects with inclinations as low as 20. That the -band amplitudes are more affected by inclination than the Spitzer amplitudes is explained by the depths probed at these different wavelengths. -band observations probe deeper into brown dwarfs atmospheres and are therefore subject to an increased path-length through a brown dwarfs atmosphere at low inclination angles, while Spitzer wavelengths mostly probe the top of the photosphere. In the following analysis, we ignore any effects due to inclination angle.
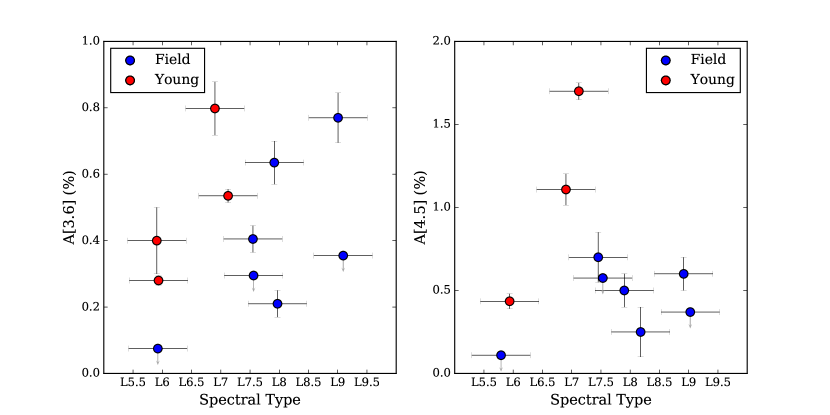
Figure 5 shows a comparison of the [3.6] and [4.5] semi-amplitudes of the low surface gravity and field-age sample of late-type L dwarfs provided in Table 2. To determine the probability that the semi-amplitudes of the young and field-age samples were drawn from the same parent sample, we first employ a Kaplan-Meier estimator (Kaplan & Meier, 1958) using the lifelines Python package (Davidson-Pilon, 2016). The Kaplan-Meier estimator constructs cumulative distribution functions for each sample accounting for censored data (i.e., upper limits). We use a log-rank parametric test to evaluate the null hypothesis that these cumulative distributions have the same parent distribution. We find -values, which give the probability that these populations are not drawn from a single distribution, of 0.953 for the [3.6] sample and 0.241 for the [4.5] sample, where values 0.05 are typically interpreted as indicating two statistically distinct samples. The -value for the [3.6] data indicates no statistically significant difference between the two populations, which is clearly seen in Figure 5. While the -value for the [4.5] samples does not meet typical significance thresholds, it does suggest that there is a 75 percent chance that the differences between the two populations are not due to random chance. We caution that the number of young objects used for the [4.5] comparison is small (3) and this result should be treated as preliminary until more data is available. It is intriguing, however, that the two largest [4.5] amplitudes of the entire late-type L sample belong to WISEA 11472040 and PSO J318.533822.8603, both young objects. The small sample size limits the significance and hence an expanded sample of mid-infrared variability amplitudes for late-type L young brown dwarfs would help to further explore this result.
4.2 Brown dwarf rotational evolution
While the rotation of very young low-mass stars is regulated by interaction with their disks through a magnetic wind, rotational braking is thought to be extremely inefficient in the substellar regime (Bouvier et al., 2014). However, substellar objects with ages between that of star forming regions and the field have not been well explored. While a detailed investigation of brown dwarf rotational evolution will require a larger sample of substellar objects at a variety of ages and masses, patterns are already beginning to emerge. The rotation periods of brown dwarfs in the Upper Scorpius association (age = 5-10 Myr; Herczeg & Hillenbrand 2015, Pecaut & Mamajek 2016) measured by Scholz et al. (2015) using K2 span a large range (5-40 hr), with a median of 1 day, while even younger brown dwarfs typically have rotation periods of several days (e.g., Joergens et al. 2003, Scholz & Eislöffel 2004, Rodríguez-Ledesma et al. 2009, Cody & Hillenbrand 2010). These values can be compared to those found for field age and young (10-300 Myr) brown dwarf samples for evidence of rotational evolution.
To investigate the rotation periods of field age brown dwarfs, we combine the rotation periods from Metchev et al. (2015) with the compilations of rotation periods in Crossfield (2014) and Vos et al. (2017), the rotation period of Luhman 16A (4.5-5.5 hr; Buenzli et al. 2015) and Luhman 16B (5.05 0.10 hr; Burgasser et al. 2014, 4.87 0.01 hr; Gillon et al. 2013) and the two known rotation periods for the Y-type brown dwarfs WISE J140518.39553421.3 (8.54 0.08 hr; Cushing et al. 2016) and WISEP J173835.52273258.9 (6.0 0.1 hr; Leggett et al. 2016). To ensure we do not include low-mass stellar sources in this comparison, we limit our field age sample to those objects with spectral types later than L2 (Dieterich et al. 2014, Dupuy & Liu 2017). We find that the rotation periods of the 26 brown dwarfs without any signs of low surface gravity range from 1.4 to 11 hours, where 24 of these 26 dwarfs have rotation periods less than 8 hours (92%), with a median rotation period of 4.05 hours. For younger, low surface gravity brown dwarfs, we consider the low-gravity L dwarfs in Table 2, SIMP J013656.5093347 (2.425 0.003; Gagné et al. 2017b), recently designated as a member of the 200 Myr old Carina-Near moving group (Gagné et al., 2017b), four additional low surface gravity brown dwarfs from Metchev et al. (2015) (including 2MASS J132435536358281, Gagné et al. 2018), and LP261-75B (4.78 0.95 hr; Manjavacas et al. 2018). We also include in this sample the directly imaged planetary mass companions Pictoris b (8.1 1.0; Snellen et al. 2014, spectral type = L2 1; Chilcote et al. 2017) and 2M1207b (10.7 hr; Zhou et al. 2016, spectral type = mid-L; Patience et al. 2010). With a range of rotation periods from 2.4 to 24 hours, we find that only 5 of 14 members of this sample have rotation periods less than 8 hr (35%), with a median rotation period of 9.66 hours. Thus, brown dwarf rotation periods generally decrease with age, likely because they are spinning up as they contract to their final radii in much the same way young stars do in order to conserve angular momentum.
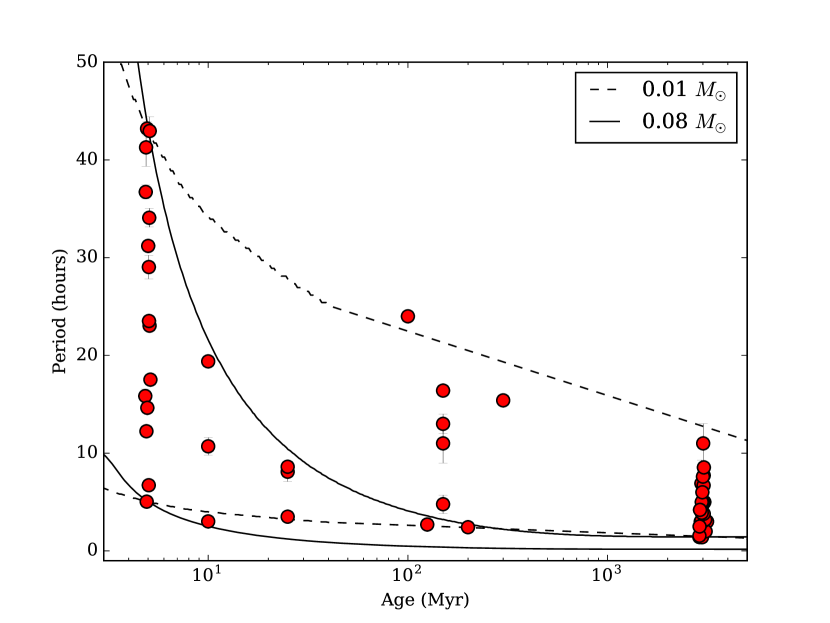
To determine whether or not the population of brown dwarfs with known rotation periods is consistent with gravitational contraction, we construct a simple model evolutionary track where angular momentum is conserved as a brown dwarf’s radius gets smaller with age. As a starting point, we use the evolutionary models of Baraffe et al. (2015) to estimate the radii of a brown dwarfs in Upper Scorpius (5 Myr) with masses of 0.01 and 0.08 and use the maximum and minimum measured periods for this age group. Assuming angular momentum is conserved, we then calculate rotation periods using theoretical radii from Baraffe et al. (2015) for the ages probed in our study. Figure 6 shows a comparison of all brown dwarf periods for ages 5 Myr compared to predictions from our simple angular momentum conservation model. The only brown dwarf that falls outside the range of predicted rotation periods from our model is the young, L4 dwarf 2MASS J161542554953211, which has a highly uncertain period (see Metchev et al. 2015). Otherwise, our model shows general agreement with measured brown dwarf rotation periods, though brown dwarfs with intermediate ages (10-1000 Myr) have not been thoroughly explored. A larger sample of brown dwarf rotation periods at various ages would help to create a more detailed picture or brown dwarf rotational evolution.
5 Conclusion
We have investigated the photometric variability of the planetary-mass, TW Hya members 2MASS 11191137AB and WISEA 11472040 using Spitzer. We find a rotation period for WISEA 11472040 of 19.39 hours, and find a period of 3.02 hours for 2MASS 11191137AB, which is possibly due to one the rotation of one component of this binary. We find that WISEA 11472040 fits into a general trend of longer rotation periods at for brown dwarfs at young ages. For all other brown dwarfs with measured rotation periods, we find general agreement between measured values and a simple model where brown dwarfs have spun up to conserve angular momentum as they contract with age.
We have also compared the [3.6] and [4.5] variability amplitudes of young L6-L9 brown dwarfs to field-age brown dwarfs with similar spectral types. While we find no significant correlation between the amplitude of variability and age as previously seen for L3-L5.5 dwarfs in Metchev et al. (2015) at [3.6], we find that young, late-type L dwarfs tend to have higher [4.5] amplitudes than field-age late-type Ls, though with limited confidence (75%). We caution that the sample size used for this comparison is small, and an expanded sample of brown dwarf light curves at different ages would aid in confirming the robustness of this result.
References
- Ackerman & Marley (2001) Ackerman, A. S., & Marley, M. S. 2001, ApJ, 556, 872
- Allers & Liu (2013) Allers, K. N., & Liu, M. C. 2013, ApJ, 772, 79
- Allers et al. (2016) Allers, K. N., Gallimore, J. F., Liu, M. C., & Dupuy, T. J. 2016, ApJ, 819, 133
- Apai et al. (2017) Apai, D., Karalidi, T., Marley, M. S., et al. 2017, Science, 357, 683
- Baraffe et al. (2015) Baraffe, I., Homeier, D., Allard, F., & Chabrier, G. 2015, A&A, 577, A42
- Bell et al. (2015) Bell, C. P. M., Mamajek, E. E., & Naylor, T. 2015, MNRAS, 454, 593
- Benneke et al. (2017) Benneke, B., Werner, M., Petigura, E., et al. 2017, ApJ, 834, 187
- Best et al. (2017) Best, W. M. J., Liu, M. C., Dupuy, T. J., & Magnier, E. A. 2017, ApJ, 843, L4
- Biller et al. (2018) Biller, B. A., Vos, J., Buenzli, E., et al. 2018, AJ, 155, 95
- Bouvier et al. (2014) Bouvier, J., Matt, S. P., Mohanty, S., et al. 2014, Protostars and Planets VI, 433
- Bowler et al. (2010) Bowler, B. P., Liu, M. C., & Dupuy, T. J. 2010, ApJ, 710, 45
- Bradley et al. (2016) Bradley, L., Sipocz, B., Robitaille, T., et al. 2016, Astrophysics Source Code Library, ascl:1609.011
- Buenzli et al. (2014) Buenzli, E., Apai, D., Radigan, J., Reid, I. N., & Flateau, D. 2014, ApJ, 782, 77
- Buenzli et al. (2015) Buenzli, E., Marley, M. S., Apai, D., et al. 2015, ApJ, 812, 163
- Burgasser et al. (2002) Burgasser, A. J., Marley, M. S., Ackerman, A. S., et al. 2002, ApJ, 571, L151
- Burgasser et al. (2014) Burgasser, A. J., Gillon, M., Faherty, J. K., et al. 2014, ApJ, 785, 48
- Burningham et al. (2010) Burningham, B., Leggett, S. K., Lucas, P. W., et al. 2010, MNRAS, 404, 1952
- Chauvin et al. (2004) Chauvin, G., Lagrange, A.-M., Dumas, C., et al. 2004, A&A, 425, L29
- Chauvin et al. (2005) Chauvin, G., Lagrange, A.-M., Dumas, C., et al. 2005, A&A, 438, L25
- Chilcote et al. (2017) Chilcote, J., Pueyo, L., De Rosa, R. J., et al. 2017, AJ, 153, 182
- Chiu et al. (2006) Chiu, K., Fan, X., Leggett, S. K., et al. 2006, AJ, 131, 2722
- Cody & Hillenbrand (2010) Cody, A. M., & Hillenbrand, L. A. 2010, ApJS, 191, 389
- Crossfield (2014) Crossfield, I. J. M. 2014, A&A, 566, A130
- Cushing et al. (2016) Cushing, M. C., Hardegree-Ullman, K. K., Trucks, J. L., et al. 2016, ApJ, 823, 152
- Dahn et al. (2002) Dahn, C. C., Harris, H. C., Vrba, F. J., et al. 2002, AJ, 124, 1170
- Davidson-Pilon (2016) Davidson-Pilon, C. 2016, Lifelines, https://github.com/camdavdisonpilon/lifelines
- Deming et al. (2015) Deming, D., Knutson, H., Kammer, J., et al. 2015, ApJ, 805, 132
- Dieterich et al. (2014) Dieterich, S. B., Henry, T. J., Jao, W.-C., et al. 2014, AJ, 147, 94
- Dupuy & Liu (2017) Dupuy, T. J., & Liu, M. C. 2017, ApJS, 231, 15
- Faherty et al. (2013) Faherty, J. K., Rice, E. L., Cruz, K. L., Mamajek, E. E., & Núñez, A. 2013, AJ, 145, 2
- Faherty et al. (2016) Faherty, J. K., Riedel, A. R., Cruz, K. L., et al. 2016, ApJS, 225, 10
- Fazio et al. (2004) Fazio, G. G., Hora, J. L., Allen, L. E., et al. 2004, ApJS, 154, 10
- Filippazzo et al. (2015) Filippazzo, J. C., Rice, E. L., Faherty, J., et al. 2015, ApJ, 810, 158
- Foreman-Mackey et al. (2013) Foreman-Mackey, D., Hogg, D. W., Lang, D., & Goodman, J. 2013, PASP, 125, 306
- Gagné et al. (2014) Gagné, J., Lafrenière, D., Doyon, R., Malo, L., & Artigau, É. 2014, ApJ, 783, 121
- Gagné et al. (2017a) Gagné, J., Faherty, J. K., Mamajek, E. E., et al. 2017a, ApJS, 228, 18
- Gagné et al. (2017b) Gagné, J., Faherty, J. K., Burgasser, A. J., et al. 2017b, ApJ, 841, L1
- Gagné et al. (2018) Gagné, J., Allers, K. N., Theissen, C. A., et al. 2018, arXiv:1802.00493
- Geballe et al. (2002) Geballe, T. R., Knapp, G. R., Leggett, S. K., et al. 2002, ApJ, 564, 466
- Gillon et al. (2013) Gillon, M., Triaud, A. H. M. J., Jehin, E., et al. 2013, A&A, 555, L5
- Gizis et al. (2012) Gizis, J. E., Faherty, J. K., Liu, M. C., et al. 2012, AJ, 144, 94
- Gizis et al. (2015) Gizis, J. E., Allers, K. N., Liu, M. C., et al. 2015, ApJ, 799, 203
- Goodman & Weare (2010) Goodman, J., & Weare, J. 2010, Communications in Applied Mathematics and Computational Science, 5, 65
- Grillmair et al. (2012) Grillmair, C. J., Carey, S. J., Stauffer, J. R., et al. 2012, Proc. SPIE, 8448, 84481I
- Grillmair et al. (2014) Grillmair, C. J., Carey, S. J., Stauffer, J. R., & Ingalls, J. G. 2014, Proc. SPIE, 9143, 914359
- Herbst et al. (2002) Herbst, W., Bailer-Jones, C. A. L., Mundt, R., Meisenheimer, K., & Wackermann, R. 2002, A&A, 396, 513
- Herczeg & Hillenbrand (2015) Herczeg, G. J., & Hillenbrand, L. A. 2015, ApJ, 808, 23
- Joergens et al. (2003) Joergens, V., Fernández, M., Carpenter, J. M., & Neuhäuser, R. 2003, ApJ, 594, 971
- Kaplan & Meier (1958) Kaplan, E. L., & Meier, P. 1958, J. Am. Stat. Assoc., 53, 457
- Karalidi et al. (2015) Karalidi, T., Apai, D., Schneider, G., Hanson, J. R., & Pasachoff, J. M. 2015, ApJ, 814, 65
- Kellogg et al. (2015) Kellogg, K., Metchev, S., Geißler, K., et al. 2015, AJ, 150, 182
- Kellogg et al. (2016) Kellogg, K., Metchev, S., Gagné, J., & Faherty, J. 2016, ApJ, 821, L15
- Kirkpatrick et al. (1999) Kirkpatrick, J. D., Reid, I. N., Liebert, J., et al. 1999, ApJ, 519, 802
- Kirkpatrick et al. (2000) Kirkpatrick, J. D., Reid, I. N., Liebert, J., et al. 2000, AJ, 120, 447
- Kirkpatrick et al. (2008) Kirkpatrick, J. D., Cruz, K. L., Barman, T. S., et al. 2008, ApJ, 689, 1295-1326
- Knutson et al. (2011) Knutson, H. A., Madhusudhan, N., Cowan, N. B., et al. 2011, ApJ, 735, 27
- Leconte (2018) Leconte, J. 2018, ApJ, 853, L30
- Leggett et al. (2016) Leggett, S. K., Cushing, M. C., Hardegree-Ullman, K. K., et al. 2016, ApJ, 830, 141
- Leggett et al. (2017) Leggett, S. K., Tremblin, P., Esplin, T. L., Luhman, K. L., & Morley, C. V. 2017, ApJ, 842, 118
- Liu et al. (2013) Liu, M. C., Magnier, E. A., Deacon, N. R., et al. 2013, ApJ, 777, L20
- Lomb (1976) Lomb, N. R. 1976, Ap&SS, 39, 447
- Looper et al. (2008) Looper, D. L., Kirkpatrick, J. D., Cutri, R. M., et al. 2008, ApJ, 686, 528-541
- Macintosh et al. (2015) Macintosh, B., Graham, J. R., Barman, T., et al. 2015, Science, 350, 64
- Manjavacas et al. (2018) Manjavacas, E., Apai, D., Zhou, Y., et al. 2018, AJ, 155, 11
- Marois et al. (2008) Marois, C., Macintosh, B., Barman, T., et al. 2008, Science, 322, 1348
- Marois et al. (2010) Marois, C., Zuckerman, B., Konopacky, Q. M., Macintosh, B., & Barman, T. 2010, Nature, 468, 1080
- Martin et al. (2017) Martin, E. C., Mace, G. N., McLean, I. S., et al. 2017, ApJ, 838, 73
- Metchev et al. (2015) Metchev, S. A., Heinze, A., Apai, D., et al. 2015, ApJ, 799, 154
- Patience et al. (2010) Patience, J., King, R. R., de Rosa, R. J., & Marois, C. 2010, A&A, 517, A76
- Pecaut & Mamajek (2016) Pecaut, M. J., & Mamajek, E. E. 2016, MNRAS, 461, 794
- Radigan et al. (2014) Radigan, J., Lafrenière, D., Jayawardhana, R., & Artigau, E. 2014, ApJ, 793, 75
- Rodríguez-Ledesma et al. (2009) Rodríguez-Ledesma, M. V., Mundt, R., & Eislöffel, J. 2009, A&A, 502, 883
- Scargle (1982) Scargle, J. D. 1982, ApJ, 263, 835
- Schmidt et al. (2010) Schmidt, S. J., West, A. A., Burgasser, A. J., Bochanski, J. J., & Hawley, S. L. 2010, AJ, 139, 1045
- Schneider et al. (2016) Schneider, A. C., Windsor, J., Cushing, M. C., Kirkpatrick, J. D., & Wright, E. L. 2016, ApJ, 822, L1
- Schneider et al. (2017) Schneider, A. C., Windsor, J., Cushing, M. C., Kirkpatrick, J. D., & Shkolnik, E. L. 2017, AJ, 153, 196
- Scholz & Eislöffel (2004) Scholz, A., & Eislöffel, J. 2004, A&A, 419, 249
- Scholz (2010) Scholz, R.-D. 2010, A&A, 510, L8
- Scholz et al. (2015) Scholz, A., Kostov, V., Jayawardhana, R., & Mužić, K. 2015, ApJ, 809, L29
- Snellen et al. (2014) Snellen, I. A. G., Brandl, B. R., de Kok, R. J., et al. 2014, Nature, 509, 63
- Tremblin et al. (2016) Tremblin, P., Amundsen, D. S., Chabrier, G., et al. 2016, ApJ, 817, L19
- Vos et al. (2017) Vos, J. M., Allers, K. N., & Biller, B. A. 2017, ApJ, 842, 78
- Vos et al. (2018) Vos, J. M., Allers, K. N., Biller, B. A., et al. 2018, MNRAS, 474, 1041
- Wilson et al. (2014) Wilson, P. A., Rajan, A., & Patience, J. 2014, A&A, 566, A111
- Zhou et al. (2016) Zhou, Y., Apai, D., Schneider, G. H., Marley, M. S., & Showman, A. P. 2016, ApJ, 818, 176