A Low Lyman Continuum Escape Fraction of for Extreme [Oiii] Emitters in an Overdensity at z
Abstract
Recent work has suggested extreme [Oiii] emitting star-forming galaxies are important to reionization. Relatedly, [Oiii]/[Oii] has been put forward as an indirect estimator of the Lyman Continuum (LyC) escape fraction () at when the opaque IGM renders LyC photons unobservable. Using deep archival U-band (VLT/VIMOS) imaging of a recently confirmed overdensity at we calculate tight constraints on for a sample (N=73) dominated by extreme [Oiii] emitters. We find no Lyman Continuum signal ( at ) in a deep U-band stack of our sample (31.98 mag at 1). This constraint is in agreement with recent studies of star-forming galaxies spanning that have found very low average . Despite the galaxies in our study having an estimated average rest-frame EW([Oiii]) and [Oiii]/[Oii] from composite SED-fitting, we find no LyC detection, which brings into question the potential of [Oiii]/[Oii] as an effective probe of the LyC–a majority of LyC emitters have [Oiii]/[Oii], but we establish here that [Oiii]/[Oii] does not guarantee significant LyC leakage for a population. Since even extreme star-forming galaxies are unable to produce the required by most theoretical calculations for star-forming galaxies to drive reionization, there must either be a rapid evolution of between and the Epoch of Reionization, or hitherto observationally unstudied sources (e.g. ultra-faint low-mass galaxies with ) must make an outsized contribution to reionization.
keywords:
cosmology: observations – dark ages, reionization, first stars – galaxies: clusters: general – galaxies: high-redshift – intergalactic medium – ultraviolet: galaxies1 Introduction
The protagonists of the last major phase transition of the universe, Cosmic Reionization, have been notoriously elusive. Leaking ionizing radiation into their surroundings, these sources (“Lyman Continuum (LyC) leakers") rapidly turned the universe filled with neutral Hydrogen into one of galaxies in the throes of star-formation and stellar-mass buildup in a mere space of 500 million years (Planck Collaboration et al., 2016). These enigmatic sources are currently expected to be star-forming galaxies, but this has mostly been concluded from elimination of other candidates like quasars and AGN, and hedging on what the faint end (-13 mag) of the UV-Luminosity function may look like rather than through convincing, direct observations of LyC emission from star-forming galaxies (e.g. Micheva et al. (2016); Cristiani et al. (2016); Robertson et al. (2013); Robertson et al. (2015); Bouwens et al. (2016), but see Giallongo et al. (2015); Madau & Haardt (2015)). Since ionizing photons cannot directly be observed during the thick of reionization at due to the opaque intervening inter-galactic medium (IGM), observational attempts to understand reionization have resorted to searching for analogues of LyC leakers at lower redshifts (Inoue et al., 2014; Stark, 2016).
The prevailing paradigm from various reionization calculations is that for star-forming galaxies to drive reionization, their must exceed (e.g., Mitra et al., 2015, 2016; Giallongo et al., 2015; Madau & Haardt, 2015; Price et al., 2016; Feng et al., 2016). Initial estimates of the average of star-forming galaxies at published numbers exceeding this threshold, but it is now well-established that these early studies greatly underestimated how contaminated they were by low interlopers and near-neighbor sources (Vanzella et al., 2010a; Vanzella et al., 2012; Nestor et al., 2011; Siana et al., 2015; Mostardi et al., 2015; Grazian et al., 2016). The current, well-established picture is that of extremely humble escape fractions out to (e.g Rutkowski et al., 2016, 2017; Japelj et al., 2017; Matthee et al., 2016; Marchi et al., 2016; Grazian et al., 2016, 2017).
Meanwhile, major strides have been made in compiling a sample of individual LyC leakers. The COS instrument on has been effective at finding these sources in our local universe and out to (Bergvall et al., 2006; Leitet et al., 2013; Izotov et al., 2016b, a; Borthakur et al., 2014; Leitherer et al., 2016). And for the first time, we have a sample of confirmed LyC leakers and highly likely candidates at the higher redshifts of (Shapley et al., 2016; Vanzella et al., 2016; Bian et al., 2017; Mostardi et al., 2015; Naidu et al., 2017). Using this sample, we hope to understand the mechanisms of LyC escape, and robustly link to quantities that are observable in the Epoch of Reionization.
One such indirect measure of that has been put forward in the literature is the line ratio [Oiii]/[Oii] which potentially traces density-bounded HII regions (e.g., Nakajima et al., 2016; Faisst, 2016). A large fraction of confirmed LyC leakers and highly likely candidates show extreme [Oiii]/[Oii] () (five sources at from Izotov et al. (2016b, a), at from de Barros et al. (2016), three sources at from Naidu et al. (2017)). Many of these sources also display extreme EW([Oiii]), in some cases as high as (rest-frame) (e.g. , GS-30668 from Naidu et al. (2017)). Extreme [Oiii] emission has long been suspected to imply LyC emission, as in the case of the compact, low-metallicity “green pea" galaxies in the SDSS sample which have been studied extensively for this reason (Cardamone et al., 2009; Jaskot & Oey, 2013; Nakajima & Ouchi, 2014; Henry et al., 2015; Amorín et al., 2017).
However, the -[Oiii]/[Oii] connection and the contribution of extreme [Oiii] emitters to the average LyC emission is yet to be tested observationally on statistical samples. In this work, we leverage a recently confirmed overdensity at (Forrest et al., 2017) to assemble a sample in a narrow redshift bin that is dominated by high EW([Oiii]) sources. We use this unique sample to constrain at , and also test the viability of [Oiii]/[Oii] and EW([Oiii]) as indirect handles on . This paper is structured as follows. In section §2 we describe the imaging and redshift data used for the analysis. The methodology of our stacking and calculation of is outlined in §3. In §4 we present constraints on for various substacks, and in §5 we discuss the implications of our findings on the [Oiii]/[Oii]-LyC connection in the context of other reionization studies. Finally, in §6 we summarise our work and look to the future. Throughout this paper, we adopt kms-1Mpc-1, i.e., , largely consistent with the most recent measurements from Planck (Planck Collaboration et al., 2015). Magnitudes are given in the AB system (Oke & Gunn, 1983). All limits on the escape fraction mentioned in this paper are limits, unless stated otherwise. [Oiii]/[Oii] as used in this paper denotes the [Oiii]5007Å/[Oii] line ratio. We use to denote the absolute escape fraction, and denotes the “relative" escape fraction (defined in §3.2). All Equivalent Widths (EWs) mentioned in this paper are in the rest-frame.
2 Data
2.1 Photometry
2.1.1 Deep U-band and R-band VLT/VIMOS imaging
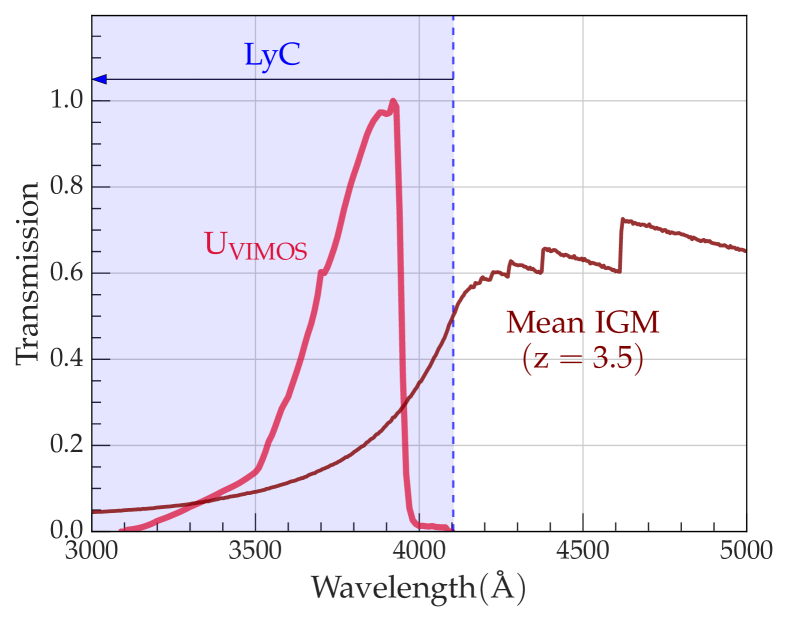
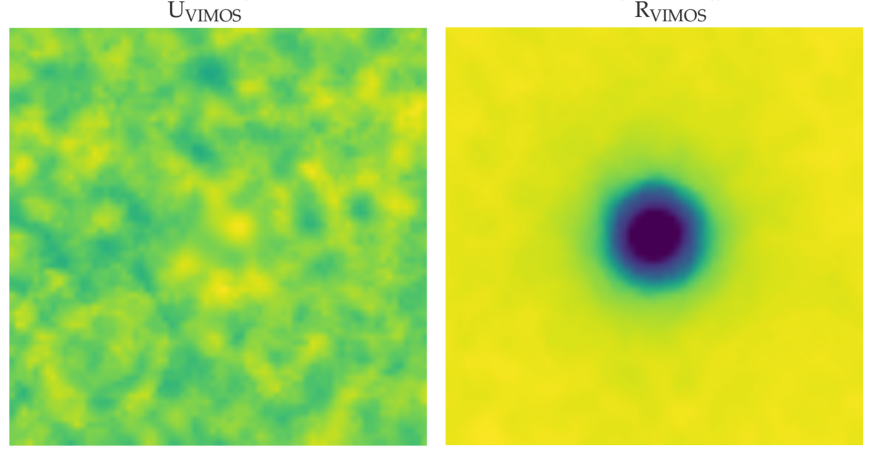
In this study we use deep U-band and R-band imaging from Nonino et al. (2009) (27.9 mag and 27.5 mag deep respectively, at in a aperture). This imaging dataset has already been used to make successful forays into the LyC puzzle. The discovery of , the first definitively confirmed LyC leaker at (Vanzella et al., 2015), and one of the preliminary constraints on at (Vanzella et al., 2010b) were possible due to the depth of these images. In our case, at , the U-band contains exclusively Lyman Continuum photons while the R-Band contains non-ionizing UV flux (see Figure 1).
2.1.2 HST imaging
Several previous studies of the LyC using ground-based data suffered from contamination due to foreground sources that was often reported as an offset between the non-ionizing UV flux and the purported LyC flux (see Vanzella et al. (2010a) for a definitive account). In order to sidestep this pitfall we rely on high spatial resolution Hubble Space Telescope images of the galaxies in our sample to check for contamination from nearby neighbours and low interlopers. Using images to discount contamination has become a standard step in recent LyC studies (e.g. Matthee et al., 2016; Japelj et al., 2017; Shapley et al., 2016).
For our galaxies, images are sourced from the 3DHST (Skelton et al., 2014; Brammer et al., 2012; Momcheva et al., 2016) and CANDELS (Koekemoer et al., 2011; Grogin et al., 2011) surveys, as well as the previous GOODS ACS imaging (Giavalisco et al., 2004). 60 out of the 73 galaxies that comprise the sample studied in this paper have been imaged in the F435W, F606W, F775W, F814W, F125W, F140W, and F160W filters by the aforementioned surveys, and the remaining 13 have been observed using at least five of these filters.
2.2 Redshifts
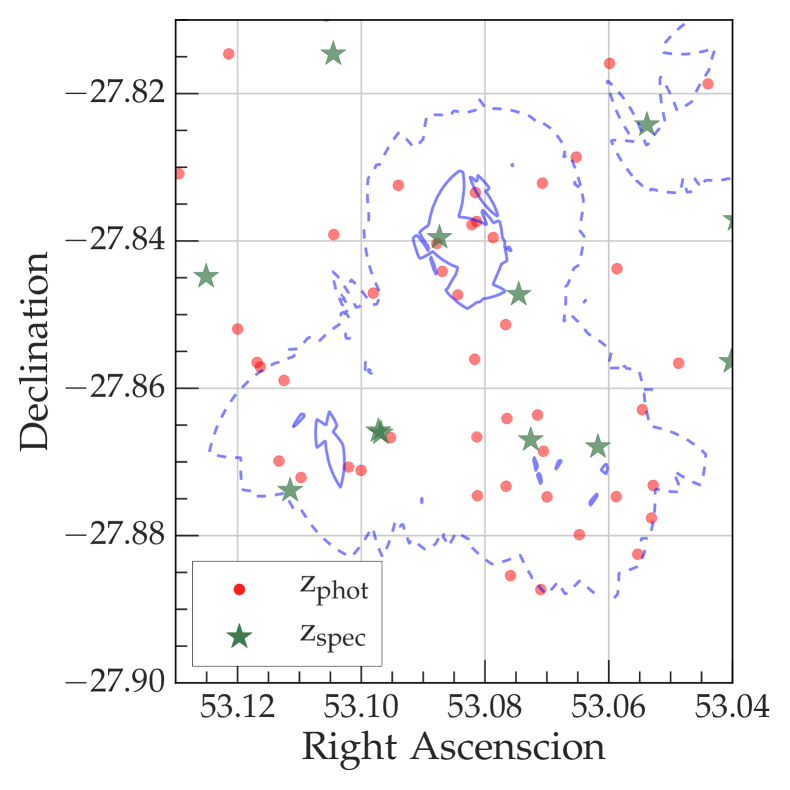
2.2.1 Overdensity at
Forrest et al. (2017) presented an overdensity in the CDFS field based on photometric redshifts derived from the medium band near-infrared FourStar Galaxy Evolution Survey (zfourge; Straatman et al., 2016). The overdensity is detected at significance and existing literature spectroscopic redshifts validate the detection. The photometric redshifts derived by zfourge using EAZY (Brammer et al., 2008) are made particularly reliable by the survey’s use of the rich multiwavelength legacy data available in the CDFS field (40 filters spanning the UV to mid-IR). Further, the medium band filters of the zfourge survey finely sample the NIR which contains the distinctive Balmer break at , thus preventing several low-z interlopers making it into our selection. The sources from the overdensity featured in this paper have photometric redshifts derived from 38 bands on average, with a mean uncertainty of ().
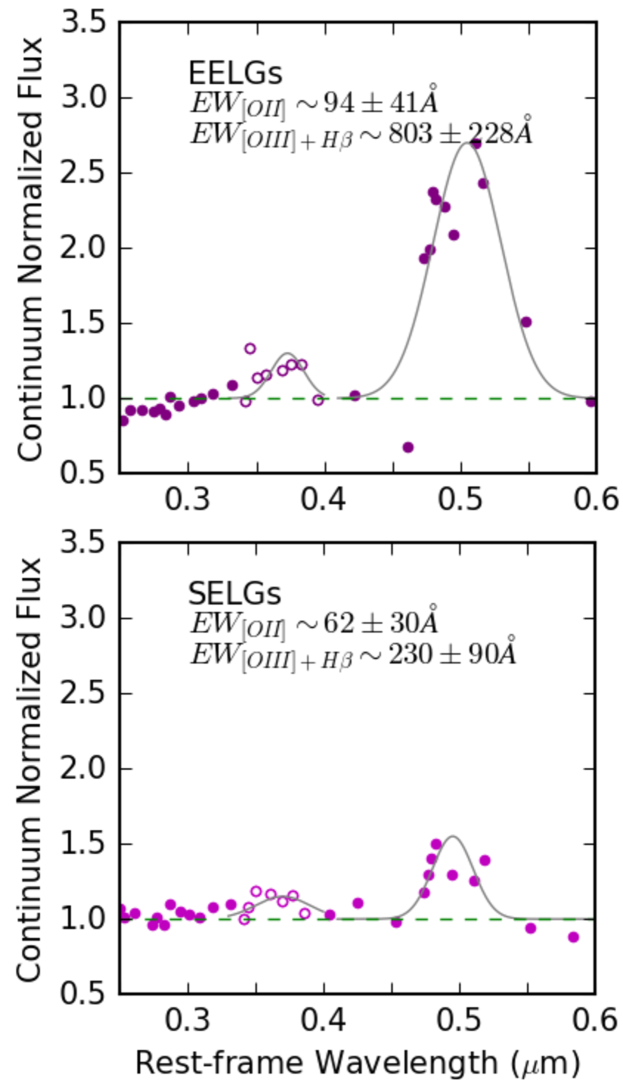
By fitting composite SEDs and inferring nebular line fluxes from K-band excesses for individual galaxies, Forrest et al. (2017) show that the overdensity includes galaxies that are “Strong Emission Line Galaxies (SELGs)" and “Extreme Emission Line Galaxies (EELGs)". The EELGs and SELGs in Forrest et al. (2017) have on average an EW([Oiii]+H) of and respectively. The sample studied in this paper is comprised largely of sources that belong to these two classes ( of the selected sample).
2.2.2 Spectroscopic Redshifts
We also select galaxies from public redshift catalogs that have spectroscopic redshifts in the redshift-range of the overdensity (), and that also have coverage in the deep U-Band and R-Band imaging from Nonino et al. (2009). The redshift catalogs we use are the compilation in the 3D-HST photometric release (Skelton et al., 2014), the VUDS survey (DR1, Le Fèvre et al., 2015) and the ESO GOODS/CDFS master redshift catalogue111https://www.eso.org/sci/activities/garching/projects/goods/MasterSpectroscopy.html, compiled mainly from Vanzella et al. (2008), Le Fèvre et al. (2005), and Balestra et al. (2010). We only consider spectroscopic redshifts which have the highest quality flags (e.g confidence class 3+ from the VUDS survey). We also use MOSFIRE redshifts from the sample studied in Holden et al. (2016).
3 Methodology
In this section we discuss how we compiled our sample from the data discussed in the previous section, our procedure for stacking the deep U and R band images of the selected sample, and finally how we calculate the average of our stack.
3.1 Sample Selection
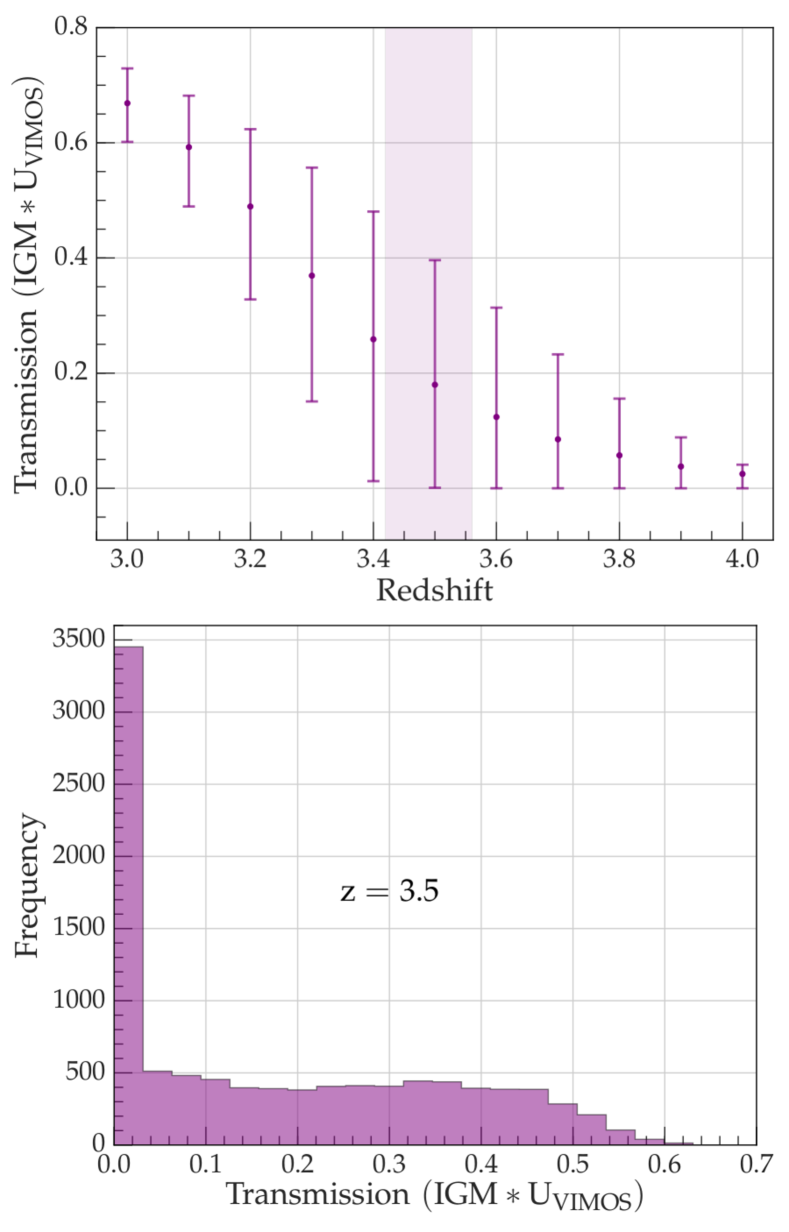
Stacking LyC-containing images of galaxies across a wide redshift-range to calculate introduces uncertainties due to the rapid evolution of the IGM with redshift (shown in Figure 2). Further, due to the stochasticity of the IGM, a large sample is required to average out the biases along individual lines of sight. Of all the efforts to constrain at by stacking photometry, to our knowledge only Grazian et al. (2016, 2017) launched a targeted campaign to compile a sample that is located in a narrow enough redshift-bin () to obviate IGM evolution with redshift, is of a large enough size (69 galaxies) to account for the stochastic variation of the IGM, and is free of contamination with a high degree of confidence based on HST coverage.
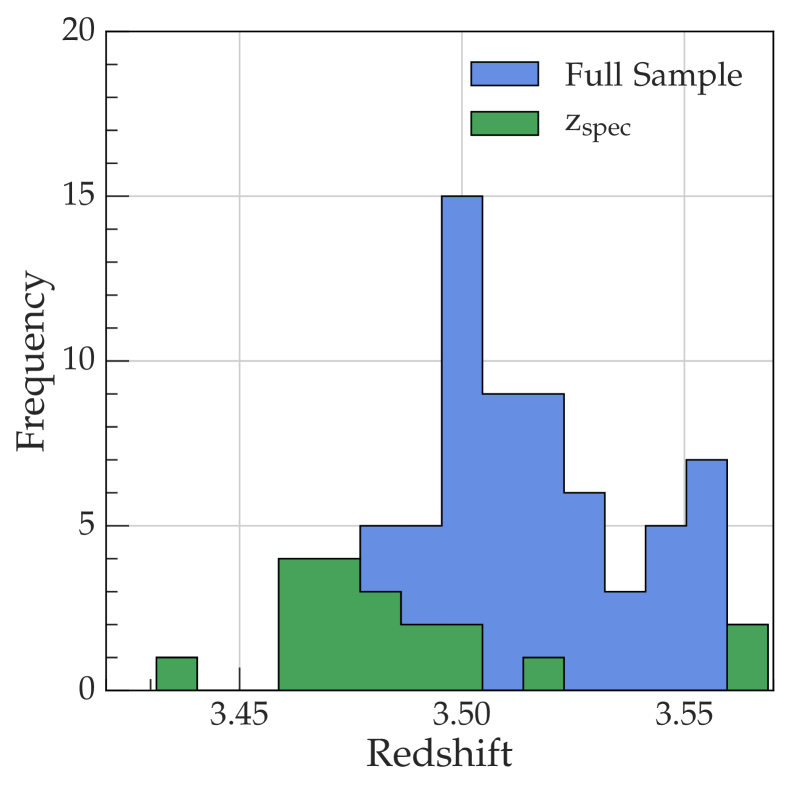
Thanks to the overdensity discussed earlier, we are able to put together a similarly large sample (73 galaxies) in a very narrow redshift-bin at the slightly higher redshift of . We choose this range since it contains the majority of the overdensity galaxies, and is a range at which the U-band is completely covered by the LyC. In order to make it to our sample, we require the peak photometric redshift of an overdensity galaxy to lie in and that the lower limit on the redshift be greater than since at , non-ionizing UV radiation begins leaking into the U-band. In addition to the overdensity galaxies, we also consider galaxies in the Nonino et al. (2009) imaging with literature spectroscopic redshifts at for inclusion in our sample.
We find no evidence for any source in this sample being an AGN. For this we rely on the zfourge AGN catalogue (Cowley et al., 2016). In addition, we also use latest x-ray (Xue et al., 2016; Cappelluti et al., 2016) and variability-based AGN catalogues (Villforth et al., 2010; Sarajedini et al., 2011; García-González et al., 2015).
Next, like in Japelj et al. (2017) and Marchi et al. (2016) we make VJH RGB stamps (V-J, J-H, and V-H comprising the three channels of the RGB images) using the high spatial resolution F606W, F125W, and F160W images and inspect these stamps to exclude galaxies that show signs of photometric contamination from nearby neighbours, or of blending with low interlopers. In the VJH stamps, flux contamination in all except some pathological cases shows up with a colour different from that of the central source.
After making these cuts, we are left with a sample of 73 galaxies, 19 of which have secure spectroscopic redshifts from the literature, while the remaining 54 have -band zfourge photometric redshifts. The sample is also dominated by SELGs and EELGs as classified by Forrest et al. (2017) (54 out of 73)–this aspect is discussed further in §5.
3.2 Calculating
| (1) |
Most studies of LyC photon escape measure the relative escape fraction as defined above instead of the absolute escape fraction to avoid uncertainties that arise from estimating the dust attenuation (, ). In the rest of this section we describe how we treat each term in Equation 1.
is the observed flux ratio of the Lyman Continuum flux and non-ionizing UV flux that we observe in the U-band and R-band stacks respectively. At the U-band collects flux at restframe and the R-band covers restframe .
is the intrinsic luminosity density ratio. No definitive observational constraints exist for this quantity, and it is usually derived by averaging SED models. We set this ratio to motivated by Starburst99 models (Leitherer et al., 1999) consistent with our EELG sample, for which we assume [Oiii]/H and fit EW([Oiii]. These values correspond to EW() and thus to an age of Myr for the instantaneous burst, and to Myr for continuous star formation with a constant star formation rate. The models yield . Several previous studies assume comparable values (e.g. in Marchi et al., 2016; Grazian et al., 2016; Guaita et al., 2016; Grazian et al., 2017; Japelj et al., 2017). In our own previous work (Naidu et al., 2017) we have deployed a grid of BPASSv2 models (Eldridge et al., 2017) which span . We also note that the ratio has been observed to be higher than what we assume () for some more extreme, individual low- LyC leakers (e.g. Izotov et al., 2016a).
represents the mean transmission of the IGM at . We calculate by convolving the U-band’s filter transmission curve with 10,000 IGM lines of sight at from Inoue et al. (2014). The top panel of Figure 2 shows the rapid evolution of with redshift, highlighting the importance of the narrow redshift distribution of our sample. The bottom panel of Figure 2 shows the stochastic nature of the IGM and the large variance in transmission across the 10,000 lines of sight at .
4 Results
4.1 The average at
| Sample [N] | % ( upper limit) | |
|---|---|---|
| 25.03 | ||
| 25.97 | ||
| All [73] | 25.38 | |
| EELGs (b) (bright) [23] | 25.07 | |
| EELGs (b) (faint) [31] | 25.96 | |
| All EELGs [54] | 25.48 |
-
(a) Bright: , Faint: . for the Full Sample stack.
-
(b) The EELG sample in this paper has an average estimated rest-frame EW([Oiii]) of as per the composite SED-estimated EWs in Table 1 of Forrest et al. (2017), who used K-band flux excesses to infer extreme [Oiii] emission.
We create a U-band and R-band mean stack of our sample (shown in Figure 6). The U-band covers the LyC region at and the R-band contains non-ionizing UV radiation. While performing the stacking we take care to mask neighbouring sources and background noise using segmentation maps from the 3D-HST survey. Fluxes are extracted in 1” apertures following Nonino et al. (2009), and an aperture correction calculated by the growth curve method (Howell, 1989) is applied to calculate the total flux.
As shown in Figure 6 we find no detection in the U-band stack (which translates to a limit of 31.98 mag at for 73 sources), and a clear detection in the R band stack (25.38 mag, with S/N) and hence calculate . For the limit on the U-band non-detection for a single source, we measure the RMS of 10,000 sky positions in 1” (radius) apertures and get a value (29.65 mag) consistent with Nonino et al. (2009) (29.8 mag). And then for the stack limit, we divide the derived limit by , where is the number of sources in the stack ( for the full stack, see Table 1 for sub-stacks).
To account for variation in the IGM in the full stack we sample random lines of sight (for various sub-stacks we sample lines of sight corresponding to the number of sources in each sub-stack) a million times from the 10,000 lines of sight described in Section 3 to calculate . Using these values in Equation 1, we are able to place a stringent limit of on for our sample spanning . Our result is consistent with Grazian et al. (2017), the most directly comparable study in terms of sample size and redshift selection, who place a limit of by stacking 69 galaxies at a proximal redshift range () using a shallower U-band stack (31.74 mag at ) at a higher IGM/U-band transmission (0.28) and with a significantly brighter sample– compared to in this work.
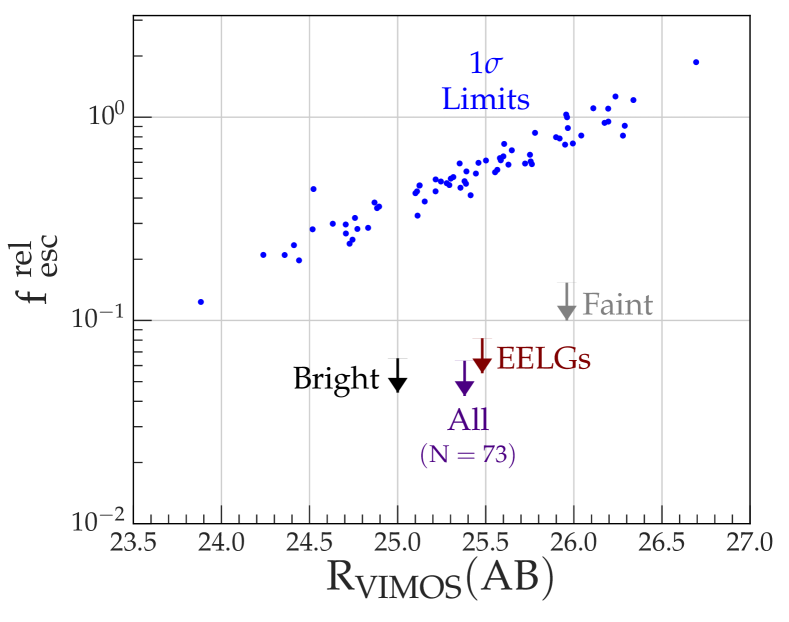
As shown in earlier work, the constraints on depend on the brightness of the sample. So we split the sample into two sub-stacks of “bright" () and “faint" () galaxies. We find no U-band detection in these sub-stacks as well (see Table 1 for constraints). In Figure 7 we show the values for individual galaxies in the stack. As the galaxies grow fainter, the constraint on grows looser since the errors on the flux are correlated with the faintness of the sources (see Section 3 in Japelj et al. (2017)).
4.2 A first constraint on the average of EELGs at
We create bright and faint sub-stacks of extreme [Oiii] emitters motivated by the growing speculation in the literature that [Oiii]/[Oii] may be used as an indirect measure of the escape fraction (see §5 for more details). We use the “Strong Emission" and “Extreme Emission" classification from Forrest et al. (2017) to select 54 sources with high [Oiii] equivalent widths from our main stack. The extreme emitters and strong emitters in Forrest et al. (2017) have on average an EW([Oiii]+H) of and respectively. Our 54 selected sources have an average rest-frame EW([Oiii]) (based on EWs derived from composite SED-fitting, see Table 1 in Forrest et al. (2017)) and we refer to them as the "EELG" (Extreme Emission Line Galaxy) sample, since they have EWs comparable with EELGs reported in literature that have EW([Oiii]) ranging from (Maseda et al., 2013, 2014; van der Wel et al., 2014; Amorín et al., 2015; Atek et al., 2011).
We find no detection in the U-band for the EELG sub-stacks as well, and place upper limits of and on for the bright and faint EELG samples respectively. Assuming an[Oiii]/H ratio of 5.1 based on Holden et al. (2016), who measure[Oiii]/H from a sample of star-forming galaxies at , and estimating EW([Oiii]) and EW([Oii]) using the composite SED fits from Forrest et al. (2017) (see Figure 5) we roughly estimate [Oiii]/[Oii] for our EELG sample. For a validation of EWs derived using the composite SED-fitting method see §3.2 of Forrest et al. (2017), and note that while EW([Oiii]) is exactly the same as stated in Forrest et al. (2017), EW([Oii]) was estimated specifically for this work in a similar fashion. For comparison, at , the typical [Oiii]/[Oii] based on extrapolations from local high- analogues in SDSS (Faisst, 2016). Given this high average ionization parameter, and the non-detection in the U-band stacks our result complicates the conclusions of recent studies like Faisst (2016) and Nakajima et al. (2016) which point to the population of extreme [Oiii] emitters as being key to understanding reionization.
5 Discussion
5.1 Evidence against a definitive LyC - [Oiii]/[Oii] connection
Motivated by the incidence of extreme [Oiii]/[Oii] in multiple LyC leakers (Vanzella et al., 2016; de Barros et al., 2016; Naidu et al., 2017; Izotov et al., 2016a), studies like Nakajima et al. (2016) and Faisst (2016) have looked to cast sources that show extreme [Oiii] emission and [Oiii]/[Oii] as the drivers of reionization. Our sample is indeed extreme for , with an [Oiii]/[Oii], which is typical of a galaxy as per the scaling relations for emission line EWs derived from SDSS high- analogues (Faisst, 2016; Faisst et al., 2016).
However, we have shown here that there is no LyC signal detected in our sample, with a stringent limit of for our EELG sample. To our knowledge, ours is the first study that has observationally constrained the LyC for a sample of EELGs large enough to account for the stochasticity of the IGM. We acknowledge that our EELGs, while extreme, are not as extreme as some individual LyC leakers like those in Izotov et al. (2016a) with EW and [Oiii]/[Oii]–though we do note that our sample has EW([Oiii]) and [Oiii]/[Oii] consistent with the average galaxy in the heart of reionization at as per the scaling relations for emission lines in Faisst (2016).
A recent comparable result which corroborates our finding of a low even from high [Oiii]/[Oii] sources comes from Rutkowski et al. (2017) who reported for a small sample of 13 [Oiii]/[Oii] galaxies at from a shallower /F275W stack. Other precursors to our result exist in the literature. Stasińska et al. (2015) used SDSS galaxies with extreme [Oiii]/[Oii] and a careful analysis of photoionization models to conclude that the ionization parameter on its own is an insufficient diagnostic tool for the leakage of LyC photons and must be used along with other lines like [Ar 3], [O 1] and He 2, and considerations of the gas covering fraction (Reddy et al., 2016a). There are also cases of gravitationally lensed galaxies (lensing allows looking for the LyC in faint regimes) with extreme [Oiii]/[Oii] and non-detections from Amorín et al. (2014) (at ) and Vasei et al. (2016) (at ). More recently, Izotov et al. (2017) presented a detailed spectroscopic study of some of the most extreme star-forming galaxies with EW([Oiii] ) and and came to the similar conclusion that by itself is not a sufficient predictor of LyC leakage.
We conclude this section by noting that while there may be a preponderance of [Oiii]/[Oii] sources in the sample of confirmed LyC leakers and candidates, a high average ionization parameter for a sample (like the one presented in this paper) may not imply LyC leakage. This finding casts doubt over approaches that hope to use the population-averaged [Oiii]/[Oii] as an indirect measure of during the Epoch of Reionziation.
5.2 Comparison with average measurements in the literature and the missing LyC photon crisis
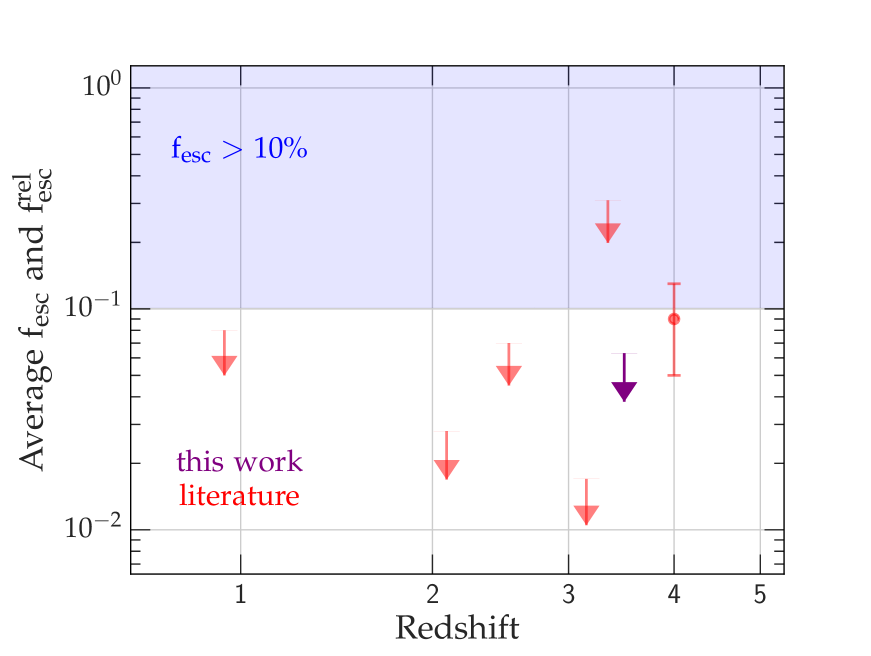
Our constraints on the LyC escape fraction are in agreement with a growing string of studies that find humble escape fractions in star-forming galaxies across (e.g. Matthee et al., 2016; Grazian et al., 2016, 2017; Rutkowski et al., 2016, 2017; Marchi et al., 2016; Japelj et al., 2017). These constraints even include samples of highly star-forming galaxies (e.g. H-emitters in Matthee et al. (2016), emission-line galaxies in Rutkowski et al. (2017)).
The growing consensus from simulations is that on average, there is no strong increase with redshift in the contribution of star-forming galaxies to the ionization budget (e.g., Xu et al., 2016; Hassan et al., 2016; Anderson et al., 2017). So if the galaxies in our sample are indeed analogous to reionizers, their is in tension with calculations that typically require for star-forming galaxies in order for them to be the chief drivers of reionization at (e.g., Mitra et al., 2015, 2016; Giallongo et al., 2015; Madau & Haardt, 2015; Price et al., 2016; Feng et al., 2016; Robertson et al., 2015).
One common solution (e.g. Rutkowski et al., 2017) to this tension is to point to the lack of low-mass (), dwarf galaxies in stacking samples. This has a solid grounding in the literature since most of the simulations referenced earlier extol the role of faint, dwarf galaxies in reionization. For instance, Wise et al. (2014) find an evolution of from to between . Our sample of EELGs has a mean as per the composite SED fits in Forrest et al. (2017), making it a “low-mass" sample, but nowhere close to . The zfourge flux completeness threshold limits the presence of intrinsically faint luminosity, extremely low-mass sources in our sample, which could possibly be why we find no LyC signal in our stacks. Similarly, none of the other robust constraints on come from a sample comprised of dwarf, intrinsically faint galaxies–hence authors like Grazian et al. (2017) look at gravitationally lensed sources as the next frontier for LyC studies.
Another way out of the crisis lies in revisiting some of the fundamental assumptions of reionization calculations. Accounting for the effects of binary stellar evolution (which itself is still poorly understood) for instance, allows for as much as a factor of four higher ionizing photon production efficiency (Ma et al., 2016; Stanway et al., 2016; Choi et al., 2017). Updating assumptions about and a proper treatment of dust for the UV and LyC regions may also lead to a very different picture of reionization (Reddy et al., 2016b, a; Reddy et al., 2017). There is also growing evidence from simulations that the escape of ionizing photons may be a highly stochastic process with brief periods of high (Wise et al., 2014; Cen & Kimm, 2015; Trebitsch et al., 2017).
6 Summary and Outlook
In this work we placed tight constraints on the escape fraction of ionizing radiation at using a recently confirmed overdensity in the GOODS-South field revealed by the zfourge survey that boasts an abundance of extreme [Oiii] emitters. Galaxies with extreme [Oiii] emission and [Oiii]/[Oii] have been marked as prime candidates for driving reionization. Here we place a tight limit on for such sources using a large sample with high [Oiii]/[Oii] and an extreme average rest-frame [Oiii] equivalent width (). Our galaxies lie in a narrow redshift slice at which means we have a sample large enough to compensate for the stochasticity of the IGM and are not forced to average the rapidly evolving IGM transmission across a wide redshift range to gather a statistical sample size like many previous studies.
Our main finding is that despite stacking a sample expected to have an elevated , we find no LyC signal in an extremely deep U-band stack (32mag at ), which corresponds to . Our result raises questions about the reliability of extreme EW([Oiii]) and [Oiii]/[Oii] as effective tracers of the LyC . We have shown in this work that these indicators do not necessarily imply significant LyC leakage for a sample, or even for individual sources. The caveats we acknowledge are that our sample doesn’t contain galaxies at extremely low masses () and that our EELGs are not as extreme as some individual LyC leakers.
Even other stacks of the star-forming galaxy population in the literature that are expected to have higher escape fractions (e.g. low-mass galaxies, H emitters, emission-line galaxies, extreme [Oiii] emitters) fail to breach the barrier on average (though there are a handful of recently discovered individual sources with much higher ). Which is to say, the open questions about the sources that drove reionization are still very much open. One clear path forward is the careful analysis of the handful of known LyC leakers in the universe, and in efforts to bolster this small sample. Extreme [Oiii]/[Oii] is a tantalizing indirect estimator because it occurs both in local LyC sources (e.g. Izotov et al., 2016b, a) as well as in what was the only known LyC leaker for a long time ( from de Barros et al. (2016) and Vanzella et al. (2016)). However, as the sparse sample of LyC leakers grows, better estimators (perhaps the H/UV-Slope, or Ly line profiles), or combinations of indirect estimators may emerge that will maximize the potential of JWST in probing reionization directly for galaxies at .
Acknowledgements
We are grateful to the referee for a thorough and fair assessment of this work–their eye for detail and precise, constructive suggestions are a heartening reminder that not all is rotten in the state of peer review (Smith, 2006). We thank Akio Inoue for providing Monte-Carlo realizations of the IGM transmission. RN thanks the members of the Kavli Institute for Astronomy and Astrophysics at Peking University and the Yale Center Beijing, particularly Prof. Linhua Jiang and Shuyan Liu, for their warm hospitality while he was working on this project. RN expresses gratitude to Prof. Shaffique Adam (Yale-NUS College) for access to High Performance Computing resources. PO acknowledges support by the Swiss National Science Foundation through the SNSF Professorship grant 157567 “Galaxy Build-up at Cosmic Dawn". BF and KT acknowledge the support of the United States’ National Science Foundation under Grant #1410728. This research made use of Astropy, a community-developed core Python package for Astronomy (Astropy Collaboration et al., 2013) and Photutils (Bradley et al., 2016), an affiliated package of Astropy that provides tools to conduct photometry. The plots in this paper were created with Matplotlib (Hunter, 2007) and Seaborn (Waskom et al., 2014). This research was possible due to the following facilities: VLT (VIMOS), HST (ACS, WFC3), Keck (MOSFIRE). Lin-Manuel Miranda (specifically, “Non-Stop" (Miranda et al., 2015)) & Yale Spring Fling provided inspiration to write this paper with celerity.
References
- Amorín et al. (2014) Amorín R., et al., 2014, ApJ, 788, L4
- Amorín et al. (2015) Amorín R., et al., 2015, A&A, 578, A105
- Amorín et al. (2017) Amorín R., et al., 2017, Nature Astronomy, 1, 0052
- Anderson et al. (2017) Anderson L., Governato F., Karcher M., Quinn T., Wadsley J., 2017, MNRAS, 468, 4077
- Astropy Collaboration et al. (2013) Astropy Collaboration et al., 2013, A&A, 558, A33
- Atek et al. (2011) Atek H., et al., 2011, ApJ, 743, 121
- Balestra et al. (2010) Balestra I., et al., 2010, A&A, 512, A12
- Bergvall et al. (2006) Bergvall N., Zackrisson E., Andersson B.-G., Arnberg D., Masegosa J., Östlin G., 2006, A&A, 448, 513
- Bian et al. (2017) Bian F., Fan X., McGreer I., Cai Z., Jiang L., 2017, ApJ, 837, L12
- Borthakur et al. (2014) Borthakur S., Heckman T. M., Leitherer C., Overzier R. A., 2014, Science, 346, 216
- Bouwens et al. (2016) Bouwens R. J., Smit R., Labbé I., Franx M., Caruana J., Oesch P., Stefanon M., Rasappu N., 2016, ApJ, 831, 176
- Bradley et al. (2016) Bradley L., et al., 2016, astropy/photutils: v0.3, doi:10.5281/zenodo.164986, https://doi.org/10.5281/zenodo.164986
- Brammer et al. (2008) Brammer G. B., van Dokkum P. G., Coppi P., 2008, ApJ, 686, 1503
- Brammer et al. (2012) Brammer G. B., et al., 2012, ApJS, 200, 13
- Cappelluti et al. (2016) Cappelluti N., et al., 2016, ApJ, 823, 95
- Cardamone et al. (2009) Cardamone C., et al., 2009, MNRAS, 399, 1191
- Cen & Kimm (2015) Cen R., Kimm T., 2015, ApJ, 801, L25
- Choi et al. (2017) Choi J., Conroy C., Byler N., 2017, ApJ, 838, 159
- Cowley et al. (2016) Cowley M. J., et al., 2016, MNRAS, 457, 629
- Cristiani et al. (2016) Cristiani S., Serrano L. M., Fontanot F., Vanzella E., Monaco P., 2016, MNRAS, 462, 2478
- Eldridge et al. (2017) Eldridge J. J., Stanway E. R., Xiao L., McClelland L. A. S., Taylor G., Ng M., Greis S. M. L., Bray J. C., 2017, Publ. Astron. Soc. Australia, 34, e058
- Faisst (2016) Faisst A. L., 2016, preprint, (arXiv:1605.06507)
- Faisst et al. (2016) Faisst A. L., et al., 2016, ApJ, 821, 122
- Feng et al. (2016) Feng Y., Di-Matteo T., Croft R. A., Bird S., Battaglia N., Wilkins S., 2016, MNRAS, 455, 2778
- Forrest et al. (2017) Forrest B., et al., 2017, preprint, (arXiv:1703.03814)
- García-González et al. (2015) García-González J., Alonso-Herrero A., Pérez-González P. G., Hernán-Caballero A., Sarajedini V. L., Villar V., 2015, MNRAS, 446, 3199
- Giallongo et al. (2015) Giallongo E., et al., 2015, A&A, 578, A83
- Giavalisco et al. (2004) Giavalisco M., et al., 2004, ApJ, 600, L103
- Grazian et al. (2016) Grazian A., et al., 2016, A&A, 585, A48
- Grazian et al. (2017) Grazian A., et al., 2017, preprint, (arXiv:1703.00354)
- Grogin et al. (2011) Grogin N. A., et al., 2011, ApJS, 197, 35
- Guaita et al. (2016) Guaita L., et al., 2016, A&A, 587, A133
- Hassan et al. (2016) Hassan S., Davé R., Finlator K., Santos M. G., 2016, MNRAS, 457, 1550
- Henry et al. (2015) Henry A., Scarlata C., Martin C. L., Erb D., 2015, ApJ, 809, 19
- Holden et al. (2016) Holden B. P., et al., 2016, ApJ, 820, 73
- Howell (1989) Howell S. B., 1989, PASP, 101, 616
- Hunter (2007) Hunter J. D., 2007, Computing In Science & Engineering, 9, 90
- Inoue et al. (2014) Inoue A. K., Shimizu I., Iwata I., Tanaka M., 2014, MNRAS, 442, 1805
- Izotov et al. (2016a) Izotov Y. I., Schaerer D., Thuan T. X., Worseck G., Guseva N. G., Orlitová I., Verhamme A., 2016a, MNRAS, 461, 3683
- Izotov et al. (2016b) Izotov Y. I., Orlitová I., Schaerer D., Thuan T. X., Verhamme A., Guseva N. G., Worseck G., 2016b, Nature, 529, 178
- Izotov et al. (2017) Izotov Y. I., Thuan T. X., Guseva N. G., 2017, MNRAS, 471, 548
- Japelj et al. (2017) Japelj J., et al., 2017, MNRAS, 468, 389
- Jaskot & Oey (2013) Jaskot A. E., Oey M. S., 2013, ApJ, 766, 91
- Koekemoer et al. (2011) Koekemoer A. M., et al., 2011, ApJS, 197, 36
- Le Fèvre et al. (2005) Le Fèvre O., et al., 2005, A&A, 439, 845
- Le Fèvre et al. (2015) Le Fèvre O., et al., 2015, A&A, 576, A79
- Leitet et al. (2013) Leitet E., Bergvall N., Hayes M., Linné S., Zackrisson E., 2013, A&A, 553, A106
- Leitherer et al. (1999) Leitherer C., et al., 1999, ApJS, 123, 3
- Leitherer et al. (2016) Leitherer C., Hernandez S., Lee J. C., Oey M. S., 2016, ApJ, 823, 64
- Ma et al. (2016) Ma X., Hopkins P. F., Kasen D., Quataert E., Faucher-Giguère C.-A., Kereš D., Murray N., Strom A., 2016, MNRAS, 459, 3614
- Madau & Haardt (2015) Madau P., Haardt F., 2015, ApJ, 813, L8
- Marchi et al. (2016) Marchi F., et al., 2016, preprint, (arXiv:1611.05882)
- Maseda et al. (2013) Maseda M. V., et al., 2013, ApJ, 778, L22
- Maseda et al. (2014) Maseda M. V., et al., 2014, ApJ, 791, 17
- Matthee et al. (2016) Matthee J., Sobral D., Best P., Khostovan A. A., Oteo I., Bouwens R., Röttgering H., 2016, preprint, (arXiv:1605.08782)
- Micheva et al. (2016) Micheva G., Iwata I., Inoue A. K., 2016, preprint, (arXiv:1604.00102)
- Miranda et al. (2015) Miranda L.-M., et al., 2015, Hamilton: original Broadway cast recording
- Mitra et al. (2015) Mitra S., Choudhury T. R., Ferrara A., 2015, MNRAS, 454, L76
- Mitra et al. (2016) Mitra S., Choudhury T. R., Ferrara A., 2016, preprint, (arXiv:1606.02719)
- Momcheva et al. (2016) Momcheva I. G., et al., 2016, ApJS, 225, 27
- Mostardi et al. (2015) Mostardi R. E., Shapley A. E., Steidel C. C., Trainor R. F., Reddy N. A., Siana B., 2015, ApJ, 810, 107
- Naidu et al. (2017) Naidu R. P., et al., 2017, ApJ, 847, 12
- Nakajima & Ouchi (2014) Nakajima K., Ouchi M., 2014, MNRAS, 442, 900
- Nakajima et al. (2016) Nakajima K., Ellis R. S., Iwata I., Inoue A. K., Kusakabe H., Ouchi M., Robertson B. E., 2016, preprint, (arXiv:1608.08222)
- Nestor et al. (2011) Nestor D. B., Shapley A. E., Steidel C. C., Siana B., 2011, ApJ, 736, 18
- Nonino et al. (2009) Nonino M., et al., 2009, ApJS, 183, 244
- Oke & Gunn (1983) Oke J. B., Gunn J. E., 1983, ApJ, 266, 713
- Planck Collaboration et al. (2015) Planck Collaboration et al., 2015, preprint, (arXiv:1502.01589)
- Planck Collaboration et al. (2016) Planck Collaboration et al., 2016, A&A, 596, A108
- Price et al. (2016) Price L. C., Trac H., Cen R., 2016, preprint, (arXiv:1605.03970)
- Reddy et al. (2016b) Reddy N. A., Steidel C. C., Pettini M., Bogosavljevic M., 2016b, preprint, (arXiv:1606.00434)
- Reddy et al. (2016a) Reddy N. A., Steidel C. C., Pettini M., Bogosavljevic M., Shapley A., 2016a, preprint, (arXiv:1606.03452)
- Reddy et al. (2017) Reddy N. A., et al., 2017, preprint, (arXiv:1705.09302)
- Robertson et al. (2013) Robertson B. E., et al., 2013, ApJ, 768, 71
- Robertson et al. (2015) Robertson B. E., Ellis R. S., Furlanetto S. R., Dunlop J. S., 2015, ApJ, 802, L19
- Rutkowski et al. (2016) Rutkowski M. J., et al., 2016, ApJ, 819, 81
- Rutkowski et al. (2017) Rutkowski M. J., et al., 2017, preprint, (arXiv:1705.06355)
- Sarajedini et al. (2011) Sarajedini V. L., Koo D. C., Klesman A. J., Laird E. S., Perez Gonzalez P. G., Mozena M., 2011, ApJ, 731, 97
- Shapley et al. (2016) Shapley A. E., Steidel C. C., Strom A. L., Bogosavljević M., Reddy N. A., Siana B., Mostardi R. E., Rudie G. C., 2016, ApJ, 826, L24
- Siana et al. (2007) Siana B., et al., 2007, ApJ, 668, 62
- Siana et al. (2015) Siana B., et al., 2015, ApJ, 804, 17
- Skelton et al. (2014) Skelton R. E., et al., 2014, ApJS, 214, 24
- Smith (2006) Smith R., 2006, J R Soc Med, 99, 178
- Stanway et al. (2016) Stanway E. R., Eldridge J. J., Becker G. D., 2016, MNRAS, 456, 485
- Stark (2016) Stark D. P., 2016, ARA&A, 54, 761
- Stasińska et al. (2015) Stasińska G., Izotov Y., Morisset C., Guseva N., 2015, A&A, 576, A83
- Steidel et al. (2001) Steidel C. C., Pettini M., Adelberger K. L., 2001, ApJ, 546, 665
- Straatman et al. (2016) Straatman C. M. S., et al., 2016, ApJ, 830, 51
- Trebitsch et al. (2017) Trebitsch M., Blaizot J., Rosdahl J., Devriendt J., Slyz A., 2017, MNRAS, 470, 224
- Vanzella et al. (2008) Vanzella E., et al., 2008, A&A, 478, 83
- Vanzella et al. (2010a) Vanzella E., Siana B., Cristiani S., Nonino M., 2010a, MNRAS, 404, 1672
- Vanzella et al. (2010b) Vanzella E., et al., 2010b, ApJ, 725, 1011
- Vanzella et al. (2012) Vanzella E., et al., 2012, ApJ, 751, 70
- Vanzella et al. (2015) Vanzella E., et al., 2015, A&A, 576, A116
- Vanzella et al. (2016) Vanzella E., et al., 2016, ApJ, 825, 41
- Vasei et al. (2016) Vasei K., et al., 2016, ApJ, 831, 38
- Villforth et al. (2010) Villforth C., Koekemoer A. M., Grogin N. A., 2010, ApJ, 723, 737
- Waskom et al. (2014) Waskom M., et al., 2014, seaborn: v0.5.0 (November 2014), doi:10.5281/zenodo.12710, https://doi.org/10.5281/zenodo.12710
- Wise et al. (2014) Wise J. H., Demchenko V. G., Halicek M. T., Norman M. L., Turk M. J., Abel T., Smith B. D., 2014, MNRAS, 442, 2560
- Xu et al. (2016) Xu H., Wise J. H., Norman M. L., Ahn K., O’Shea B. W., 2016, ApJ, 833, 84
- Xue et al. (2016) Xue Y. Q., Luo B., Brandt W. N., Alexander D. M., Bauer F. E., Lehmer B. D., Yang G., 2016, ApJS, 224, 15
- de Barros et al. (2016) de Barros S., et al., 2016, A&A, 585, A51
- van der Wel et al. (2014) van der Wel A., et al., 2014, ApJ, 788, 28