Equation of state and optical properties
of shock-compressed C:H:N:O molecular mixtures
Abstract.
Water, ethanol, and ammonia are the key components of the mantles of Uranus and Neptune. To improve structure and evolution models and give an explanation of the magnetic fields and luminosities of the icy giants, those components need to be characterised at planetary conditions (some Mbar and a few K). Those conditions are typical of the Warm Dense Matter regime, which exhibits a rich phase diagram, with the coexistence of many states of matter and a large variety of chemical processes. H2O, C:H:O, and C:H:N:O mixtures have been compressed up to 2.8 Mbar along the principal Hugoniot using laser-driven decaying shocks. The experiments were performed at the GEKKO XII and LULI 2000 laser facilities using standard optical diagnostics (Doppler velocimetry and pyrometry) to characterise equation of state and optical reflectivity of the shocked states. The results show that H2O and the C:H:N:O mixture share the same equation of state with a density scaling, while the reflectivity behaves differently by what concerns both the onset pressures and the saturation values. The reflectivity measurement at two frequencies allows to estimate the conductivity and the complex refractive index using a Drude model.
Introduction
Composite mixtures behaviour at extreme pressures and temperatures shows intriguing chemical and physical processes, involving complex bounding scenarios. At different temperatures and densities, a variety of states exist. These include combinations of many chemical species in distinct states of ions, atoms, molecules, clusters and lattices, depending on the specific conditions. Of particular interest are C:H:N:O mixtures (also called planetary ices), as they comprise the major component of the interiors of our icy giant planets Uranus and Neptune. Their structure are indeed composed by an outer layer of hydrogen and helium, an “icy” mantle made of a water (H2O) - methane (CH4) - ammonia (NH3) mixture, and possibly a rocky core [1]. As pressure and temperature increase from the outer layers towards the core, their interiors are expected to exhibit a wide range of different states embracing atomic and molecular fluids, dissociated plasmas, and superionic lattices.
The complexity in describing the behaviour of these mixtures at planetary conditions (few Mbar, few K) is at the basis of the numerous lacunae in our understanding of Uranus and Neptune. Their internal structures are inferred from the observed gravitational fields, masses, internal rotation and radii. However mass distribution remains ambiguous [2]. Accurate analysis of Voyager 2 data [3, 4, 5, 6] even open the possibility for a dichotomy in their structures, indicating that the two planets could have very different interiors, despite being similar in mass and radius. Lack of precise information on transport properties of the C:H:N:O mixture is also casting serious issues in explaining Uranus and Neptune’s magnetic fields [7]. Similarly, the simplified approach adopted in the ice characterisation fails in describing Uranus’ low luminosity [8, 9]. Resolving this situation is even more urgent today as the discovery of exoplanets is incredibly active. Since solar planets are used as prototypes for extrasolar planets [10], the loose description of planetary ice and the resulting approximate portrait of Uranus and Neptune not only prevent the understanding of extrasolar giant planets such as GJ 436b or HAT-P-11b but also affect our capability to distinguish Earth-like planets candidates. As a result there is actually a great need to establish benchmarking values for the equations of states, phase diagrams, and transport properties of H2O-NH3-CH4 mixtures at Mbar pressures and temperatures of some K. So far, our knowledge of water/methane/ammonia mixtures mainly relies on ab initio calculations [11, 12, 13, 14] since experimental data at planetary conditions [15, 16, 11] are limited, while water has been experimentally probed up to high pressures [17, 18, 19, 20, 21].
In the present work, we have compressed water and two C:H:(N):O mixtures relevant for ice giant interiors up to Mbar through laser-driven shocks. We have measured the equation of state of the shocked sample and the optical reflectivity of the shock front using optical diagnostics (VISARs and SOP). An estimation of the electronic contribution to conductivity is given using a Drude model.
Methods and experimental setup
Mixtures.
Liquid water/ethanol (C:H:O) and water/ethanol/ammonia (C:H:N:O) mixtures have been prepared by adding up different amounts (see the Supporting Information) of pure water, pure ethanol, and a liquid water/ammonia (28% wt.) mixture to obtain the following atomic ratios: C:H:O = 4:22:7; C:H:N:O = 4:25:1:7. The latter - synthetic Uranus [16] - reproduces the chemical composition of Uranus and Neptune’s mantles, with the C:N:O abundance ratios comparable to those of the Solar System [22]. The density of the mixtures at ambient conditions was g/cm3.
Laser facilities.
Experiments were performed at the GEKKO XII laser facility of the Institute of Laser Engineering, Osaka University (Japan) [23] and at the LULI 2000 laser facility of the Laboratoire d’Utilisation des Lasers Intenses, École Polytechnique (France). At GEKKO XII, we used 3 up to 9 beams (corresponding to energies on target from 120 - 440 J) at 351 nm, with a m focal spot diameter. At LULI 2000 we used 1 or 2 beams (energies on target from 200 - 500 J) at 527 nm, with a m focal spot diameter. In both cases, the laser pulse duration was ns and phase plates were used to obtain a uniform irradiation spot.
Targets.
To optimise the target design and ensure there were no shock reverberations in the sample, we simulated laser-target interaction and the shock loading into the cell with the Lagrangian 1-D hydrodynamic code MULTI [24]. The equation of state of the target components were extracted from the SESAME tables [25, 26]. The table 7154 for water has been used for the mixtures. The multi-layered target cells were composed by a 10-15 m thick CH ablator, a 40 m thick Al shield, a 50 m thick SiO2 standard, the sample (4 mm thick), and a rear SiO2 window (200 m thick). We also performed some high-intensity shots at GEKKO XII with CH 50 m / Au 3 m / Al 5 m / SiO2 20 m / mixture 4 mm / SiO2 200 m targets, the gold layer serving as X-ray shield to prevent any pre-heating of the sample. As probe lasers, we used a YAG at 532 nm at GEKKO XII and at 532 and 1064 nm at LULI 2000, with a full-width half-maximum pulse duration of ns.
Data analysis.
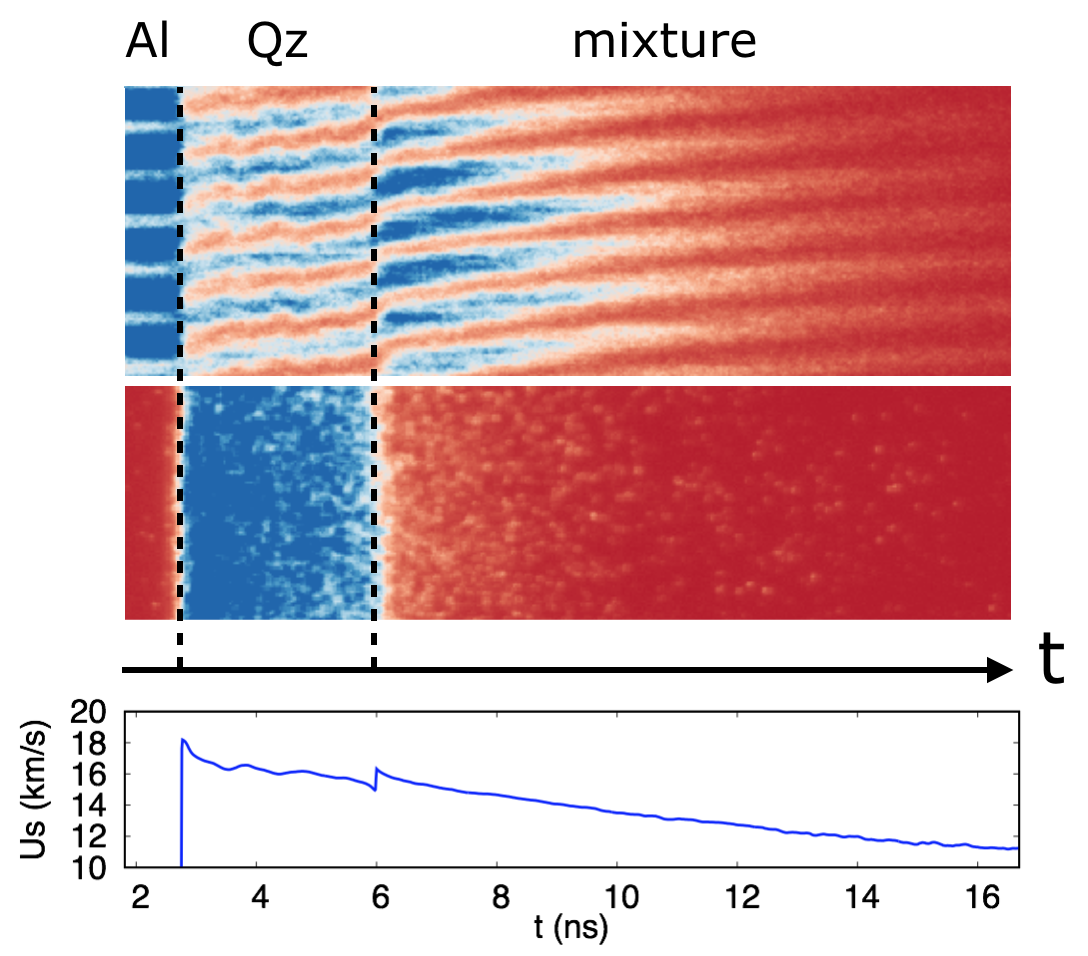
Time-resolved shock velocity has been extracted using the Neutrino software [27] from the output of two VISARs [28] (Doppler velocity interferometers, see the Supporting Information), both working at 532 nm (GEKKO XII) or one at 532 and one at 1064 nm (LULI 2000). The thermodynamic conditions (the mass density , the pressure , and the internal energy density ) reached in the mixture have been obtained from the Rankine-Hugoniot relations [29, 30] through impedance mismatching [31], using quartz as in situ standard. To span a range of thermodynamical conditions with a single shot, we employed a decaying shock technique. We determined the shock velocity at the exit from quartz and at the entrance in the mixture ( and , respectively) with a linear fit on on a time window of some ns before and after the crossing of the quartz/mixture interface. Shock velocity versus fluid downstream velocity (-) Sandia Z-pinch data [32] have been used as reference for quartz. The adiabatic release of quartz on the lower-impedance mixture at the shock crossing of the interface has been modeled using a mirror Hugoniot approximation. This method agrees with the use of a quartz release model [33] within the error bars in the region where the latter can be applied.
Time-resolved self emission has been measured through a streaked optical pyrometer (SOP) working at nm. Temperature has been obtained from Planck’s law , where , is a calibration factor, is the emissivity of the shock front at the working wavelength and is the number of counts on the SOP. To get the emissivity at nm we used the reflectivity measured at nm under a grey-body hypothesis: . SOP calibration has been made in situ, by determining the factor using quartz as standard (GEKKO XII) or using a calibration lamp with known emission temperature (LULI 2000, see the Supporting Information).
A typical VISAR and SOP output is shown in Figure 1, together with the extracted shock velocity temporal profile.
Since the shocked sample has different thermodynamical conditions with respect to the un-shocked one, its refractive index changes. According to the Fresnel equations, the shock front reflects a fraction of the incident light from the probe laser. The reflectivity of the shock front has been measured with the VISARs as the ratio between the shot signal and a reference signal reflected on the aluminum/quartz interface. A VISAR-independent reflectivity measurement at nm was included in the setup for some shots at LULI 2000. Since VISARs and reflectometer can measure only a relative value, a quartz reflectivity fit [34] based on previous measurements [35], has been used to calibrate the measure.
Results and discussion
Equation of state
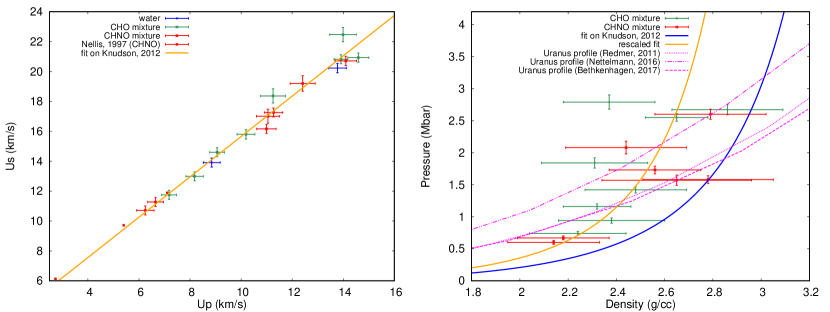
Figure 2 (left) shows - velocity data for pure water and the C:H:O and C:H:N:O mixtures, together with the best linear fit on previous water high pressure shock data [19]: km/s. We extracted -- thermodynamic conditions from the - relation via the Rankine-Hugoniot equations:
| (1a) | ||||
| (1b) | ||||
| (1c) | ||||
-- results are shown in Table 1. We observed that the - relation does not significantly change between water and C:H:(N):O mixture. Therefore, the only discrepancy in their - relation along the principal Hugoniot is due to the different initial density (1.00 vs 0.88 g/cm3). The mixtures - relation is shown in Figure 2 (right) and compared with a fit on previous water data [19]. This fit has been rescaled to take into account the different initial density of water and mixtures in order to be immediately compared with mixture data.
The common - relation between water and mixtures indicates that they share a similar structural behaviour. This confirms previous first-principles molecular dynamics (FPMD) simulations [11] which identify the regime we explored as an electronic conducting phase. At these temperatures, carbon-carbon and carbon-nitrogen bond lifetimes are predicted to be very short by first-principles calculations [13]. This prevents polymerisation and clustering, and causes the existence of an atomic fluid above K. Therefore, no structural effect of carbon and nitrogen atoms on the - relation is expected at those conditions. These results confirm recent FPMD calculations [14] which validate the use of the linear mixing approximation when dealing with C:H:N:O mixtures at planetary conditions.
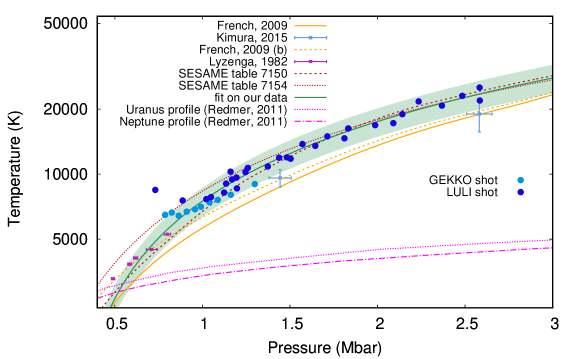
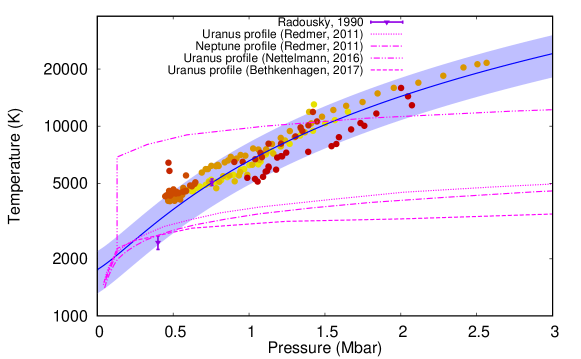
The temperature-pressure (-) relations of water and C:H:N:O mixture are shown in Figure 3 and 4, respectively. Figures 3 and 4 also show the predicted planetary isentropes of Uranus [36, 37, 14] and Neptune [36]. Our data have been fitted with the function , rescaled to be pressure-dependent using the relation given by the equation of state of water.
An extrapolation of our fit to lower pressures is compatible with previous gas-gun data [18]. While our data agree within the errors with recent laser shock results [20], our temperatures are higher than those given by FPMD simulations [38], although it is worth noticing that when quantum corrections from molecular vibrations are taken into account [39] the predicted temperatures increase of K and become more similar to our data.
Our - results for C:H:N:O agree with a previous low-pressure experimental study of the same mixture [15]. Water and C:H:N:O temperatures on the principal Hugoniot are comparable, although the relatively high error bars on temperature make difficult to point out possible discrepancies.
Hereafter we compare our - data with the available models of planetary interiors profiles. Most of them [36, 14] predict an adiabatic profile inside the icy giants, implying that temperatures stay relatively low (3 - 4 K) even at the highest pressures we explored (about 3 Mbar). Indeed, we compressed the sample through single shock loading, which is a process causing high entropy increase, reaching higher temperatures than those of isentropic models. Nevertheless, recent interior profile models include a thermal boundary layer [37], predicting 2-3 times higher temperatures, consistent with our data up to Mbar. Moreover, the recent discovery of a large amount of exoplanets exhibits a wide range of structures including hot Neptunes, whose interior profiles can match the thermodynamical conditions we explored. Finally, our data are useful for the validation of FPMD simulations at extreme conditions.
Optical reflectivity
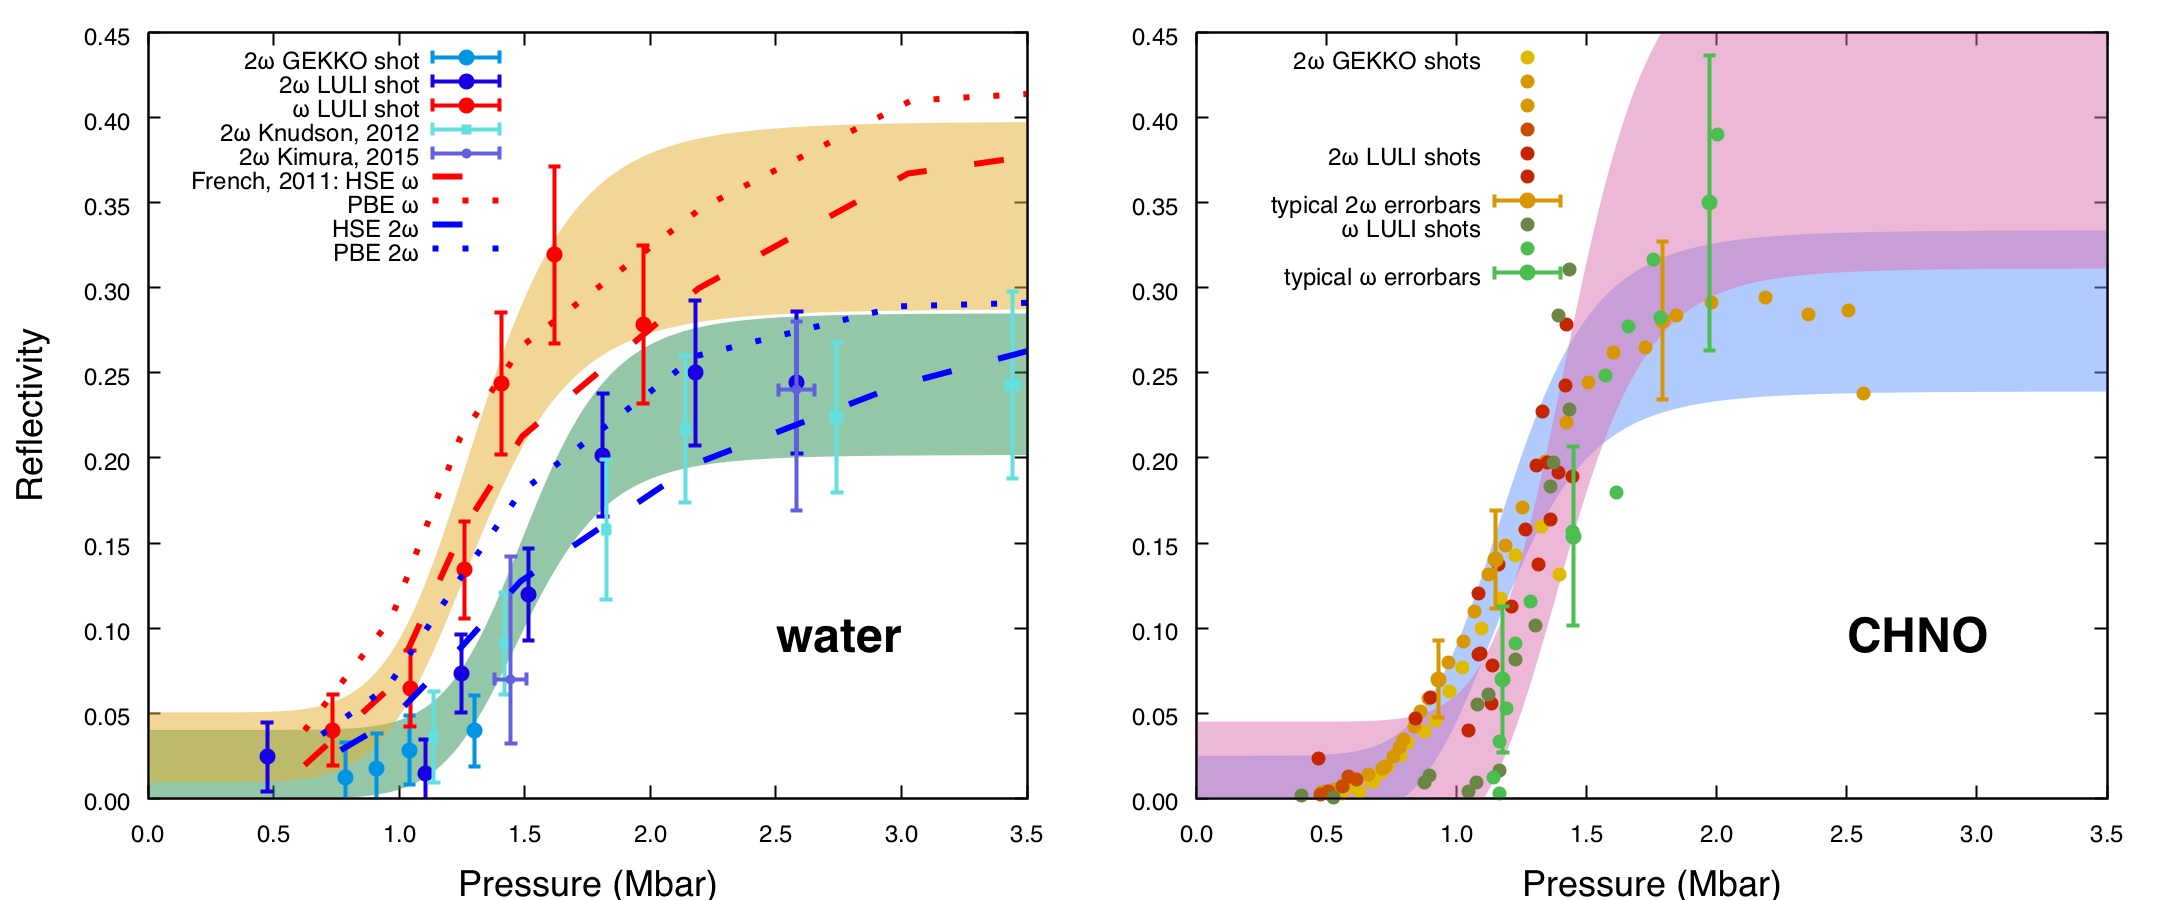
The optical reflectivity of the water shock front at and nm as a function of pressure is shown in Figure 5 (left). The gradual increase of reflectivity up to a saturation value along the principal Hugoniot indicates a smooth transition from an insulating to an electronically conducting (“metallic”) state with the increase of density, pressure, and temperature. We performed a best fit on each - relation using a Hill function , which is suitable to model this gradual transition. The function has been then rescaled to be pressure-dependent using an experimental water equation of state [19] to link pressure and shock velocity. The error bars of the fit are discussed in the Supporting Information and mainly depend on the calibration. According to the Hill fit on nm data, the onset of reflectivity in water occurs at Mbar. At these pressures the reflectivity of the shock front reaches the of the saturation value, respectively. We found a saturation value of reflectivity of at nm and at nm. Our nm reflectivity data are in quantitative agreement with previous experiments [19, 20].
When compared with existing calculations [40], at nm, in the low-pressure regime ( Mbar), our measured reflectivity is lower than the results using two different exchange-correlation functionals (HSE and PBE). At higher pressures our results are in qualitative agreement with the calculated reflectivity using the PBE functional, while the HSE one fails in providing the correct pressure-dependence, as observed by [19]. At nm we always obtained data in qualitative agreement with the calculations.
The reflectivity of the C:H:N:O mixture shock front at nm and nm is shown in Figure 5 (right) against the shocked sample pressure, with Hill fits on the relations rescaled to be pressure-dependent. These are the first reflectivity data of the C:H:N:O mixture along the principal Hugoniot. There are no calculations of shock-compressed C:H:N:O reflectivity in the literature. The onset of reflectivity in C:H:N:O occurs at lower pressures than in water. Indeed, reflectivity at nm reaches the of the saturation value at Mbar, respectively. While water reflectivity at nm is always greater than at nm, this is not true for C:H:N:O at low pressures: the onset value for the nm reflectivity is about Mbar. Starting from Mbar, the nm reflectivity becomes greater and saturates at . The crossing between the two reflectivity values is an indication of the metallisation of the sample via a gap-closure mechanism. Indeed, frequency-dependent conductivity of a semiconducting state has a maximum at a non-zero frequency. As the gap progressively closes with the increase of density and temperature, conductivity (thus reflectivity) becomes to decrease monotonically with frequency as in a free electron gas [41, 42, 43].
The fact that the onset pressure of the C:H:N:O reflectivity at nm occurs at pressures around lower than in water can not be fully explained by the difference between their initial densities. Different dissociation mechanisms that occur in pure water and in carbon-rich mixtures could be at the origin of the mixture higher reflectivity due to the higher free electron density associated to the breaking of carbon-carbon bonds. For similar reasons, the reflectivity saturation value at nm of C:H:N:O is , higher than that of water ().
Conductivity
Electrical conductivity is one of the most important parameters to understand the planetary magnetic field generation and structure. Indeed, a dynamo effect can be sustained if magnetic induction dominates over diffusion. This is usually expressed by the requirement that the magnetic Reynolds number (where is the electrical conductivity of the active planetary layer component and and are the velocity and length scale of the fluid motion inside the layer, respectively).
In gas-gun experiments, the DC electrical conductivity can be directly measured using electrodes. This approach can not be applied to laser shock experiments. Instead, they would need a measurement of the complex refractive index of the shocked sample since, from the wave solution of the Maxwell equations, . In a restricted range of pressure and temperature the absorption coefficient and the reflectivity
| (2) |
can be simultaneously measured [21]. In this case, the evaluation of the conductivity is straightforward.
Nevertheless, this approach is very delicate and remains restricted to few experiments and conditions. In laser shock experiments only reflectivity is usually measured.
In this case, a model has to be considered in order to infer the complex refractive index. A common approach employs a Drude modelisation of optical properties, modified to account for both free and bound carriers. Even if this model is too simplistic for a well-established conductivity estimation, no first-principles calculations on these mixtures are led to date. This approach can therefore be followed to compare mixture conductivity with water data found in literature and obtained with the same method.
In the context of the Drude model, , where is the contribution of the bound electrons to the refractive index. , where is the direct current conductivity and the electron-ion scattering time.
The free parameters in this model are , , and . Reflectivity is generally measured at one probe laser frequency (usually in the green: nm), requiring two of the three parameters to be fixed in an arbitrary way. As is the physical quantity of interest, both and must be estimated.
A reasonable choice for is the Ioffe-Regel limit , which depends on the scattering length and on the electron thermal velocity . is the molar mass, the molar volume, the Avogadro number and the number of atoms in the chemical formula of the mixture; is the reduced mass in a semiconductor formalism.
is much more delicate to be estimated over a wide range of pressures and temperatures. It is usually considered either as a constant or linearly dependent on density (Gladstone-Dale model), which is a simplistic assumption for conducting states. The simultaneous measurement of reflectivity at two frequencies in our experiments removes this difficulty, reducing the number of parameters to fix to one ().
Following this approach, for each Hugoniot state we find the best couple which matches the two reflectivity measurements.
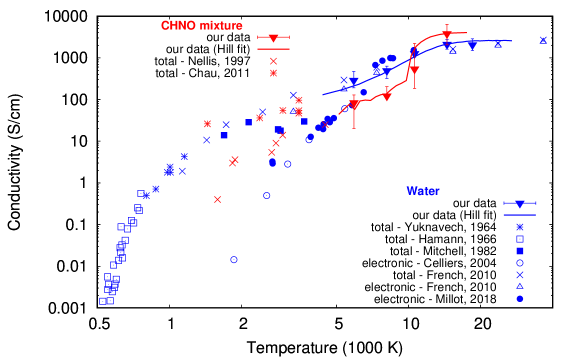
In Figure 6 we show the temperature-dependent DC conductivity of water and C:H:N:O mixture. After a rapid arise from to K, conductivity quasi-saturates, following the reflectivity behaviour.
In this region, at K ( Mbar), conductivity values are and S/cm for water and C:H:N:O, respectively. We notice that the C:H:N:O mixture conductivity is higher than water. A different behaviour was observed in multiple shock experiments. As already underlined, in this conditions the electronic contribution dominates over the ionic one. This situation is different from previous experiments [16, 11] where the main contribution was ionic.
These data highlight that the use of water as a representative of planetary ices can be a too simplified picture for dynamo modelisation.
Refractive index
The combined use of the reflectivity at two different frequencies also allows us to infere a measurement of the complex refractive index of the shocked sample. From the couple , extracted as explained in Subsection Conductivity, we can compute the complex refractive index along the Hugoniot:
| (3a) | ||||
| (3b) | ||||
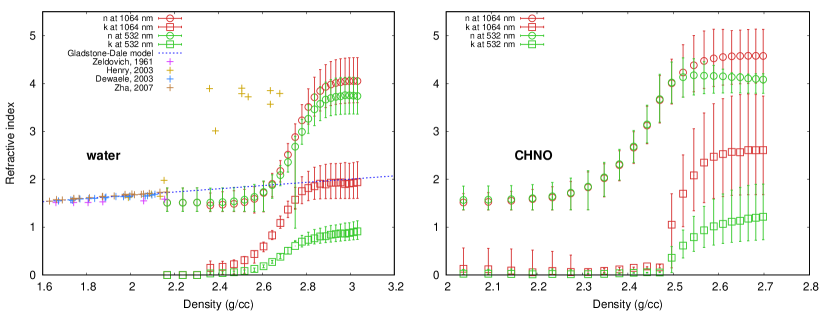
The real and imaginary part of the refractive indices of water and C:H:N:O mixture at both laser frequencies are shown in Figure 7. Low-density real refractive index values are comparable to the results in the literature [45, 46, 47, 48]. At densities around g/cm3, the water real refractive index starts to increase from values comparable to those given by the Gladstone-Dale model [49] to a saturation value of around . This value is very similar to previous results [49, 46], although they found it at around g/cm3, in an opaque regime where reflectivity could not be measured. It has been recently noticed [21] that this is in contrast with the Fresnel reflectivity estimation obtained with . Our data are not affected by this inconsistency, since we find at g/cm3, where water reflectivity is .
The increase of the real and imaginary part of the refractive index are a marker of the transition to a metallic state. Our data show that this transition takes place between and g/cm3. For C:H:N:O, the sudden increase in both the real and imaginary refractive indices takes place around g/cm3.
Conclusions
We studied the behaviour of shock-compressed water and C:H:N:O mixtures at extreme conditions in the Warm Dense Matter regime, reaching pressures up to Mbar and temperatures of K.
We obtained -- equation of state, temperature, optical reflectivity, and electronic contribution to the electrical conductivity of pure H2O and C:H:N:O mixtures along their principal Hugoniot. We found that the only difference in the - relations of water and C:H:N:O can be completely explained by the difference in the initial densities. Their - relations are comparable, although possible small discrepancies could not be distinguished.
The similarity between the equations of state of water and C:H:N:O confirms the validity of the Linear Mixing Approximation at planetary conditions [14]. Moreover, the studied Hugoniot states are consistent with the existence of an atomic fluid above K as recently expected by first-principles calculations [13].
The reflectivity behaviour of water and C:H:N:O mixture are different. The reflectivity onset for C:H:N:O is at Mbar (), slightly lower than water which is found at Mbar (). At Mbar, C:H:N:O reflectivity at nm gets higher than at nm showing a strong metallic behaviour. The reflectivity saturation values are higher for C:H:N:O than for water ( against at nm, against at nm).
Using the dual reflectivity measurement, conductivity and complex refractive index of shocked water and C:H:N:O mixture are obtained through a modified Drude model. Saturation values for conductivities are and S/cm for water and C:H:N:O, respectively. Our results suggest that, in a mantle composed by C:H:N:O mixtures, planetary dynamo could be sustained differently than expected if water is assumed as unique component.
Future experimental work should consider high pressure off-Hugoniot states to enlarge the studied scenario and explore thermodynamic conditions more relevant to planetary interiors.
| shot # | (g/cm3) | (Mbar) | (kJ/g) |
| Pure water | |||
| GK-680 | 2.74 0.18 | 1.23 0.05 | 39.2 2.7 |
| L1-19 | 3.00 0.15 | 2.73 0.06 | 91.3 3.7 |
| C:H:O mixture | |||
| GK-687 | 2.48 0.15 | 1.42 0.04 | 51.9 2.7 |
| GK-706 | 2.24 0.20 | 0.74 0.03 | 25.5 2.0 |
| GK-725 | 2.65 0.13 | 2.55 0.06 | 96.8 3.8 |
| GK-744 | 2.32 0.14 | 1.16 0.04 | 41.1 2.6 |
| GK-753 | 2.38 0.22 | 0.94 0.04 | 33.5 2.7 |
| L1-29 | 2.86 0.19 | 2.67 0.07 | 104.8 5.1 |
| L2-82 | 2.37 0.16 | 2.79 0.11 | 99.6 6.8 |
| L2-86 | 2.31 0.19 | 1.84 0.08 | 64.8 5.3 |
| C:H:N:O mixture | |||
| GK-694 | 2.56 0.19 | 1.73 0.06 | 63.6 4.0 |
| GK-696 | 2.78 0.19 | 1.58 0.05 | 60.4 3.4 |
| GK-712 | 2.79 0.23 | 2.60 0.08 | 99.4 5.9 |
| GK-715 | 2.14 0.19 | 0.60 0.03 | 19.5 2.1 |
| GK-745 | 2.18 0.19 | 0.67 0.03 | 22.3 2.1 |
| L2-102 | 2.65 0.26 | 1.57 0.07 | 56.7 4.8 |
| L2-130 | 2.44 0.30 | 2.08 0.10 | 74.4 7.8 |
References
- [1] Tristan Guillot. Interiors of giant planets inside and outside the solar system. Science, 286(5437):72–77, 1999.
- [2] M. Podolak and R. Helled. What do we really know about Uranus and Neptune? Astrophysical Journal Letters, 759:L32(2), 2012.
- [3] G.F. Lindal, J.R. Lyons, D.N. Sweetnam, V.R. Eshleman, D.P. Hinson, and G.L. Tyler. The atmosphere of Uranus: results of radio occultation measurements with Voyager 2. Journal of Physical Research, 92(A13), 1987.
- [4] J. D. Anderson, J. K. Campbell, R. A. Jacobson, D. N. Sweetnam, and A. H. Taylor. Radio science with Voyager 2 at Uranus - Results on masses and densities of the planet and five principal satellites. Journal of Geophysical Research, 92(A13):14877–14883, 1987.
- [5] G. L. Tyler, D. N. Sweetnam, J. D. Anderson, S. E. Borutzki, J. K. Campbell, E. R. Kursinski, G. S. Levy, G. F. Lindal, J. R. Lyons, and G. E. Wood. Voyager radio science observations of Neptune and Triton. Science, 246:1466–1473, 1989.
- [6] G. F. Lindal. The atmosphere of Neptune - an analysis of radio occultation data acquired with Voyager 2. Astrophysical Journal, 103(3):967–982, 1992.
- [7] D.J. Stevenson. Planetary magnetic fields: Achievements and prospects. Space Science Reviews, 152:651–664, 2010.
- [8] J. C. Pearl, B. J. Conrath, R. A. Hanel, and J. A. Pirraglia. The albedo, effective temperature, and energy balance of Uranus, as determined from Voyager IRIS data. Icarus, 84:12–28, March 1990.
- [9] J. C. Pearl and B. J. Conrath. The albedo, effective temperature, and energy balance of Neptune, as determined from Voyager data. Journal of Geophysical Research Supplement, 96:18, October 1991.
- [10] D. C. Swift, J. H. Eggert, D. G. Hicks, S. Hamel, K. Caspersen, E. Schwegler, G. W. Collins, N. Nettelmann, and G. J. Ackland. Mass-radius relationships for exoplanets. The Astrophysical Journal, 744(1):59, 2012.
- [11] R. Chau, S. Hamel, and W.J. Nellis. Chemical processes in the deep interior of Uranus. Nature Communications, 2(203), 2011.
- [12] M. Lee and S. Scandolo. Mixtures of planetary ices at extreme conditions. Nature communications, 2:185, 2011.
- [13] Edmund R. Meyer, Christopher Ticknor, Mandy Bethkenhagen, Sebastien Hamel, Ronald Redmer, Joel D. Kress, and Lee A. Collins. Bonding and structure in dense multi-component molecular mixtures. The Journal of Chemical Physics, 143(16):164513, 2015.
- [14] M. Bethkenhagen, E. R. Meyer, S. Hamel, N. Nettelmann, M. French, L. Scheibe, C. Ticknor, L. A. Collins, J. D. Kress, J. J. Fortney, and R. Redmer. Planetary ices and the linear mixing approximation. The Astrophysical Journal, 848(1):67, 2017.
- [15] H.B. Radousky, A.C. Mitchell, and W.J. Nellis. Shock temperature measurements of planetary ices: NH3, CH4, and synthetic Uranus. Journal of Chemical Physics, 93(11):8235–8239, 1990.
- [16] W.J. Nellis, N.C. Holmes, A.C. Mitchell, D.C. Hamilton, and M. Nicol. Equation of state and electrical conductivity of synthetic Uranus, a mixture of water, ammonia, and isopropanol, at shock pressures up to 200 GPa. J. Chem. Phys., 107(21):9096–9100, 1997.
- [17] A.C. Mitchell and W.J. Nellis. Equation of state and electrical conductivity of water and ammonia shocked to the 100 GPa (1 Mbar) pressure range. Journal of Chemical Physics, 76(12):6273–6281, 1982.
- [18] G. A. Lyzenga, T. J. Ahrens, W. J. Nellis, and A. C. Mitchell. The temperature of shock-compressed water. Journal of Chemical Physics, 76:6282–6286, June 1982.
- [19] M.D. Knudson, M. P. Desjarlais, R.W. Lemke, T. R. Mattsson, M. French, N. Nettelmann, and R. Redmer. Probing the interiors of the ice giants: Shock compression of water to 700 GPa and 3.8 g/cm3. Physical Review Letters, 108:091102, Feb 2012.
- [20] T. Kimura, N. Ozaki, T. Sano, T. Okuchi, T. Sano, K. Shimizu, K. Miyanishi, T. Terai, T. Kakeshita, Y. Sakawa, and R. Kodama. P--T measurements of H2O up to 260 GPa under laser-driven shock loading. Journal of Chemical Physics, 142(16):164504, 2015.
- [21] Marius Millot, Sebastien Hamel, J. Ryan Rygg, Peter M. Celliers, Gilbert W. Collins, Federica Coppari, Dayne E. Fratanduono, Raymond Jeanloz, Damian C. Swift, and Jon H. Eggert. Experimental evidence for superionic water ice using shock compression. Nature Physics, 14:297–302, 2018.
- [22] A. G. W. Cameron. Abundances of the Elements in the Solar System. Space Science Reviews, 15:121–146, September 1973.
- [23] N. Ozaki, K. A. Tanaka, T. Ono, K. Shigemori, M. Nakai, H. Azechi, T. Yamanaka, K. Wakabayashi, M. Yoshida, H. Nagao, and K. Kondo. GEKKO/HIPER-driven shock waves and equation-of-state measurements at ultrahigh pressures. Physics of Plasmas, 11:1600–1608, April 2004.
- [24] R. Ramis, R. Schmalz, and J. Meyer-Ter-Vehn. MULTI: A computer code for one-dimensional multigroup radiation hydrodynamics. Computer Physics Communications, (3):475 – 505, 1988.
- [25] S.P. Lyon and J.D. Johnson. Los Alamos technical report, la-ur-92-3407 edition, 1992.
- [26] J.D. Johnson. National Technical Information Service Document, 1994.
- [27] A. Flacco and T. Vinci. Neutrino: A light, expandable and full featured image analysis tool for research. https://github.com/NeutrinoToolkit/Neutrino, 2011.
- [28] D.H. Dolan. Foundations of VISAR analysis, 2006.
- [29] W.J. Macquorn Rankine. On the thermodynamic theory of waves of finite longitudinal disturbance. Philosophical Transactions of the Royal Society of London, 160:277–288, 1870.
- [30] H. Hugoniot. Mémoire sur la propagation des mouvements dans les corps et spécialement dans les gaz parfaits. Journal de l’Ecole Polytechnique, 57:3–97.
- [31] J.W. Forbes. Shock Wave Compression of Condensed Matter. Springer, 2012.
- [32] M. D. Knudson and M. P. Desjarlais. Shock Compression of Quartz to 1.6 TPa: Redefining a Pressure Standard. Physical Review Letters, 103(22):225501, November 2009.
- [33] M. D. Knudson and M. P. Desjarlais. Adiabatic release measurements in -quartz between 300 and 1200 GPa: Characterization of -quartz as a shock standard in the multimegabar regime. Physical Review B, 88(18):184107, November 2013.
- [34] M. Millot, N. Dubrovinskaia, A. Černok, S. Blaha, L. Dubrovinsky, D. G. Braun, P. M. Celliers, G. W. Collins, J. H. Eggert, and R. Jeanloz. Shock compression of stishovite and melting of silica at planetary interior conditions. Science, 347:418–420, 2015.
- [35] D. G. Hicks, T. R. Boehly, J. H. Eggert, J. E. Miller, P. M. Celliers, and G. W. Collins. Dissociation of Liquid Silica at High Pressures and Temperatures. Physical Review Letters, 97(2):025502, July 2006.
- [36] R. Redmer, T.R. Mattsson, N. Nettelmann, and M. French. The phase diagram of water and the magnetic fields of Uranus and Neptune. Icarus, 211(1):798 – 803, 2011.
- [37] N. Nettelmann, K. Wang, J.J. Fortney, S. Hamel, S. Yellamilli, M. Bethkenhagen, and R. Redmer. Uranus evolution models with simple thermal boundary layers. Icarus, 275:107 – 116, 2016.
- [38] M. French, T.R. Mattsson, N. Nettelmann, and R. Redmer. Equation of state and phase diagram of water at ultrahigh pressures as in planetary interiors. Physical Review B, 79:054107, Feb 2009.
- [39] M. French and R. Redmer. Estimating the quantum effects from molecular vibrations of water under high pressures and temperatures. Journal of Physics Condensed Matter, 21:375101, September 2009.
- [40] M. French and R. Redmer. Optical properties of water at high temperature. Physics of Plasmas, 18(4):043301, 2011.
- [41] Yann Laudernet, Jean Clérouin, and Stéphane Mazevet. Ab initio simulations of the electrical and optical properties of shock-compressed SiO2. Phys. Rev. B, 70:165108, Oct 2004.
- [42] Jean Clerouin, Patrick Renaudin, Yann Laudernet, Pierre Noiret, and Michael P. Desjarlais. Electrical conductivity and equation-of-state study of warm dense copper: Measurements and quantum molecular dynamics calculations. Phys. Rev. B, 71:064203, Feb 2005.
- [43] T. Qi, M. Millot, R. G. Kraus, S. Root, and S. Hamel. Optical and transport properties of dense liquid silica. Physics of Plasmas, 22(6):062706, June 2015.
- [44] R. Chau, A. C. Mitchell, R. W. Minich, and W. J. Nellis. Electrical conductivity of water compressed dynamically to pressures of 70 - 180 GPa (0.7 - 1.8 Mbar). The Journal of Chemical Physics, 114(3):1361–1365, 2001.
- [45] Y. B. Zel’Dovich, S. B. Kormer, M. V. Sinitsyn, and K. B. Yushko. A Study of the Optical Properties of Transparent Materials under High Pressure. Soviet Physics Doklady, 6:494, December 1961.
- [46] E. Henry. Équation d’état et métallisation de l’eau comprimée par choc laser. PhD thesis, École Polytechnique, 2003.
- [47] A. Dewaele, J. H. Eggert, P. Loubeyre, and R. Le Toullec. Measurement of refractive index and equation of state in dense He, H2, H2O, and Ne under high pressure in a diamond anvil cell. Phys. Rev. B, 67:094112, Mar 2003.
- [48] Chang-Sheng Zha, Russell J. Hemley, Stephen A. Gramsch, Ho-Kwang Mao, and William A. Bassett. Optical study of H2O ice to 120 GPa: Dielectric function, molecular polarizability, and equation of state. The Journal of Chemical Physics, 126(7):074506, 2007.
- [49] D. Batani, K. Jakubowska, A. Benuzzi-Mounaix, C. Cavazzoni, C. Danson, T. Hall, M. Kimpel, D. Neely, J. Pasley, M. Rabec Le Gloahec, and B. Telaro. Refraction index of shock compressed water in the megabar pressure range. Europhysics Letters, 112(3):36001, 2015.
Acknowledgements
We want to thank the GEKKO XII and LULI 2000 laser and support teams. We are grateful to Ronald Redmer, Martin French, and Mandy Bethkenhagen for the useful discussions. This research was supported by a French ANR grant to the POMPEI project (ANR-16-CE31-0008), the JSPS core-to-core program on International Alliance for Material Science in Extreme States with High Power Laser and XFEL, and the International Joint Research Promotion Program at the Osaka University. This work has taken advantage of the MECMATPLA international collaboration.
Author contributions statement
T.O., A.B.-M., R.K., N.O., and A.R.. conceived the project. M.G., J.-A.H., T.O., P.B., A.B.-M., R.B., E.B., Y.F., F.L., K.M., N.O., Y.U., T.V., and A.R. conducted the experiments. M.G. analysed the results. M.G., J.-A.H, and A.R. wrote the paper. All authors reviewed the manuscript.
Additional information
Supplementary infomation for this article is available. The authors declare no competing interests. The data that support the plots within this paper and other findings of this study are available from the corresponding author upon reasonable request.