Tidal stripping as a possible origin of the ultra diffuse galaxy lacking dark matter
Abstract
Recent observations revealed a mysterious ultra diffuse galaxy, NGC1052-DF2, in the group of a large elliptical galaxy, NGC1052. Compared to expectations from abundance matching models, the dark matter mass contained in NGC1052-DF2 is smaller by a factor of . We utilize controlled -body simulations of the tidal interaction between NGC1052 and a smaller satellite galaxy, that we suppose as the progenitor of NGC1052-DF2, to test if tidal stripping can explain dark-matter deficiency at such levels. We find that when assuming a tightly bound and quite radial orbit and cored density structure for the dark halo of the satellite, our simulations reproduce well both the mass profile and the effective radius inferred from the observations of NGC1052-DF2. Orbital parameters are in the tail, but still consistent with measurements of their distributions from cosmological simulations. Such strongly dark-matter deficient galaxies, in our scenario, are thus expected to be relatively rare in groups and clusters, and not present in the field.
keywords:
galaxies: individual: NGC1052-DF2 – galaxies: formation – dark matter – methods: numerical.1 Introduction
A traditional galaxy population, low surface brightness galaxies (LSBs), have been commonly observed as both early (elliptical) and late (disc or irregular) types (Impey & Bothun, 1997). While typical LSBs have sizes of kpc (e.g. Turner et al., 1993; McGaugh & Bothun, 1994; Dalcanton et al., 1997), some of them may be larger than 10 kpc (Sandage & Binggeli, 1984; Bothun et al., 1987). Recently, van Dokkum et al. (2015) defined a sub-class of LSBs, ultra diffuse galaxies (UDGs). At the distance of the Coma cluster, the UDGs have the luminosity of a dwarf galaxy at the size of a galaxy. Subsequent studies have followed up their finding in the same galaxy cluster (e.g. Koda et al., 2015; Yagi et al., 2016), in other clusters and groups of galaxies (e.g. Mihos et al., 2015; van der Burg et al., 2017; Trujillo et al., 2017) and even in the field (Papastergis et al., 2017).
While dark matter (DM) is thought to play a key role in galaxy formation (White & Rees, 1978) and typical UDGs are dynamically dominated by DM (e.g. van Dokkum et al. 2016; Amorisco et al. 2018; Sifón et al. 2018), van Dokkum et al. (2018b, hereafter vD18) inferred that a unique UDG in the NGC1052 group, NGC1052-DF2, previously identified by Fosbury et al. (1978) and Karachentsev et al. (2000), is significantly lacking DM, using the kinetic data of globular clusters in the galaxy.111Similar approach was adopted by Toloba et al. (2018) to measure the masses of UDGs in the Virgo cluster. The stellar mass of the galaxy is M☉ and theoretical models based on the abundance matching technique and the standard theoretical framework of galaxy formation (e.g. Behroozi et al., 2013; Moster et al., 2013) expect that it would be surrounded by a DM halo with a mass of M☉. However, the DM mass of NGC1052-DF2 is inferred as only M☉ within kpc from its centre. Note that the mass distribution of NGC1052-DF2 is under debate. Martin et al. (2018) and Laporte et al. (2018) showed that the current observation data only allow to more weakly constrain the mass distribution than what vD18 obtained. van Dokkum et al. (2018a) updated the observation data and confirmed the results in vD18. Also note that the distance to NGC1052-DF2 may be actually shorter than what vD18 measured and then NGC1052-DF2 might be just a typical dwarf galaxy (Trujillo et al., 2018).
Tidal stripping may be a possible mechanism to form such unique DM-deficient galaxies. Stars in a smaller satellite system are tightly bound in the centre of its DM haloes and thus would be more resilient to the tidal forces of larger host systems, compared with the outskirt of the DM halo. For example, Peñarrubia et al. (2010, hereafter P10) showed that this mechanism can reduce the dynamical mass-to-light ratio of the satellite systems by a factor of .
Motivated by P10, we investigate using high-resolution -body simulations if tidal stripping can indeed explain the deficiency of DM mass even at the extreme level vD18 obtained. Specifically, we consider the interaction between NGC1052 and a possible progenitor of NGC1052-DF2. In fact, some studies found the presence of HI tidal tails in NGC1052 and suggested that the galaxy may have experienced a merger event with a satellite 1 Gyr ago (van Gorkom et al., 1986; Pierce et al., 2005; Fernández-Ontiveros et al., 2011). Section 2 describes the model calibrated for the target galaxy pair. We show the results of our simulations in Section 3 and summarize and discuss the results in Section 4. Throughout this Letter, we use the cosmological parameter set based on Planck Collaboration et al. (2016) and define the virial radius of DM haloes as enclosing an average density of 200 times the critical density. The virial mass and radius of DM haloes are denoted as and .
2 Model description
2.1 Structural parameters
In this subsection, we calibrate the structural parameters of the galaxy pair, NGC1052 (host) and a possible progenitor of NGC1052-DF2 (satellite), using empirical relations. When the relations require redshift, , or we compute the virial radius of the systems, we set . We characterize the initial configuration of the host and satellite with a density profile for spherical systems,
| (1) |
where is the density profile as a function of the distance from the center of the system (or more simply radius). The model has four parameters in total: and are the scale density and length. The parameters, and , control the inner and outer density slopes, respectively. The concentration of the system is defined as . For example, the Navarro-Frenk-White (NFW) profile for the density structure of DM haloes (Navarro et al., 1997) corresponds to the model of and .
First, we use the stellar-to-halo mass relation by Moster et al. (2013). The stellar mass of NGC1052 is M☉ (e.g. Forbes et al., 2017) and the relation expects a halo mass of M☉. The virial radius of the host halo is kpc. Some observations have measured the dynamical mass enclosed within kpc, corresponding to effective radius of the galaxy. van Gorkom et al. (1986) obtained M☉ using HI kinematics and Pierce et al. (2005) derived M☉ with the kinematic information of globular clusters orbiting around NGC1052. The mass of HI gas is M☉ (van Gorkom et al., 1986) and that of the central super massive black hole is M☉ (Woo & Urry, 2002) so that DM is the main contributor in the mass even at the central 20 kpc. We take only the DM halo into account for simplicity. Assuming the NFW density profile and fixing the enclosed mass, we get , for the constraint of van Gorkom et al. (1986) and for that of Pierce et al. (2005). Giving the halo virial mass (and redshift), one can get the typical concentration of DM haloes. Since the former is more consistent with the relation by Ludlow et al. (2016), we adopt it in this Letter.
For the satellite system, NGC1052-DF2, we adopt the stellar mass measured by vD18, M☉. The relation by Moster et al. (2013) expects a halo virial mass of M☉ and the corresponding virial radius is kpc. We set the concentration parameter, , as predicted by the relation of Ludlow et al. (2016).
Another interesting aspect of the halo structure is the inner density slope. One of the long-standing issues on the standard cold dark matter scenario is the so-called core-cusp problem. While cosmological simulations of cold dark matter model predict the power-law density structure, cusp, at the centre of haloes (e.g. Navarro et al., 1997), the kinetic data of low-mass dwarf galaxies prefer the model with a constant density region, core, in the halo centre (e.g. Moore, 1994; Burkert, 1995).222The situation is becoming more complicated in recent years. Oman et al. (2015) showed that the rotation curves of observed dwarf galaxies are diverse, i.e. dynamics of some dwarfs can be explained with cuspy profiles while others prefer cored profiles. On the other hand, ones in simulations are given as a function of galaxy mass. The diversity may be described with e.g. the choice of density profile models, deviation from the equilibrium state and angle to observe galaxies (e.g. Read et al., 2016). The interstellar medium in galaxies heated by supernova feedback temporarily expands, and after losing thermal energy by radiative cooling, it falls back towards the centre again to ignite the next star formation. The cycle of gas expansion and contraction also lead the repetitive change in the gravitational potential and dynamically heat up DM to transform the central cusps into cores (e.g. Governato et al., 2010; Pontzen & Governato, 2012; Teyssier et al., 2013; Ogiya & Mori, 2014; Oñorbe et al., 2015; Peirani et al., 2017). Di Cintio et al. (2014) found an empirical relation to connect the central density structure of DM haloes with the stellar-to-halo mass ratio of galaxies. Applying the relation for our satellite model, we get . We run simulations varying , but fix .
We model the stellar component of the satellite with the Hernquist profile (Hernquist, 1990) which corresponds to the model of and . Stars are distributed to kpc, determined by the same manner with the definition of the virial radius. We set the concentration for the stellar component, , that realizes the effective radius of 0.93 kpc, consistent with the size-mass relation of Lange et al. (2015).
2.2 Orbital parameters
We characterize the relative orbit between host and satellite systems with the following two parameters. The first one is the radius of the circular orbit corresponding to the orbital energy, , , scaled by the virial radius of the host, i.e. . The second one is the orbital circularity, , defined as , where and are the angular momentum of the orbit having the orbital energy, , and that of the circular orbit with the same energy. The distribution of the two parameters have been studied using cosmological -body simulations (Khochfar & Burkert, 2006; Wetzel, 2011; Jiang et al., 2015). While typical orbits have and , we set and , the lower limits of the distributions (van den Bosch et al., 2018). Thus the orbit we study is more tightly bound by the gravitational potential of the host and more radial compared with the typical ones. The satellite is initially located at the apocentre of the orbit, (559, 0, 0) kpc and the velocity vector is (0, 20.6, 0) km/s in the host frame.333The host centre is fixed at the origin throughout simulations. Here we approximate the two systems as point particles to get the vectors.
According to Wetzel (2011), the pericentre of the orbit, kpc, corresponds to the 1.2th percentile of the distribution. In such a central region of the host galaxy stars, gas disc, and central black hole (that we neglect) all play a role. Thus the tidal force the satellite feels in our model would be weaker than the actual. We emphasize that the goal of this study is to investigate whether tidal stripping can form galaxies with little DM as inferred by vD18 and, in fact, the mechanism would work more significantly.
2.3 Simulation setup
In our simulations, the host is treated as a fixed NFW potential of the parameters described above. The timescale of the orbital decay by dynamical friction (Chandrasekhar, 1943) would be of the order of where is the free-fall time of the host. Measuring it at , we get Gyr. The mass ratio between the host and satellite is and we can safely neglect dynamical friction because the time scale of the orbital decay would be much longer than the age of the Universe.
We follow the dynamical evolution of the satellite modeled as an -body system that consists of the two spherical components (stars and a DM halo) in the initial configuration and is initially in the dynamical equilibrium state. Previous studies assumed that the satellite systems are always dynamically dominated by DM and neglected (P10) or modelled the stellar component using mass less particles (Errani et al., 2015). However, the goal of this study is to investigate if tidal stripping can make the satellite galaxy dynamically dominated by stars and thus including the stellar component of the satellite system in a self-consistent way is essential. Setting , the analytical mass profile of the system diverges in the limit of . To avoid this, we employ the sophistication proposed by Kazantzidis et al. (2006). The density structure of the system is described as Eq. (missing) 1 at and is exponentially decayed beyond . The mass of is initially distributed beyond , keeping . We numerically compute the phase-space distribution function that takes the potential of the two components into account using the Eddington formula (Eddington, 1916). Our satellite system of the two components stays at the initial configuration at least for 10 Gyr in the absence of the host potential.
We run two simulations, varying the parameter to control the inner density slope, , of the DM halo of the satellite, for 10 Gyr. In the the first one, we set as predicted by the empirical relation by Di Cintio et al. (2014) and adopt , corresponding to the NFW profile, in the second run. 100,761,600 particles (100,352,000 and 409,600 particles are for the DM halo and stellar component, respectively) are employed in each simulation and all particle have the same mass, M☉. Numerical computation is performed by a treecode (Barnes & Hut, 1986) designed for Graphics Processing Unit clusters (Ogiya et al., 2013). The opening angle of the tree algorithm is and the Plummer softening parameter is kpc, determined by the prescription of Power et al. (2003). The numerical convergence is verified with simulations, reducing the number of particles by a factor of 10, but fixing the other parameters.
3 Results of simulations
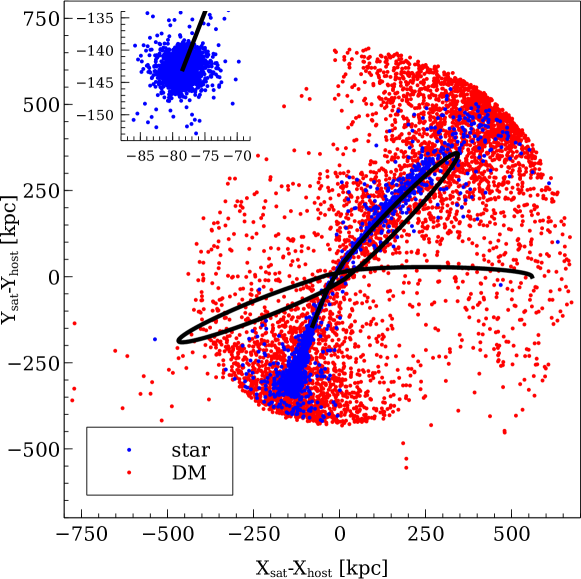
Fig. missing 1 illustrates the distribution of stars (blue) and DM (red) at Gyr in the runs of . From each component, 5,000 particles are selected and shown. We derive the orbit of the satellite center in the host frame using the scheme described in van den Bosch et al. (2018). As demonstrated by many previous studies, the stripped matter remains along the orbit and creates a leading arm and trailing tail, as well as the shell structures at the apocentres. Note that the bulk of the stellar component is still settled at the centre of the satellite (the tip of the black line), as shown in the inset panel.
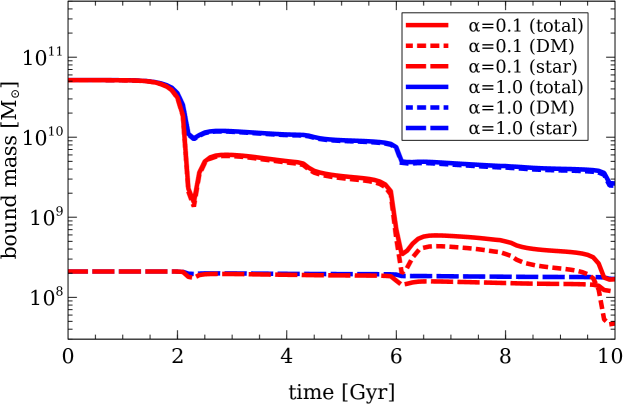
In Fig. missing 2, we demonstrate the evolution of the bound mass in the satellite. The stellar mass (dashed) does not significantly change with time in either of the two runs. On the other hand, the bound mass of the DM halo (dotted) decreases with time, especially at the pericentre where the satellite feels the strongest tidal force, and the degree of DM mass loss depends on the inner density slope, (e.g. P10; Errani et al. 2015). The mass of the cored halo (; red) decreases by a factor of at Gyr and, as a result, the stellar component dominates the total mass. In the run of the NFW halo (; blue), of the initial DM mass is retained and the system keeps DM dominated as it is in the initial configuration. According to the criteria for numerical convergence in -body simulations of tidal stripping by van den Bosch & Ogiya (2018), the derived mass would be reliable in both runs.
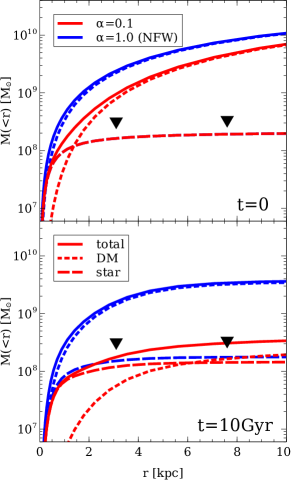
In Fig. missing 3, we compare the mass profiles of the satellite at the initial time of the simulations (upper) and those at Gyr (lower). The same color and line schemes as in Fig. missing 2 are used. Initially, the satellite is a DM dominated system in the both models while the stellar component dominates in mass at kpc in the cored model. As implied by Fig. missing 2, the mass profile of the stellar component is hardly altered by the tidal force of the host potential because it is tightly bound. The cored halo model has a smaller enclosed mass than the model of the cuspy NFW halo at the same radius (in the radial range shown in this figure) from the beginning of the simulations. This represents that the cored halo is less tightly bound than the cuspy counterpart. As a result of tidal stripping, the difference in the mass profile is significantly amplified. The cored halo model reproduces the observational result by vD18 well, the stellar and DM mass enclosed within the central 7 kpc of NGC1052-DF2 is M☉ and M☉.444Looking at mass contained in each radial bin, DM mass dominates at kpc in the model of . Hence we conclude that tidal stripping by NGC1052 can play an important role in forming a DM-deficient UDG, such as NGC1052-DF2.
While we also make some tests varying the orbital parameters and the concentration of DM haloes, the parameter range allowed to reproduce the observation is not so large. The distribution of stripped stars would depend on the parameters and may be broader than that vD18 observed. Follow-up deep observations with a wide field of view, e.g. the Hyper Suprime-Cam of Subaru telescope, may help to test the validity of the formation scenario and make better constraints for the parameters. To estimate the surface brightness of the stellar stream in Fig. missing 1, we assume the distance to NGC1052-DF2 of 20 Mpc (e.g. vD18) and stellar mass-to-light ratio of . Then we find , below the detection limit of the Dragonfly Telephoto Array. Note that this does not indicate detecting such stellar streams is impossible since the simulation is just an example reproducing the vD18 results and more detailed studies are needed to discuss the distribution of stripped stars and detectability.
4 Summary and discussion
We utilize high resolution -body simulations to study the tidal interaction between a large elliptical galaxy, NGC1052, and one of its satellite galaxies and find it can be a possible formation process of the unique DM-deficient UDG, NGC1052-DF2 (vD18). We model an infalling satellite galaxy (the progenitor of NGC1052-DF2) as a two-component (stars and DM) -body system and vary the inner density structure of its DM halo, , motivated by P10. Other structural parameters and orbital ones are calibrated using the results of the observations, abundance matching techniques as well as numerical simulations.
Our simulations demonstrate that the observed mass profile of NGC1052-DF2 by vD18 is reproduced when i) the DM halo has a central density core; ii) the satellite is on a tightly bound and quite radial orbit. The orbital parameters are somewhat in the tails of the distributions in cosmological simulations. Because of the rareness of the orbit, our scenario expects that such significantly DM-deficient galaxies would be rare in groups and clusters, and not present in the field.
We also measure the projected effective (half-light) radius, , of the Sérsic profile (Sérsic, 1963). Stars in the simulations are randomly rotated and the projected radius that contains of the total stellar mass is measured, assuming a two-dimensional axis ratio of , while vD18 derived , where and are the principal semi-axes of the ellipse that satisfy . We repeat the procedure 100 times and obtain kpc in the initial configuration and and kpc at Gyr in the models of the cored and cuspy profiles. Because the mass in the outskirts of the surrounding DM halo is stripped away, the potential well gets shallower and the stellar component expands as a result. The resultant in the cored model is approximately consistent with the observed one for NGC1052-DF2 (2.2 kpc). Carleton et al. (2018) used a semi-analytic model based on simulations by Errani et al. (2017) and found similar results. While the mass profile hardly depends on the initial , the resultant depends on it, according to runs of , varying the initial .
As pointed out by Martin et al. (2018) and Laporte et al. (2018), large uncertainties remain in estimating the dynamical mass profile of NGC1052-DF2 due to the lack of tracers. While stellar streams have not been detected around NGC1052-DF2 so far, ones might be found and contribute to provide better mass constraints. More detailed studies would provide predictions for the detectability and distribution of possible stellar streams and test the validity of the formation scenario of NGC1052-DF2 considered in this Letter.
Acknowledgements
GO acknowledges the constructive comments from the referees helped to greatly improve this Letter and thanks Oliver Hahn and Frank van den Bosch for careful reading of the draft. GO was supported by funding from the European Research Council (ERC) under the European Union’s Horizon 2020 research and innovation programme (grant agreement No. 679145, project ‘COSMO-SIMS’).
References
- Amorisco et al. (2018) Amorisco N. C., Monachesi A., Agnello A., White S. D. M., 2018, MNRAS, 475, 4235
- Barnes & Hut (1986) Barnes J., Hut P., 1986, Nature, 324, 446
- Behroozi et al. (2013) Behroozi P. S., Wechsler R. H., Conroy C., 2013, ApJ, 770, 57
- Bothun et al. (1987) Bothun G. D., Impey C. D., Malin D. F., Mould J. R., 1987, AJ, 94, 23
- Burkert (1995) Burkert A., 1995, ApJ, 447, L25
- Carleton et al. (2018) Carleton T., Errani R., Cooper M., Kaplinghat M., Peñarrubia J., 2018, preprint, (arXiv:1805.06896)
- Chandrasekhar (1943) Chandrasekhar S., 1943, ApJ, 97, 255
- Dalcanton et al. (1997) Dalcanton J. J., Spergel D. N., Gunn J. E., Schmidt M., Schneider D. P., 1997, AJ, 114, 635
- Di Cintio et al. (2014) Di Cintio A., Brook C. B., Macciò A. V., Stinson G. S., Knebe A., Dutton A. A., Wadsley J., 2014, MNRAS, 437, 415
- Eddington (1916) Eddington A. S., 1916, MNRAS, 76, 572
- Errani et al. (2015) Errani R., Peñarrubia J., Tormen G., 2015, MNRAS, 449, L46
- Errani et al. (2017) Errani R., Peñarrubia J., Laporte C. F. P., Gómez F. A., 2017, MNRAS, 465, L59
- Fernández-Ontiveros et al. (2011) Fernández-Ontiveros J. A., López-Sanjuan C., Montes M., Prieto M. A., Acosta-Pulido J. A., 2011, MNRAS, 411, L21
- Forbes et al. (2017) Forbes D. A., Sinpetru L., Savorgnan G., Romanowsky A. J., Usher C., Brodie J., 2017, MNRAS, 464, 4611
- Fosbury et al. (1978) Fosbury R. A. E., Mebold U., Goss W. M., Dopita M. A., 1978, MNRAS, 183, 549
- Governato et al. (2010) Governato F., et al., 2010, Nature, 463, 203
- Hernquist (1990) Hernquist L., 1990, ApJ, 356, 359
- Impey & Bothun (1997) Impey C., Bothun G., 1997, ARA&A, 35, 267
- Jiang et al. (2015) Jiang L., Cole S., Sawala T., Frenk C. S., 2015, MNRAS, 448, 1674
- Karachentsev et al. (2000) Karachentsev I. D., Karachentseva V. E., Suchkov A. A., Grebel E. K., 2000, A&AS, 145, 415
- Kazantzidis et al. (2006) Kazantzidis S., Zentner A. R., Kravtsov A. V., 2006, ApJ, 641, 647
- Khochfar & Burkert (2006) Khochfar S., Burkert A., 2006, A&A, 445, 403
- Koda et al. (2015) Koda J., Yagi M., Yamanoi H., Komiyama Y., 2015, ApJ, 807, L2
- Lange et al. (2015) Lange R., et al., 2015, MNRAS, 447, 2603
- Laporte et al. (2018) Laporte C. F. P., Agnello A., Navarro J. F., 2018, preprint, (arXiv:1804.04139)
- Ludlow et al. (2016) Ludlow A. D., Bose S., Angulo R. E., Wang L., Hellwing W. A., Navarro J. F., Cole S., Frenk C. S., 2016, MNRAS, 460, 1214
- Martin et al. (2018) Martin N. F., Collins M. L. M., Longeard N., Tollerud E., 2018, preprint, (arXiv:1804.04136)
- McGaugh & Bothun (1994) McGaugh S. S., Bothun G. D., 1994, AJ, 107, 530
- Mihos et al. (2015) Mihos J. C., et al., 2015, ApJ, 809, L21
- Moore (1994) Moore B., 1994, Nature, 370, 629
- Moster et al. (2013) Moster B. P., Naab T., White S. D. M., 2013, MNRAS, 428, 3121
- Navarro et al. (1997) Navarro J. F., Frenk C. S., White S. D. M., 1997, ApJ, 490, 493
- Oñorbe et al. (2015) Oñorbe J., Boylan-Kolchin M., Bullock J. S., Hopkins P. F., Kereš D., Faucher-Giguère C.-A., Quataert E., Murray N., 2015, MNRAS, 454, 2092
- Ogiya & Mori (2014) Ogiya G., Mori M., 2014, ApJ, 793, 46
- Ogiya et al. (2013) Ogiya G., Mori M., Miki Y., Boku T., Nakasato N., 2013, in Journal of Physics Conference Series. p. 012014, doi:10.1088/1742-6596/454/1/012014
- Oman et al. (2015) Oman K. A., et al., 2015, MNRAS, 452, 3650
- Papastergis et al. (2017) Papastergis E., Adams E. A. K., Romanowsky A. J., 2017, A&A, 601, L10
- Peñarrubia et al. (2010) Peñarrubia J., Benson A. J., Walker M. G., Gilmore G., McConnachie A. W., Mayer L., 2010, MNRAS, 406, 1290
- Peirani et al. (2017) Peirani S., et al., 2017, MNRAS, 472, 2153
- Pierce et al. (2005) Pierce M., Brodie J. P., Forbes D. A., Beasley M. A., Proctor R., Strader J., 2005, MNRAS, 358, 419
- Planck Collaboration et al. (2016) Planck Collaboration et al., 2016, A&A, 594, A13
- Pontzen & Governato (2012) Pontzen A., Governato F., 2012, MNRAS, 421, 3464
- Power et al. (2003) Power C., Navarro J. F., Jenkins A., Frenk C. S., White S. D. M., Springel V., Stadel J., Quinn T., 2003, MNRAS, 338, 14
- Read et al. (2016) Read J. I., Iorio G., Agertz O., Fraternali F., 2016, MNRAS, 462, 3628
- Sandage & Binggeli (1984) Sandage A., Binggeli B., 1984, AJ, 89, 919
- Sérsic (1963) Sérsic J. L., 1963, Boletin de la Asociacion Argentina de Astronomia La Plata Argentina, 6, 41
- Sifón et al. (2018) Sifón C., van der Burg R. F. J., Hoekstra H., Muzzin A., Herbonnet R., 2018, MNRAS, 473, 3747
- Teyssier et al. (2013) Teyssier R., Pontzen A., Dubois Y., Read J. I., 2013, MNRAS, 429, 3068
- Toloba et al. (2018) Toloba E., et al., 2018, ApJ, 856, L31
- Trujillo et al. (2017) Trujillo I., Roman J., Filho M., Sánchez Almeida J., 2017, ApJ, 836, 191
- Trujillo et al. (2018) Trujillo I., et al., 2018, preprint, (arXiv:1806.10141)
- Turner et al. (1993) Turner J. A., Phillipps S., Davies J. I., Disney M. J., 1993, MNRAS, 261, 39
- Wetzel (2011) Wetzel A. R., 2011, MNRAS, 412, 49
- White & Rees (1978) White S. D. M., Rees M. J., 1978, MNRAS, 183, 341
- Woo & Urry (2002) Woo J.-H., Urry C. M., 2002, ApJ, 579, 530
- Yagi et al. (2016) Yagi M., Koda J., Komiyama Y., Yamanoi H., 2016, ApJS, 225, 11
- van Dokkum et al. (2015) van Dokkum P. G., Abraham R., Merritt A., Zhang J., Geha M., Conroy C., 2015, ApJ, 798, L45
- van Dokkum et al. (2016) van Dokkum P., et al., 2016, ApJ, 828, L6
- van Dokkum et al. (2018a) van Dokkum P., et al., 2018a, preprint, (arXiv:1806.04685)
- van Dokkum et al. (2018b) van Dokkum P., et al., 2018b, Nature, 555, 629
- van Gorkom et al. (1986) van Gorkom J. H., Knapp G. R., Raimond E., Faber S. M., Gallagher J. S., 1986, AJ, 91, 791
- van den Bosch & Ogiya (2018) van den Bosch F. C., Ogiya G., 2018, MNRAS, 475, 4066
- van den Bosch et al. (2018) van den Bosch F. C., Ogiya G., Hahn O., Burkert A., 2018, MNRAS, 474, 3043
- van der Burg et al. (2017) van der Burg R. F. J., et al., 2017, A&A, 607, A79