Hyperheavy nuclei: existence and stability
Abstract
What are the limits of the existence of nuclei? What are the highest proton numbers at which the nuclear landscape and periodic table of chemical elements cease to exist? These deceivably simple questions are difficult to answer especially in the region of hyperheavy () nuclei. We present the covariant density functional study of different aspects of the existence and stability of hyperheavy nuclei. For the first time, we demonstrate the existence of three regions of spherical hyperheavy nuclei centered around (), () and () which are expected to be reasonably stable against spontaneous fission. The triaxiality of the nuclei plays an extremely important role in the reduction of the stability of hyperheavy nuclei against fission. As a result, the boundaries of nuclear landscape in hyperheavy nuclei are defined by spontaneous fission and not by the particle emission as in lower nuclei. Moreover, the current study suggests that only localized islands of stability can exist in hyperheavy nuclei.
keywords:
Hyperheavy nuclei , covariant density functional theory , fission


The investigation of superheavy elements (SHE) remains one of the most important sub-fields of low-energy nuclear physics [1]. The element Og with proton number is the highest element observed so far [2]. Although future observation of the elements in the vicinity of seems to be feasible, this is not a case for the elements with beyond 122. Considering also that the highest in spherical shell closure in SHE is predicted at in Skyrme density functional theory (DFT) [3], it is logical to name the nuclei with as hyperheavy [4, 5]. The properties of such nuclei are governed by increased Coulomb repulsion and single-particle level density; these factors reduce the localization of shell effects in particle number [5].

Although hyperheavy nuclei have been studied both within DFTs [4, 5, 6, 7, 8, 9] and phenomenological [10, 11, 12] approaches, the majority of these studies have been performed only for spherical shapes of the nuclei. This is a severe limitation which leads to misinterpretation of physical situation in many cases since there is no guarantee that spherical minimum in potential energy surface exist even in the nuclei with relative large spherical shell gaps (see discussion in Ref. [13]). In addition, the stability of hyperheavy nuclei against spontaneous fission could not be established in the calculations restricted to spherical shape. The effects of axial and triaxial deformations in hyperheavy nuclei are considered only in Refs. [6, 14] and in Ref. [8, 15], respectively. However, only few nuclei are studied in Refs. [6, 14, 15] and according to the present study the deformation range employed in Ref. [8] is not sufficient for nuclei.
The investigation of hyperheavy nuclei is also intimately connected with the establishments of the limits of both the nuclear landscape and periodic table of elements. The limits of nuclear landscape at the proton and neutron drip lines and related theoretical uncertainties have been extensively investigated in a number of theoretical frameworks but only for the nuclei [16, 17, 18]. The atomic relativistic Hartree-Fock [19] and relativistic Multi-Configuration Dirac-Fock [20, 21] calculations indicate that the periodic table of elements terminates at and , respectively. However, at present it is not even clear whether such nuclei are stable against fission. In addition, Refs. [19, 20, 21] employ phenomenological expression for charge radii and its validity for the nuclei is not clear.
To address these deficiencies in our understanding of hyperheavy nuclei the systematic investigation of even-even nuclei from up to is performed within the axial relativistic Hartree-Bogoliubov (RHB) framework employing the DD-PC1 covariant energy density functional [22]. This functional provides good description of the ground state and fission properties of known even-even nuclei [18, 23]. To establish the stability of nuclei with respect to triaxial distortions a number of nuclei have been studied within the triaxial RHB [24] and relativistic mean field + BCS (RMF+BCS) [25] frameworks. The main goals of this study are (i) to understand whether the nuclei stable against fission could be present in the region and (ii) to define the most important features of such nuclei.
The CDFT calculations are performed within the relativistic Hartree-Bogoliubov framework [26] employing the state-of-the-art covariant energy density functionals the global performance of which with respect to the description of the ground state [13, 18, 27] and fission [23, 24, 25, 28] properties is well established. These functionals (DD-PC1 [22], DD-ME2 [29], PC-PK1 [30] and NL3* [31]) represent the major classes of covariant density functional models [18]. The absolute majority of the calculations employ the DD-PC1 functional which is considered to be the best relativistic functional today based on systematic and global studies of different physical observables [13, 18, 24, 27, 28, 32]. Other functionals are used to assess the systematic theoretical uncertainties in the predictions of the heights of fission barriers around spherical minima. To avoid the uncertainties connected with the definition of the size of the pairing window [33], we use the separable form of the finite-range Gogny pairing interaction introduced in Ref. [34].
The truncation of the basis is performed in such a way that all states belonging to the major shells up to fermionic shells for the Dirac spinors (and up to bosonic shells for the meson fields in meson exchange functionals) are taken into account. The comparison of the axial RHB calculations with and shows that in 208Pb the truncation of basis at provides sufficient accuracy for all deformations of interest. However, in hyperheavy nuclei the required size of the basis depends both on the nucleus and deformation range of interest. The basis is sufficient for the description of deformation energy curves in the region of . The deformation ranges and typically require (low- and low- hyperheavy nuclei) or (high- and high- hyperheavy nuclei). Even more deformed ground states with are seen in high-/high- hyperheavy nuclei (see Figs. 1c and d for the and 426176 results); their description requires . Thus, the truncation of basis is made dependent on the nucleus and typical profile of deformation energy curves or potential energy surfaces.
The deformation parameters and are extracted from respective quadrupole moments:
| (1) | |||||
| (2) |
via
| (3) | |||||
| (4) |
where . Note that and in axially symmetric RHB calculations. The and values have a standard meaning of the deformations of the ellipsoid-like density distributions only for values. At higher values they should be treated as dimensionless and particle normalized measures of the and moments. This is because of the presence of toroidal shapes at large negative values and of necking degree of freedom at large positive values. Note that physical observables are frequently shown as a function of the and moments. However, from our point of view such way of presentation has a disadvantage that the physical observables of different nuclei related to the shape of the density distributions (such as deformations) are difficult to compare because the and moments depend on particle number(s).
For each nucleus under study, the deformation energy curves in the range are calculated in the axial reflection symmetric RHB framework [18]; such large range is needed for a reliable definition of the value of the lowest in energy minimum for axial symmetry (LEMAS). This LEMAS becomes the ground state if the higher order deformations (triaxial, octupole) do not lead to the instability of these minima. The nuclei up to are calculated using the basis with up to 26.
On the contrary, with the exception of the and 426176 nuclei, the nuclei are calculated only with . The major goals of the calculations for the nuclei are (i) to define the type of the LEMAS states, (ii) to find whether spherical or normal deformed states could be the LEMAS states of these nuclei and (iii) to calculate the fission barriers around spherical states.
The required size of the basis limits the applicability of triaxial calculations to typically range. The nuclei with the ground states located at the deformations below are calculated in triaxial RHB framework [24], while a pair of nuclei with local minima at corresponding to toroidal shapes were calculated in triaxial RMF+BCS framework [25]. The later framework is more numerically stable at very large values. Because of high computational cost of the calculations with triaxiality included, only limited number of nuclei were studied in these frameworks. The role of octupole deformation in the nuclei shown in Fig. 6 has been studied in the axial reflection asymmetric RHB code of Ref. [32]. These calculations are performed with .
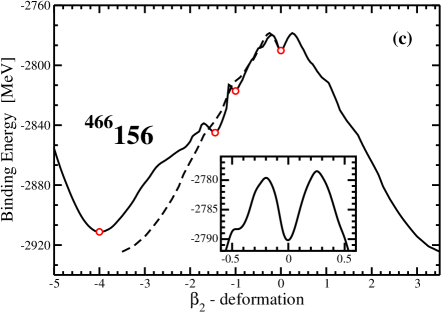
Fig. 1 illustrates the dependence of the deformation energy curves, obtained in axial RHB calculations, on the nucleus. The 208Pb nucleus is spherical in the ground state. The total energy of the nucleus is increasing rapidly with increasing oblate deformation. On the prolate side, it increases with the increase of quadrupole deformation up to and then stays more or less constant. This leads to the existence of high ( MeV) and very broad fission barrier which is responsible for the stable character of this nucleus.
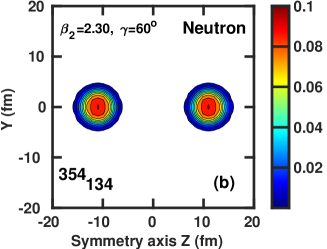
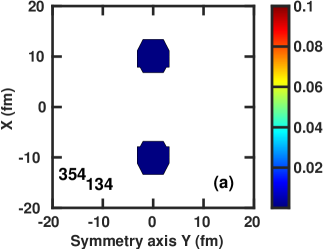
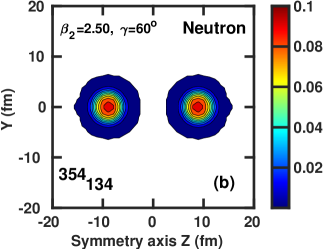
The nucleus shows completely different profile of the deformation energy curves (Fig. 1b). The LEMAS is located at and the deformation energy curves on the oblate side are more flat in energy as compared with 208Pb. The fission barrier for the minimum is rather high ( MeV) and broad (Fig. 1b) which would suggest high stability of this nucleus against fission if the nucleus would stay axially symmetric. Note that at values there are two solutions; the one shown by solid line has and another (which appear only in triaxial calculations at ) shown by dotted line has . The minima of these two solutions appear at . The former solution is characterized by toroidal shapes (see supplementary Fig. 1), while the latter one by double banana shapes connected by low density links (see supplementary Fig. 2). The solution is lower in energy in a number of nuclei around the nucleus but it is unstable with respect to triaxial distortions (see discussion below). Thus, in considering the shapes with we focus on toroidal shapes with positive which are potentially stable with respect to triaxial distortions. In the nucleus, the minimum of this solution with is located at 4.2 MeV excitation energy with respect to the minimum.
Further increase of proton number leads to drastic modifications of the deformation energy curves. In the and nuclei, the minimum appears at extreme values. However, these minima are potentially unstable with respect to the transition to the prolate shape via -plane and subsequent fission since prolate shapes with corresponding quadrupole deformations are located at lower energies (compare dashed lines with solid ones in Figs. 1c and d). Note also that in the nucleus there are excited local and spherical minima which could be potentially stable against fission.
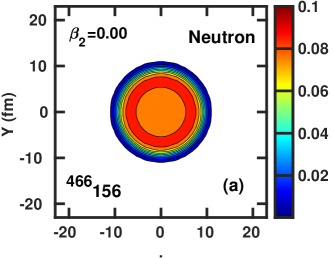
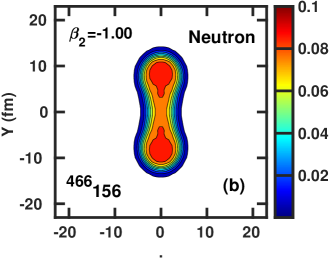
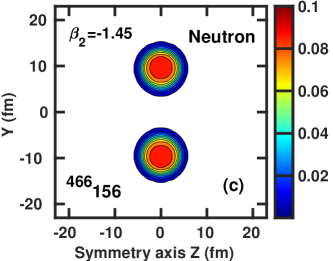
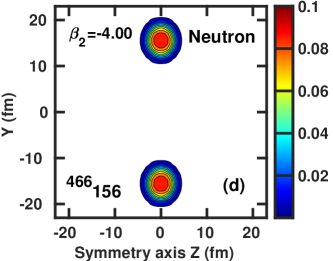
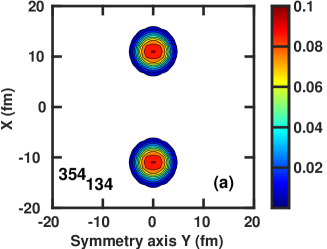
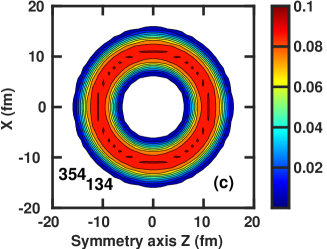
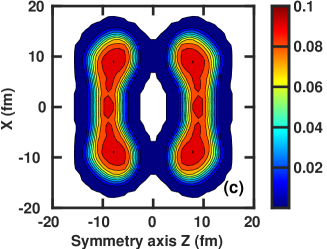
The evolution of the neutron density distributions with the change of the value are shown for the 466156 nucleus in Fig. 2. The nucleus at spherical shape is characterized by the density depression in the central part of the nucleus; the maximum neutron density fm-3 is achieved at radial coordinate fm while the density in the center is only fm-3. This depression is similar (but less pronounced) to the one predicted for the superheavy nucleus in Refs. [3, 35]. Our calculations show neither bubble nor semi-bubble shapes (in the language of Ref. [4]) for the lowest in energy solutions of spherical nuclei shown in Fig. 6 below. Note that proton density is roughly half of the neutron one and central density depression is somewhat more pronounced in proton subsystem as compared with neutron one. As illustrated in Fig. 2b, biconcave disk density distribution is formed at large oblate deformation of . Further decrease of the values leads to the formation of toroidal shapes (Figs. 2c and d). It is observed that with the increase of absolute value of the radius of the toroid increases and the tube radius decreases.
The biconcave disk and toroidal shapes in atomic nuclei have been investigated in a number of the papers [14, 15, 37, 38, 36, 39]. However, in absolute majority of the cases such shapes correspond to highly excited states either at spin zero [15, 36] or at extreme values of angular momentum [37, 38, 40]. The latter substantially exceed the values of angular momentum presently achievable at the state-of-art experimental facilities [41]. The competition of such shapes at spin zero in superheavy even-even isotopes with and in the even-even isotones with has been investigated in constrained Skyrme-HFB calculations in Ref. [36]. It was concluded that investigated nuclei in toroidal shapes are unstable against returning to the shape of sphere-like geometry (Ref. [36]). Similar study for superheavy 316122, 340130, 352134 and 364138 nuclei has been performed in Skyrme Hartree-Fock calculations of Ref. [15]; only in 364138 nuclei the toroidal solution is the lowest in energy. The Gogny HFB calculations of Ref. [14] showed that toroidal shapes represent the lowest in energy solutions at axial shape in the and nuclei.
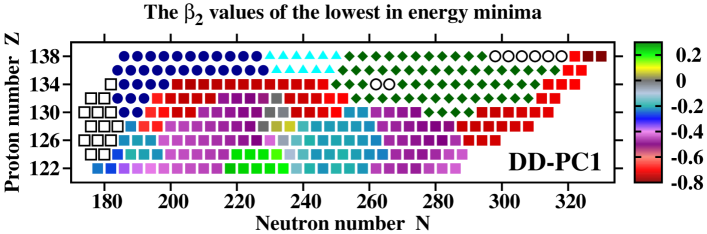
Fig. 3 presents the systematics of the values for the lowest in energy minima for axial symmetry obtained in axial RHB calculations for nuclei. Only few spherical nuclei located around are found in the calculations. Prolate deformed nuclei are seen only at and . The rest of the nuclear chart is dominated by oblate or toroidal shapes in the LEMAS. The values of these states depend on the combination of proton and neutron numbers. However, the general trend is that they increase with proton number. The calculations for nuclei beyond are extremely time-consuming due to required increase of the fermionic basis up to . The scan of the deformation energy curves in axial RHB calculations with for the nuclei located between two-proton and two-neutron drip lines does not show the presence of either prolate or spherical LEMAS states; the LEMAS states in all nuclei have toroidal shapes with . However, because of the limited size of the basis these values have to be considered as lower limits (in absolute sense). Thus, for the first time, our systematic calculations show that toroidal shapes should represent the lowest in energy minima of almost all hyperheavy (and some nuclei with lower , see Fig. 3) if axially symmetric solutions are stable with respect of triaxial distortions.
However, it is well known that triaxial deformation lowers the fission barriers in actinides and superheavy nuclei with and [25, 43, 44, 45, 46, 47]. These nuclei are either prolate or spherical in their ground states and thus the impact of triaxiality is limited: for example, the lowering of inner fission barriers in actinides due to triaxiality is typically on the level of 1-3 MeV. On the contrary, the impact of triaxiality on fission barriers gets much more pronounced in the nuclei with ground state oblate shapes and it generally increases with the rise of their oblate deformation. Not only the fission through the -plane gets more energetically favored, but also the fission path through -plane becomes much shorter than the one through the axis.
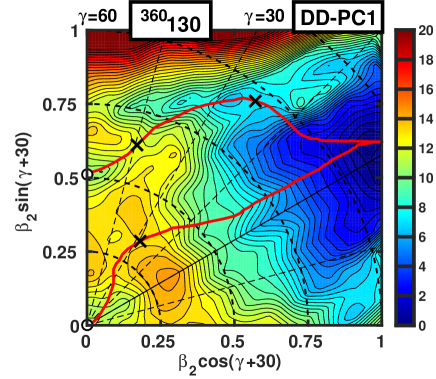
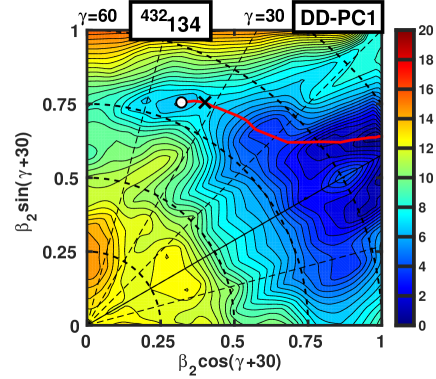
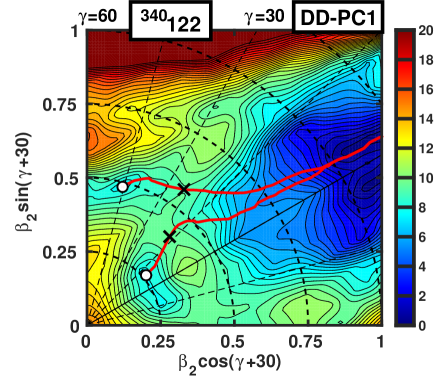
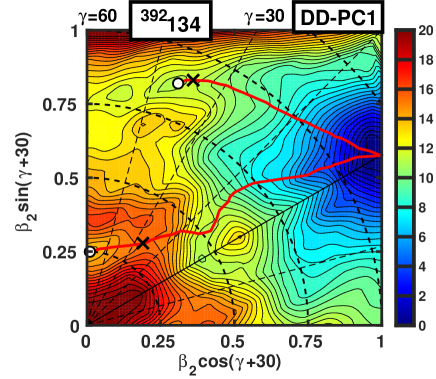
These features are illustrated in Fig. 4. The 360130 nucleus is an example of the coexistence of spherical ground state and excited (at 0.8 MeV) oblate (with ) minimum. The static fission paths from these minima are comparable in length and both of them have reduced (by MeV) inner fission barriers as compared with axial RHB calculations (see supplementary Table 1). The effect of the reduction of inner fission barrier due to triaxiality becomes much more pronounced in the nucleus. As compared with axial calculations, the presence of triaxiality leads to the shift of minimum from () to () and the reduction of the fission barrier height from 8.16 MeV to 1.30 MeV. The 340122 nucleus is an example of the coexistence of the ground state oblate and slightly excited (by 0.72 MeV) prolate minima in axial RHB calculations which have fission barriers at 5.74 and 3.19 MeV, respectively (see supplementary Table 1). The triaxiality leads to the -softness of potential energy surfaces so that these minima drift in the -plane by . However, it also leads to substantial reduction of fission barrier heights down to MeV (see supplementary Table 1). In axial RHB calculations, the 392134 nucleus has superdeformed oblate ground state with and highly excited (at excitation energy of 2.69 MeV) oblate state with . The fission barriers for these two minima are 10.24 and 7.55 MeV, respectively. The triaxiality substantially affects the position of first minimum so it drifts to but has almost no effect on the second minimum. However, it has huge impact on the heights of their fission barriers which are reduced to 0.56 and 2.08 MeV, respectively (see supplementary Table 1).
Supplementary Table 1 summarizes the results of more systematic triaxial RHB calculations. The general conclusion is that the barriers along the fission paths emerging from the oblate minima located within the range decrease with increasing proton number. As a result, the majority of these nuclei would be unstable with respect to fission. Similar trend of the evolution of fission barriers with proton number has also been seen in microscopic+macroscopic (mic+mac) calculations with Woods-Saxon potential and Skyrme DFT calculations with the SLy4 functional presented in Ref. [8]. Note that these calculations use smaller deformation plane (ranging from up to ) as compared with the one shown in Fig. 4 . The Skyrme DFT calculations provide higher fission barriers as compared with mic+mac and our RHB results. However, the SLy4 functional substantially overestimates fission barriers in actinides and SHE [8].
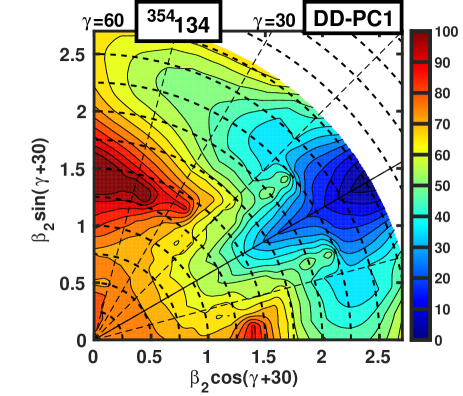
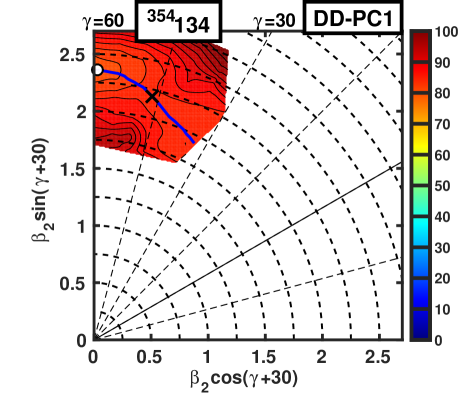
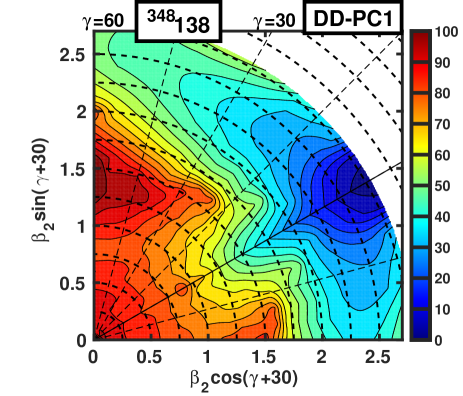
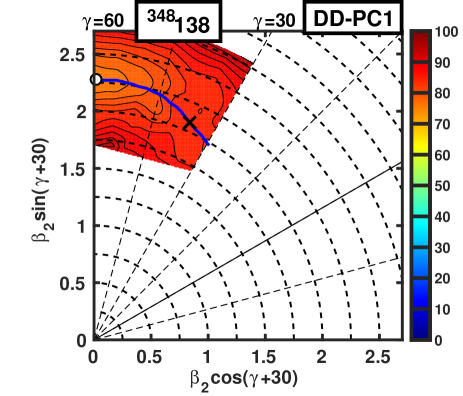
The situation however is substantially complicated by the fact that with increasing proton number toroidal shapes correspond to the lowest in energy solutions in axial RHB calculations (Fig. 3). Their large values and high and values require increased basis which makes triaxial RHB and RMF+BCS calculations prohibitively time consuming. A priori we cannot exclude the stability of such shapes against fission or multifragmentation. This is illustrated by the calculations of the (Fig. 5) and (supplementary Fig. 3) nuclei, for which the basis provides acceptable numerical accuracy. In these nuclei, the oblate minimum with is unstable with respect to triaxial distortions (left panels of these figures). On the contrary, the excited minimum is stable with respect to triaxial distortions (see right panels of Fig. 5 and supplementary Fig. 3).
The triaxial RHB calculations for the part of the deformation plane clearly indicate the general trend of the reduction of the stability of the minima located at these deformations with respect to fission with increasing proton number. The triaxial RMF+BCS calculations also indicate the potential stability of toroidal shapes located in the minima with with . Unfortunately, the systematic triaxial calculations of the stability of such minima are beyond available computational power. Thus, their more detailed investigation is left for future.
Note also that toroidal nuclei are expected to be unstable against multifragmentation [42, 51]. The most detailed investigation of the instabilities of toroidal nuclei with respect of so-called breathing and sausage deformations has been performed in Ref. [51]. The breathing deformation preserves the azimuthal symmetry of the torus and it is defined by the radius of torus and the radius of its tube. In our calculations, this type of deformation is related to the values (see discussion of Fig. 2 above). The results of Ref. [51] clearly indicate the stability of toroidal nuclei with respect of breathing deformation both in liquid-drop model calculations and in Strutinsky type calculations. This is also the case in our calculations which show minima at large negative values in deformation energy curves presented as a function of (see Fig. 1b,c, and d). The sausage deformations make a torus thicker in one section(s) and thinner in another section(s); they are examplified by the density distributions shown in supplementary Fig. 2. The analysis of Ref. [51] clearly indicates the instability of toroidal nuclei with respect of sausage deformations in the liquid drop model. However, it was not excluded in Ref. [51] that the instability in the sausage degree of freedom may be counterbalanced by shell effects at some combinations of proton and neutron numbers and deformations. The situation here is similar to superheavy nuclei which are unstable in liquid drop model. The instability with respect of sausage deformations has not been studied so far in either Strutinsky type models [51] or in density functional theories. However, our results for the solutions in the 354134 and 348138 nuclei show for the first time this type of instability also in the framework which takes shell effects into account.
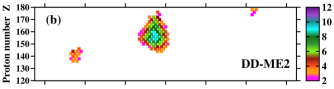
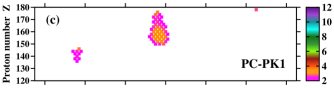
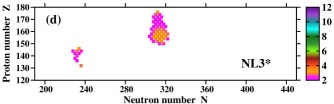
The analysis of the deformation energy curves obtained in axial RHB calculations reveals that hyperheavy nuclei could be stabilized at spherical shapes in some regions (see the insert to Fig. 1c). If the toroidal shapes in these nuclei are unstable against triaxial distortions or multifragmentation, these states represent the ground states. From our point of view, this is the most likely scenario. Otherwise, they are excited states frequently located at high excitation energies (Fig. 1c). It was verified that these spherical states are stable with respect to triaxial and octupole distortions. The largest island of stability of spherical hyperheavy nuclei is centered around (Fig. 6a). In the calculations with the DD-PC1 functional the fission barriers reach 11 MeV for the nuclei located in the center of the island of stability. This is substantially larger than the fission barriers predicted in the CDFT for experimentally observed superheavy nuclei with for which calculated inner fission barriers are around 4-5 MeV [24]. Smaller islands of stability of spherical hyperheavy nuclei are predicted at and (Fig. 6a). Since nuclei in these three regions have they cannot be formed in laboratory conditions. The only possible environment in which they can be produced is the ejecta of the mergers of neutron stars [48].
Additional calculations have been performed with the DD-ME2 [29], PC-PK1 [30] and NL3* [31] functionals in order to evaluate systematic theoretical uncertainties [49] in the predictions of fission barriers for spherical hyperheavy nuclei. The DD-ME2 functional provides predictions comparable with the DD-PC1 one (Fig. 6a,b). In contrast, the PC-PK1 and NL3* functionals predict lower fission barriers and smaller regions of stability (Fig. 6c,d). Note that the nuclear matter properties and the density dependence are substantially better defined for density-dependent (DD*) functionals as compared with non-linear NL3* and PC-PK1 ones [27]. As a consequence, they are expected to perform better for large extrapolations from known regions. The large fission barriers obtained in the density-dependent functionals will lead to substantial stability of spherical hyperheavy nuclei against spontaneous fission. This stability is substantially lower for the NL3* and PC-PK1 functionals.
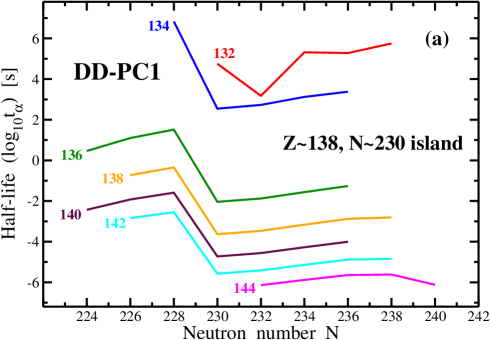
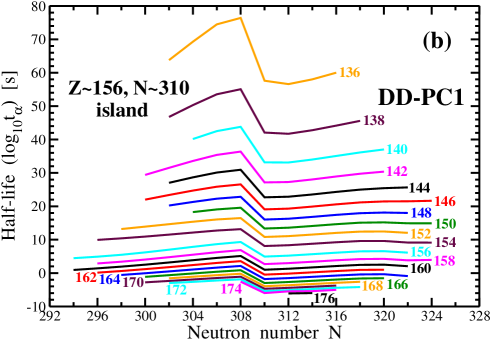
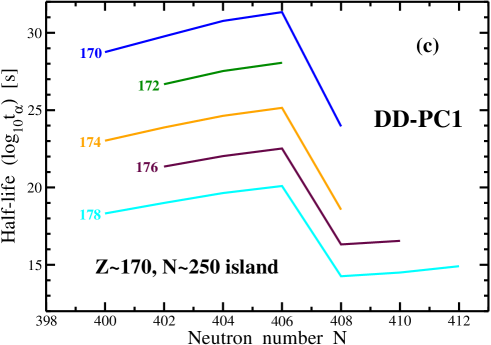
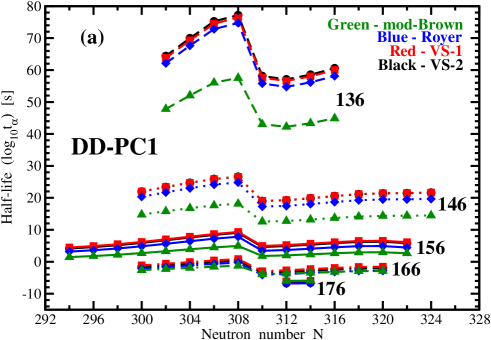
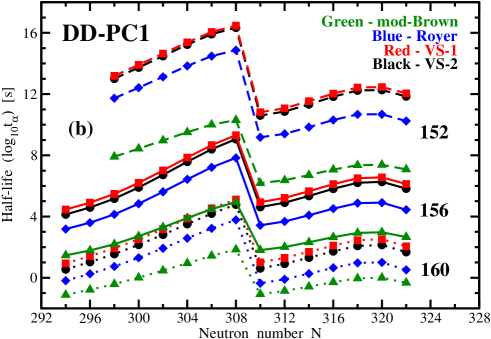
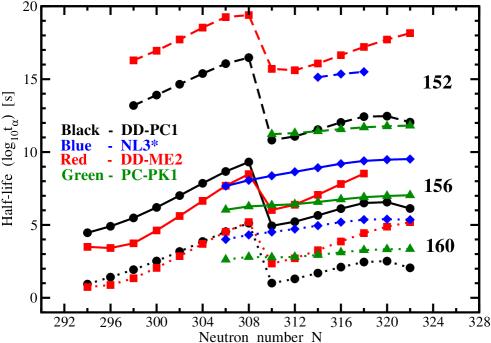
Note that these spherical states are also relatively stable against -decay (see supplementary Fig. 4). Theoretical uncertainties in the predictions of the -decay half-lives due to the use of different empirical formulas for their calculations and the CEDFs are evaluated for the region of spherical hyperheavy nuclei in supplementary Figs. 5 and 6, respectively. One can see that when combined these uncertainties could reach 10 orders of magnitude in the center of region. However, even with these uncertainties accounted the -decay half-lives of many nuclei are substantial exceeding seconds, hours and days ranges. Considering empirical nature of the formulas employed more microscopic studies of the -decay half-lives would be highly desirable. It is also important in future to investigate other competing decay modes such as cluster [52, 53] and [54, 55] decays to fully establish the potential stability of spherical hyperheavy nuclei.
Existing atomic calculations suggest that the periodic table of elements ends at [19, 20, 21]; this takes place when the electron binding energy dives below . However, these calculations employ the empirical formulas for the root-mean-square (RMS) nuclear charge radii. For example, the calculations of Ref. [19] employ the formula from Ref. [50] which underestimates the RMS nuclear charge radii as compared with the ones obtained in the RHB calculations. This is exemplified by the values of RMS nuclear charge radii in the , and nuclei which are 6.52 fm (6.91 fm), 7.10 fm (7.576 fm), 7.62 fm (8.312 fm) in the calculations with empirical formula of Ref. [50] (the RHB calculations with DD-PC1). Note that these nuclei represent the centers of the islands of stability of spherical hyperheavy nuclei (see Fig. 6a). Unfortunately, the impact of nuclear size changes on atomic properties and thus on the end of periodic table of elements has not been investigated in Refs. [19, 20, 21]. However, these differences in the RMS nuclear charge radii are substantial and new atomic calculations are needed to see how they can affect the end of periodic table of elements.
In summary, covariant density functional studies have been performed for superheavy and hyperheavy nuclei with proton numbers . In axial RHB calculations the nuclear landscape in the region is dominated by oblate shapes with deformation of , while all nuclei have toroidal shapes in the lowest in energy minima. The inclusion of triaxiality leads to the instability against fission via triaxial plane of the absolute majority of the nuclei the ground states deformations of which lie in the range . The potential stability against triaxial distortions of toroidal shapes located in the minima with has been exemplified by the 354134 and nuclei. However, systematic triaxial calculations for such nuclei are beyond available computational resources and thus the question of the stability of toroidal shapes in the nuclei remains open. The calculations indicate three regions of potentially stable spherical hyperheavy nuclei centered around (), () and (). However, theoretical systematic uncertainties in the predictions of their fission barriers are substantial. These results clearly indicate that the boundaries of nuclear landscape in hyperheavy nuclei are defined by spontaneous fission and not by particle emission as in lower nuclei. Moreover, the current study suggests that only localized islands of stability can exist in hyperheavy nuclei.
1 Acknowledgements
This material is based upon work supported by the Department of Energy National Nuclear Security Administration under Award No. DE-NA0002925 and by the US Department of Energy, Office of Science, Office of Nuclear Physics under Award No. DE-SC0013037.
References
- [1] Yu. Ts. Oganessian and V. K. Utyonkov, Rep. Prog. Phys. 78, 036301 (2015).
- [2] Yu. Ts. Oganessian et all, Phys. Rev. Lett. 109, 162501 (2012).
- [3] M. Bender, K. Rutz, P.-G. Reinhard, J. A. Maruhn and W. Greiner, Phys. Rev. C 60, 034304 (1999).
- [4] J. Dechargé, J.-F. Berger, K. Dietrich and M.S. Weiss, Phys. Lett. B 451, 275 (1999).
- [5] M. Bender, W. Nazarewicz and P.-G. Reinhard, Phys. Lett. B 515, 42 (2001).
- [6] J. F. Berger, L. Bitaud, J. Dechargé, M. Girod and K. Dietrich, Nucl. Phys. A 685, 1c (2001).
- [7] W. Zhang, J. Meng, S. Q. Zhang, L. S. Geng and H. Toki, Nucl. Phys. A 753, 106 (2005).
- [8] W. Brodziński and J. Skalski, Phys. Rev. C 88, 044307 (2013).
- [9] Y. K. Gambhir, A. Bhagwat and M. Gupta, J. Phys. G 42, 125105 (2015).
- [10] K. Dietrich and K. Pomorski, Phys. Rev. Lett. 80, 34 (1998).
- [11] V. Yu. Denisov, Phys. At. Nuclei, 68, 1133 (2005).
- [12] M. Ismail, A. Y. Ellithi, A. Adel and H. Anwer, J. Phys. G. 43, 015101 (2016).
- [13] S. E. Agbemava, A. V. Afanasjev, T. Nakatsukasa, and P. Ring, Phys. Rev. C 92, 054310 (2015).
- [14] M. Warda, Int. J. Mod. Phys. E 16, 452 (2007).
- [15] A. Staszczak and C. Y. Wong, Acta Phys. Pol. 40, 753 (2009).
- [16] J. Erler et al, Nature, 486, 509 (2012).
- [17] A. V. Afanasjev, S. E. Agbemava, D. Ray and P. Ring, Phys. Lett. B 726, 680 (2013).
- [18] S. E. Agbemava, A. V. Afanasjev, D. Ray and P. Ring, Phys. Rev. C 89, 054320 (2014).
- [19] B. Fricke, W. Greiner and J. T. Waber, Theor. Chim. Acta 21, 235 (1971).
- [20] P. Pyykko, Phys. Chem. Chem. Phys. 13, 161 (2011).
- [21] P. Indelicato, J. Biero and P. Jansson, Theor. Chem. Acc., 129, 495 (2011).
- [22] T. Nikšić, D. Vretenar and P. Ring, Phys. Rev. C 78, 034318 (2008).
- [23] B.-N. Lu, E.-G. Zhao, and S.-G. Zhou, Phys. Rev. C 85, 011301 (2012).
- [24] S. E. Agbemava, A. V. Afanasjev, D. Ray and P. Ring, Phys. Rev. C 95, 054324 (2017).
- [25] H. Abusara, A. V. Afanasjev and P. Ring, Phys. Rev. C 82, 044303 (2010).
- [26] D. Vretenar, A. V. Afanasjev, G. A. Lalazissis and P. Ring, Phys. Rep. 409, 101 (2005).
- [27] A. V. Afanasjev and S. E. Agbemava, Phys. Rev. C 93, 054310 (2016).
- [28] V. Prassa, T. Nikśić, G. A. Lalazissis, and D. Vretenar, Phys. Rev. C 86, 024317 (2012).
- [29] G. A. Lalazissis, T. Nikšić, D. Vretenar and P. Ring, Phys. Rev. C 71, 024312 (2005).
- [30] P. W. Zhao, Z. P. Li, J. M. Yao and J. Meng, Phys. Rev. C 82, 054319 (2010).
- [31] G. A. Lalazissis, S. Karatzikos, R. Fossion, D. Peña Arteaga, A. V. Afanasjev, and P. Ring, Phys. Lett. B 671, 36 (2009).
- [32] S. E. Agbemava, A. V. Afanasjev and P. Ring, Phys. Rev. C 93, 044304 (2016).
- [33] S. Karatzikos, A. V. Afanasjev, G. A. Lalazissis and P. Ring, Phys. Let. B 689, 72 (2010).
- [34] Y. Tian, Z. Y. Ma and P. Ring, Phys. Let. B 676, 44 (2009).
- [35] A. V. Afanasjev and S. Frauendorf, Phys. Rev. C 71, 024308 (2005).
- [36] A. Kosior, A. Staszczak and C.-Y. Wong, Acta Phys. Pol. 10, 249 (2017).
- [37] A. Staszczak and C.-Y. Wong, Phys. Lett. B 738, 401 (2014).
- [38] T. Ichikawa, K. Matsuyanagi, J. A. Maruhn, and N. Itagaki, Phys. Rev. C 90, 034314 (2014)
- [39] W. Nazarewicz, M. Bender, S. Cwiok, P. H. Heenen, A. T. Kruppa, P.-G. Reinhard and T. Vertse”, Nucl. Phys. A 701, 165c (2002).
- [40] A. Staszczak, C.-Y. Wong, and A. Kosior, Phys. Rev. C 95, 054315 (2017).
- [41] A. V. Afanasjev, D. B. Fossan, G. J. Lane and I. Ragnarsson, Phys. Rep. 322, 1 (1999).
- [42] N. T. B. Stone et all, Phys. Rev. Lett. 78, 2084 (1997).
- [43] M. Warda, J. L. Egido, L. M. Robledo and K. Pomorski, Phys. Rev. C 66, 014310 (2002).
- [44] A. Staszczak, A. Baran, J. Dobaczewski, and W. Nazarewicz, Phys. Rev. C 80, 014309 (2009).
- [45] P. Möller et all, Phys. Rev. C 79, 064304 (2009).
- [46] H. Abusara, A. V. Afanasjev and P. Ring, Phys. Rev. C 85, 024314 (2012).
- [47] N. Schunck and L. M. Robledo, Rep. Prog. Phys. 79, 116301 (2016).
- [48] B. P. Abbott et all, Phys. Rev. Lett. 119, 161101 (2017).
- [49] J. Dobaczewski, W. Nazarewicz and P.-G. Reinhard, J. Phys. G 41, 074001 (2014)
- [50] I. Angeli, At. Data Nucl. Data Tables, 87, 185 (2004).
- [51] C. Y. Wong, Annals of Physics 77, 279 (1973)
- [52] D. N. Poenaru, R. A. Gherghescu, and W. Greiner, Phys. Rev. Lett. 107, 062503 (2011).
- [53] D. N. Poenaru, R. A. Gherghescu, and W. Greiner, Phys. Rev. C 85, 034615 (2012).
- [54] T. Marketin, L. Huther, and G. Martínez-Pinedo, Phys. Rev. C 93, 025805 (2016).
- [55] T. Shafer, and J. Engel, C. Fröhlich, G. C. McLaughlin, M. Mumpower, and R. Surman, Phys. Rev. C 94, 055802 (2016).
Supplementary information
| Axial RHB | Triaxial RHB | ||||||
| 1 | 2 | 3 | 4 | 5 | 6 | 7 | 8 |
| 122 | 182 | -0.25 | 0.20 | 5.99 | 0.23,58 | 0.43,35 | 3.10 |
| 202 | -0.43 | 0.04 | 8.18 | 0.43,56 | 0.44,46 | 1.59 | |
| 218 | -0.46 | 0.00 | 5.74 | 0.49,46 | 0.57,24 | 1.75 | |
| 0.25* [0.72] | 0.39 | 3.19 | 0.26,10 | 0.41,17 | 2.05 | ||
| 222 | 0.24 | 0.37 | 4.26 | 0.25,0 | 0.39,25 | 2.62 | |
| -0.48* [2.12] | -0.25 | 3.79 | 0.45,60 | 0.47,36 | 1.15 | ||
| 242 | -0.19 | 0.31 | 4.05 | 0.18,57 | 0.48,31 | 3.07 | |
| 262 | -0.23* | 0.13 | 5.38 | 0.25,58 | 0.33,22 | 1.07 | |
| -0.45 [0.18] | 0.13 | 5.56 | 0.45,51 | 0.47,40 | 1.09 | ||
| 282 | 0.34 | 0.46 | 1.84 | 0.34,0 | 0.41,24 | 1.68 | |
| -0.44* [1.64] | 0.00 | 8.11 | 0.46,38 | 0.52,29 | 0.65 | ||
| 126 | 214 | -0.46 | 0.00 | 8.29 | 0.48,47 | 0.52,37 | 2.05 |
| 234 | -0.05 | 0.33 | 3.85 | 0.15,2 | 0.31,20 | 3.04 | |
| -0.39* [1.34] | 0.33 | 2.51 | 0.40,59 | 0.40,30 | 2.09 | ||
| 254 | -0.21 | 0.22 | 6.16 | 0.23,58 | 0.34,23 | 2.91 | |
| 274 | -0.49 | -0.02 | 8.95 | 0.48,59 | 0.47,53 | 1.86 | |
| 294 | -0.43 | 0.00 | 6.17 | 0.43,56 | 0.46,44 | 0.52 | |
| -0.74 | 0.00 | 6.18 | no | no | no | ||
| 130 | 206 | -0.74 | 0.00 | 8.99 | 0.82,37 | 0.84,31) | 0.68 |
| -0.46* [0.19] | 0.00 | 8.80 | no | no | no | ||
| 226 | -0.50 | -0.25 | 5.22 | 0.50,58 | 0.56,33 | 3.02 | |
| 0.12* [1.69] | 0.33 | 3.44 | 0.15,2 | 0.35,27 | 1.21 | ||
| -0.74* [2.19] | -0.64 | 3.38 | 0.82,37 | 0.83,34 | 0.70 | ||
| 230 | -0.01 | 0.32 | 4.86 | 0.00,0 | 0.34,26 | 2.77 | |
| -0.53* [0.81] | 0.32 | 4.05 | 0.52,55 | 0.63,44 | 2.04 | ||
| 246 | -0.72 | 0.25 | 6.68 | 0.73,59 | 0.75,50 | 0.67 | |
| -0.21* [0.28] | 0.25 | 6.40 | 0.26,58 | 0.47,35 | 3.12 | ||
| 266 | -0.47 | 0.01 | 9.05 | 0.48,59 | 0.48,54 | 0.56 | |
| -0.78* [0.74] | 0.01 | 8.31 | no | no | no | ||
| -0.23* [1.57] | 0.01 | 7.48 | 0.28,33 | 0.34,20 | 0.58 | ||
| 286 | -0.75 | 0.00 | 8.19 | 0.77,40 | 0.75,35 | 1.28 | |
| -0.51* [0.27] | 0.00 | 7.92 | 0.54,51 | 0.57,38 | 1.35 | ||
| 134 | 258 | -0.79 | 0.00 | 10.24 | 0.88,39 | 0.90,37 | 0.56 |
| -0.23* [2.69] | 0.00 | 7.55 | 0.25,58 | 0.33,25 | 2.08 | ||
| 278 | -0.50 | 0.07 | 10.68 | 0.51,56 | 0.52,49 | 1.54 | |
| -0.79* [0.17] | 0.07 | 10.51 | 0.79,38 | 0.79,33 | 2.56 | ||
| 298 | -0.74 | -0.21 | 8.16 | 0.82,37 | 0.85,32 | 1.30 | |
| 318 | -0.71 | 0.28 | 11.59 | 0.71,59 | 0.78,47 | 1.37 | |
References
- [1] V. E. Viola, Jr. and G. T. Seaborg, Nuclear systematics of the heavy elements — II. Lifetimes for alpha, beta and spontaneous fission decay, J. Inorg. Nucl. Chem. 28, 741 (1966).
- [2] T. Dong and Z. Ren, New calculations of -decay half-lives by the Viola-Seaborg formula, Eur. Phys. J. A26, 69 (2005).
- [3] A. Sobiczewski, Z. Patyk, and S. Cwiok, Deformed superheavy nuclei, Phys. Lett. B 224, 1 (1989).
- [4] A. I. Budaca, R. Budaca, and I. Silisteanu, Extended systematics of alpha decay half lives for exotic superheavy nuclei, Nucl. Phys. A 951, 60 (2016).
- [5] G. Royer, Alpha emission and spontaneous fission through quasi-molecular shapes, J. Phys. G: Nucl. Part. Phys. 26, 1149 (2000).
- [6] S. E. Agbemava, A. V. Afanasjev, T. Nakatsukasa, and P. Ring, Covariant density functional theory: Reexamining the structure of superheavy nuclei, Phys. Rev. C 92, 054310 (2015).