SOLAR RADIO BURST ASSOCIATED WITH THE FALLING BRIGHT EUV BLOB
Abstract
At the beginning of the 4 November 2015 flare, in the 1300 – 2000 MHz frequency range, we observed a very rare slowly positively drifting burst. We searched for associated phenomena in simultaneous EUV observations made by IRIS, SDO/AIA, Hinode/XRT and in Hα observations. We found that this radio burst was accompanied with the bright blob, visible at transition region, coronal, and flare temperatures, falling down to the chromosphere along the dark loop with the velocity of about 280 km s-1. The dark loop was visible in Hα but disappeared afterwards. Furthermore, we found that the falling blob interacted with the chromosphere as expressed by a sudden change of the Hα spectra at the location of this interaction. Considering different possibilities we propose that the observed slowly positively drifting burst is generated by the thermal conduction front formed in front of the falling hot EUV blob.
1 INTRODUCTION
It is commonly known that a plasma in solar flares is rapidly heated, e.g. by the magnetic field reconnection. In single loop models of solar flares or in loops of the flare arcade the plasma may be heated at tops of the loops. Such a plasma would expand along the loop to its footpoints. This plasma is collisionless, therefore a question arises if this plasma expansion is a free expansion of plasma particles without any interactions or the expansion generates some plasma waves making thus an obstacle for the free expansion.
Brown et al. (1979) in their pioneering work answered this question and proposed the so called thermal conduction front formed between expanding hot and cold plasmas. Their idea was supported by observations made by Fárník et al. (1983); Rust et al. (1985); Mandrini et al. (1996).
From that time several attempts to simulate the thermal front numerically have been made. The results of McKean et al. (1990a, b), based on the 1-D electrostatic particle-in-cell simulations, did not confirm an existence of the thermal front. They only showed a free expansion of electrons from the hot plasma region to the colder one. On the other hand, Arber & Melnikov (2009), using a Vlasov code, showed that a thermal front trapping of hot electrons can be really generated.
Recently, Karlický (2015) has studied a formation of the thermal front using a 3-D particle-in-cell fully electromagnetic code. He recognized the thermal front and importance of inductive effects for its formation. The thermal front was propagating with the sound speed of the hot plasma. The thermal front was associated not only with the strong ion-acoustic waves, but also with the plasma and electromagnetic ones. Just the electromagnetic waves at the thermal front led to an idea that the thermal front can be observed on radio waves.
In this article, we present a very rare example of the slowly positively drifting burst which we propose to be the radio emission of the thermal conduction front. Such an interpretation is supported by simultaneous EUV and Hα observations.
2 OBSERVATIONS
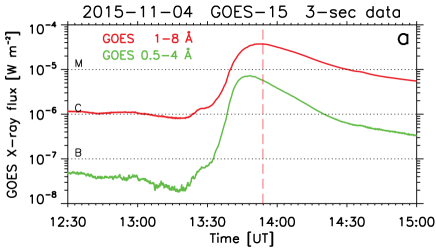
The studied phenomenon was observed at the beginning of the 4 November 2015 flare. The flare was classified as GOES M3.7 and started at 13:31 UT, peaked at 13:52 UT, and ended at 14:13 UT and occurred in the active region NOAA 12443, located at this time close to the center of the solar disk.
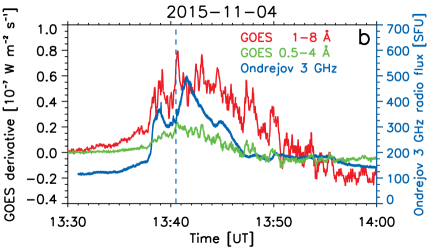
Global temporal profiles of the flare in GOES 1-8 and 0.5-4 Å soft X-rays and their derivatives together with the radio flux observed by the Ondřejov radiometer (Jiřička & Karlický, 2008) on 3 GHz are presented in Figure 1. For global overview of this flare, see movies attached to the paper by Li et al. (2017), where they studied evolution of flare ribbons.
2.1 Radio Spectral Observations
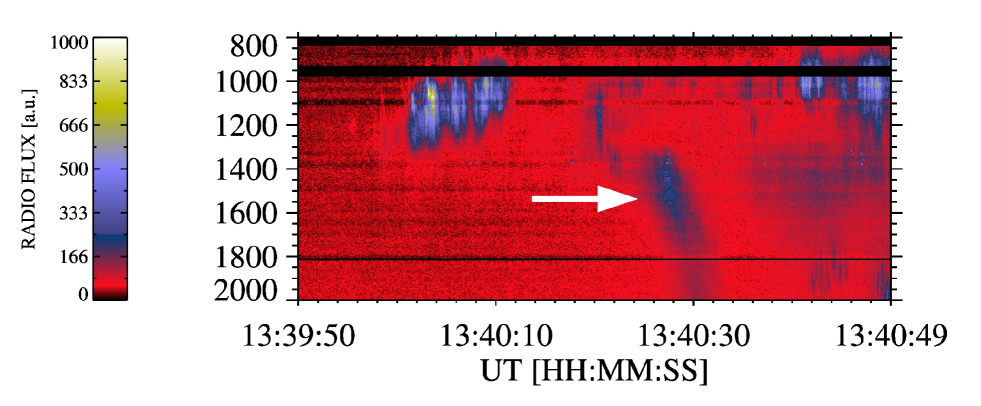
Figure 2 shows the 800 – 2000 MHz radio spectrum observed by the Ondřejov radiospectrograph (Jiřička & Karlický, 2008) at the beginning of the solar flare in the time interval 13:39:50 – 13:40:49 UT. As seen here, in the 900 – 1300 MHz frequency range and at 13:39:55 UT the flare radio emission started with the drifting pulsation structure (Jiřička et al., 2001), which drifted with the frequency drift -18 MHz s-1. This drifting pulsation structure is then at about 13:40:20 UT followed by decimetric type III bursts, indicating the electron beams propagating upwards through the flare atmosphere. Their frequency drift is very high, greater than 3 GHz s-1.
The most interesting and very rare burst in this radio spectrum is the slowly positively drifting burst (SPDB). It suddenly started at 1300 MHz, at 13:40:24 UT and drifted towards higher frequencies with the frequency drift of about 115 MHz s-1. Its intensity was fading at higher frequencies. The drift indicates that this burst is generated by the plasma emission mechanism. Thus assuming that the frequency of SPDB corresponds to plasma frequency then the density in the radio source is 2.08 1010 cm-3. Note that SPDB was observed during the maximum peak of GOES 1-8 and 0.5-4 Å soft X-rays derivatives (Figure 1, part b).
After this burst, the Ondřejov and e-Callisto (Monstein, 2013) radio spectra show continua with fiber bursts and type II radio burst (signature of the flare shock) in the 45 – 80 MHz frequency range at 13:42:00 – 13:54:00 UT.
2.2 EUV Imaging Observations
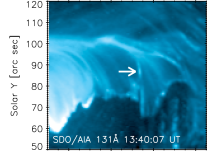
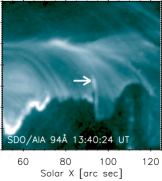
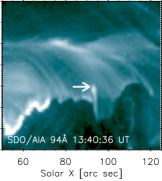
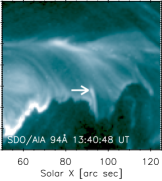
Using observations made by the Atmospheric Imaging Assembly (AIA, Lemen et al., 2012) onboard the Solar Dynamics Observatory (SDO, Pesnell et al., 2012), the X-ray Telescope (Golub et al., 2007) onboard of Hinode satellite (Kosugi et al., 2007) and the Interface Region Imaging Spectrograph (IRIS, De Pontieu et al., 2014) we searched for any EUV signature associated with the slowly positively drifting radio burst. The radio burst was very short (about 9 s), so it was challenging to observe its counterpart, considering cadences of UV/EUV imaging observations. In search of the EUV counterpart we used the following criteria given by SPDB properties: a) the densities derived from SPDB should be 2.08 1010 cm-3, such densities are commonly observed in EUV (Petkaki et al., 2012) and b) the EUV counterpart has to be observed at time of SPDB and with time duration at least as SPDB, and c) the positive frequency drift of SPDB indicates that the agent generating SPDB moves to higher densities, which means in the gravitationally stratified atmosphere a downward motion. Searching in all flare area at time of SPDB, we found one distinct bright blob that meets the above criteria. This bright blob is falling down to the chromosphere and is observed by IRIS, AIA, and XRT instruments.
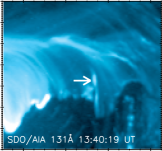
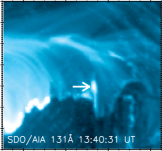
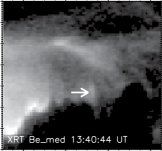
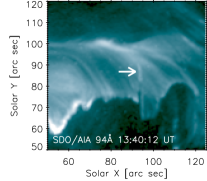
Figure 3 contains images from AIA 131 Å and 94 Å filters, combined with one panel observed in XRT Be_med filter. We observed the bright plasma blob (white arrows) falling along the dark loop structure within the bright flare arcade. The flare emission in AIA 94 Å and 131 Å originates at temperatures log( [K]) = 6.85 and 7.15, respectively but the contribution form coronal plasma at log( [K]) 5.45 - 6.05 is present as well (O’Dwyer et al., 2010; Del Zanna, 2013). The Be_med filter is sensitive to plasma at log( [K]) 6.5 - 6.9 (O’Dwyer et al., 2014) while the coronal emission below log( [K]) 6.1 is suppressed (Narukage et al., 2014). Simultaneous observations in AIA 94, 131 Å and XRT Be_med filters point to a hot component within the blob, likely with log( [K]) 6.9.
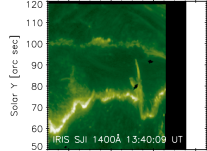
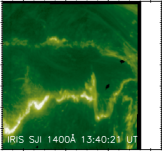
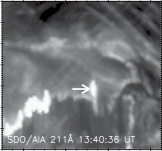
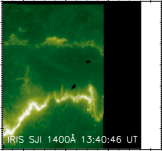
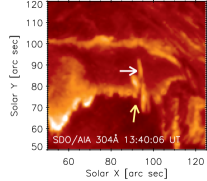
Figure 4 shows the transition region and coronal counterpart of the hot emission in Figure 3. This figure contains the IRIS 1400 Å slit-jaw images (SJI) combined with AIA 211 Å and AIA 304 Å filter. There are no IRIS spectra of the blob since the slit did not reach it.
The 1400 Å IRIS filter is dominated by transition region lines of Si IV formed at log( [K]) 4.9 (Dudík et al., 2014) but contains also photospheric continuum emission. The AIA 304 Å filter is dominated by optically thick He II Ly- line at 303.8 Å formed at around log( [K]) 4.9 (Dere et al., 1997; Del Zanna, 2015).
The emission at coronal temperatures should be seen by the AIA filters 171, 193, and 211 Å. The 171 and 193 Å observations were overexposed, thus we present AIA 211 Å filter observations only. The emission seen in this passband is not entirely understood (Del Zanna et al., 2011; Del Zanna, 2013). The coronal contribution of Fe XIV 211.3 Å line at log( [K]) = 6.3 can be present also under the flare conditions but the most significant contribution (in flare) comes from continuum emission (O’Dwyer et al., 2010). Thus a coronal emission is very likely present within the blob.
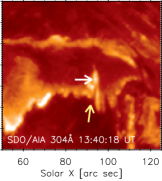
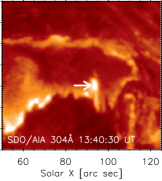
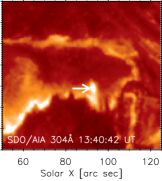
At transition region temperatures ribbons are well visible. The blob is also visible in AIA 304 Å and 211 Å observations (white arrows) and in IRIS 1400 Å SJI. Yellow arrows in the first two panels of 304 Å images show the position of dark loop structure along which the bright blob falls.
All these observations show that the falling bright blob has a multi-temperature structure spanning within two orders of magnitude in temperature.
We tried to estimate velocity of the falling blob in the plane of image from AIA filters in Figures 3 and 4. The center position of the blob was marked manually at each image. From these positions and the cadence we estimated velocity, which is 279 (+31/-33) km s-1 during 13:40:06 – 13:40:24 UT, when the blob moved through the largest arc of the dark loop.
The accompanying movie in 304 Å filter shows that during 13:39:00 UT - 13:40:00 UT, the SPDB connected falling blob is preceded by other, but less bright blobs falling along the wider dark loop structure but at slightly different trajectories, perhaps along neighboring dark threads. They move on both sides of the dark loop and are immediately followed by the middle one, connected with SPDB. After this blob the dark loop disappeared. Only the blob connected with SPDB was visible in XRT Be_med and Al_thick filters indicating the highest temperature in this blob. This type of blobs resembles the flare-driven coronal rain clumps (Scullion et al., 2016). However, our blobs are observed at the impulsive phase of the flare, contrary to the rain clumps that are observed at the end of the flare (Scullion et al., 2016). The velocity of our blob is faster than that of the rain clumps (several tens km s-1) and the blob temperature is higher than in rain clumps ( 22000 K - 1 MK). In this sense, our observed blobs are unique, and it is unlikely that they occur due to coronal rain.
2.3 Hα Observations
The studied flare was also observed in the Hα (6562.8 Å) by the Multi-channel Subtractive Double Pass (MSDP) imaging spectrograph and Large Coronograph (LC) at the Białków Observatory, Poland (Mein, 1991; Rompolt et al., 1994).
On November 4th, 2015 LC worked with artificial moon removed, enabling observations of the solar surface. Between 13:12 UT and 14:15 UT, 110 scans of NOAA 12443 were collected. The 2D spectra-images obtained from LC-MSDP system have pixel size 0.5” and the spatial resolution of LC is limited by seeing conditions to 1”. The nine-channel MSDP prism-box enables recording spectra-images at nine positions across the Hα line profile, with a total range of 1.6 Å. After a standard dark current and flat-field reduction, two-dimensional, quasi-monochromatic images with pixel band-width of 0.06 Å, separated by 0.2 Å up to 1.2 Å from the Hα line center are restored (Radziszewski et al., 2006, 2007). Thus the Hα profile in the range of 1.2 Å from the line center is available for each pixel within the FOV.
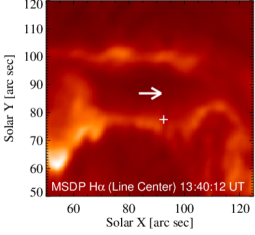
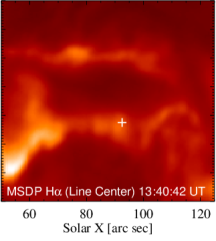
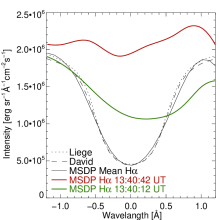
We have studied Hα observations to look for any optical counterpart of radio/EUV event described in previous sections. Figure 5 shows two MSDP images in the center of Hα line at times close to that of SPDB. In the first panel the white arrow shows the position of the bright plasma blob visible at the same time (13:40:12 UT) in AIA 94 Å. There is no counterpart of the blob visible in Hα in this position at this time. Instead, a dark loop structure in Hα (log( [K]) 4) is already visible since about 13:35 UT (see online movie in Hα). It quickly evolved from a wider structure into narrow fibre at about 13:40:12 UT (Figure 5, the first panel), and finally disappeared. A bright knot appeared in its place at about 13:40:42 UT (Figure 5, the second panel), i.e., at the time when the UV/EUV blob reached the ribbon.
The Hα profiles (Figure 5, last panel) were taken from the same position, i.e. from the central part of the dark loop structure at 13:40:12 UT and the bright knot at 13:40:42 UT, marked by the white crosses in Figure 5. The dark loop structure at 13:40:12 UT is characterized by a small redshift corresponding to velocity of +11 km s-1. After 30s, in the same position, the bright knot was visible, whose Hα profile was significantly increased. In red wing there is clear local maximum of intensity, which corresponds to plasma moving downward with velocity of +41 km s-1 - i.e. almost three times more than earlier. Additionally, in blue wing, the smaller local maximum was visible, which implied the second component of upward moving plasma with velocity of -35 km s-1. Such a profile suggests presence of both direction of plasma motion in the bright knot but with dominating downward component.
3 DISCUSSION AND CONCLUSIONS
The slowly positively drifting burst (SPDB) was observed at the beginning of solar flare and its drift (115 MHz s-1) was much smaller than that of following decimetric type III bursts (several GHz s-1). Because type III bursts are generated by electron beams with the velocity of about one third of speed of light, SPDB has to be generated by an agent having much smaller velocity.
The presented EUV observations show that at the time of SPDB the bright blob was propagating along the dark loop, visible in Hα, downwards to the chromosphere. An interaction of this falling blob with the chromosphere was expressed by a sudden change of the Hα line spectrum, which shows a strong plasma heating and enhanced plasma velocities.
The fall velocity of the EUV blob is estimated as about 280 km s-1. It is much smaller than the Alfvén speed at such atmospheric altitudes (about 1000 km s-1), but greater than the velocities of flare-driven coronal rain clumps. As argued in Section 2.2, our blob is not due to the coronal rain phenomenon.
Based on these observations, firstly, we considered the model with the magnetic island (plasmoid) moving downwards. Plasmoids are observed in the flare impulsive phase. But this explanation is not very probable because the plasmoid has to move along the current sheet (Bárta et al., 2008) and no indications of the straight or distorted current sheet were found in and around the loop where the EUV blob was moving. Moreover, such a plasmoid would be magnetically open in the direction of the magnetic field lines, i.e., in the direction of the loop and thus it would need some structure like the thermal front to be thermally isolated from cold plasma. We also considered some dissipation process along the loop with the twisted magnetic field lines. But in this case the dissipation spreads with the Alfvén velocity that is higher than the observed one. The problem with the thermal isolation in the direction of the loop axis would be the same as in the plasmoid case. Thus on the results obtained by numerical simulations (Karlický, 2015), we propose that SPDB is generated by the thermal conduction front formed in front of the falling bright and hot blob. Namely, the thermal front can generate the electromagnetic (radio) waves by plasma emission mechanism.
In such an interpretation, the velocity of the thermal front corresponds to the the velocity of the falling blob and also to the sound speed of the hot plasma at the bottom edge of the falling blob. If we take the velocity of the falling blob (280 km s-1) as the sound velocity, the corresponding plasma temperature is about 3.5 MK (log( [K]) 6.54.) The bright blob was observed in a broad range of temperatures from those in the transition region through coronal ones up to flare temperatures. But this temperature is lower than the temperature of the EUV lines dominating in 94 Å and 131 Å filters ( 7 MK, i.e., log( [K]) 6.85). According to the theory the velocity of the thermal front corresponds to the sound velocity of the hot plasma close to the thermal front. Here the temperature is lower than that in central part of the bright blob, because the most energetic electrons from this region freely escape through the thermal front to the region of cold plasma and propagate towards the chromosphere. Just the flux of these energetic electrons can explain the maximum peak in the derivatives of GOES 1-8 and 0.5-4 Å soft X-rays (peak in hard X-ray emission considering the Neupert effect) (Figure 1 b) at the time of SPDB observation.
SPDB drifted from 1300 MHz to 2000 MHz during about 6 seconds. If in accordance with the assumed plasma emission mechanism of SPDB we assume that the radio frequencies correspond to the plasma frequencies, it means that the electron plasma density in front of the thermal front changed from 2.08 1010 cm-3 to 4.94 1010 cm-3 during 6 seconds.
Because there is no reliable density model for this case, in the following we consider the density dependance in the gravitationally stratified solar atmosphere: , where is the height in the solar atmosphere and is the scale height (H[m] = 50 T[K]). The hot blob with the velocity 280 km s-1 moves distance 1680 km during 6 seconds. If we assume that this motion is in vertical direction, we can estimate the scale height as = 1950 km, which gives the temperature in front of the thermal conduction front (in front of the falling blob) 39000 K. However, the blob falls along the cold loop structure, which is not vertical, therefore the scale height is probably shorter and temperature is smaller and thus to be in agreement with observations of the Hα cold loop (the temperature up to about 20000 K). However, we cannot exclude that the density gradient in this cold loop differs from that given by the gravitational equilibrium because plasma processes at this stage are very dynamic.
In the region of the thermal front the plasma waves were generated and then converted to the electromagnetic (radio) waves observed as SPDB. In this complex process there are several possibilities how to explain the sudden start and fading of SPDB. The most probable reason for this sudden start is sudden formation of the thermal front. Because the collisional optical depth for the plasma emission process increases as the second power of the radio frequency (Benz, 1993), the fading of SPDB towards higher frequencies can be explained by this optical depth increase. Nevertheless, there are other possibilities like a change of the level of the plasma waves and so on. In this emission process the so called ducting (Benz, 1993) probably plays a role, because the blob has a multithermal structure.
Just before the analyzed falling blob (which was associated with SPDB) we observed other falling blobs with no radio counterparts. But they were less bright and not visible in XRT Be_med and Al_thick filters. Note that for more bright and hotter blob the association with the radio burst and also formation of the thermal front is more probable. We think that in other cases maybe no thermal fronts were formed or the radio emission was very weak, because this emission is very sensitive to plasma conditions in the thermal front.
References
- Arber & Melnikov (2009) Arber, T. D., & Melnikov, V. F. 2009, ApJ, 690, 238
- Bárta et al. (2008) Bárta, M., Vršnak, B., & Karlický, M., 2008, A&A, 477, 649
- Benz (1993) Benz, A. O., 1993, Kinetic processes in solar and stellar coronae, Astrophysics and Space Science Library, Vol.184, Kluwer Acad. Publ., Dordrecht, The Netherlands, p. 263 and 277
- Boerner et al. (2012) Boerner, P., Christopher, E., Lemen, J. et al. 2012, Sol. Phys., 275, 41
- Brown et al. (1979) Brown, J.C., Melrose, D.B., & Spicer, D.S. 1979, ApJ, 228, 592
- De Pontieu et al. (2014) De Pontieu, B., Title, A.M., Lemen, J.R. et al. 2014, Sol. Phys., 289, 2733
- Del Zanna (2015) Del Zanna, G., Dere, K.P., Young, P.R. et al., A&A, 582, 12
- Del Zanna (2013) Del Zanna, G. 2013, A&A, 558, A73
- Del Zanna et al. (2011) Del Zanna, G.,O’Dwyer, B., Mason, H.E. 2011, A&A, 535, A46
- Dere et al. (1997) Dere, K. P., Landi, E., Mason, H. E. et al. 1997, A&AS, 125,149
- Dudík et al. (2014) Dudík, J., Del Zanna, G., Dzifčáková, E. et al. 2014, ApJ, 780, L12
- Fárník et al. (1983) Fárník, F., Kaastra, J., Kálmán, B., Karlický, M., Slottje, C., & Valníček, B. 1983, Sol. Phys., 89, 355
- Golub et al. (2007) Golub, L., DeLuca, E., Austin, G. et al. 2007, Sol. Phys., 243, 63
- Jiřička et al. (2001) Jiřička, K., Karlický, M., Mészárosová, H., & Snížek, V., 2001, A&A, 375, 243
- Jiřička & Karlický (2008) Jiřička, K. & Karlický, M. 2008, Sol. Phys., 253, 95
- Karlický (2015) Karlický, M. 2015, ApJ, 814, 153
- Kosugi et al. (2007) Kosugi, T., Matsuzaki, K., Sakao, T. et al. 2007, Sol. Phys., 243, 3
- Lemen et al. (2012) Lemen, J.R., Title, A.M., Akin, D.J. et al. 2012, Sol. Phys., 275, 17
- Li et al. (2017) Li T., Zhang, J. and Hou, Y. 2017, ApJ, 848, 32.
- Mandrini et al. (1996) Mandrini, C. H., Demoulin, P., van Driel-Gesztelyi, L., Schmieder, B., Cauzzi, G., & Hofmann, A. 1996, Sol. Phys., 168, 115
- McKean et al. (1990a) McKean, M.E., Winglee, R.M., & Dulk, G.A. 1990a, ApJ, 364, 295
- McKean et al. (1990b) McKean, M.E., Winglee, R.M., & Dulk, G.A. 1990b, ApJ, 364, 302
- Mein (1991) Mein, P., 1991, A&A, 248, 669
- Monstein (2013) Monstein, C. 2013, EGU General Assembly Conference Abstracts 15, id. EGU2013-2027
- Narukage et al. (2014) Sakao, T., Kano, R., Shimojo, M., Winebarger, A. Weber, M., & Reeves, K. K. 2014, Sol. Phys., 289, 1029
- O’Dwyer et al. (2014) O’Dwyer, B., Del Zanna, G. & Mason, H. E., 2014, A&A, 561, A20
- O’Dwyer et al. (2010) O’Dwyer, B., Del Zanna, G., Mason, H. E.,Weber, M. A., & Tripathi, D. 2010, A&A, 521, A21
- Pesnell et al. (2012) Pesnell, W. D., Thompson, B. J., & Chamberlin, P. C. 2012, Sol. Phys., 275, 3
- Petkaki et al. (2012) Petkaki, P., Del Zanna, G. Mason, H. E. & Bradshaw, S. J., 2012, A&A, 547, A25
- Radziszewski et al. (2007) Radziszewski, K., Rudawy, P., Phillips, K.J.H., 2007, A&A, 461, 303
- Radziszewski et al. (2006) Radziszewski, K., Rudawy, P., Phillips, K.J.H., Dennis, B.R., 2006, Adv. Space Res. 37, 1317
- Rompolt et al. (1994) Rompolt, B., Mein, P., Mein, N., Rudawy, P., Berlicki, A., 1994, JOSO Annual Report 1993, 87
- Rust et al. (1985) Rust, D. M., Simnett, G. M., & Smith, D. F. 1985, ApJ, 288, 401
- Scullion et al. (2016) Scullion, E., Rouppe van der Voort, L., Antolin, P., Wedemeyer, S., Vissers, G., Kontar, E. P., & Gallagher, P. T. 2016, ApJ, 833, 184