Black Hole/Pulsar Binaries in the Galaxy
Abstract
We have performed population synthesis calculation on the formation of binaries containing a black hole (BH) and a neutron star (NS) in the Galactic disk. Some of important input parameters, especially for the treatment of common envelope evolution, are updated in the calculation. We have discussed the uncertainties from the star formation rate of the Galaxy and the velocity distribution of NS kicks on the birthrate () of BH/NS binaries. From incident BH/NS binaries, by modelling the orbital evolution duo to gravitational wave radiation and the NS evolution as radio pulsars, we obtain the distributions of the observable parameters such as the orbital period, eccentricity and pulse period of the BH/pulsar binaries. We estimate that there may be BH/pulsar binaries in the Galactic disk and around 10% of them could be detected by the Five-hundred-meter Aperture Spherical radio Telescope.
keywords:
stars: binaries – stars: black holes – stars: neutron – binaries: general1 Introduction
More than forty years have passed since the first binary pulsar of PSR B1913+16 was discovered (Hulse & Taylor, 1975), and there are now known in the Galaxy (see Tauris et al., 2017, for a compilation). To date, however, no binaries containing a black hole (BH) and a pulsar has been detected. Discovery of BH/pulsar binaries is a holy grail in astrophysics, not only because they can yield constraints on the evolution of massive star binaries, but also they are very useful for testing relativistic gravity (e.g., Liu et al., 2014) and understanding the formation of gravitational wave sources (e.g., Belczynski, Kalogera & Bulik, 2002). There have been investigations on the formation of BH/pulsar binaries (Sigurdsson, 2003, for a review), but mainly focusing on binaries containing a recycled pulsar (Sipior, Portegies Zwart & Nelemans, 2004; Pfahl et al., 2005) and formed due to dynamical processes (Faucher-Giguère & Loeb, 2011; Clausen, Sigurdsson & Chernoff, 2014). For binary systems with a recycled pulsar, Pfahl et al. (2005) concluded that the birthrate in the Galactic disk is probably no larger than and even including zero, the expected number is fewer than . In both the Galactic centre and globular clusters, the estimated number of dynamically formed BH/(recycled) pulsar binaries has the order of unity, the upper limit on the size of this population is (Faucher-Giguère & Loeb, 2011; Clausen, Sigurdsson & Chernoff, 2014).
In this Letter, we revisit the population of BH/pulsar binaries through isolated binary evolution. Compared to previous studies, we have included new important updates in the population synthesis calculation to obtain more reliable estimates on the binaries containing a BH and a neutron star (NS). In addition, the NSs in binary systems are regarded as isolated radio pulsars, we can model the pulsar evolution with time to derive the parameter distribution of BH/pulsar binaries. Searching for BH/pulsar systems is one of the important scientific goals of the Five-hundred-meter Aperture Spherical radio Telescope (FAST) because of its excellent performance, our results can provide helpful information for detectable BH/pulsar binaries in the Galactic disk. The rest of the paper is organized as follows. In section 2 we introduce the method in this work. We present the results in section 3. A brief discussion is made in section 4.
2 Method
2.1 Population Synthesis Calculation
To model the population of BH/pulsar systems, we firstly utilize the BSE population synthesis code (Hurley et al., 2002) to perform a series of Monte-Carlo simulations for a large number () of binary evolution calculations to obtain the distribution of BH/NS binaries. Some of the modifications of the code, including the process of mass transfer, the supernova explosions and the treatment of common envelope (CE) evolution, have been described by Shao & Li (2014). The key points are summarized as follows.
In a primordial binary, the first mass transfer occurs when the primary star evolves to overflow its Roche lobe. If the mass transfer proceeds very rapidly, the secondary star will get out of thermal equilibrium due to mass accretion, and the responding expansion may cause the secondary star to fill its own Roche lobe, leading to the formation of a contact binary (Nelson & Eggleton, 2001). In the calculation we assume that contact binaries will go into CE evolution. The mass transfer efficiency (i.e. the fraction of mass accreted onto the secondary star among the transferred mass) is an important factor that determines whether a binary will evolve to be contact. Here we assume the efficiency to be 0.5, based on Shao & Li (2014) for the formation of Galactic Be/X-ray binaries. The corresponding critical mass ratio between the primary and the secondary stars for stable mass transfer is 2.0 (Shao & Li, 2014).
For dynamically unstable mass transfer in a binary, we use the standard energy conservation equation (Webbink, 1984) to deal with the CE evolution. During the spiral-in stage, the orbital energy of the accretor is used to balance the binding energy of the donor envelope. We follow Xu & Li (2010) and Wang, Jia & Li (2016) to deal with the binding energy parameter in which the contribution of the internal energy is included, and the CE efficiency is taken to be 1.0 in the calculation.
A massive star will finally evolve to produce a compact star. We set the remnant mass according to the rapid supernova mechanism (Fryer et al., 2012), which can account for the gap or deficiency between the measured masses of NSs and BHs. At the moment of supernova explosions, the compact stars are subject to supernova kicks. Hobbs et al. (2005) proposed that the distribution of the pulsar birth velocities is well fitted by a Maxwellian distribution with , while Verbunt et al. (2017) argued that a bimodal distribution (with and ) can better describe the birth velocities, among which the lower distribution may be attributed to the pulsars formed from electron-capture supernovae. Note that the birth velocities include the contribution from supernova kicks, the pre-supernova binary motion and the motion of the progenitor systems. In our calculation, the NS kick velocities are assumed to have a Maxwellian distribution, we discuss three different velocity distributions with , 150 and . For natal kicks to newborn BHs, we use the NS kick velocities reduced by a factor of , where is the fallback fraction.
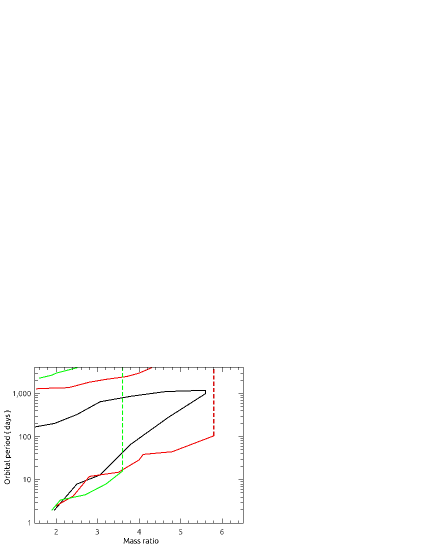
The general scenario for the formation of BH/NS binaries is that a massive BH forms first, with a NS at a later epoch 111An alternative scenario is that the BH progenitor transfers a great amount of material to the NS progenitor, resulting in the NS being formed first. The NS is then recycled by the transferred matter from the BH progenitor. This requires that enough mass must be transferred. From our calculation, there is no such binaries produced since the adopted mass transfer efficiency is 0.5. Furthermore, binary population synthesis studies demonstrated that these systems are very rare and probably not existent (Sipior, Portegies Zwart & Nelemans, 2004; Pfahl et al., 2005).. During the evolution in binaries with a BH accretor and a massive normal donor (the NS progenitor), we use the EV stellar evolution code initially developed by Eggleton (1971) to deal with the mass transfer stability. The CE evolution is assumed to be triggered when either the donor has developed a deep convective envelope (with the mass transfer rate rapidly reaches ) or the trapping radius 222For binaries with a BH accretor, there is a so-called “trapping radius” in the super-Eddington accretion flow around the BH, below which photon diffusion outward cannot overcome the advection of photons inward, and the radiation generated in excess of the Eddington limit can thus be advected into the BH (Shakura & Sunyaev, 1973). King & Begelman (1999) proposed that CE evolution will be avoided if the trapping radius is smaller than the BH’s Roche lobe radius. of the accreting BH is larger than its Roche lobe radius. Fig. 1 shows the parameter spaces of the binaries with the occurrence of CE evolution at the metallicity of 0.02. The black, red and green curves correspond to the the initial BH mass of 5, 10 and , respectively. The dashed vertical lines indicate the donor’s mass of . The maximal mass ratio for avoiding CE evolution can reach as high as , and the mass transfer may be always stable in some binaries with long periods. This result is roughly consistent with that of Pavlovskii et al. (2017). In the BSE code, we use the interpolation of mass ratios and orbital periods (rather than a constant value) to decide whether the CE evolution is triggered in binaries with different BH masses.
In our calculation, the initial input parameters of the primordial binaries are set as follows. We adopt the Kroupa et al. (1993) initial mass function for the primary mass and a flat distribution between 0 and 1 for the mass ratio of the secondary to the primary (Sana et al., 2012). All stars are assumed to initially in binaries. The distribution of the orbital separations is assumed to be flat in logarithm and all binaries are assumed to have circular orbits (Hurley et al., 2002). The primordial binaries are believed to follow the distribution of stars in the Galactic disk and the progenitors of BH/NS binaries are assumed to be close to their birth locations (because of the short lifetime of massive stars and the small kick velocity at BH formation). We only track the spatial motions of BH/NS binaries in the Galaxy, which are determined by the Galactic gravitational potential (Kuijken & Gilmore, 1989). We set the initial metallicity of stars to be 0.02, and assume a constant star formation rate over a 10 Gyr period. Several investigations estimated that the star formation rate of the Galaxy can vary in a range of (e.g., Smith,Biermann & Mezger, 1978; Diehl et al., 2006; Robitaille & Whitney, 2010). So we consider three different values of , 3 and for comparison. We will see that the expected birthrate of BH/NS binaries vary by several times when adopting different star formation rates, but the overall shapes of the parameter distribution remain unchanged.
2.2 Modelling Pulsar Evolution
| () | () | () | |||
|---|---|---|---|---|---|
| 1 | 50 | 2.7 | 16 | 0.2 | 1.5 |
| 150 | 1.3 | 8 | 0.1 | 0.9 | |
| 300 | 0.6 | 3 | 0.04 | 0.3 | |
| 3 | 50 | 8.0 | 48 | 0.5 | 4.5 |
| 150 | 4.0 | 24 | 0.3 | 2.7 | |
| 300 | 1.8 | 10 | 0.1 | 0.9 | |
| 5 | 50 | 13.3 | 80 | 0.8 | 7.5 |
| 150 | 6.7 | 40 | 0.5 | 4.5 | |
| 300 | 3.0 | 17 | 0.2 | 1.5 |
* In some situations, the calculated number may be smaller than one, it indicates how low is the probability of one system to be detected.
After the formation of a BH/NS binary, the subsequent orbital evolution is controlled by gravitational wave radiation (Peters, 1964). For every newborn NS in binaries, we follow the method of Faucher-Giguère & Kaspi (2006, and references therein) to deal with its evolution as an isolated radio pulsar. The radio luminosity is assumed to have a power-law dependence on the spin (or pulse) period and its period derivative . Since most pulsars were detected at 1.4 GHz in previous surveys, we only consider the luminosity at that frequency. The initial spin period and surface magnetic field strength of the pulsars are assumed to obey the log-normal distributions, then we can model their spin evolution that is driven by magnetic dipole radiation. The radio emission is assumed to turn off when the pulsars evolve across the “death line” in the diagram, so we use the relation given by Bhattacharya et al. (1992) to classify the pulsars as either active or extinguished radio sources. In addition, we assume that detection of pulsars is constrained by the beaming effect, for which the fraction of pulsars that beam toward us depends on the spin period (Tauris & Manchester, 1998).
3 Results
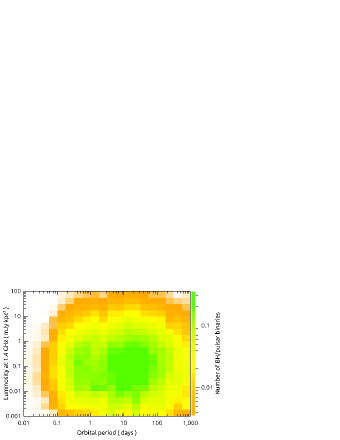
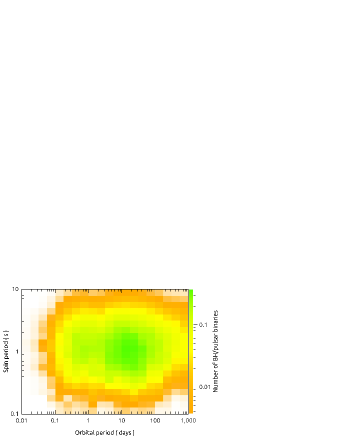
For each BH/NS binary produced in our population synthesis calculation, we can obtain the evolutionary tracks of the radio luminosity and the spin period against the pulsar age . The number of BH/pulsar binaries in each interval of and can be evaluated by accumulating the product of their birthrate and the evolution time . In Table 1, we present the calculated numbers of detectable BH/pulsar binaries considering different star formation rates and NS kick velocity distributions. The birthrate of all BH/NS binaries in the Galactic disk varies in the range of , and the inferred number (over a period of 10 Gyr) is of the order . About 3-80 among them can be detected as BH/pulsar binaries. In the top panel of Fig. 2, by taking and for an example, we present the distribution (with a total number of 24) of BH/pulsar binaries in the plane of orbital period and pulsar luminosity. The BH/pulsar systems are distributed in a wide range of the orbital period days. The logarithmic luminosity of the pulsars roughly follows a normal distribution with the peak of , which is in agreement with the results of Faucher-Giguère & Kaspi (2006). In the bottom panel of Fig. 2, we plot the distribution of BH/pulsar binaries in the plane of orbital period and pulse period. The pulse periods are mainly distributed in the range of .
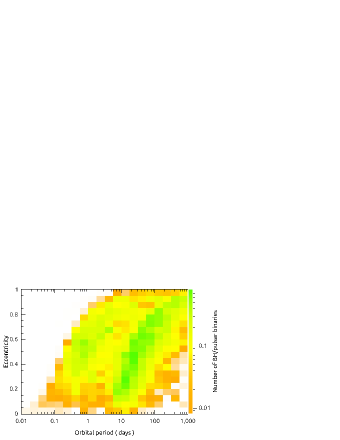
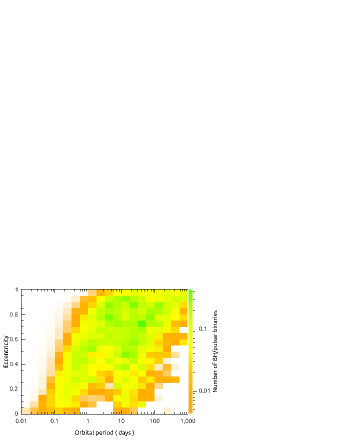
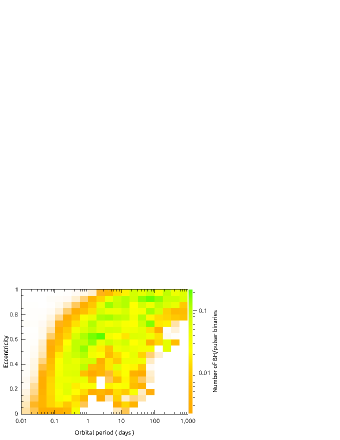
The distribution of BH/pulsar binaries in the plane of orbital period and eccentricity is given in Fig. 3. The top, middle and bottom panels correspond to , 150 and , respectively. In the case with a low of , the orbital period distribution is separated into two groups by the period of several days, which reflects whether the progenitor binary with a BH accretor has experienced CE evolution. When increasing the kick velocities, more binaries (especially the long period systems) will be disrupted, and the survived BH/pulsar binaries tend to have large eccentricities.
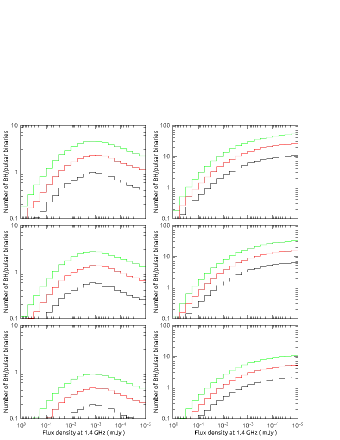
Fig. 4 shows the flux density distribution for the pulsars in BH/pulsar binaries when assuming the NS kick velocity distribution with (top), 150 (middle) and (bottom). The black, red and green curves correspond to the star formation rate of 1, 3 and , respectively. It can be seen that the number of BH/pulsar binaries with radio flux density large than is in the range of . In Table 1, we also give the predicted number of BH/pulsar binaries that can be detected in the Parkes Multibeam and FAST surveys with the flux density limit of (Manchester et al., 2001) and (D. Li, private communication). From the Parkes Multibeam survey, the detected number is expected to be less than 0.8. This small number may explain the lack of such binaries by now. Considering the fact the FAST survey will cover around 44% of the Galaxy (Li & Pan, 2016), we expect that the detected number of BH/pulsar binaries in FAST survey is about , the detection of such binaries is promising.
4 Discussion
We briefly discuss possible factors that may influence our results. The kick velocity distributions (with ) at NS birth can change the number of BH/pulsar binaries by a factor of . The lower kick velocity, the more BH/PSR binaries can be produced. When combining the uncertainty in the star formation rate () of the Galaxy, the excepted number of detectable BH/pulsar binaries can vary by a factor of . In our calculations, we assume that all stars are initially in binary systems. Observations show that the binary fraction among all massive stars is (Sana et al., 2012), this can slightly reduce the size of the BH/pulsar population. During the progenitor evolution of BH/NS binaries, we have accepted some typical assumptions. For the process of CE evolution, if we reasonably decrease the CE efficiency from 1.0 to be 0.5, the birthrate of BH/NS binaries will drop by a factor of .
For spin evolution of the pulsars, we assume the standard model of magnetic dipole radiation. The measured braking indices of young pulsars vary in a range of (Archibald et al., 2016, and references therein). By simulating the pulsar evolution, with a normal distribution of braking indices with mean 2.4 and standard deviation 0.6, Faucher-Giguère & Kaspi (2006) demonstrated that the corresponding diagrams were found to be qualitatively very similar to the one obtained with all braking indices set to 3. So that the model of magnetic dipole radiation should be a very good approximation.
There is a possibility that a BH/pulsar binary has been existed in the detected pulsar sample but just not recognized. In the Galaxy, the supernova rate is about , and the number of detected isolated pulsars is (Manchester et al., 2005). Based on the formation rate of for BH/NS binaries from our calculation, we can estimate that the number of potential BH/pulsar systems is , which is consistent with the calculated upper limit of 0.8 in Parkes Multibeam survey (see Table 1). The FAST prediction for BH/pulsar binaries is subject to many uncertainties, the high kick velocity and the low CE efficiency are likely to bring a null result in the whole survey.
Acknowledgments
We thank the referee Duncan Lorimer for constructive suggestions that improved this Letter and Prof. D. Li for helpful conversation. This work was supported by the Natural Science Foundation of China (Nos. 11603010, 11133001, 11333004, 11773015, and 11563003), the National Program on Key Research and Development Project (Grant No. 2016YFA0400803), and the Natural Science Foundation for the Youth of Jiangsu Province (No. BK20160611).
References
- Archibald et al. (2016) Archibald R.F. et al., 2016, ApJ, 819, L16
- Belczynski, Kalogera & Bulik (2002) Belczynski K., Kalogera V., Bulik, T., 2002, ApJ, 572, 407
- Bhattacharya et al. (1992) Bhattacharya D., Wijers R. A. M. J., Hartman J. W., Verbunt F., 1992, A&A, 254, 198
- Clausen, Sigurdsson & Chernoff (2014) Clausen D., Sigurdsson S., Chernoff D.F., 2014, MNRAS, 442, 207
- Diehl et al. (2006) Diehl R. et al., 2006, Nature, 439, 45
- Eggleton (1971) Eggleton P. P., 1971, MNRAS, 151, 351
- Faucher-Giguère & Kaspi (2006) Faucher-Giguère C.-A., Kaspi V. M., 2006, ApJ, 643, 332
- Faucher-Giguère & Loeb (2011) Faucher-Giguère C.-A., Loeb, A., 2011, MNRAS, 415, 3951
- Fryer et al. (2012) Fryer C. et al., 2012, ApJ, 749, 91
- Hobbs et al. (2005) Hobbs G. et al, 2005, MNRAS, 360, 974
- Hulse & Taylor (1975) Hulse R. A., Taylor J. H., 1975, ApJ, 195, L51
- Hurley et al. (2002) Hurley J. R., Tout C. A., Pols O. R., 2002, MNRAS, 329, 897
- King & Begelman (1999) King A. R., Begelman M. C., 1999, ApJ, 519, L169
- Kroupa et al. (1993) Kroupa P., Tout C. A., Gilmore G., 1993, MNRAS, 262, 545
- Kuijken & Gilmore (1989) Kuijken K., Gilmore G., 1989, MNRAS, 239, 651
- Li & Pan (2016) Li D., Pan Z., 2016, Radio Science, 51, 1060
- Liu et al. (2014) Liu K., Eatough R.P., Wex N., Kramer, M., 2014, MNRAS, 445, 3115
- Manchester et al. (2001) Manchester R. N. et al., 2001, MNRAS, 328, 17
- Manchester et al. (2005) Manchester R. N. et al., 2005, AJ, 129, 1993
- Nelson & Eggleton (2001) Nelson C. A., Eggleton P. P., 2001, ApJ, 552, 664
- Pavlovskii et al. (2017) Pavlovskii K., Ivanova N., Belczynski K., Van K. X., 2017, MNRAS, 465, 2092
- Peters (1964) Peters P.C., 1964, Phys. Rev., 136, 1224
- Pfahl et al. (2005) Pfahl E., Podsiadlowski Ph., Rappaport S., 2005, ApJ, 628, 343
- Robitaille & Whitney (2010) Robitaille T. P., Whitney B. A., 2010, ApJL, 710, L11
- Sana et al. (2012) Sana H. et al., 2012, Science, 337, 444
- Shakura & Sunyaev (1973) Shakura N., Sunyaev R., 1973, A&A, 24, 337
- Shao & Li (2014) Shao Y., Li X.-D., 2014, ApJ, 796, 37
- Sigurdsson (2003) Sigurdsson S. 2003, in ASP Conf. Ser. 302, Radio Pulsars, ed. M. Bailes, D. J. Nice, S. E. Thorsett (San Francisco: ASP), 391
- Sipior & Sigurdsson (2002) Sipior M. S., Sigurdsson S., 2002, ApJ, 572, 962
- Sipior, Portegies Zwart & Nelemans (2004) Sipior M. S., Portegies Zwart S., Nelemans, G., 2004, MNRAS, 354, L49
- Smith,Biermann & Mezger (1978) Smith L. F., Biermann P., Mezger P. G., 1978, A&A, 66, 65
- Tauris & Manchester (1998) Tauris T. M., Manchester R. N., 1998, MNRAS, 298, 625
- Tauris et al. (2017) Tauris T. M. et al., 2017, ApJ, 846, 170
- Verbunt et al. (2017) Verbunt F., Igoshev A., Cator E., 2017, A&A, 608,57
- Wang, Jia & Li (2016) Wang C., Jia K., Li X.-D., 2016, RAA, 16, 126
- Webbink (1984) Webbink R. F., 1984, ApJ, 277, 355
- Xu & Li (2010) Xu X.-J., Li, X.-D., 2010, ApJ, 716, 114