Building a Large Solar Analog Sample Using K2
Abstract
We have begun a project aimed at providing a large consistent set of well- vetted solar analogs in order to address questions of stellar rotation, activity, dynamos, and gyrochronology. We make use of the K2 mission fields to obtain precise photometric time series, supplemented by ground-based photometric and spectroscopic data for promising candidates. From this data we will derive rotation periods, spot coverages, and flare rates for a well- defined and well-calibrated sample of solar analogs.
keywords:
stars:activity, stars:variable, Sun:rotation1 Sample Selection
Our K2 sample is selected based on colors, for consistency with our earlier Kepler sample (Buzasi, Lezcano, & Preston 2015); we adopt . We have eliminated stars with known non-main sequence spectral types based on catalog searches in SIMBAD and VIZIER, and used TRILEGAL simulations to estimate that of the remaining stars in our sample have . Since the light curves and power spectra can be used after the fact to eliminate giants from the sample (Mathur et al. 2011), we view this level of contamination as acceptable. We are focusing our attention on targets bright enough () for ground-based spectroscopic follow-up with meter-class telescopes. In support of this project, we have 11 approved K2 campaigns through Campaign 17, supplemented by additional targets observed by other investigators that fit our criteria. To date, data on approximately 2000 targets have been released and analysis is under way.
K2 data are available through a number of different data reduction pipelines, and outputs are not necessarily consistent between pipelines. We compared results from 6 different publicly available algorithms, including K2SC and K2SC-P (Aigrain, Parviainen, & Pope 2016), K2SP (Buzasi et al. 2016), EVEREST (Luger et al 2016, K2SFF (Vanderburg & Johnson 2014), and the project pipeline product (K2; Van Cleve et al. 2016). Differences between output periods are frequently substantial, particularly at low frequencies, and these differences make the typical methodology used for photometric range (range between 5th and 95th percentile) potentially problematic.
2 Period Detection, Comparisons, and Conclusions
We analyzed output from each pipeline using four different period detection algorithms:
-
1.
Lomb-Scargle Periodogram (LS): A commonly-used algorithm for detecting and characterizing periodicity in unevenly-sampled time-series
-
2.
Autocorrelation function (ACF): A measure of the correlation between values of the time series at different times, as a function of the time lag.
-
3.
Wavelet transform (Wave): Decomposition into families of basis functions that are localized in both real and Fourier space.
-
4.
Hilbert-Huang transform (HHT): Decomposition into empirical modes, followed by application of the Hilbert transform to determine frequencies and amplitudes.
In some cases, there is general agreement between the different approaches. However, much of the time agreement is not so dependable, and this is particularly the case for the long-period variability that is most of interest for rotating solar-like stars.
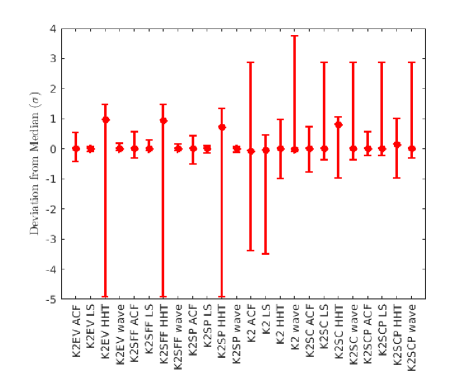
Our 6 pipelines and 4 algorithms produce 24 potentially different periods for each target, and we have compared each of these period sets with the ensemble median for each star (Figure 1). Systematic effects due to some algorithms (ACF, HHT) are apparent, and it is clear that some combinations (K2EV+LS, K2SP+Wavelet, K2SP+LS, K2SFF+Wavelet, K2EV+Wavelet, K2SFF+LS) are systematically more repeatable.
We are currently examining the most problematic algorithms to see if their performance can be improved, as well as performing similar comparisons for photometric range characterization. Once those comparisons are complete, we will be able to make a well-informed decision regarding the appropriate choice of tools for light curve characterization. This in turn will allow us to efficiently direct our ground-based follow-up resources with the goal of building a well-characterized sample of solar analogs.
References
- [Aigrain, Parviainen, & Pope (2016)] Aigrain, S., Parviainen, H., & Pope, B. 2016, MNRAS, 459, 2408. (K2SC, K2SCP)
- [Buzasi, Lezcano, & Preston (2016)] Buzasi, D., Lezcano, A., & Preston, H. 2016, JSWSC, 6, 38.
- [Buzasi et al. (2016)] Buzasi, D., Carboneau, L., Hessler, C., Lezcano, A., & Preston, H. 2016, Proc. IAU, 29, 673. (K2SP)
- [Luger et al. (2016)] Luger, R. et al 2016, AJ, 152, 100. (K2EV)
- [Mathur et al. (2011)] Mathur, S. et al. 2011, ApJ, 741, 119.
- [Vanderburg & Johnson (2014)] Vanderburg, A. & Johnson, J. 2014, PASP, 126, 948. (K2SFF)
- [Van Cleve (2016)] Van Cleve et al. 2016, PASP, 128, 5002. (K2)