OGLE14-073 – a promising pair-instability supernova candidate
Abstract
The recently discovered bright type II supernova OGLE14-073 evolved very slowly. The light curve rose to maximum for 90 days from discovery and then declined at a rate compatible with the radioactive decay of 56Co. In this study, we show that a pair-instability supernova is a plausible mechanism for this event. We calculate explosion models and light curves with the radiation hydrodynamics code stella starting from two MZAMS = 150 , Z=0.001 progenitors. We obtain satisfactory fits to OGLE14-073 broadband light curves by including additional 56Ni in the centre of the models and mixing hydrogen down into the inner layers of the ejecta to a radial mass coordinate of 10 . The extra 56Ni required points to a slightly more massive progenitor star. The mixing of hydrogen could be due to large scale mixing during the explosion. We also present synthetic spectra for our models simulated with the Monte Carlo radiative transfer code artis. The synthetic spectra reproduce the main features of the observed spectra of OGLE14-073. We conclude that OGLE14-073 is one of the most promising candidates for a pair-instability explosion.
keywords:
supernovae: general – supernovae: individual: OGLE14-073 – stars: massive – radiative transfer1 Introduction
OGLE14-073 is a unique supernova (SN) event which was discovered long before its peak (Blagorodnova et al., 2014; Wyrzykowski et al., 2014; Terreran et al., 2017). It was classified as a bright hydrogen-rich type II supernova at redshift z=0.1225. Thanks to an extensive follow-up campaign, it has good data coverage, starting from 90 days before peak magnitude in the I-band. Recently, Moriya et al. (2018) and Dessart & Audit (2017) suggested fallback accretion or a magnetar as the powering engine of this bright SN.
However, the long rise to peak could also indicate a high ejecta mass (Terreran et al. 2017 estimate M ). This can only be realized if the initial mass of the progenitor star was above at least 100 . From a theoretical point of view, it is well known that stars with initial mass range between 140 – 260 undergo pair instability and explode as pair-instability supernovae (hereafter PISN, Barkat et al., 1967; Rakavy & Shaviv, 1967). Depending on the amount of radioactive 56Ni produced, the supernova may be either sub- or superluminous (Gilmer et al., 2017).
The long rise of OGLE14-073 and the presence of H Balmer lines throughout observations covering more than 150 days require a massive H-rich ejecta. The peak luminosity in combination with an assumption about the time of explosion constrains the amount of 56Ni which powers the light curve (Arnett, 1982). Unfortunately, the explosion time is quite uncertain for OGLE14-073. According to the findings by Kozyreva et al. (2016), the peak luminosity of erg s for OGLE14-073 (Terreran et al., 2017) requires 1.3 of 56Ni. Terreran et al. (2017) derive a lower limit for the 56Ni mass of 0.47 assuming that the explosion occurred just before the first detection.
In a pair-instability explosion, there is a strong correlation between the mass of the final carbon-oxygen-rich core (CO core) and the 56Ni yield (see e. g. Heger & Woosley, 2002, and references therein), because nickel production depends on the degree of compression during the collapse phase. The larger the CO core mass, the deeper the gravitational potential reached during the pair-instability phase. In turn, higher density and temperature are reached at maximum compression, releasing more nuclear energy and producing higher yields of 56Ni. Most of the helium-rich core is burnt into carbon and oxygen in PISN progenitors, leaving a narrow He-shell on top of the core, which only amounts to a few solar masses (see e. g. Yusof et al., 2013). Thus the final helium core mass roughly equals the CO core mass. In PISN models, stars with helium cores of 80 – 90 generate 0.5-1.3 of 56Ni. Note that the nickel yield varies rapidly at the lower end of the PISN mass range. For example, a model with a 70 He core (CO-core of 64 ) gives 0.02 of 56Ni, while a model with a He core of 90 (CO-core of 82 ) produces already 1.3 of 56Ni. This implies that a 25% increase in the helium core mass corresponds to almost two orders of magnitude difference in the 56Ni yield (Heger & Woosley, 2002). Hence, assuming that OGLE14-073 exploded as a PISN, its progenitor is expected to be a very massive star with a final helium core mass in the range of 80 – 90 .
In the present study, we examine a possible PISN origin of OLGE14-073. In particular, we construct ejecta configurations based on two existing self-consistent PISN models to explain the light curves and spectra of OGLE14-073. Details of our explosion models and the techniques to model light curves and spectra are given in Section 2. In Section 3, we present synthetic observables for our best-fitting model and discuss how the light curve properties depend on different progenitor and explosion parameters before concluding the study in Section 4.
2 Modelling OGLE14-073
2.1 Explosion models
| model | Radius | Mtot | MH | H-mix down | MNi | Ni-mix up | Eexpl | Notes |
| [] | [] | [] | to Mr [] | [Msun] | to Mr [] | [foe] | ||
| 150M | 3450 | 93 | 4.9 | – | 0.03 | 6 | 5 | original (Kozyreva et al. 2014) |
| 150M-3000R | 3000 | 90 | 3.9 | 30 | 1.18 | 6 | 9 | |
| 150M-14foe | 2000 | 86 | 9.1 | 10 | 1.31 | 5 | 14 | |
| 150M-He | 2000 | 86 | 1.6 | – | 1.27 | 5 | 14 | HHe down to 30 M(He)=29 |
| 150M-bf | 2000 | 86 | 9.1 | 10 | 1.31 | 5 | 9 | best-fitting |
| P150 | 1267 | 91 | 3.8 | – | 0.003 | 4 | 6 | original (Gilmer et al. 2017) |
| P150ni10 | 1267 | 91 | 9.3 | 10 | 1.37 | 10 (XNi=0.14) | 9 | |
| P150ni30 | 1267 | 91 | 9.3 | 10 | 1.37 | 30 (XNi=0.045) | 9 | |
| P150ni50 | 1267 | 91 | 9.3 | 10 | 1.4 | 50 (XNi=0.015) | 9 | |
| P150-bf | 1267 | 91 | 9.3 | 10 | 1.37 | 1.6 | 9 | best-fitting |
| He90 | 18 | 90 | – | 1.3 | 25 | 29 | original (Heger & Woosley 2002) | |
| He90-H001 | 18 | 90 | 1.6 | 10 (XH=0.01) | 1.3 | 25 | 29 | |
| He90-H01 | 18 | 90 | 7.3 | 10 (XH=0.1) | 1.3 | 25 | 29 | |
| He90-H02ni | 18 | 90 | 9.7 | 10–60 (XH=0.2) | 1.4 | 2 | 29 | centered 56Ni |
| 60 (XH=0.05) |
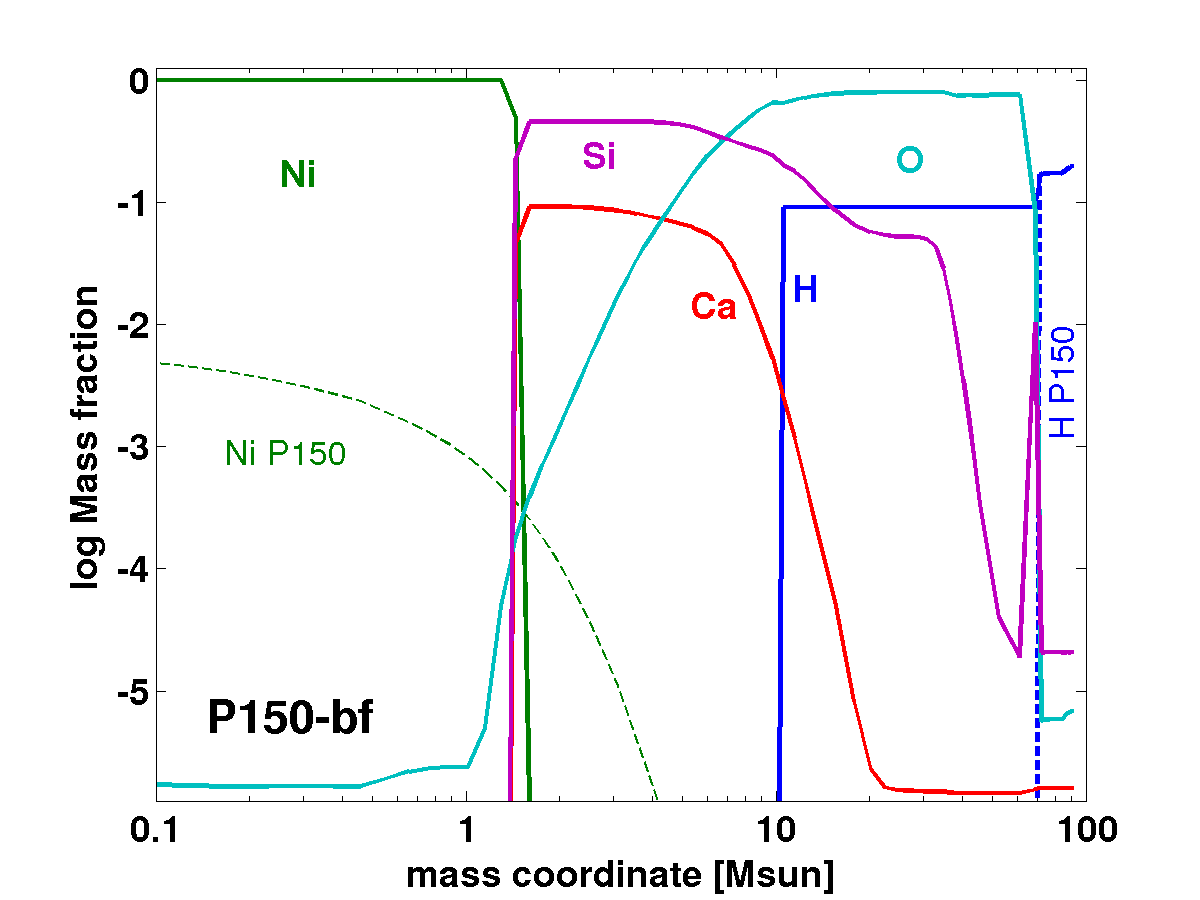
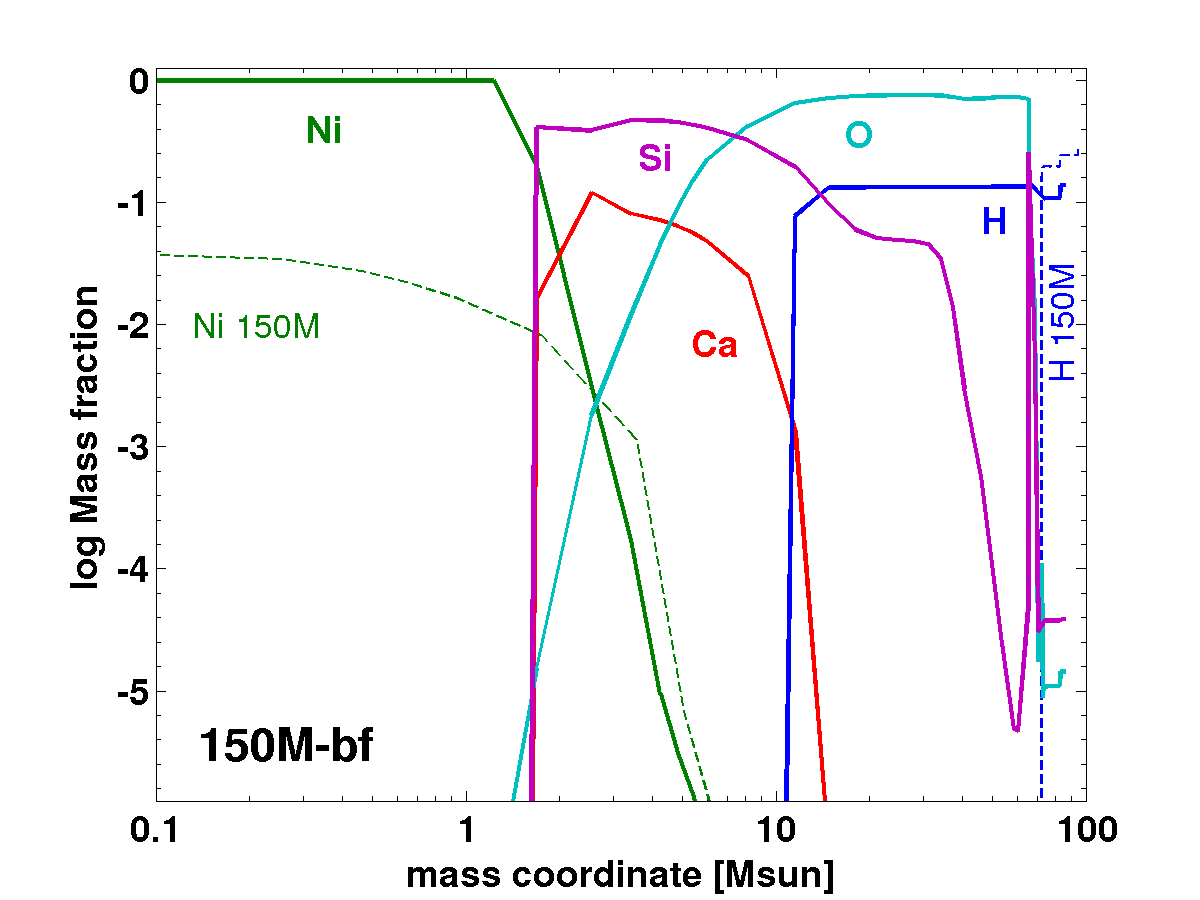
Our models are based on two very massive non-rotating star models with MZAMS = 150 at a metallicity Z=0.001, evolved from the zero age main sequence (ZAMS) until the start of the pair-instability phase with stellar evolution codes. The two models, 150M and P150, were evolved with bec (Langer et al., 2007; Kozyreva et al., 2014b) and genec (Ekström et al., 2012; Yusof et al., 2013), respectively. Abundances in the original GENEC stellar evolution model P150 are scaled from solar metallicity () down to and alpha-enhanced in most cases, following observational constraints (Lodders, 2003). Note that although both models have the same total metallicity, it is distributed differently onto the various elements. In particular, the calcium abundance is zero in 150M but in P150.
Pair-instability explosions of the original models 150M and P150 were carried out with bec and flash (Fryxell et al., 2000; Dubey et al., 2009; Chatzopoulos et al., 2013; Chatzopoulos et al., 2015), respectively. The models 150M and P150 have helium core masses of 73 and 83 , respectively. Both models build up equally massive CO-cores of 64 . In the explosion, only small amounts of 56Ni are produced, namely 0.04 in 150M and 0.003 in P150. Consequently, the resulting light curves are dominated by cooling processes and do not show a peak powered by 56Ni (Kozyreva et al., 2014a; Gilmer et al., 2017). Thus, these models are not compatible with OGLE14-073 since its peak luminosity seems to require about 1.3 of 56Ni.
However, rotation-induced mixing would effectively increases the CO-core mass. Therefore, rotating siblings of our 150 models would end up with higher mass CO-cores and, in turn, yield more 56Ni in a PISN explosion. For example, a , 150 rotating model computed with genec develops an 85 helium core and an 80 CO-core (R. Hirschi, private communication, Yusof et al. 2013). Besides that, more massive stars at slightly lower metallicity () retain the hydrogen-helium envelope similar to 150M or P150 (R. Hirschi, N. Yusof, private communication). Therefore, we decided that using 150M and P150 as reference models is a reasonable starting point.
Ideally, a large grid of models would be computed, with initial masses between 150 and 200 (56Ni yield from 0.003 up to 13 ), with varying initial metallicities and different degrees of rotation to find the best match to OGLE14-073. However, computing the evolution of very massive star models is very challenging due to the loose gravitational binding of the hydrogen-rich envelope and the proximity to the Eddington limit. Furthermore, mass loss is uncertain in these stars and they may experience large, -Carinae-like, mass-loss episodes (Vink, 2015). Given all these complications, we adopt a reverse-engineering approach in this study to find out which modifications of the original models would enable a fit to the observed properties of OGLE14-073. The modifications made to the original models are given in Table 1 and we add suffixes to the original model names to identify them. We explain below in more detail the various modifications made and the underlying motivations.
In the original observational paper by Terreran et al. (2017), the authors find a number of similarities between OGLE14-073 and SN 1987A. In particular, H is observed during the whole observational period. Hence, the chemical structure of the OGLE14-073 ejecta might resemble that of SN 1987A. Studies of SN 1987A conclude that hydrogen was mixed deep into the ejecta and that 56Ni was mixed into ejecta regions far away from the centre (Utrobin, 1993). Such a mixing pattern has been confirmed in multi-dimensional simulations of core collapse SNe (e.g. Wongwathanarat et al., 2015). Similar mixing processes might be active in PISN. Indeed, 2.5-D simulations of rotating PISNe by Chatzopoulos et al. (2013) show the formation of Rayleigh–Taylor instabilities and asymmetries that lead to mixing in the ejecta. Based on this and the similarities between OGLE14-073 and SN 1987A, we explored whether the presence of hydrogen in OGLE14-073 might be explained by artificially mixing hydrogen deep into the ejecta in both explosion models. We found that modified versions of models 150M and P150 with a hydrogen mass fraction of down to a mass coordinate M produce bolometric light curves in good agreement with OGLE14-073.
The best-fitting models of SN 1987A have 56Ni mixed throughout the entire ejecta (Nomoto et al., 1988). Thus, we also explored the effect of mixing 56Ni outward in the model P150. We constructed models, in which 56Ni was smeared out uniformly inside the inner 10, 30 and 50 solar masses, but found that this mixing does not improve the match between the resulting synthetic light curves and OGLE14-073 (see discussion in Section 3).
Finally, we lowered the hydrogen-to-helium mass fraction ratio in the outer shells of the model 150M (H:He1:4 in the original model, while we set H:He1:8), to reduce the high cooling emission after the shock breakout. For the same reason, i.e. to reduce the strong cooling signature, model 150M was truncated at a radius, (the original radius of 150M is 3475 ). In Figure 1, we show the radial distribution of hydrogen, 56Ni and a few other selected chemical species for our best-fitting models 150M-bf and P150-bf, and compare them to the distribution of hydrogen and 56Ni in the original models 150M and P150.
2.2 Light curve modelling
We follow the supernova explosion and model the light curve with the one–dimensional multigroup radiation hydrodynamics code stella (Blinnikov et al., 2006; Kozyreva et al., 2014a). We mapped the models into stella when the shock is at the bottom (models 150M) or in the middle (models P150) of the H-He envelope. The energy of the pair-instability explosion (in the modified models) was increased by multiplying the velocity of the basic model (150M and P150) by a factor 1.3. In the present simulations, we use 100 frequency bins. The opacity includes photoionization, free-free absorption, electron scattering processes assuming local thermodynamical equilibrium in the plasma, and line interactions. The line opacity is calculated using a database of about 160,000 spectral lines from Kurucz & Bell (1995) and Verner et al. (1996). Energy deposition from 56Ni and 56Co radioactive decay is treated in a one-group diffusion approximation according to Swartz et al. (1995).
When calculating opacities, STELLA treats only a limited set of species, which generally play an important role in SNe. These are H, He, C, N, O, Ne, Na, Mg, Al, Si, S, Ar, Ca, stable Fe, which represents heavy iron-group elements, radioactive 56Co and stable Ni and radioactive 56Ni. We note that ejecta models extracted from STELLA, and used for the spectral synthesis post-processing described in the next Section, are limited to the same set of species.
2.3 Spectral synthesis
To obtain spectral time series for the models P150-bf and 150M-bf, we use the Monte Carlo radiative transfer code artis (Kromer & Sim, 2009). Using a detailed wavelength-dependent opacity treatment, artis solves the time-dependent radiative transfer problem in homologously expanding supernova ejecta. This includes a detailed simulation of the propagation of -ray photons and ultraviolet-optical-infrared photons. For -ray photons artis accounts for interactions with matter by Compton scattering, photo-electric absorption and pair production (Sim & Mazzali, 2008). For ultraviolet-optical-infrared photons artis accounts for electron scattering, free-free, bound-free and line interactions. The latter are treated in the Sobolev approximation (Sobolev, 1957) using a generalised scheme that enforces statistical equilibrium and allows for a parameter-free treatment of line fluorescence (Lucy, 2002, 2003). The ionisation and thermal balance equations are solved self-consistently with the radiative transfer problem. Excitation is treated approximately by assuming local thermodynamic equilibrium.
As input model for our artis simulations we use the density and abundance structure from stella at 10 d after explosion, when the ejecta approach homologous expansion. In artis this ejecta structure is mapped to a uniform Cartesian grid and follows homologous expansion. On this grid, we then simulate the evolution of the radiation field by propagating Monte Carlo quanta for 150 logarithmically-spaced time steps from 50 to 450 d past explosion. Once the Monte Carlo quanta escape from the simulation domain they are binned in time and on a logarithmic wavelength grid spanning 1,000 bins from 375 to 30,000 Å to obtain the spectral time series.
For our simulation we use an atomic data set that is based on the cd23_gf-5 model of Kromer & Sim (2009) but extended by H lines which were not part of the original compilation. The cd23_gf-5 data set is based on the atomic line list by Kurucz & Bell (1995). A grey approximation is used in optically thick cells for d to speed up the calculations (cf. Kromer & Sim, 2009). Local thermodynamic equilibrium is assumed for d. At later epochs, we use the detailed ionisation treatment of artis to solve the ionisation balance as described by Kromer & Sim (2009). For the excitation balance we follow a different approach and adopt a nebular approximation
| (1) |
with symbols as defined in Kromer & Sim (2009). For metastable levels (i.e. levels without permitted electric dipole transitions to the ground state) the dilution factor is set to .
3 Results and Discussion
3.1 Bolometric properties and broad band magnitudes
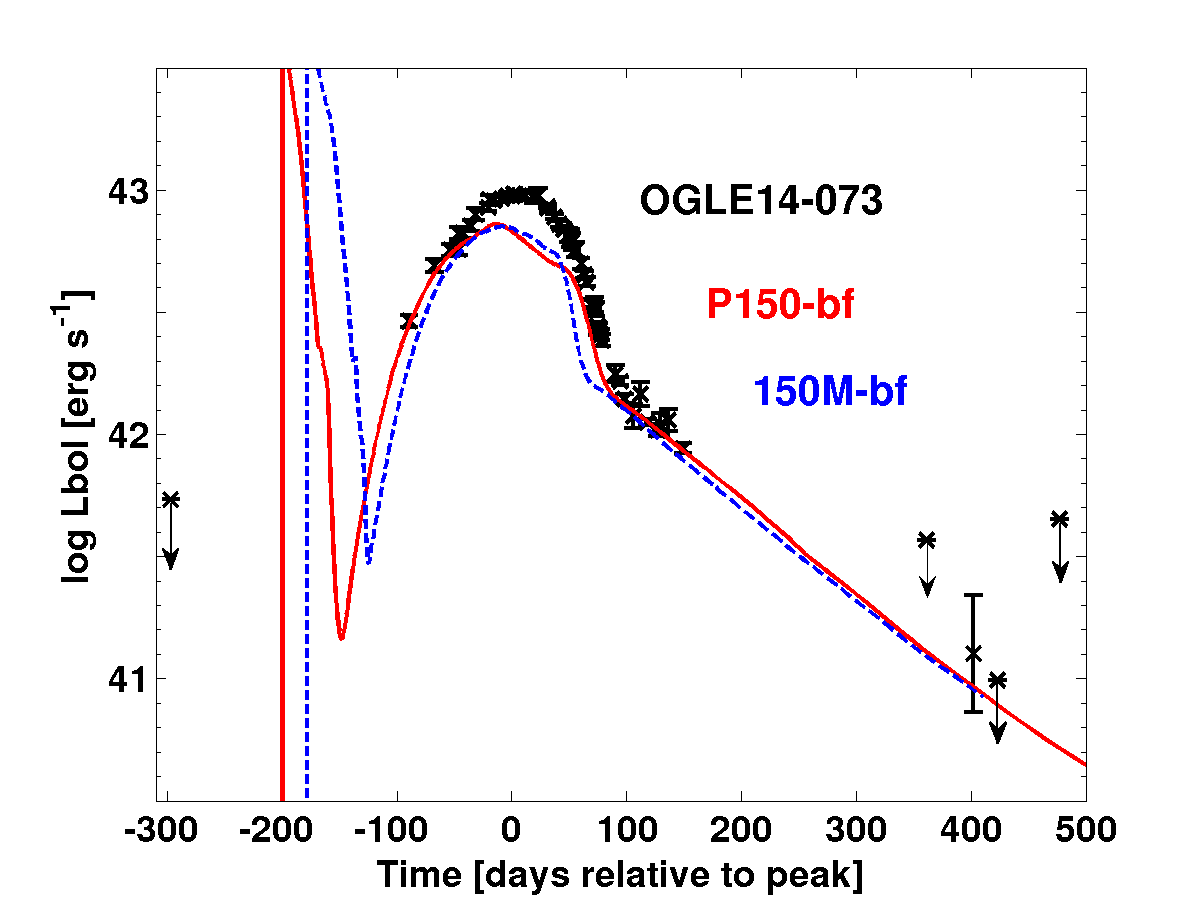
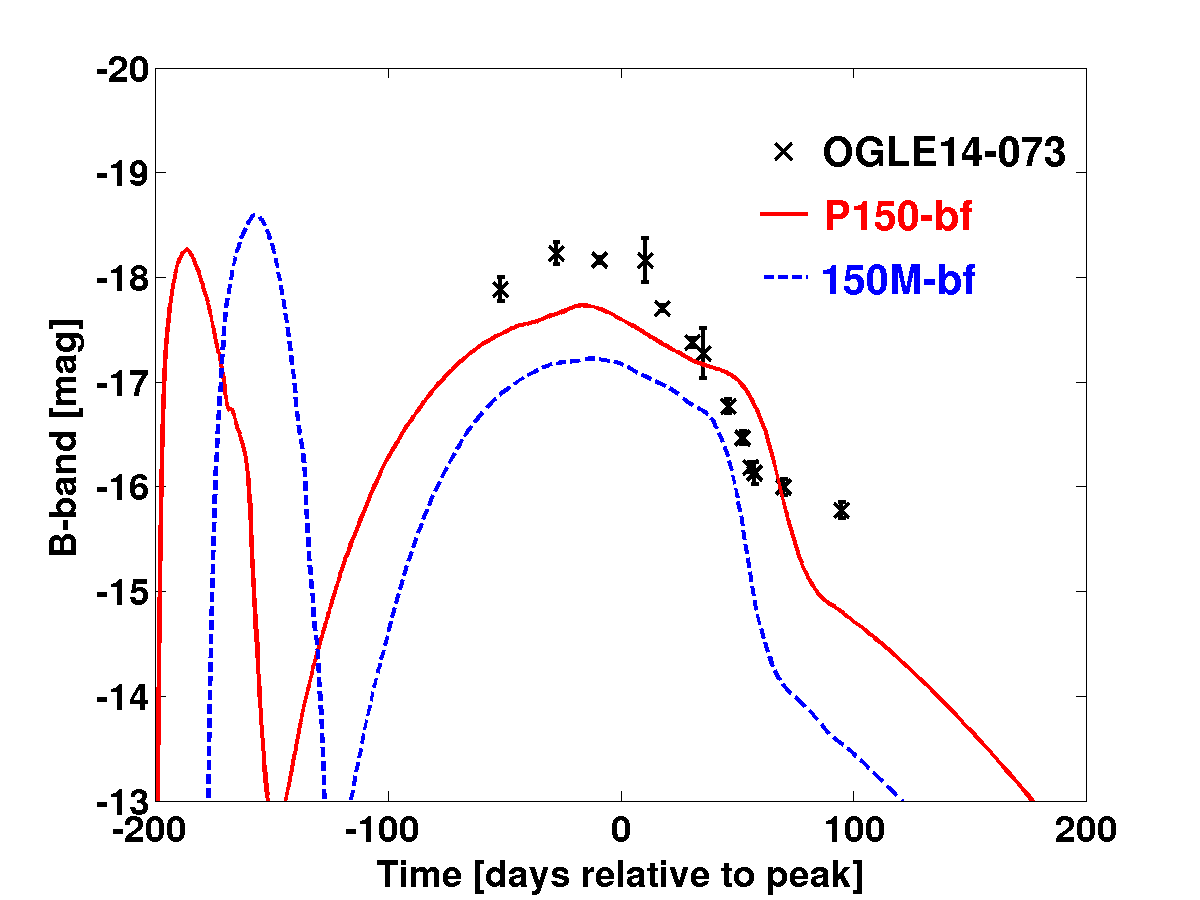
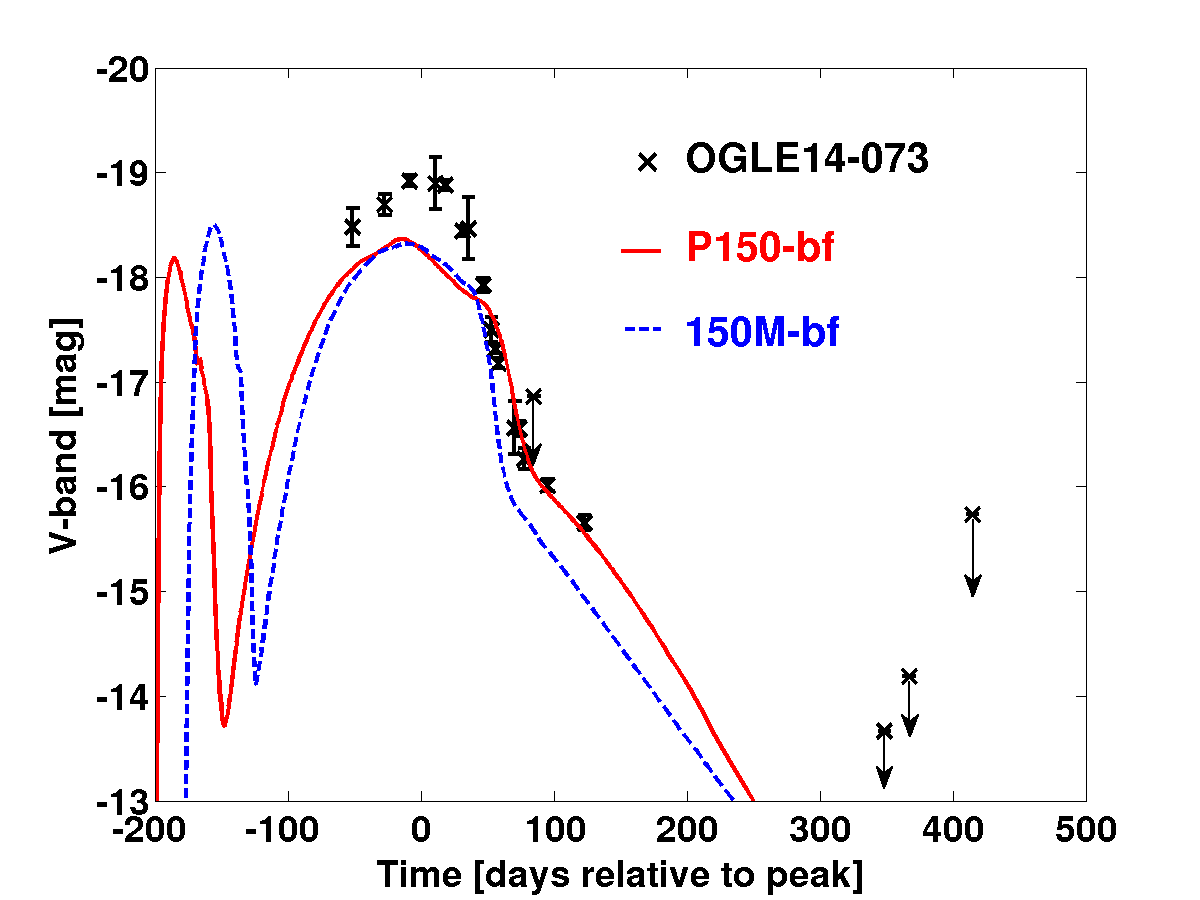
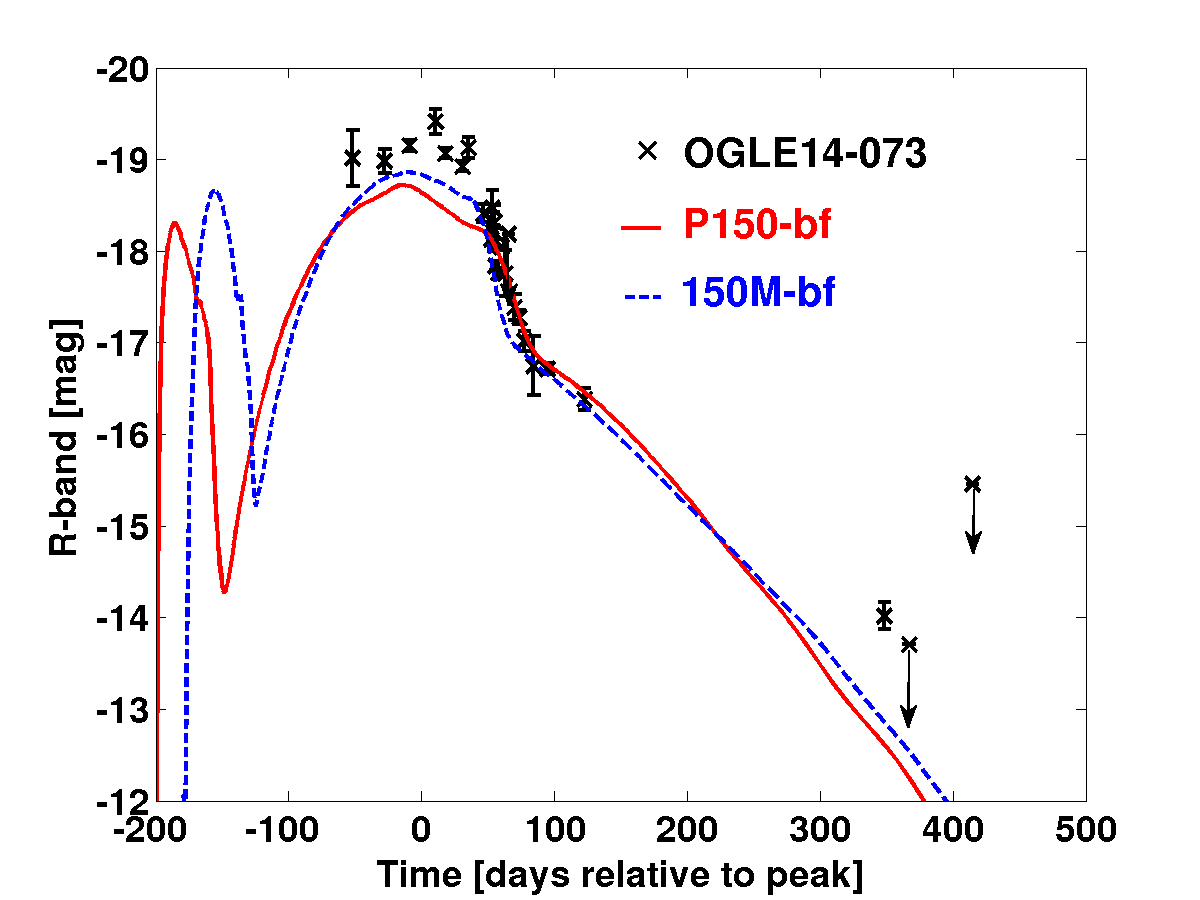
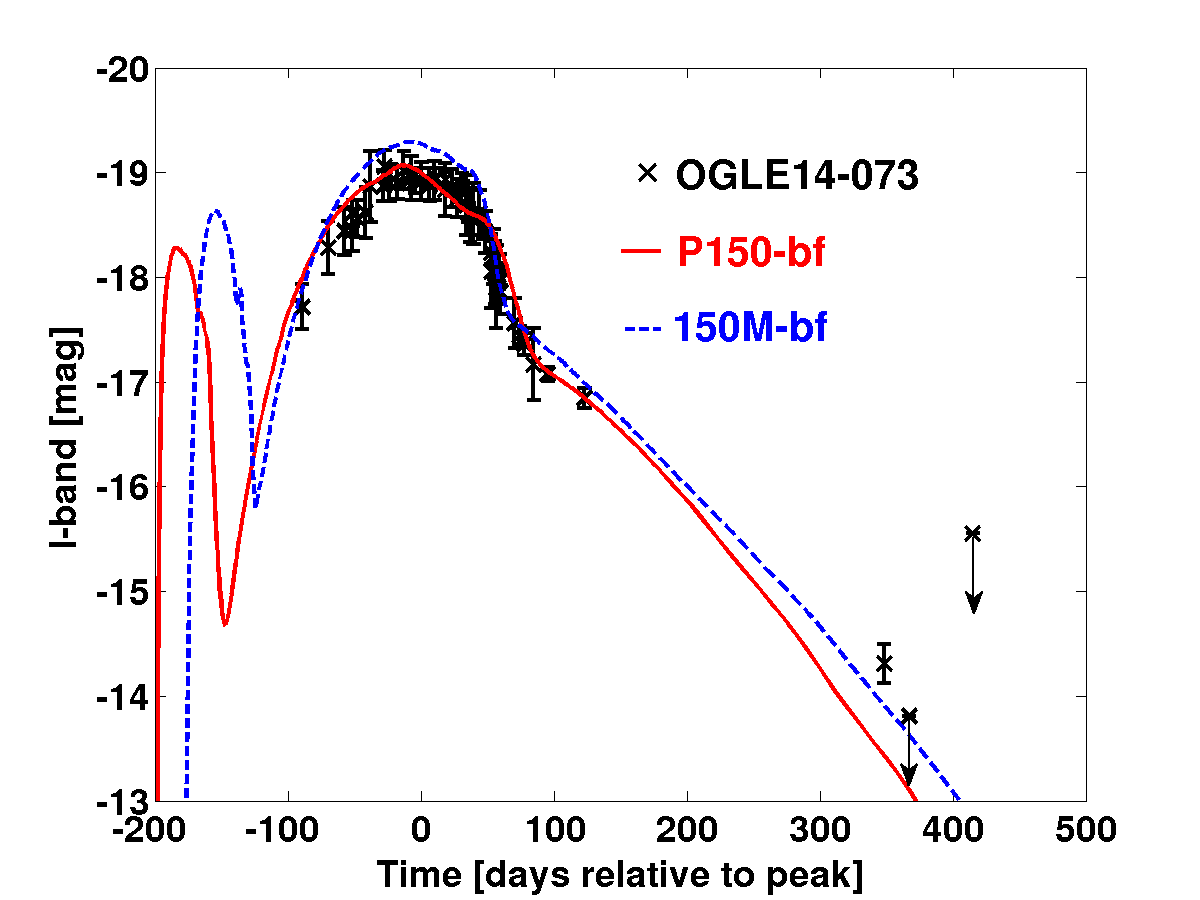
In Figures 2 and 3, we show our best-fitting synthetic light curves from the stella calculations for our modified models 150M-bf and P150-bf. Bolometric light curves and the evolution in the B, V, R, and I bands are shown, respectively. The models qualitatively follow the observed light-curve evolution of OGLE14-073. In particular, the slope during the rise to the peak, the smooth dome-like shape of the peak phase, the drop after the peak and transition to the tail are well-reproduced. The bolometric luminosity at peak is underestimated by 0.15 dex compared to OGLE14-073. The light curves are redder by 0.9 mags and 0.4 mags in B for 150M-bf and P150-bf respectively. In V and R, both models are too red by 0.3 mags while a perfect match between models and observations is achieved in the I band. This colour effect could be related to the LTE assumption in stella or its simplified treatment of line opacities. For other PISN models it was suggested that the red colours result from line blanketing due to the high metal content of the models, particularly of 56Ni (Dessart et al., 2013). As 56Ni is confined to the central ejecta regions in our model, we expect the effect of line blanketing to be much weaker. In fact, our synthetic spectra presented in Section 3.2 are in good agreement with the broad-band SED observed in OGLE14-073.
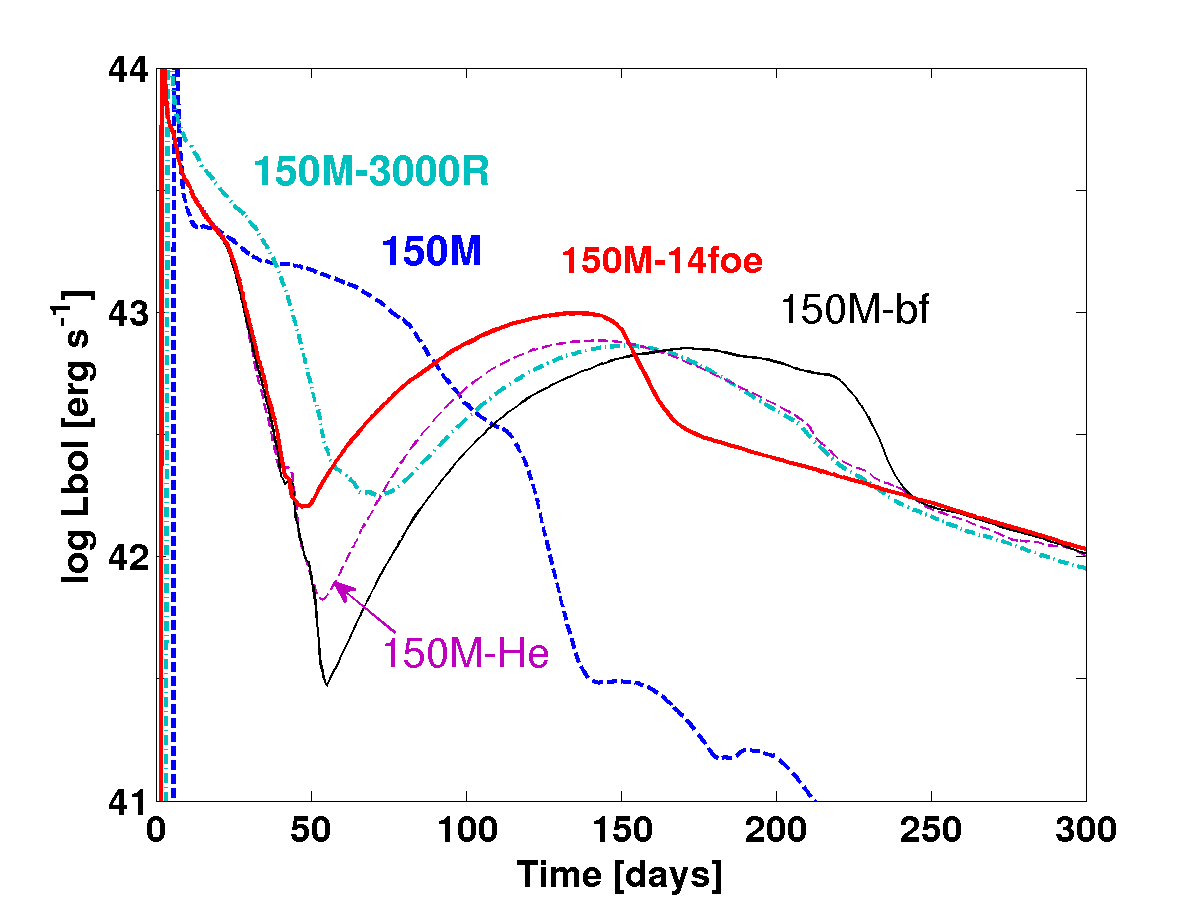
In the following, we present our findings when exploring the various modifications of the original PISN models, in particular with respect to the bolometric light curve. Specifically, we investigate the consequences of changes of the amount of 56Ni and hydrogen mixing, varying the explosion energy and the radius of the progenitor. The resulting trends are illustrated in Figures 4, 5, and 6:
-
•
Larger radius (model 150M-3000R) and higher energy (150M-14foe) for the model 150M increase the luminosity during the cooling phase after shock breakout and extend its duration as shown in Figure 4. As there are no data between the non-detection limit (160 days before maximum) and the first discovery observation, the cooling phase cannot be well constrained.
-
•
A higher explosion energy reduces the diffusion time (, Arnett 1982), hence, the light curve peaks earlier. We demonstrate this effect with the model 150M-14foe which is the same as 150M-bf but with the explosion energy increased by 5 foe (see Figure 4). 150M-14foe peaks 50 days earlier than our best fitting model 150M-bf.
-
•
The deeper hydrogen is mixed into the ejecta, the broader the dome-like maximum phase is. Hydrogen remains the main element providing electrons and contributing to the total opacity via electron scattering. Therefore, substituting hydrogen with helium leads to a sharper rise to peak. We demonstrate the He-effect with model 150M-He (see Figure 4).
-
•
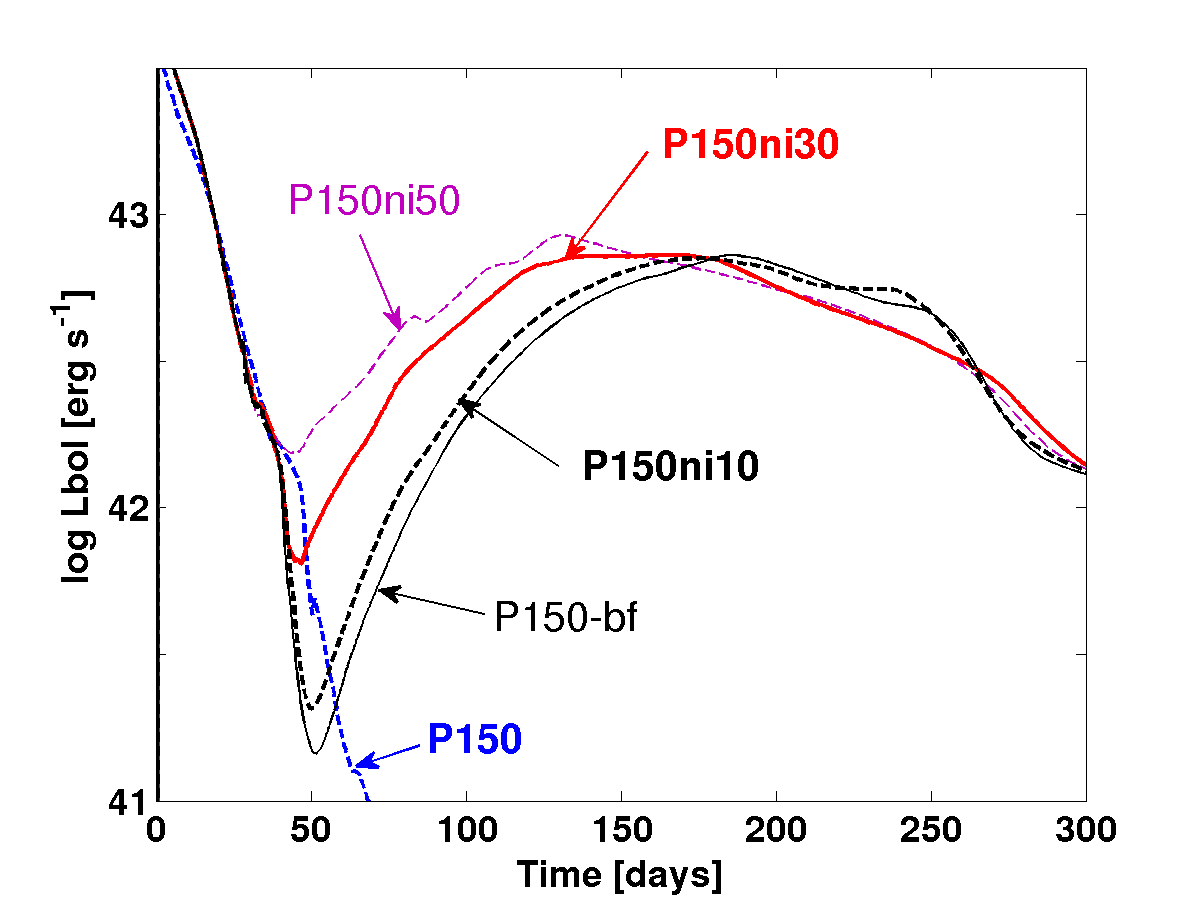
Mixing of 56Ni shortens the effective diffusion time and reduces the time between explosion and maximum light. We run model P150 with 56Ni distributed uniformly in the innermost 10 (model P150ni10), 30 (model P150ni30) and 50 (model P150ni50), and show the resulting light curves in Figure 5. The resulting light curves have a shallower minimum after post shock breakout cooling and in turn start rising earlier than the model P150-bf with centrally concentrated nickel. On top of that, the dome-like light curve loses the “OGLE14-073” shape and tends to peak earlier, while the decline after the peak becomes flattened. We conclude that an extended distribution of 56Ni makes the model less applicable to OGLE14-073.
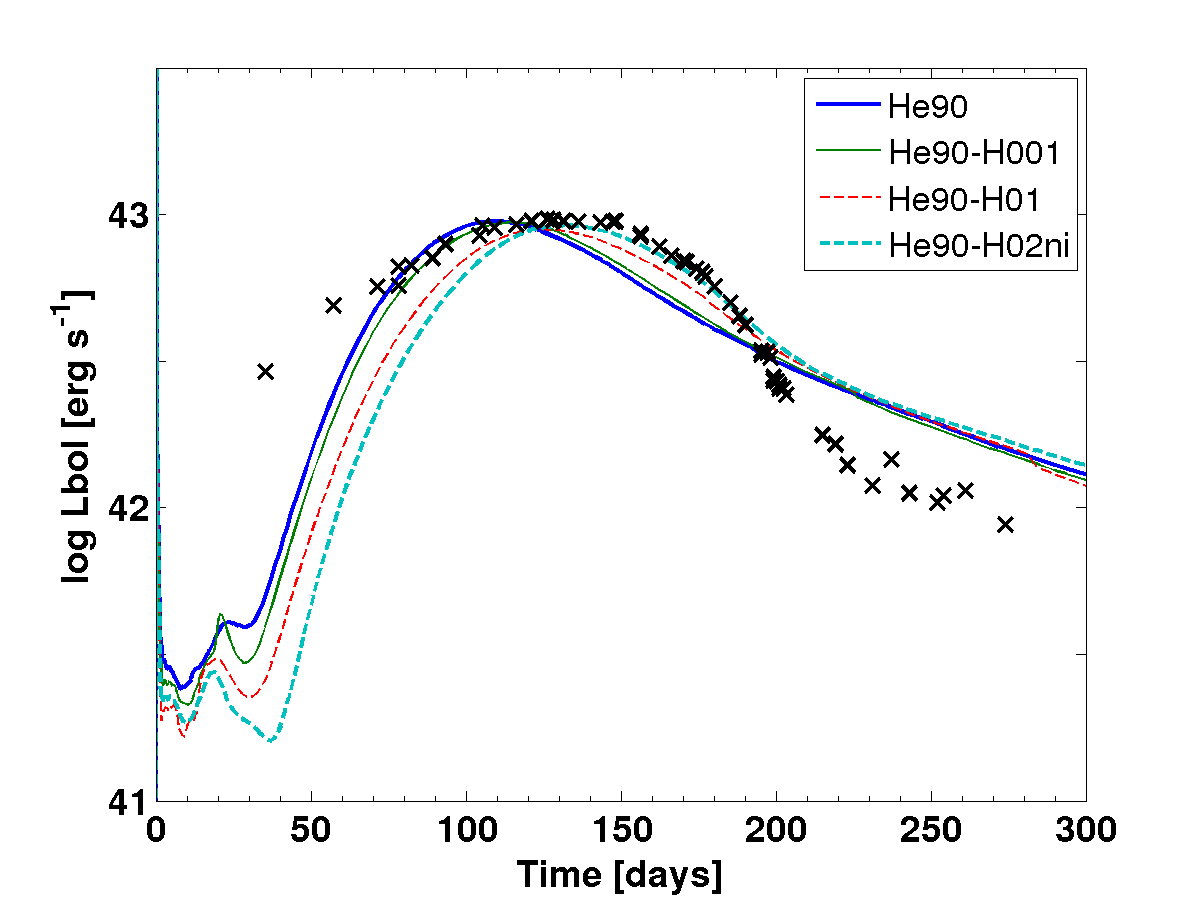
To explore whether more compact models may improve the overall match between the synthetic and observed bolometric light curve, we carry out additional simulations based on the PISN model He90 from Heger & Woosley (2002). He90 is a compact (18 ) helium star model which produces 1.3 of 56Ni in the pair-instability explosion. Peak luminosity is reached 60 days earlier (about 100 days after the explosion) than for the hydrogen-rich models 150M-bf and P150-bf, as shown in Figure 6. At the same time, the overall light curve becomes narrower and does not reproduce the slopes of the OGLE14-073 light curve. We test the model He90 with a modified chemical composition, i.e. with hydrogen mixed down to mass coordinate M . The models He90-H001, He90-H01, and He90-H02ni have different hydrogen mass fraction: 0.001, 0.1, and 0.2, correspondingly. We kept the original distribution of 56Ni (it is naturally distributed in 20 ) in the models He90, He90-H001, and He90-H01. In the model He90-H02ni, 56Ni is located in the central 2 to attempt to extend the rising phase of the light curve. Nevertheless, these modifications did not improve the match. We conclude that the compact helium model He90 and its modifications do not result in observational properties that match OGLE14-073.
Before shifting our focus towards the spectral properties of OGLE14-073, we briefly summarize our findings based on modelling the bolometric and broad-band light curves. By modifying two first-principle PISN models, we are able to produce light curves that qualitatively reproduce the observed evolution of OGLE14-073. A crucial ingredient is to invoke down-mixing of hydrogen into the inner ejecta regions, similar to what has been observed for SN 1987A. As anticipated in the study of Terreran et al. (2017), a fairly high 56Ni mass is needed to achieve a peak brightness similar to OGLE14-073. Unlike for SN 1987A, we do not require to mix radioactive 56Ni from the centre to the outer ejecta regions. Instead, our best-fit models have centrally located 56Ni. Finally, the explosion energy and progenitor radius are somewhat unconstrained since they mainly affect the cooling phase, for which there is little observational information.
3.2 Spectral properties
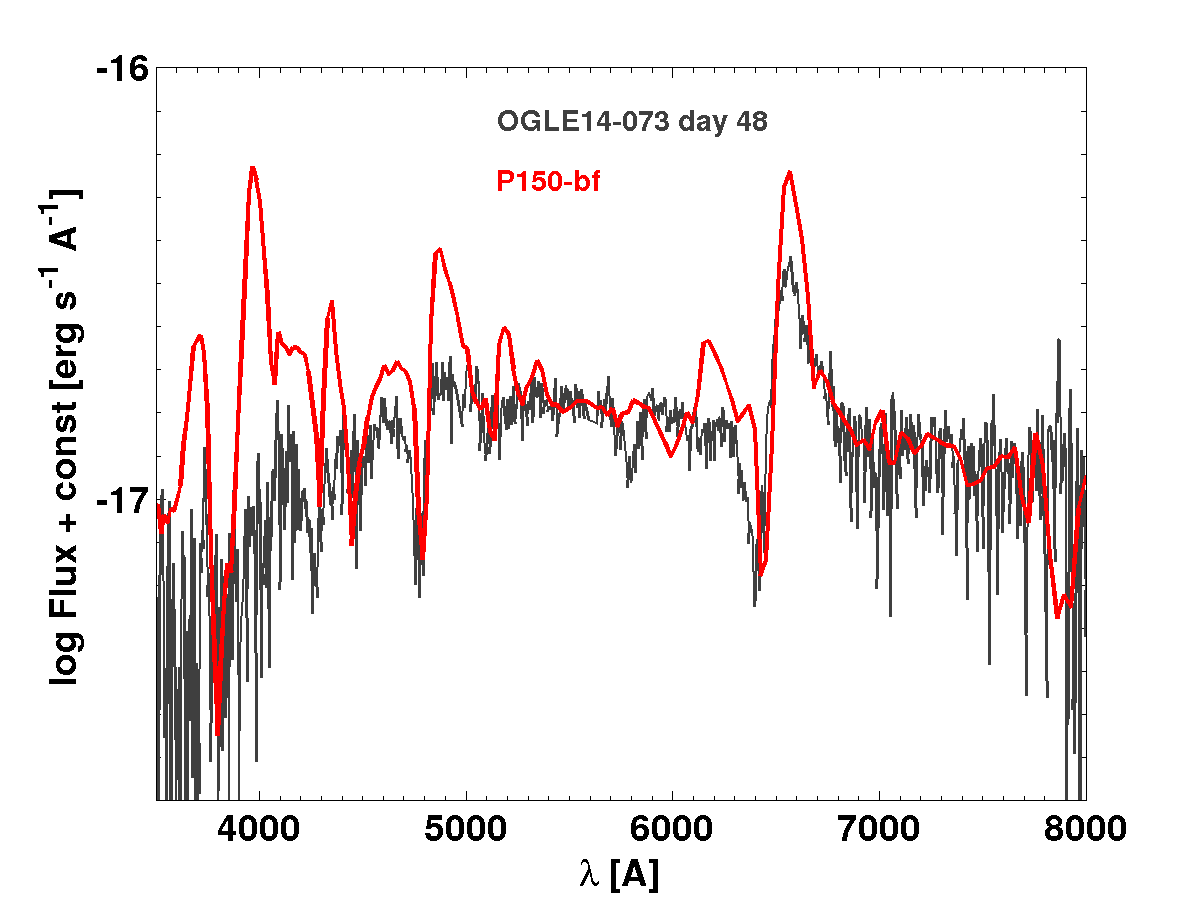
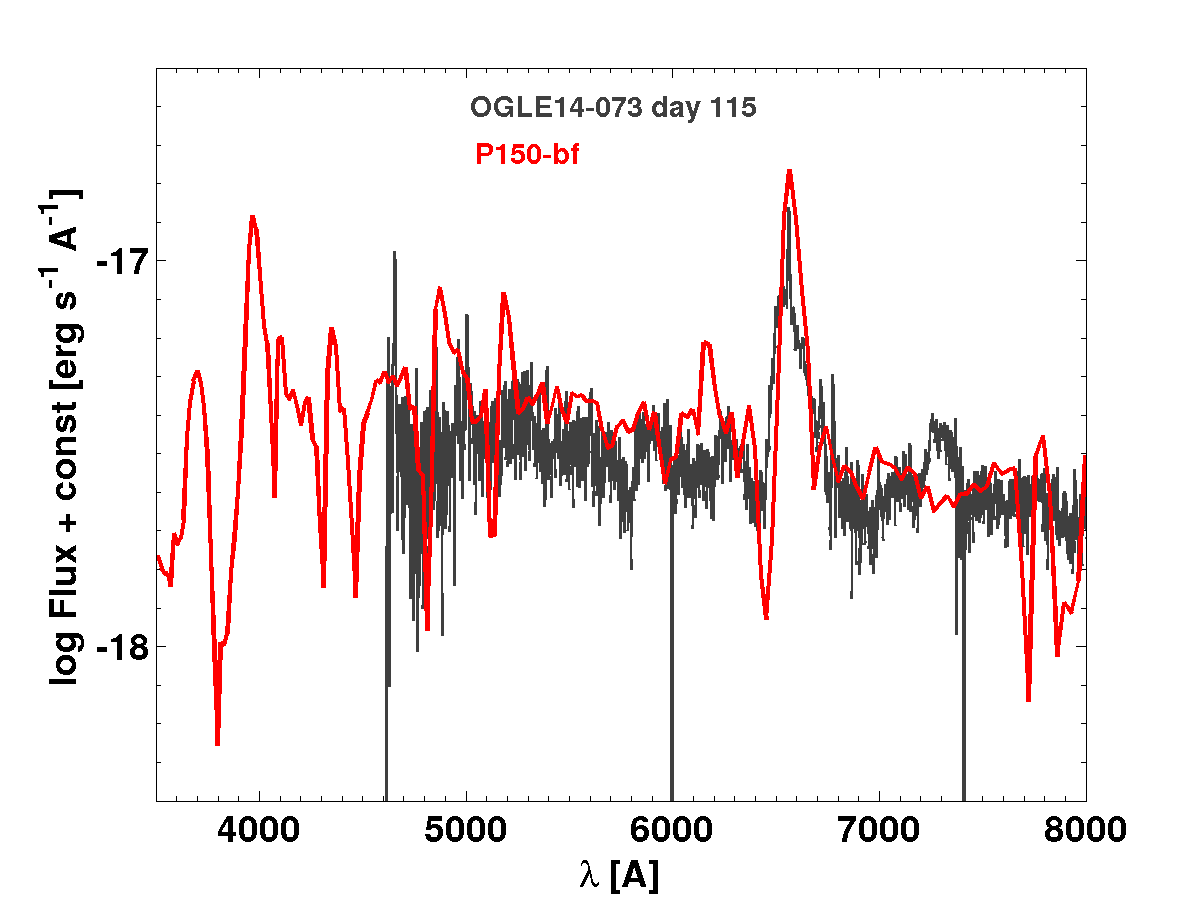
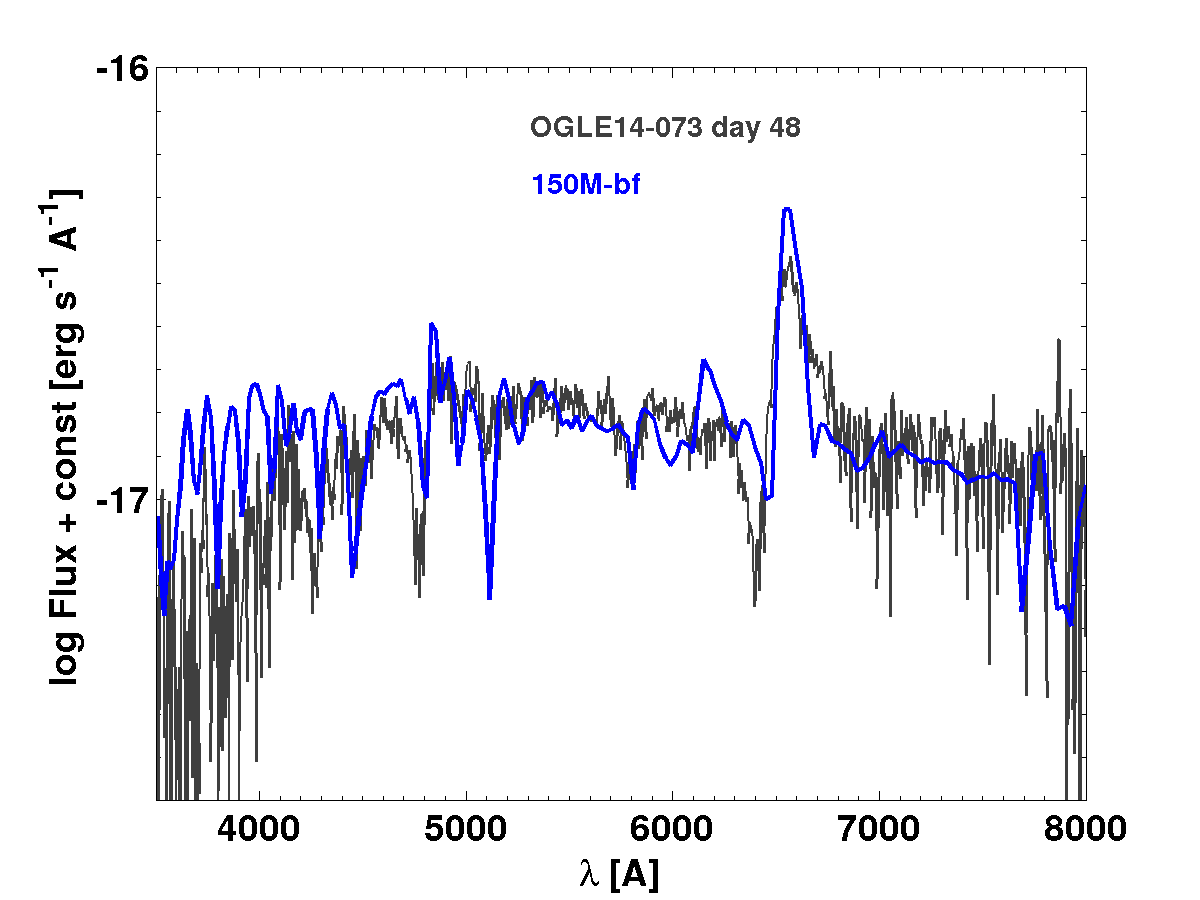
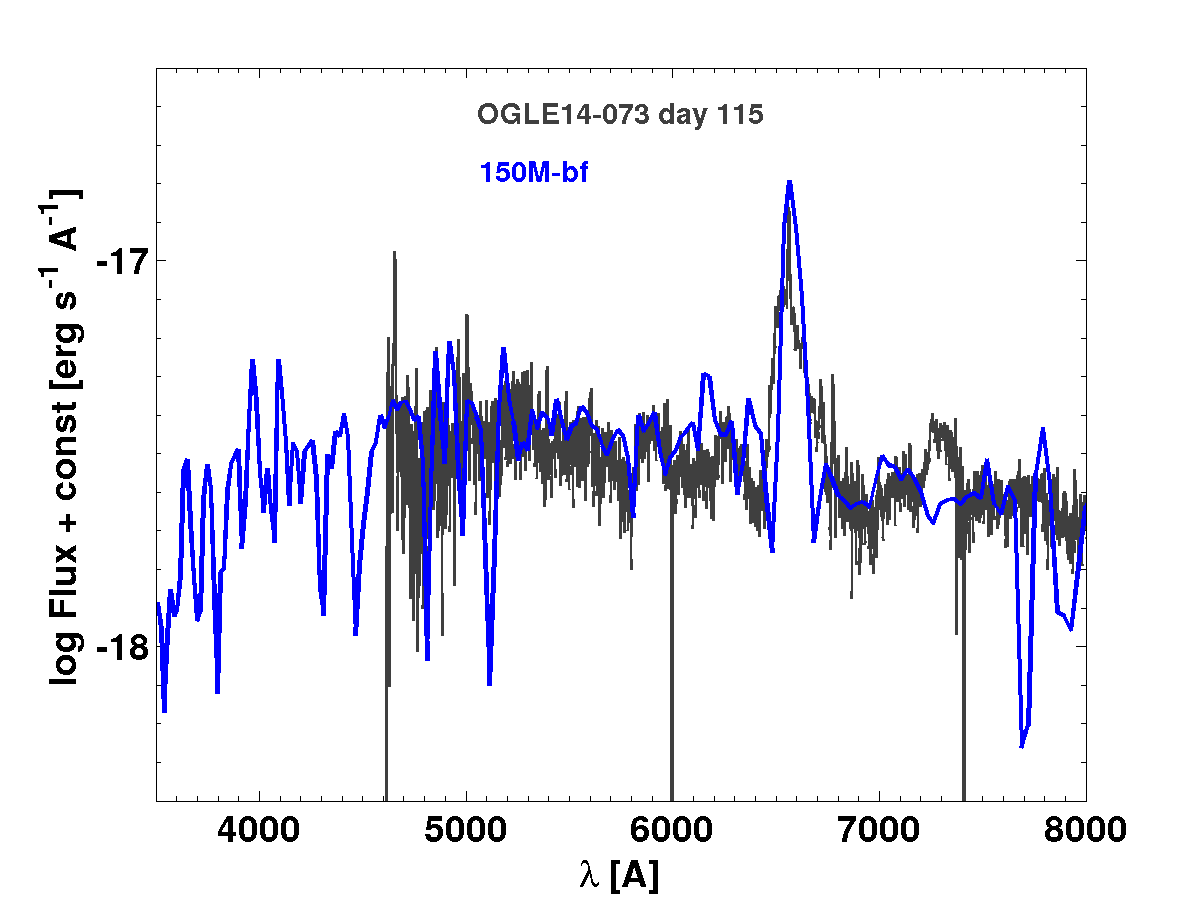
For our best-fit models P150-bf and 150M-bf we simulated the spectral evolution from 50 to 450 d with artis and compared the synthetic spectra to those observed for OGLE14-073. A subset of these comparisons for both models is shown in Figures 7 and 8, respectively.
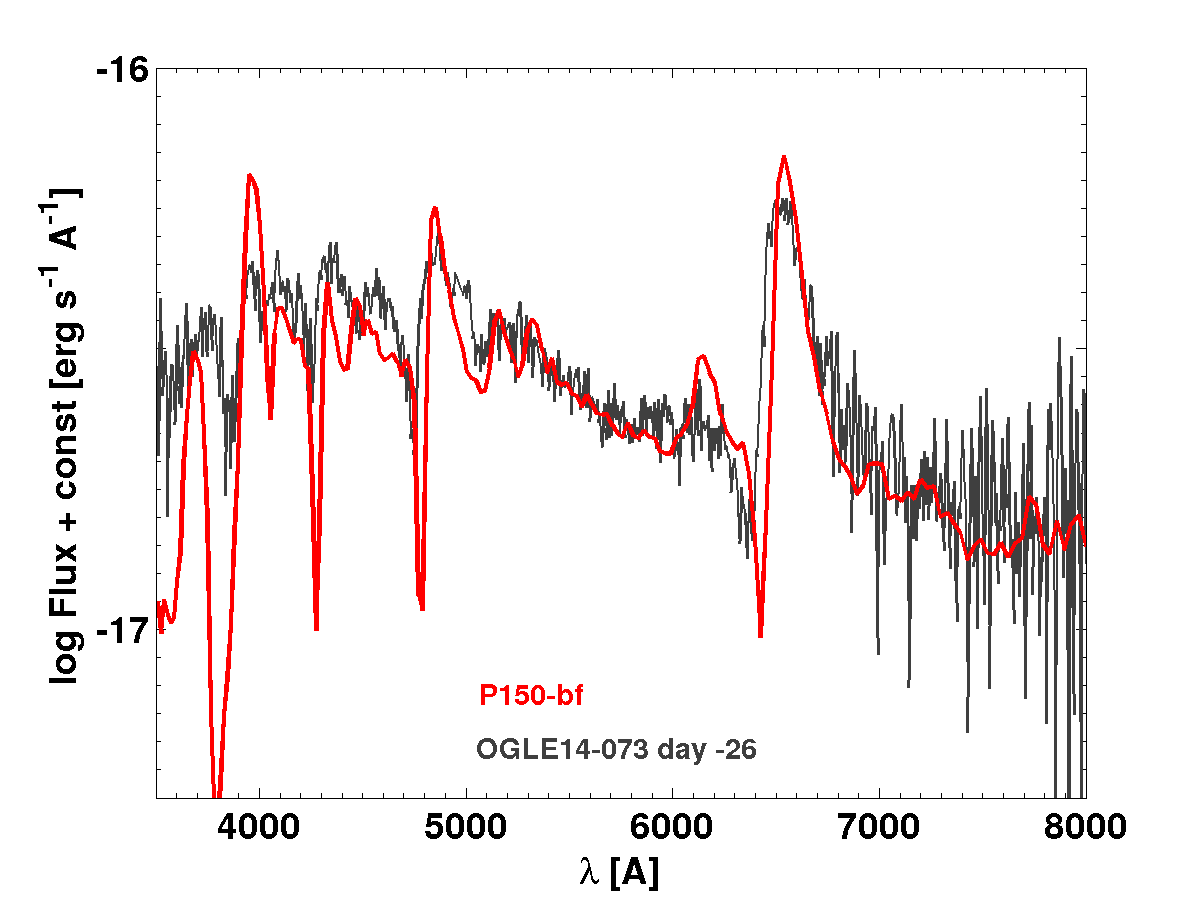
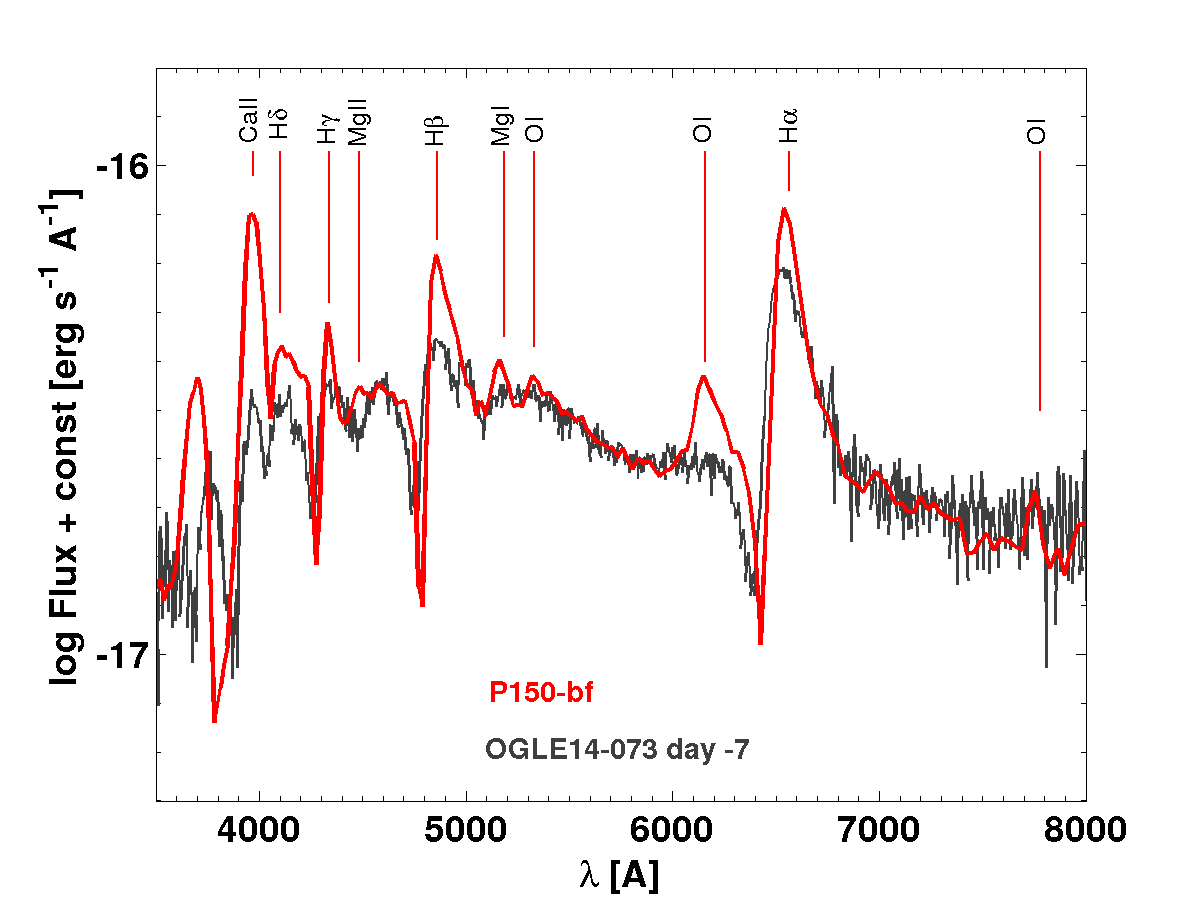
Figure 7 shows synthetic spectra of model P150-bf for four epochs at day –26, –7, 48, 115 relative to bolometric peak (the corresponding model epochs are 189, 208, 263, and 330 days past explosion, respectively). Overall the agreement between P150-bf and OGLE14-073 is fairly good. The shape of the continuum in the model matches the observation between 4000 Å and 8000 Å. However, there are minor (0.1 dex) differences in the flux level which corresponds to an uncertainty in the distance estimate of about 15 %. The characteristic hydrogen lines are clearly visible in the synthetic spectra, and the shape of H, H, and H are in rough agreement with the shape of the observed line features in OGLE14-073. A closer inspection reveals that the detailed shape of the synthetic H lines is slightly too narrow compared to the observations. This may suggest insufficient ejecta velocities and in turn too low kinetic energies in the explosion. However, hydrogen at higher velocity, i.e. at a larger mass coordinate, leads to a different light curve evolution inconsistent with the observed light curve of OGLE14-073. Uncertainties in the ionization/excitation structure may also affect the width of the hydrogen lines.
A clear difference between P150-bf and OGLE14-073 is visible to the blue of H. While the model spectrum shows an emission feature at around 6200 Å that is originating from O i , no such feature is present in OGLE14-073 at –26, –7 and 48 days. A similar behavior is observed for O i that leads to a clear absorption feature in the model at around 5200 Å but not in OGLE14-073. In contrast, both model and data show an absorption feature at around 5100 Å. In the model this feature is due to Mg i and its strength increases with time, while in the data it is getting weaker.
Another difference between P150-bf and the observed spectra is visible in the Ca H&K absorption. Although present in OGLE14-073, the features are much weaker than those predicted from our model. This suggests too much Ca in the model. The major fraction of calcium is produced in the pair-instability explosion due to explosive oxygen and silicon burning, resulting in 0.4 of Ca. However, there is also a small contribution resulting from progenitor metallicity. This leads to a Ca mass fraction at the () level up to the outermost ejecta layers (c.f. Figure 1), which owing to the intrinsic strength of the Ca H&K features gives rise to significant absorption. Also, there is a strong Ca infrared triplet feature in all synthetic spectra. In the corresponding spectral range, only in the last epoch data is available and again does not show such a strong feature.
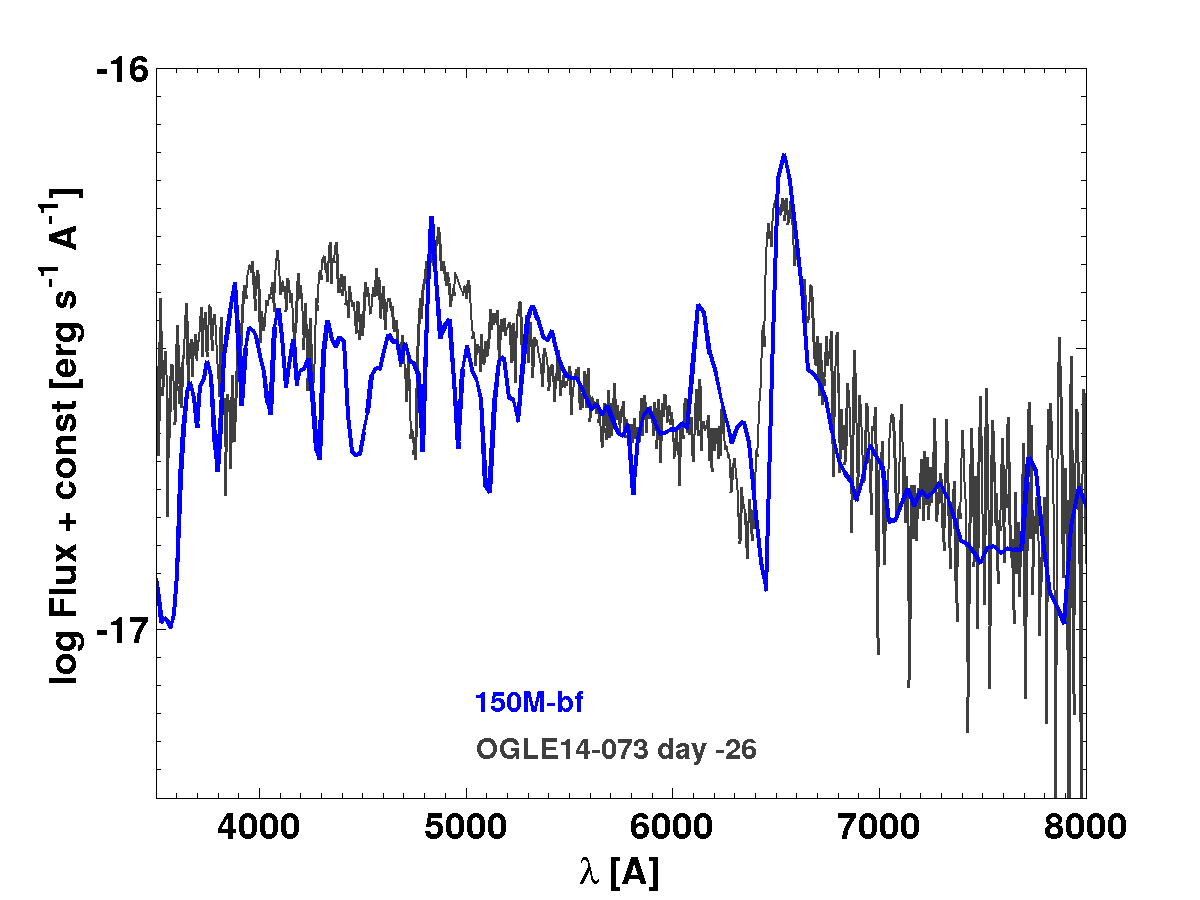
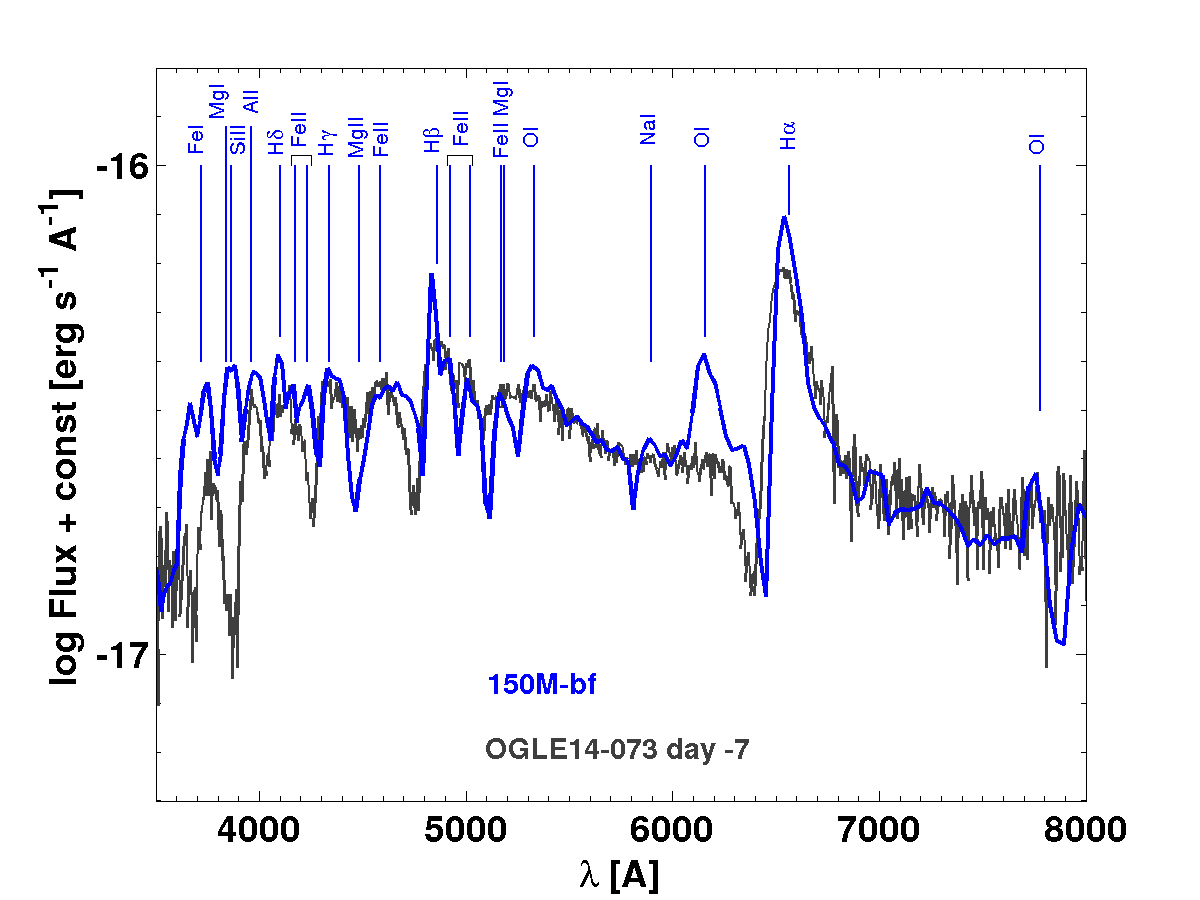
Figure 8 shows synthetic spectra of model 150M-bf for four epochs at day –26, –7, 48, 115 relative to bolometric peak (the corresponding model epochs are 179, 198, 253, and 320 days past explosion, respectively). Similar to P150-bf, model 150M-bf also provides a reasonable match with OGLE14-073. The overall flux distribution in the the observed range between 4000 Å and 8000 Å agrees fairly well, and the H Balmer lines, which are the dominant line features in OGLE14-073, are clearly present in the model. As for P150-bf, the detailed line shapes of the Balmer lines of 150M-bf are also too narrow compared to OGLE14-073. In fact 150M-bf has even narrower lines than P150-bf since the maximum ejecta velocity in 150M-bf is lower (11,000 vs. 16,700 km s-1). The strong emission feature at around 6200 Å that is not seen in OGLE14-073 and originates from O i in our models is also present in 150M-bf.
Apart from these similarities between the two models, there are also important differences. While P150-bf shows a strong absorption in the Ca ii H&K lines, this feature is absent in 150M-bf. This results from a different treatment of the progenitor metallicity in the initial models 150M and P150 (see Section 2.1), which leads to a different Ca distribution in the two models (see Figure 1). In model 150M-bf the Ca mass fraction drops to zero at a mass coordinate of M⊙. In contrast, P150-bf contains Ca throughout the ejecta, though at a low mass fraction of in the outer layers. However, given the large ejecta mass and the high intrinsic strength of the Ca ii H&K lines, this is sufficient to lead to strong Ca features in P150-bf.
Another difference between P150-bf and 150M-bf is the distribution of iron-group elements, specifically 56Ni. In P150-bf the 56Ni mass fraction drops abruptly at 1.6 solar masses, while 150M-bf shows a more gentle decline of 56Ni (see Figure 1). This leads to significant contributions from Fe lines (from the decay of 56Ni) in the synthetic spectra of 150M-bf, while the optical spectra of P150-bf are still dominated by line features of intermediate mass elements.
Despite some problems in the features associated with a few elements, we emphasize that the synthetic spectra of our best-fitting models provide overall a good match to the observations of OGLE14-073. In particular, we find good agreement in the continuum and thus also the broad-band colors. This is different from previously published PISN models (e.g. Dessart et al., 2013; Chatzopoulos et al., 2015; Jerkstrand et al., 2016), which, compared to observed SNe, suffered from a lack of flux at UV and blue wavelengths owing to strong line blanketing. Altogether, the good agreement found from our spectral and light curve modeling make OGLE14-073 a very promising PISN candidate.
4 Conclusion
In this work, we have examined a possible PISN origin of the bright type II supernova OGLE14-073. As a starting point for our investigation, we use two first-principle PISN models with an initial progenitor mass 150 at metallicity 0.001. Modifications in the progenitor properties and ejecta structure enable a good match of the characteristic bolometric features of OGLE14-073. In particular, a relatively large mass of 56Ni, in the range of 1.3 – 1.4 , was required to match the peak brightness. This increase is reasonable given the high sensitivity of the amount of 56Ni synthesized during a PISN on small changes in the progenitor CO core mass as discussed in the introduction. Furthermore, hydrogen must be mixed into the inner ejecta regions (down to a radial mass coordinate of 10 ) to produce the characteristic dome-like shape of the OGLE14-073 light curve around peak. Such mixing is predicted by multidimensional explosion simulations and observed in SN 1987A, which shares some similarities with OGLE14-073. The best-fitting models thus constructed produce synthetic light curves which match the observed bolometric evolution of OGLE14-073 fairly well. In particular, the dome-like structure around peaks is reproduced, as is the sharp post-peak drop-off and the settling onto the light curve tail which seems to follow the characteristic radioactivity decline.
In addition to the good agreement in the bolometric light curve, our models P150-bf and 150M-bf also reproduce the observed spectral evolution of OGLE14-073 remarkably well. In particular, we find a good match to the overall SED and the broad-band colours from epochs well before peak to several weeks thereafter. This is different from previous PISN models, which suffer from a flux deficit in the blue wavelength regime owing to strong line blanketing by large amounts of iron-group elements in the ejecta. This effect is much less prominent in our models, since 56Ni, the dominant iron-group species, is confined to the central region of the ejecta. Our synthetic spectra also reproduce many of the observed absorption features of OGLE14-073, specifically the prominent hydrogen Balmer lines. In detail, however, there are some differences in the line shapes. Given that the models have not been tuned to fit the spectra this is to be expected. Also, a more sophisticated radiative transfer treatment may lead to better agreement in the absorption features.
In summary, our best-fitting models produce synthetic observables that fit many characteristic features observed in OGLE14-073. In fact, the match between predicted and observed signatures reported here is significantly better than for previous PISN candidates (Dessart et al., 2013; Kozyreva et al., 2017; Jerkstrand et al., 2017). Consequently, we conclude not only that a PISN origin of OGLE14-073 is possible but that this bright SN is one of the most promising PISN candidates. Late-time nebular spectra may substantiate this interpretation. However, no such data are available for OGLE14-073 which faded fairly quickly after the last observations reported by Terreran et al. (2017).
Acknowledgements
The stella simulations were carried out on the DIRAC Complexity system (grants ST/K000373/1 and ST/M006948/1), operated by the University of Leicester IT Services, which forms part of the STFC DiRAC HPC Service (www.dirac.ac.uk). For the artis simulations, we gratefully acknowledge the Gauss Centre for Supercomputing (GCS) for providing computing time through the John von Neumann Institute for Computing (NIC) on the GCS share of the supercomputer JUQUEEN (Stephan & Docter, 2015) at Jülich Supercomputing Centre (JSC). GCS is the alliance of the three national supercomputing centres HLRS (Universität Stuttgart), JSC (Forschungszentrum Jülich), and LRZ (Bayerische Akademie der Wissenschaften), funded by the German Federal Ministry of Education and Research (BMBF) and the German State Ministries for Research of Baden-Württemberg (MWK), Bayern (StMWFK) and Nordrhein-Westfalen (MIWF). MK acknowledges support from the Klaus Tschira Foundation. UMN is supported by the Transregional Collaborative Research Centre TRR 33 “The Dark Universe” of the German Research Foundation (Deutsche Forschungsgemeinschaft). RH acknowledges support from EU-FP7-ERC-2012-St Grant 306901, the World Premier International Research Centre Initiative (WPI Initiative), MEXT, Japan, and the “ChETEC” COST Action (CA16117). The authors thank Ryan Wollaeger (LANL, USA) for additional simulations with the spectral synthesis code SuperNu.
References
- Arnett (1982) Arnett W. D., 1982, ApJ, 253, 785
- Barkat et al. (1967) Barkat Z., Rakavy G., Sack N., 1967, Physical Review Letters, 18, 379
- Blagorodnova et al. (2014) Blagorodnova N., et al., 2014, The Astronomer’s Telegram, 6489
- Blinnikov et al. (2006) Blinnikov S. I., Röpke F. K., Sorokina E. I., Gieseler M., Reinecke M., Travaglio C., Hillebrandt W., Stritzinger M., 2006, A&A, 453, 229
- Chatzopoulos et al. (2013) Chatzopoulos E., Wheeler J. C., Couch S. M., 2013, ApJ, 776, 129
- Chatzopoulos et al. (2015) Chatzopoulos E., van Rossum D. R., Craig W. J., Whalen D. J., Smidt J., Wiggins B., 2015, ApJ, 799, 18
- Dessart & Audit (2017) Dessart L., Audit E., 2017, preprint, (arXiv:1712.04492)
- Dessart et al. (2013) Dessart L., Waldman R., Livne E., Hillier D. J., Blondin S., 2013, MNRAS, 428, 3227
- Dubey et al. (2009) Dubey A., Reid L. B., Weide K., Antypas K., Ganapathy M. K., Riley K., Sheeler D., Siegal A., 2009, preprint, (arXiv:0903.4875)
- Ekström et al. (2012) Ekström S., et al., 2012, A&A, 537, A146
- Fryxell et al. (2000) Fryxell B., et al., 2000, ApJS, 131, 273
- Gilmer et al. (2017) Gilmer M. S., Kozyreva A., Hirschi R., Fröhlich C., Yusof N., 2017, ApJ, 846, 100
- Heger & Woosley (2002) Heger A., Woosley S. E., 2002, ApJ, 567, 532
- Jerkstrand et al. (2016) Jerkstrand A., Smartt S. J., Heger A., 2016, MNRAS, 455, 3207
- Jerkstrand et al. (2017) Jerkstrand A., et al., 2017, ApJ, 835, 13
- Kozyreva et al. (2014a) Kozyreva A., Blinnikov S., Langer N., Yoon S.-C., 2014a, A&A, 565, A70
- Kozyreva et al. (2014b) Kozyreva A., Yoon S.-C., Langer N., 2014b, A&A, 566, A146
- Kozyreva et al. (2016) Kozyreva A., Hirschi R., Blinnikov S., den Hartogh J., 2016, MNRAS, 459, L21
- Kozyreva et al. (2017) Kozyreva A., et al., 2017, MNRAS, 464, 2854
- Kromer & Sim (2009) Kromer M., Sim S. A., 2009, MNRAS, 398, 1809
- Kurucz & Bell (1995) Kurucz R., Bell B., 1995, Atomic Line Data, Kurucz CD-ROM No. 23., Cambridge, Mass.: Smithsonian Astrophysical Observatory., http://kurucz.harvard.edu/cdroms.html
- Langer et al. (2007) Langer N., Norman C. A., de Koter A., Vink J. S., Cantiello M., Yoon S.-C., 2007, A&A, 475, L19
- Lodders (2003) Lodders K., 2003, ApJ, 591, 1220
- Lucy (2002) Lucy L. B., 2002, A&A, 384, 725
- Lucy (2003) Lucy L. B., 2003, A&A, 403, 261
- Moriya et al. (2018) Moriya T. J., Terreran G., Blinnikov S. I., 2018, MNRAS, 475, L11
- Nomoto et al. (1988) Nomoto K., Shigeyama T., Kumaga S., Hashimoto M.-A., 1988, Proceedings of the Astronomical Society of Australia, 7, 490
- Rakavy & Shaviv (1967) Rakavy G., Shaviv G., 1967, ApJ, 148, 803
- Sim & Mazzali (2008) Sim S. A., Mazzali P. A., 2008, MNRAS, 385, 1681
- Sobolev (1957) Sobolev V. V., 1957, Soviet Ast., 1, 678
- Stephan & Docter (2015) Stephan M., Docter J., 2015, Journal of large-scale research facilities JLSRF, 1, A1
- Swartz et al. (1995) Swartz D. A., Sutherland P. G., Harkness R. P., 1995, ApJ, 446, 766
- Terreran et al. (2017) Terreran G., et al., 2017, Nature Astronomy, 1, 713
- Utrobin (1993) Utrobin V., 1993, A&A, 270, 249
- Verner et al. (1996) Verner D. A., Verner E. M., Ferland G. J., 1996, Atomic Data and Nuclear Data Tables, 64, 1
- Vink (2015) Vink J. S., 2015, in Vink J. S., ed., Astrophysics and Space Science Library Vol. 412, Very Massive Stars in the Local Universe. p. 77 (arXiv:1406.5357), doi:10.1007/978-3-319-09596-7_4
- Wongwathanarat et al. (2015) Wongwathanarat A., Müller E., Janka H.-T., 2015, A&A, 577, A48
- Wyrzykowski et al. (2014) Wyrzykowski L., Udalski A., Kozlowski S., Kostrzewa-Rutkowska Z., Szymanski M. K., Mroz P., Soszynski I., 2014, The Astronomer’s Telegram, 6494
- Yusof et al. (2013) Yusof N., et al., 2013, MNRAS, 433, 1114