Periodic spiking by a pair of ionic channels 111©2018. This manuscript version is made available under the CC-BY-NC-ND 4.0 license http://creativecommons.org/licenses/by-nc-nd/4.0/
Abstract
Neuronal cells present periodic trains of localized voltage spikes involving a large amount of different ionic channels. A relevant question is whether this is a cooperative effect or it could also be an intrinsic property of individual channels. Here we use a Langevin formulation for the stochastic dynamics of a pair of Na and K ionic channels. These two channels are simple gated pore models where a minimum set of degrees of freedom follow standard statistical physics. The whole system is totally autonomous without any external energy input, except for the chemical energy of the different ionic concentrations across the membrane. As a result it is shown that a unique pair of different ionic channels can sustain membrane potential periodic spikes. The spikes are due to the interaction between the membrane potential, the ionic flows and the dynamics of the internal parts (gates) of each channel structures. The spike involves a series of dynamical steps being the more relevant one the leak of Na ions. Missing spike events are caused by the altered functioning of specific model parts. The time dependent spike structure is comparable with experimental data.
keywords:
Langevin equations; nonlinear oscillations; periodic firing; channel gating1 Introduction
Neurons exhibit a great variety of firing electrical patterns. It is recognized that the neuronal electrical activity depends, besides from the synaptic inputs, on its electrophysiological membrane properties of the specific type of neuron [1, 2]. These membrane properties ultimately depends on physical processes, such as the movement of ions through the molecular channels, the membrane potential dynamics, and the gating dynamics of the channels. These processes are indeed complex, involving a large hierarchy of biomolecular structures from the atomic to the cellular and multicellular scales.
However, from the point of view of physical modeling, it is interesting to explain these processes by using a reduced formulation, with only a minimum of relevant physical mechanisms and variables. One could then address for instance the question of whether the observed firing behavior could appear in a very simple device or it is instead necessary a large biological complexity or a whole collectivity of channels [2, 3]. Also, due the the large variety and complexity of real neural outputs, it is fundamental the recognition of the different fundamental firing patterns. Then one could in principle try to reproduce the most basic response patterns by using only the necessary ingredients in a unified framework, and to study the changes of these basic patterns when varying the physical parameters. Once this aim is achieved, it is open the possibility of introducing more elements in order to reproduce more complex patterns. This objective implies the choice of a simple theoretical scenario as starting approach.
Most theoretical approaches for action potential dynamics are based on the classic Hodking-Huxley [4, 5] framework. It originally consists of deterministic equations for the dynamics of membrane permeability. At the level of individual channels other computational approaches consider microscopic details at the atomic scale by means of molecular dynamics simulations [6]. Also mechanical models for the gating dynamics for a K channel have been proposed [7]. In the last years there has been an increasing interest on the role of channel noise in neural firing patterns [8, 9, 10, 11, 12, 13, 14]. Fluctuations have usually been modeled by using either master equations for the gate states [15, 16], or by including stochastic terms into the membrane conductivities [17]. Also the diffusion of ions inside the channel has been considered [18, 19].
Recently, a semi-microscopic approach for the stochastic dynamics of individual molecular channels was formulated [20, 21]. This approach uses only some relevant physical mechanisms acting on a minimum model. Variables representing the relevant degrees of freedom (ion positions and gate states) interact through a single energy functional, and a Langevin dynamics is then constructed by following standard rules from statistical physics. It is worth to remark the physical consistency of the resulting formulation. On the one hand the magnitude of the fluctuations verifies the fluctuation-dissipation theorem. On the other hand the working of the channel is autonomous, with the energy source being the chemical energy from the different ionic concentrations inside and outside the cell. The resulting model was able to reproduce the basic properties of Na and K channels [21] and the excitable properties of a single Na channel in the presence of K leak [20].
Here we will show how this approach, applied to a unique pair of channels following known physical mechanisms acting on the membrane, is able to generate a periodic firing pattern of electrical activity. We will find the effects of the external control parameters, and answer questions on how to control the stability of the periodicity or where are the sources of misfunctioning.
The structure of this paper is as follows. In the next section we will show how a couple of gating pores, modeling Na and K channels, exhibit periodic firing with a well controlled period. Next we will study the changes in the response pattern by changes of different channel parameters and external conditions. We end with some conclusions. Some specific details of the approach are presented in the Appendix.
2 The periodic spiking minimum device
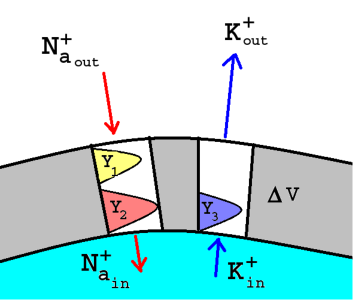
We have employed a minimum device consisting of a couple formed by two channel models, as a rude simplification of Na and K voltage-gated ionic channels, as pictured in Fig. 1. Each model is a simple physical pore with active gates controlled by the membrane potential. The Na-like channel has two gates, whereas the K-like channel has a single gate. This physical structure has been designed [20, 21] to follow experimental observations on individual Na and K channels (see for instance Chapter 4 in Ref. [2]).
The physical variables of the model are the ion positions , the gate coordinates , and the membrane potential . The are bistable variables such that the value 0/1 corresponds to the corresponding gate being closed/open. Gates , of the Na channel are activating and deactivating (i.e. open and close with membrane depolarization) respectively. According to experimental evidence, they are mediated by different parts of the channel structure [2, 22]. Gate of the K gate is activating. These gates (, , ) can be related to the activating (, ) and deactivating () functions appearing in the H–H formulation [4, 5].
We have considered a single degree of freedom ( variable) for each gate. Generalization to more variables to account for the existence of several voltage-sensing domains in real channels is straightforward, but it has not been considered here in order to keep the formulation of the model to a minimum. The control parameters are the out cell ionic concentrations with fixed intra cell concentrations. Thus we implicitly neglect changes in bulk concentrations originated by the small local flow from the pair of channels.
The model is defined by an energy functional describing the interaction between the different physical variables. The explicit construction of this functional is described in the Appendix. Following basic statistical physics the variables , follow a brownian stochastic dynamics [20]:
| (1) | |||||
| (2) |
where thermal noises fulfill
| (3) |
and are the corresponding frictions. Note that by construction the model verifies fluctuation-dissipation theorem. An analogous formulation for the coupling between ion and channel state, consistent with statistical physics, was already used in Ref. [18] to describe the stochastic behavior of singly occupied ion channels.
The numerical simulation of these equations, by a first order algorithm, allows to record the state of the gates and the position of the ions. The ionic concentrations in the bulk are implemented as boundary conditions at both ends of the channel for the Langevin dynamics of ions [23]. Finally, the dynamics of the membrane potential follows the classical capacitor equation
| (4) |
where is the membrane capacity assumed to be constant and the r.h.s term includes all the ionic fluxes either across the channel or membrane leaks.
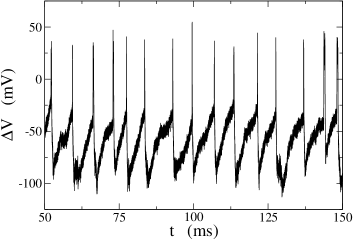
Letting the system evolve according the dynamical equations, without any external perturbation, we observe that the membrane potential present periodic pulses or spikes. We show a temporal evolution of this quantity in Fig. 2, which is very similar to those presented in some experiments, as it is seen for instance in Chapter 17 in Ref. [2].
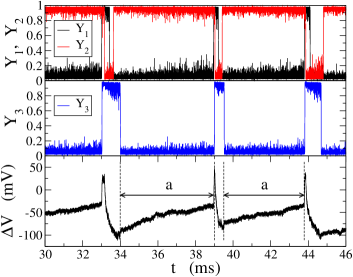
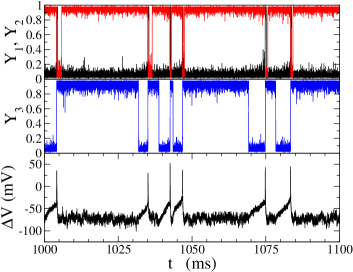
The working of the system during a few spikes, in this range of parameters, can be seen in Figs. 3, 4, where the evolution of the three gate variables and the membrane potential are shown.
| Regime | step | |||
| Stand-by | a | |||
| Pulse | b | |||
| Pulse | c | |||
| Refractory | ||||
| Refractory | ||||
| Refractory | ||||
| Error | ||||
| Error | ||||
| Error |
These figures reveal that any successful pulse involves three different regimes : stand-by, the spike event and the refractory state. These physical regimens are composed of steps (Table 1): stand-by from the membrane at the K-Nernst potential which corresponds to the dynamical depolarizing (step a), the spike (steps b and c) and the restoring of the K-Nernst potential (step d). Being more explicit the description of each step is:
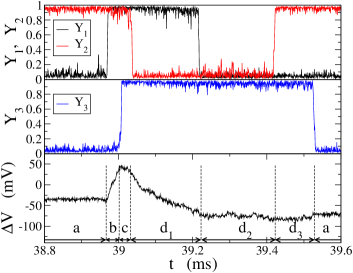
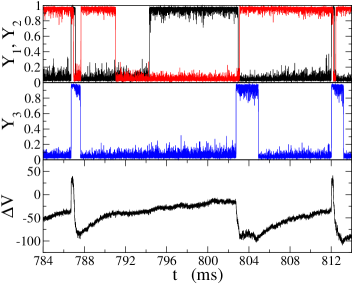
a).- This is the main dynamical process to trigger the pulse and to control the spike period. This step has the largest time span where the Na gate is closed and the gate is open. The K gate is just closed and the membrane potential is the K Nernst value mV (See Fig. 3 at ms). Now the gate, although closed, has nevertheless a small leak of Na ions. In Fig. 3 we see how this leak increases the action potential depolarizing the membrane. An analogous phase, the so called pacemaker depolarization, is found in Na channels of Purkinje cells [2].
b) and c).- The pulse. This regime is the shortest time interval, which is magnified in Fig. 4. The Na leak increasing triggers the sequence of events in the Na channel that originates first the opening of gate , which permits a larger flux of Na ions, depolarizing the membrane by increasing even further forming the pulse (b). Very quickly the gate of the K channel also opens and gate of the Na channel closes. Then the flux of K ions towards the exterior of cell leads the membrane potential to reset its polarization, leading to more negative values of (c).
d).- Na gate closes and the membrane potential relaxes towards the K-Nernst potential because during all this step the Na channel is closed and the K channel is open. In this regime the Na channel presents three different configurations of closed channel. d1: open and closed, d2: with and both closed, and d3 with closed and open. Then the Na channel rests in stand-by regime, until the K gate closes and the depolarization starts a new cycle.
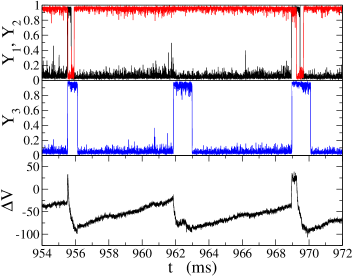
In this dynamics some cycles are observed to be missing because of the inherent stochasticity of the gate dynamics. In the first example the Na door closes before the completion of the depolarization of the action potential. This misses a possible spike at ms (Fig. 5). In the second example the K door opens reducing the membrane potential without a pulse at ms (Fig. 6). The system goes back to the state . These two cases of missed spikes disturb the regularity of the train of spikes, increasing the mean and the variance of the period. All these steps are summarized in Table 1.
3 Effect of the Na ions leak
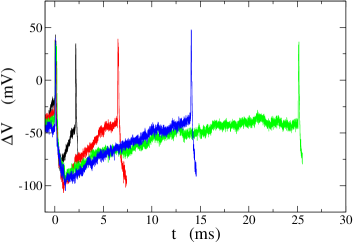
The pulse of the action potential is produced by the synchronized opening and closing of gates of the Na channel, and it is completely similar to the process described for the model of excitable membrane of Ref. [20]. The periodicity of the oscillatory behavior is controlled by the slow leak of the Na ions when both channels are closed, which introduces its time scale into the process. This slow leak could be produced by other processes or channels in more complex devices. In our case the period of the oscillations should directly be related to the rate at which ions can cross the potential barrier of the closed gate . As it is well known the time scale for crossing a barrier is given by the Arrhenius (or Kramers) law, according to which for , where is the height of the barrier (in this case that of the gate). To test this prediction we have performed simulations with different values of . Results of mean periods, measured as the time intervals between membrane potential peaks, are presented in Table 2.
| (k) | 8 | 9 | 9.85 | 10 |
|---|---|---|---|---|
| Number of oscillations | 501 | 274 | 115 | 94 |
| Mean period (ms) | ||||
| Std dev. (ms) |
Note that according to the Kramers’ law, by increasing the barrier height in 1T the crossing time should increase in a factor for . According the results in Table 2: , . While the order of magnitude is correct, the result is better for the larger barrier case as expected. In Fig. 7 four examples with different periods are plotted.
4 Effect of external cell concentrations
For a specific Na-K pair of channels, their internal parameter values, including concentrations, are fixed, so the most viable possibility of some external control is to change the external (out cell) Na and K concentrations.
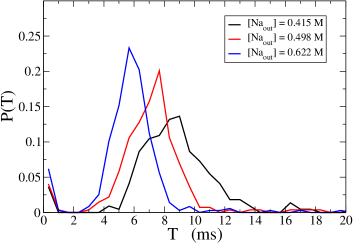
Na concentration: We expect that the height of the spike follows the Na concentration because the Na Nernst potential also increases as . Moreover the period of the oscillations is decreased because of the leak increase. Numerical simulation for different Na external concentrations were conducted to confirm this prediction. The distribution of periods can be seen in Fig. 8 and mean and variance values in Table 3.
| (out) (M) | 0.415 | 0.498 | 0.622 |
|---|---|---|---|
| Number of oscillations | 220 | 274 | 356 |
| Mean period (ms) | |||
| Std dev. (ms) |
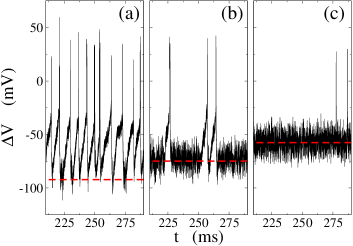
K concentration: We have seen in simulations that the period is rather insensitive to moderate variations of the external values of K concentration. When increasing it further a new effect appears. For higher values of K concentration the difference with the internal concentration is lower, and then with the channel K open the membrane polarization is lower (i.e. the potential reach smaller negative values), as it can be seen in Fig. 9. As a result the K channel has less tendency to close. Then, for larger time spans, the system remains in a state with the Na channel closed and the K channel open. In such state it is necessary a larger fluctuation to induce the closing of the K channel and initiate the depolarization of the membrane that will produce the spike (Fig.9b).
This behavior can be seen in more detail in Fig. 10 for a M. Note that the periodicity of the spikes, given until now by the time scale of the Na leak, is now broken. Instead, to this time it is now added the waiting time for the stochastic closing of the K channel. This introduces a new source of stochasticity.
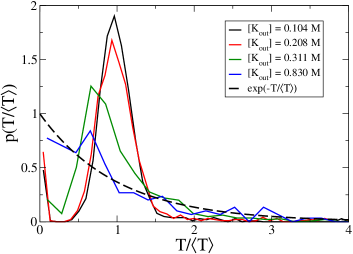
For even larger K concentrations the effect is stronger and the polarization of the membrane is weaker. As a consequence there are very few events of closing of the K gate. In this case some peaks of the membrane potential can be observed due to strong fluctuations, but now not necessarily associated with closings of the K channel (Fig. 9c). This is then an excitable regime controlled by fluctuations. In this regime the apparition of peaks is expected to be a stochastic poisson process, with an exponential distribution of waiting times, and then a standard deviation equaling the mean value. In our case, for the lower K concentrations the standard deviations are consistently lower than the mean values, indicating the presence of a well defined period. However for the larger concentrations both values are very similar, as seen in Table 4, indicating a poisson process. The period distributions, plotted in Fig. 11, clearly show the two limiting behaviors from an oscillatory regimen to an excitable one.
5 Conclusions
We have shown that the periodic spiking activity of the action potential can be modeled by an unique pair of Na and K ionic channels, by using a minimal semi-microscopic approach [20]. The emergence of regular spikes is caused by the interaction between the channel gates, ionic flows and the membrane potential, within a unified physical framework. The system is autonomous and it enters in the oscillatory regime without any kind of perturbation or energy supply. The only source of energy is the chemical energy of the ionic concentration differences between both sides of the membrane. This is assumed to be controlled by other cell mechanisms, such as molecular ionic pumps, not considered here. The dynamical patterns of the spike events are very similar to those observed in experiments, with a clear stand-by regimen of membrane depolarization and a very narrow pulse.
Given the simplicity of the approach it has been possible to establish the relevant steps and involved variables in the periodic firing. Special attention has been paid to the external Na and K concentrations. In particular the K concentration has shown to be responsible for the transition from an oscillatory regime, with a well defined period, to an excitable regime, with stochastic waiting times. The period is controlled by the Na leak, which could be changed to model different neurons by using an internal parameter such as . In our simulations we have obtained examples of spike intervals from ms to ms, but results are in principle not limited by these values.
The approach uses basic physical processes, described with a minimum of degrees of freedom, implemented by using standard formalisms of statistical physics. This allows for further possibilities of including other physical elements and mechanisms, which should permit to cover additional specific firing patterns. They could further be combined to deal with more complex neural activity.
Acknowledgments
This work was supported by the Ministerio de Economia y Competividad (Spain) and FEDER (European Union), under projects FIS2015-66503-C01-P2/P3 and by the Generalitat de Catalunya Projects 2009SGR14 and 2014SGR878.
Appendix: Model details
The total potential energy of the system is [20]
| (A-1) | |||
This potential has three different terms corresponding to the interactions between elements. The first one is the potential seen by the ions inside the channel
| (A-2) |
where is the potential difference between both sides of the membrane, and is the length of the channel. The gate variables evolve with the potential
| (A-3) | |||||
where the first part represents the bistable internal structure. With it is a simple potential with two well minima at the closed () and open () states. In the last term the parameter is the effective charge of the gate sensor and is the reference potential that determines the value at which both states are equally probable. The values for the different parameters (Table A2) are characteristic of each specific channel and are chosen to enter into the experimental scales.
| particle friction | s meV/nm2 |
|---|---|
| particle friction | s meV/nm2 |
| K | meV |
| channel length | nm |
| channel section | 4 nm2 |
| mM | |
| M | |
| effective capacity | charges/mV |
| a | b | |||||||
|---|---|---|---|---|---|---|---|---|
| kBT | kBT | e | mV | nm | ||||
| 1000 | 7 | 9 | +12 | -35 | 0.2 | 7 | 1.0 | |
| 4000 | 7 | 10 | -8 | -35 | 0.2 | 9 | 3.0 | |
| 4000 | 7 | 8 | +10 | -15 | 0.2 | 7 | 3.0 |
Finally, the effect of the collisions of ions with the gate is modeled by the potential energy
| (A-4) |
where is the position of the center of the gate inside the channel, and is its width. The height of the barrier is modulated by the function , depending on the state (open or close) of the gate, with a maximum value . For the envelope modulating function the expression is used which has the values for the close state, and for the open state. The parameters of the model are indicated in Tables A1-A2.
References
- [1] B. Hille, Ion Channels of Excitable Membranes. Sinauer, 3rd ed., 2001.
- [2] C. Hammond, Cellular and Molecular Neurophysiology. Academic Press, 4th ed., 2015.
- [3] J. A. Fraser and C. L.-H. Huang, “Quantitative techniques for steady-state calculation and dynamic integrated modelling of membrane potential and intracellular ion concentrations,” Progress in biophysics and molecular biology, vol. 94, no. 3, pp. 336–372, 2007.
- [4] A. L. Hodgkin and A. F. Huxley, “A quantitative description of membrane current and its application to conduction and excitation in nerve,” The Journal of Physiology, vol. 117, no. 4, pp. 500–544, 1952.
- [5] E. M. Izhikevich., Dynamical Systems in Neuroscience. Cambridge: The MIT press, 2010.
- [6] S. Furini and C. Domene, “K+ and Na+ conduction in selective and nonselective ion channels via molecular dynamics simulations,” Biophysical journal, vol. 105, no. 8, pp. 1737–1745, 2013.
- [7] A. Wawrzkiewicz-Jałowiecka, P. Borys, and Z. J. Grzywna, “Impact of geometry changes in the channel pore by the gating movements on the channels conductance,” Biochimica et Biophysica Acta (BBA)-Biomembranes, vol. 1859, no. 3, pp. 446–458, 2017.
- [8] H. C. Tuckwell and F. Y. Wan, “Time to first spike in stochastic Hodgkin–Huxley systems,” Physica A: Statistical Mechanics and its Applications, vol. 351, no. 2, pp. 427–438, 2005.
- [9] M. Ozer, M. Perc, and M. Uzuntarla, “Controlling the spontaneous spiking regularity via channel blocking on newman-watts networks of hodgkin-huxley neurons,” EPL (Europhysics Letters), vol. 86, no. 4, p. 40008, 2009.
- [10] M. Ozer, M. Uzuntarla, M. Perc, and L. J. Graham, “Spike latency and jitter of neuronal membrane patches with stochastic Hodgkin–Huxley channels,” Journal of Theoretical Biology, vol. 261, no. 1, pp. 83–92, 2009.
- [11] X. Sun, J. Lei, M. Perc, Q. Lu, and S. Lv, “Effects of channel noise on firing coherence of small-world Hodgkin–Huxley neuronal networks,” The European Physical Journal B-Condensed Matter and Complex Systems, vol. 79, no. 1, pp. 61–66, 2011.
- [12] D. Guo, S. Wu, M. Chen, M. Perc, Y. Zhang, J. Ma, Y. Cui, P. Xu, Y. Xia, and D. Yao, “Regulation of irregular neuronal firing by autaptic transmission,” Scientific Reports, vol. 6, p. 26096, 2016.
- [13] H. Yu, R. F. Galán, J. Wang, Y. Cao, and J. Liu, “Stochastic resonance, coherence resonance, and spike timing reliability of Hodgkin–Huxley neurons with ion-channel noise,” Physica A: Statistical Mechanics and its Applications, vol. 471, pp. 263–275, 2017.
- [14] B. Maisel and K. Lindenberg, “Channel noise effects on first spike latency of a stochastic hodgkin-huxley neuron,” Physical Review E, vol. 95, no. 2, p. 022414, 2017.
- [15] I. Goychuk and P. Hänggi, “The role of conformational diffusion in ion channel gating,” Physica A: Statistical Mechanics and its Applications, vol. 325, no. 1, pp. 9–18, 2003.
- [16] J. R. Groff, H. DeRemigio, and G. D. Smith, “Markov chain models of ion channels and calcium release sites,” in Stochastic methods in neuroscience (C. Laing and G. J. Lord, eds.), pp. 29–64, Oxford University Press, 2009.
- [17] J. H. Goldwyn and E. Shea-Brown, “The what and where of adding channel noise to the Hodgkin-Huxley equations,” PLoS Comput. Biol, vol. 7, no. 11, p. e1002247, 2011.
- [18] K. Lee and W. Sung, “Ion transport and channel transition in biomembranes,” Physica A: Statistical Mechanics and its Applications, vol. 315, no. 1, pp. 79–97, 2002.
- [19] K. Pawełek, J. J. Kozak, and Z. Grzywna, “Asynchronous motion and transport of in the KcsA selectivity filter,” Physica A: Statistical Mechanics and its Applications, vol. 389, no. 16, pp. 3013–3022, 2010.
- [20] L. Ramírez-Piscina and J. M. Sancho, “Molecular Na-channel excitability from statistical physics,” EPL (Europhysics Letters), vol. 108, no. 5, p. 50008, 2014.
- [21] L. Ramírez-Piscina and J. M. Sancho, “Physical properties of voltage gated pores,” The European Physical Journal B, vol. 91, p. 10, Jan 2018.
- [22] W. A. Catterall, “Voltage-gated sodium channels at 60: structure, function and pathophysiology,” The Journal of physiology, vol. 590, no. 11, pp. 2577–2589, 2012.
- [23] L. Ramírez-Piscina, “Fixed-density boundary conditions in overdamped langevin simulations of diffusion in channels,” In preparation.