An Integrated Framework for Competitive Multi-channel Marketing of Multi-featured Products
Abstract
For any company, multiple channels are available for reaching a population in order to market its products. Some of the most well-known channels are (a) mass media advertisement, (b) recommendations using social advertisement, and (c) viral marketing using social networks. The company would want to maximize its reach while also accounting for simultaneous marketing of competing products, where the product marketings may not be independent. In this direction, we propose and analyze a multi-featured generalization of the classical linear threshold model. We hence develop a framework for integrating the considered marketing channels into the social network, and an approach for allocating budget among these channels.
Index Terms:
Social networks, viral marketing, product features, mass media, social advertisement, budget allocationI Introduction
Companies can market their respective products through several possible channels, the most prominent being mass media advertising (television, radio, newspapers, etc.), fixed Internet banner ads, banner ads based on browsing history, recommendations based on attributes (location, age group, field of work, etc.), recommendations based on friends’ purchases, sponsored search ads, social media, sponsored Internet reviews, and so on. Potential customers or nodes also get indirectly influenced through their friends owing to word-of-mouth marketing. In order to make optimal use of these channels, a company would want to make the decision of how to invest in each channel, based on the investment strategy of competitors who also market their products simultaneously.
This paper aims to present a framework for competitive influence maximization in the presence of several marketing channels. We focus on modeling three channels, namely, viral marketing, mass media advertisement, and recommendations based on friends’ purchases using social advertisement.
I-1 Viral Marketing
In our context, a social network can be represented as a weighted, directed graph, consisting of nodes which are potential customers. The model we propose for influence diffusion in social network is a generalization of the well-studied linear threshold (LT) model [1]. Given such a model, a company would want to select a certain number of seed nodes to trigger viral marketing so that maximum number of nodes get influenced (buy the product) [2].
I-2 Mass media advertisement
This is one of the most traditional way of marketing where a company advertises its product to the masses using well-accessible media such as television, radio, and newspaper. The timing of when to show the ads is critical to ensure optimal visibility and throughput.
I-3 Social advertisement based on friends’ purchases
While making purchasing decisions, nodes rely not only on their own preferences but also on their friends’, owing to social correlation due to homophily (bias in friendships towards similar individuals) [3]. This, in effect, can be harnessed to suggest products to a node based on its friends’ purchasing behaviors. If a node has high influence on its friend (which is accounted for in diffusion models like LT), it is likely that the two nodes are similar. However, if the influence is low, it is not conclusive whether the nodes are dissimilar. So in addition to the influence parameter considered in LT-like models, marketing in practice requires another parameter that quantifies similarity between nodes. Note that since diffusion models do not consider this similarity, they alone cannot justify why two nodes having negligible influence on each other, display similar behaviors. It has also been observed in Twitter that almost 30% of information is attributed to factors other than network diffusion [4]. The effect of such factors could hence be captured using the similarity parameter.
I-A Related Work
The problem of influence maximization is well-studied in literature on social network analysis. It is known that computing the exact value of the objective function for a given seed set (the expected number of influenced nodes at the end of diffusion that was triggered at that set), is #P-hard under the LT model [5]. However, the value can be well approximated using sufficiently large number of Monte-Carlo simulations. Though the influence maximization problem under LT model is NP-hard, the objective function is non-negative, monotone, and submodular; so greedy hill-climbing algorithm provides an approximation guarantee for its maximization [2]. There exist generalizations of LT model, e.g., general threshold model [2], extensions to account for time [6], and extensions to account for competition [7, 8]. State-of-the-art heuristics such as LDAG [5] and Simpath [9] perform close to greedy algorithm while running several orders of magnitude faster. There also exist algorithms that provide good performance irrespective of the objective function being submodular [10].
The problem of competitive influence maximization wherein multiple companies market competing products using viral marketing has also been studied [11, 12]. Also, more realistic models have been developed, where influences not only diffuse simultaneously but also interact with each other [13, 14].
The impact of recommendations and word-of-mouth marketing on product sales revenue is well studied in marketing literature [15, 16, 17]. Biases in product valuation and usage decisions when agents consider a product that offers new features of uncertain value, have been investigated [18]. It has also been discussed how marketers can apply latent similarities of customers for segmentation and targeting [19].
II The Proposed Framework
We propose a framework to facilitate study of different marketing aspects using a single model, capturing several factors:
-
1.
Companies market their products using multiple channels;
-
2.
Diffusions of different products are mutually dependent;
-
3.
Each node aggregates the mass media advertisements, recommendations, and neighbors’ purchasing decisions.
We first describe LT model, followed by our competitive multi-feature generalization, and then integration of other channels into this generalized model. Table I presents notation.
In LT model, every directed edge has weight , which is the degree of influence that node has on node , and every node has an influence threshold . The weights are such that . Owing to thresholds being private information to nodes, they are assumed to be chosen uniformly at random from . The diffusion process starts at time step 0 with the initially activated set of seed nodes, and proceeds in discrete time steps. In each time step, a node gets influenced if and only if the sum of influence degrees of the edges incoming from its already influenced neighbors crosses its influence threshold, that is, . The process stops when no further nodes can be influenced. Formally, let if and only if . Let be the set of nodes influenced by time . Then
| influence weight of node on node | |
|---|---|
| set of influencing neighbors of | |
| similarity between nodes and | |
| threshold of node | |
| total budget for the marketing of product | |
| budget for seed nodes for viral marketing of product | |
| mass media advertising weight of product in time step | |
| social advertising weight of product | |
| final aggregate preference of node | |
| product bought by node | |
| set of nodes influenced by time |
| (1) |
II-A Competitive Multi-feature Generalization of LT Model
Products these days, be they toothpastes or mobile phones, come with several features with different emphases on different features. Let such an emphasis be quantified by a real number between 0 and 1. That is, a product can be represented by a vector of mutually independent features , where . Let the features of each product be suitably scaled such that . Note that such scaling may not be feasible when there is a product which offers strictly better features than product (); so let the products be such that one of the features corresponds to ‘null’. So would have a lower null component as compared to , thus making the scaling feasible (a higher null component would imply that the product has a poorer feature set).
Our model for a node getting influenced is analogous to that used in classical mechanics to study the initial motion of a body placed on a rough horizontal surface, as a result of several forces acting on it. In our context, a node is analogous to the body, and its threshold is analogous to static frictional force stopping it from moving. Such a force is equal to , where is mass of the body, is acceleration due to gravity, and is the coefficient of static friction between the body and surface. For unit for all nodes, the frictional force and analogously, the threshold equals mass, which is chosen uniformly at random from (as assumed in the LT model).
A node gets influenced in time step when the net force on it crosses its threshold value ; let the net force correspond to aggregate vector (say ). Let be the angular distance between and the product vector . Since ,
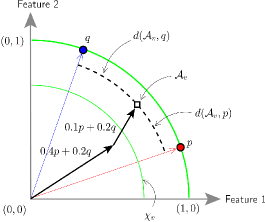
A node buys a product whose angular distance from its aggregate vector is the least (it can be easily shown that such a product would have the least Euclidean distance as well). If there exist multiple such products, one of them is chosen uniformly at random.
Hence the competitive multi-feature version of (1) is
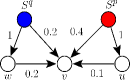
A geometric interpretation of the proposed model is presented in Figure 1. Consider 2 competing products having 2 features, say . In time step 0, and are selected for seeding by products and , respectively. In time step 1, node aggregates the purchasing decisions of its neighbors and , hence obtaining the aggregate vector . Say , so is not influenced yet. However, and purchase products and respectively (since the influence weights from to and to are 1). Hence in time step 2, node aggregates the purchasing decisions of and , hence obtaining the aggregate vector . Say , so is now influenced and it purchases product if , if , else it chooses randomly.
II-B Properties of the Generalized LT Model
The standard LT model is a special case of the proposed model, where there is a single product with one feature, i.e., . As the problem of influence maximization in the standard LT model is NP-hard, we have that the problem of influence maximization in the proposed model is also NP-hard.
We now explain the multi-feature (vector-based) model with an illustrative example, which will also throw light on the properties of the objective function under the proposed model. Recollect that the threshold for any node is chosen uniformly at random from . Let be the probability that node gets influenced by product when and are selected for seeding by and respectively. In Figure 2, let the two products be and .
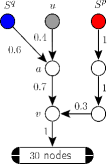
Let be the expected number of nodes influenced by when and are selected for seeding by and respectively. That is, . With diffusion starting from and simultaneously, we have and . Note that if is influenced by , then it influences with probability 0.70 even before the influence of reaches it, starting from ; now even if influence of reaches it, it is impossible for its aggregate preference to be closer to than to . So node can get influenced by only if is not influenced by . So . So all 30 nodes which have as sure influencer get influenced by with probability 0.12. Hence .
Now if the seed set for is , due to an incoming edge of 0.6 from (it is impossible for the aggregate preference of node to be closer to than to ). However, . From the argument similar as above, . So the 30 nodes get influenced by with probability less than 0.084. Hence . That is, .
Thus while the objective function in the standard LT model follows monotone increasing property, adding a node to a set in the generalized model could decrease its value; this proves non-monotonicity. It can also be shown using counterexamples that is neither submodular nor supermodular.
II-C Integrating Mass Media & Social Advertising into Network
Let be the investment for mass media advertising of product in time step and be the total investment over time , that is, . For social advertising, we consider that a company would recommend or advertise product to a node when any of its friends has bought the product. Let be the effort invested in social advertising. Let (or ) be the parameter that quantifies the similarity between nodes and . So could be viewed as the influence of such a recommendation on owing to the purchase of product by . Since the total influence weight allotted by node for viral marketing is , the total weight that it can allot for other channels is . Hence the weights allotted for other channels ( and ) would be scaled accordingly to obtain the values of and specific to node . A simple scaling rule is:
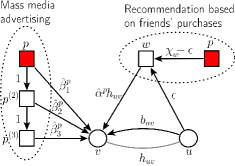
In order to integrate mass media and social advertisements into the network, we add pseudonodes and pseudoedges corresponding to them, as illustrated in Figure 3. Pseudonode corresponds to the product company itself (the figure shows two separate copies of pseudonode for the two channels for better visualization; they are the same pseudonode). Pseudonode and all seed nodes selected for viral marketing, are influenced in time step 0.
For integrating mass media advertisement, we create a set of pseudonodes (where corresponds to pseudonode ), and pseudoedges of weight 1. Hence gets influenced with probability 1 in time step (see Figure 3). We further create pseudoedges for node such that . Since gets influenced in time , node receives influence of from pseudonode in time step ; this is equivalent to mass media advertisement.
For integrating social advertisement, corresponding to edge , we create an intermediary pseudonode with a fixed threshold , and pseudoedges such that (see Figure 3). Now if the reference friend is influenced by some product , where the angle between products and be , the intermediary pseudonode gets influenced if and only if . Since , this is equivalent to
So gets influenced if and only if buys product , after which is recommended to buy with influence weight . Also note the time lapse of one step between the reference friend buying the product and the target node receiving the recommendation. Hence the latency in recommendation using social advertising is implicitly accounted for.
III The Underlying Problem
The fundamental problem here is to distribute the total available budget among the three marketing channels under study. Let be the number of free samples of product that the company would be willing to distribute. Let be the corresponding set of nodes in the social network to whom free samples would be provided (). Let be the cost function for allotting effort of activating set to trigger viral marketing, for social advertising, and corresponding to each step of mass media advertising. In general, would be a weighted sum of these parameters since the costs for adjusting parameters corresponding to different channels would be different. Let be the total budget for marketing of product . Let be the expected number of nodes (excluding pseudonodes) influenced by product , accounting for the marketing strategies of and its competitors. Hence the optimization problem for the marketing of product is
| (2) |
In the above optimization problem, we not only need to determine the optimal allocation among channels (), but the best nodes to trigger viral marketing such that , and the optimal allocation over time for mass media advertising such that . The problem hence demands a method for multi-parametric optimization.
Methods such as Fully Adaptive Cross Entropy (FACE) provide a simple, efficient, and general approach for simultaneous optimization over several parameters [20]. In our context, the FACE method involves an iterative procedure where each iteration consists of two steps, namely, (a) generating data samples according to a specified distribution and (b) updating the distribution based on the sampled data to produce better samples in the next iteration. Here, our sample is a vector consisting of whether a node should be included in , budget allotted for each time step of mass media advertising , and budget allotted for social advertising ; each data sample satisfies the cost constraint . Initially, the data samples could be generated based on a random distribution. The value of the objective function is computed for each data sample as per the proposed model using a sufficiently large number of Monte Carlo simulations. The distribution is then updated by considering data samples which provide value of the objective function better than a certain percentile. This iterative updating continues until convergence or for a fixed number of iterations. The obtained terminal data sample acts as the best response allocation strategy for product , in response to the strategies of competitors.
A Note for Practical Implementation
In order to implement the proposed framework in practice, a company would need to map its customers to the corresponding nodes in social network. To create such a mapping, it would be useful to get the online social networking identity (say Facebook ID) of a customer as soon as it buys the product. This can be done using a product registration website (say for activating warranty) where a customer, when it buys the product, needs to login using a popular social networking website (such as Facebook), or needs to provide its email address which could be used to discover its online social networking identity. Thus the time step when the node has bought the product, can also be obtained.
References
References
- [1] D. Easley and J. Kleinberg, Networks, Crowds, and Markets: Reasoning About a Highly Connected World. Cambridge University Press, 2010.
- [2] D. Kempe, J. Kleinberg, and É. Tardos, “Maximizing spread of influence through a social network,” in SIGKDD. ACM, 2003, pp. 137–146.
- [3] F. Chua, H. Lauw, and E.-P. Lim, “Generative models for item adoptions using social correlation,” IEEE Transactions on Knowledge and Data Engineering, vol. 25, no. 9, pp. 2036–2048, 2013.
- [4] S. Myers, C. Zhu, and J. Leskovec, “Information diffusion and external influence in networks,” in SIGKDD. ACM, 2012, pp. 33–41.
- [5] W. Chen, Y. Yuan, and L. Zhang, “Scalable influence maximization in social networks under the linear threshold model,” in ICDM. IEEE, 2010, pp. 88–97.
- [6] W. Chen, W. Lu, and N. Zhang, “Time-critical influence maximization in social networks with time-delayed diffusion process.” in AAAI. AAAI, 2012, pp. 592–598.
- [7] A. Borodin, Y. Filmus, and J. Oren, “Threshold models for competitive influence in social networks,” in WINE. Springer, 2010, pp. 539–550.
- [8] N. Pathak, A. Banerjee, and J. Srivastava, “A generalized linear threshold model for multiple cascades,” in ICDM. IEEE, 2010, pp. 965–970.
- [9] A. Goyal, W. Lu, and L. V. S. Lakshmanan, “SIMPATH: An efficient algorithm for influence maximization under the linear threshold model,” in ICDM. IEEE, 2011, pp. 211–220.
- [10] R. Narayanam and Y. Narahari, “A Shapley value-based approach to discover influential nodes in social networks,” IEEE Transactions on Automation Science and Engineering, vol. 8, no. 1, pp. 130–147, 2011.
- [11] S. Bharathi, D. Kempe, and M. Salek, “Competitive influence maximization in social networks,” in WINE. Springer, 2007, pp. 306–311.
- [12] S. Goyal and M. Kearns, “Competitive contagion in networks,” in STOC. ACM, 2012, pp. 759–774.
- [13] S. Myers and J. Leskovec, “Clash of contagions: Cooperation & competition in information diffusion,” in ICDM. IEEE, 2012, pp. 539–548.
- [14] A. Zarezade, A. Khodadadi, M. Farajtabar, H. Rabiee, and H. Zha, “Correlated cascades: Compete or cooperate.” in AAAI, 2017, pp. 238–244.
- [15] D. Godes, “The strategic impact of references in business markets,” Marketing Science, vol. 31, no. 2, pp. 257–276, 2012.
- [16] R. Van der Lans, G. Van Bruggen, J. Eliashberg, and B. Wierenga, “A viral branching model for predicting the spread of electronic word of mouth,” Marketing Science, vol. 29, no. 2, pp. 348–365, 2010.
- [17] S. Aral and D. Walker, “Creating social contagion through viral product design: A randomized trial of peer influence in networks,” Management Science, vol. 57, no. 9, pp. 1623–1639, 2011.
- [18] R. Meyer, S. Zhao, and J. Han, “Biases in valuation vs. usage of innovative product features,” Marketing Science, vol. 27, no. 6, pp. 1083–1096, 2008.
- [19] M. Braun and A. Bonfrer, “Scalable inference of customer similarities from interactions data using dirichlet processes,” Marketing Science, vol. 30, no. 3, pp. 513–531, 2011.
- [20] P.-T. De Boer, D. P. Kroese, S. Mannor, and R. Y. Rubinstein, “A tutorial on the cross-entropy method,” Annals of operations research, vol. 134, no. 1, pp. 19–67, 2005.