∎
corrauthorCorresponding author: ejjeon@ibs.re.kr
Background model for the NaI(Tl) crystals in COSINE-100
Abstract
The COSINE-100 dark matter search experiment is an array of NaI(Tl) crystal detectors located in the Yangyang Underground Laboratory (Y2L). To understand measured backgrounds in the NaI(Tl) crystals we have performed Monte Carlo simulations using the Geant4 toolkit and developed background models for each crystal that consider contributions from both internal and external sources, including cosmogenic nuclides. The background models are based on comparisons of measurement data with Monte Carlo simulations that are guided by a campaign of material assays and are used to evaluate backgrounds and identify their sources. The average background level for the six crystals (70 kg total mass) that are studied is 3.5 counts/day/keV/kg in the (2–6) keV energy interval. The dominant contributors in this energy region are found to be 210Pb and 3H.
1 Introduction
COSINE-100 is a dark matter search experiment consisting of a 106 kg array of eight ultra-pure NaI(Tl) crystals kims-nai2014 ; kims-nai2015 . Its primary goal is to test DAMA/LIBRA’s assertion of an observation of annual modulation signal bernabei08 ; bernabei10 ; bernabei13 ; bernabei18 . The experiment has been operating at the Yangyang Underground Laboratory (Y2L) since September 2016 cosinedet17 . COSINE-100 is one of several NaI(Tl)-based dark matter searches in operation (DM-Ice17 dmice17 , ANAIS amare14 ; amare16 ) or under development (DM-Ice dmice14 , Kam-LAND-PICO kamland-pico , SABRE sabre17 , COSINUS cosinus ). Previously, the KIMS-CsI experiment put a limit on interaction rates in CsI crystals hslee07 ; sckim12 that precluded the interpretation of the DAMA modulation signal as being due to WIMPs scattering from I or Tl nuclei, considering the different quenching factors of iodine and thallium for NaI(Tl) and CsI(Tl).
The COSINE-100 crystal array is immersed in a tank of liquid scintillator (LS) that tags backgrounds that originate from outside the LS as well as decays of 40K nuclides inside the crystals. To determine the sources of the backgrounds, we have performed Monte Carlo simulations using the Geant4 toolkit (V.4.9.6.p02) geant4 and built a background model for the eight detectors by iteratively fitting their contributions to the measured energy spectra; two crystals are excluded in this paper due to their low light yields, which result in a background spectrum without characteristic peaks of isotopes by the worse energy resolution, and relatively higher background contamination in the low energy region.
The paper is structured as follows: the COSINE-100 experimental setup is described in Sect. 2. Section 3 describes the background modeling, with the simulation method described in Sect. 3.2, sources of the background internal and external to the crystal and of cosmogenic origin in Sects. 3.2 – 3.4. Section 4 describes the comparison and fit to the data, and Sect. 5 provides discussions of the background developed by the fits. Finally Sect. 6 provides conclusions.
2 COSINE-100 setup and simulation geometry
 |
 |
| (a) Front view | (b) Side view |
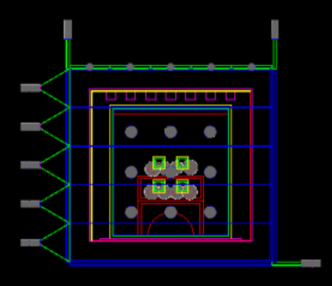
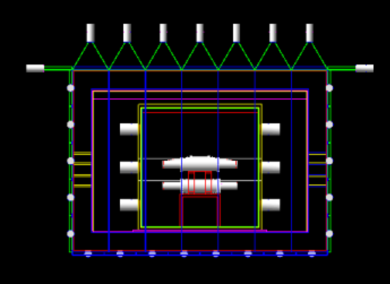
The experimental setup is described in detail in Ref. cosinedet17 . The simplified geometry used for the simulations is shown in Fig. 1. Eight NaI(Tl) crystals, arranged in two layers, are located in the middle of a four-layer shielding structure. From outside inward, the four shielding layers are plastic scintillator panels, a lead-brick castle, a copper box, and a scintillating liquid. The eight NaI(Tl) crystal assemblies and their support table are immersed in the scintillating liquid that serves both as an active veto and a passive shield.
The eight NaI(Tl) crystals were grown out of batches of powder provided by Alpha Spectra as-inc with successive improvements. The first attempts, which produced an order of magnitude reduction in 40K, were AS-B and AS-C. This was followed by WIMPScint-II (AS-WSII) which reduced the 210Pb contamination, and WIMPScint-III (AS-WSIII) which resulted in another factor of two reduction of 40K. The results are summarized in Table 1. The final crystals are cylindrically shaped and hermetically encased in OFE copper tubes with wall thickness of 1.5 mm and quartz windows (12.0 mm thick) at each end. Each crystal’s lateral surfaces were wrapped in roughly 10 layers of 250 m-thick PTFE reflective sheets. The quartz windows are optically coupled to each end of the crystal via 1.5 mm thick optical pads. These, in turn, are optically coupled to 3-inch Hamamatsu R12669SEL photomultiplier tubes (PMTs) with a thin layer of high viscosity optical gel. The PMTs are protected from the liquid scintillator by a housing made of copper and PTFE.
The following components of the detector have been included in the simulation: PTFE reflective sheets, copper tubes, quartz windows, optical gel, PMT housing, and PMTs.
3 Background modeling
3.1 Simulation method
The Physics list classes of G4EmLivermorePhysics for low energy electromagnetic process and G4Radioactive-Decay for radioactive decay process were used geant4:lowEM ; geant4:lowEMpackage ; geant4:2016 . The 238U and 232Th decay chains were treated as broken at the long-lived parts of the chain. The 238U chain was broken into five distinct groups and the 232Th chain was broken into three groups. The details are reported in Ref. kims-nai-bkg17 .
Each simulated event record includes all energy deposited in the crystals within an event window of 10 s from the time a decay is generated, to account for the conditions in the data acquisition system (DAQ) of the experimental setup cosinedet17 . Sometimes decays with relatively short half-lives, such as 212Po decay (with a half-life of 300 ns) and the subsequent daughter decays will appear in the 10 s time window, resulting in pileup events. They are treated as a single event in the simulation.
The simulated spectrum was convolved with an energy dependent energy resolution function developed during a calibration run. Calibration points were measured using –ray sources: 59.5 keV(241Am), 1173.2 keV and 1332.5 keV (60Co). Internal background peaks at 3.2 and 1460.8 keV from 40K, 67.3 keV from 125I, and 609.3 keV from 214Bi were used to calibrate the measured spectra; peaks at 3.2 keV, 59.5 keV, and 67.3 keV were used for the low energy calibration below 70 keV.
3.2 Internal backgrounds in the NaI(Tl) crystals
| Crystal | Mass | Size (inches) | Powder | Rate | 40K | 238U | 228Th |
|---|---|---|---|---|---|---|---|
| (kg) | (diameterlength) | (mBq/kg) | (ppb) | (ppt) | (ppt) | ||
| Crystal-1 | 8.3 | AS-B | <0.02 | ||||
| Crystal-2 | 9.2 | AS-C | <0.12 | <0.6 | |||
| Crystal-3 | 9.2 | AS-WSII | <0.04 | ||||
| Crystal-4 | 18.0 | AS-WSII | <0.3 | ||||
| Crystal-5 | 18.3 | AS-C | |||||
| Crystal-6 | 12.5 | AS-WSIII | <0.02 | ||||
| Crystal-7 | 12.5 | AS-WSIII | <0.6 | ||||
| Crystal-8 | 18.3 | AS-C | <1.4 |
After the insertion of the crystals into the shield and prior to filling the liquid scintillator container, their background levels were measured to verify that they were free of any additional contamination. Overall, the eight crystals have acceptable 238U and 232Th contaminations as shown in Table 1 cosinedet17 . Secular equilibrium in the chains is assumed for the interpretation of 238U and 232Th related radioactivity measurements, with the exception of 210Pb.
In order to estimate the background contributions from 238U, 232Th, 40K, and 210Pb, we simulated background spectra from the internal radioactive contaminants and normalized them by their measured activities in Table 1. In the normalization we assumed a chain equilibrium and, thus, all related activities within the chains are equal to the 238U, 232Th, and 40K activities multiplied by the branching ratios for decay of the daughter isotopes. We also added the background simulation of internal 210Pb by considering the measured rate. The resultant background contributions, except for those from 40K and 210Pb, were negligible in all eight crystals.
The 40K contribution is reduced by the LS veto detector. To measure the reduction efficiency of the 40K generated 3.2 keV emission background provided by tagging the accompanying 1460.8 keV -ray in one of the other NaI(Tl) crystals or the LS, and to compare this to the efficiency provided by the other crystals alone, we generated 40K decays at random locations inside a NaI(Tl) crystal for the cases with and without the LS veto. From these simulations, we determined that the Crystal-6 tagging efficiency by other crystals without LS is 31.70.1 and by the LS only is 64.90.2. The total combined efficiency is 81.70.3 . The efficiency is measured in the crystal energy range between 2 and 6 keV by requiring the LS energy deposit be larger than 20 keV. Efficiencies vary depending on the crystal location in the detector. For example, Crystal-1 (at the corner of the 42 array) shows higher coverage by the LS (75 %) than neighboring crystals (17 %), but the combined efficiency is similar to that of Crystal-6 (82 %). The tagging efficiency of the 1460.8 keV -ray in the LS-only case is lower because the range of the -ray in the NaI(Tl) crystal is shorter than in the LS. Therefore, more -rays are stopped in the other crystals than in the LS. These estimated efficiencies are in agreement with measurements cosinedet17 . Accordingly, the 40K background level is reduced by as much as 80 % by requiring single-hit crystal events with no signal in the LS.
The 210Pb contribution is estimated by modeling the background from bulk 210Pb and surface 210Pb as discussed in Sect. 4.
3.3 External background sources
| Radioactivitya | |||
|---|---|---|---|
| External source | U(214Bi) | Th(228Ac) | (40K) |
| PMT kims-nai2014 | 25 5 | 12 5 | 58 5 |
| (R12669SELb) | |||
| Quartz window | 1.8 | 7.5 | 20 |
| PTFE reflector | 0.5 | 1.0 | 6.4 |
| Cable ties | 4.2 | 3.5 | 149 32 |
| LS | 2.7 | 3.3 | 7 4 |
The external background from the radioactive isotopes in the surrounding rocks is shielded by the 20 cm-thick lead castle and the 3 cm-thick copper box. By using the full shielding structure with gas flowing into the inside of the copper shield to avoid backgrounds from 222Rn in the air at Y2L (measured to be pCi/L kims-radon2011 ), we reduced the environmental background by a factor of 10,000 based on the measurements of a high-purity Ge (HPGe) detector, thus ensuring that those contributions are negligibly small.
Despite all the efforts to block backgrounds due to external sources, some backgrounds from radioactive contaminations in detector components inside the shielding are still expected, including from the PMTs, grease, copper case, bolts, cables, acrylic supports, liquid scintillator, copper box, and steel that supports the lead block housing. We simulated background spectra from those external sources to test their effects and compared the shapes of contributions to the crystals’ energy spectra. We found that all the spectra from these external sources are similar in shape and, thus, could be represented by a spectrum that is obtained by simulating 238U, 232Th, and 40K, distributed randomly in the volume outside the eight crystals. Because the PMTs are the main contributer to the external background we used two kinds of spectra for the external background modeling; one is the spectrum from the PMTs and another is the spectrum from the other external sources that is treated as a parameter floating in the fit. The radioactivity levels of the PMTs and PMT surrounding parts were measured underground with a HPGe detector and the results are listed in Table 2. We used the measured activities from the PMTs to constrain the data fitting and treated background contributions from the PMTs in nine groups as broken at the long-lived parts of the chain.
3.4 Treatment of cosmogenic radionuclides
| (a) | ||
| Cosmogenic | Half-life | Production rate |
| isotopes | (days) | at sea level walter-thesis |
| (counts/kg/day) | ||
| 125I | 59.4 | 221 |
| 121Te | 19.17 | 93 |
| 121mTe | 164.2 | 93 |
| 123mTe | 119.2 | 52 |
| 125mTe | 57.4 | 74 |
| 127mTe | 106.1 | 93 |
| 113Sn | 115.1 | 9.0 |
| 109Cd | 461.4 | 4.8 |
| 3H | 4500 | 26 |
| 22Na | 951 | 66 |
| (b) | ||
|---|---|---|
| Crystal | Exposure | Radioactivity |
| time (see text) | cooling time at Y2L | |
| (years) | (years) | |
| Crystal-1 | 2 | 3 |
| Crystal-2 | 0.75 | 2.75 |
| Crystal-3 | 1.2 | |
| Crystal-4 | 1.7 | 0.5 |
| Crystal-6 | 0.3 | 0.6 |
| Crystal-7 | 0.3 | 0.6 |
Although the eight NaI(Tl) crystals had underground radioactivity cooling times that ranged from several months to three years, there are still background contributions due to the long-lived cosmogenic isotopes that were activated by cosmic rays while they were on the surface.
To consider these backgrounds, we first checked the list of cosmogenic radioactive isotopes that are produced in NaI(Tl), as reported in Ref. walter-thesis ; cosmogenic-amre15 ; cosmogenic-villar18 ; cosmogenic-amre18 . In Table 3 (a), we list the contributing cosmogenic isotopes with their half lives; short-lived isotopes, for which half lives are less than a year, are 125I, 121Te, 121mTe, 123mTe, 125mTe, 127mTe, and 113Sn and long-lived isotopes are 109Cd, 3H, and 22Na. The radioactivity cooling time at Y2L for each crystal at the time data-taking for COSINE-100 started, is listed in Table 3 (b). The short-lived isotopes are not expected to contribute to either Crystal-1 or Crystal-2 because their cooling times are long enough to reduce these activities to a negligible level.
However, we expect some backgrounds from the sho-rt-lived isotopes in other crystals because their production rates at sea level, as listed in Table 3 (a), are high and their cooling times are less than or equal to a year. In addition, there are long-lived 109Cd, 3H, and 22Na nuclides that are potentially hazardous background sources; , the beta-decay spectrum of tritium has an endpoint energy of 18 keV. We thus need to understand their background contributions in the low energy region, especially in the (2–6) keV WIMP signal region of interest (ROI). Because it is impossible to compute the initial activities of those isotopes from the production rates in each crystal at Y2L without knowing the cosmic ray exposure conditions: time, location, altitude, etc. walter-thesis , we investigated the correlation of characteristic peaks produced by /X-rays from the decay of cosmogenic isotopes.
-
109Cd decays by electron capture to the isomeric state of 109Ag depositing in the crystal the binding energy of the Ag K-shell electrons (25.5 keV), that will be accompanied by the 88 keV ray from the isomer transition of 109Ag having a mean time of 57.4 seconds. By using the timing information of two adjacent events that have each 25.5 keV and 88 keV, we measured the background contribution of 109Cd in Crystal-4 and found it to be 0.100.01 mBq/kg.
-
22Na decays via positron emission (90%) and electron capture (10%), followed by 1274.6 keV -ray emission with a mean lifetime of 3.8 yr. The electron capture decay produces 0.9 keV emissions. Therefore, 10% of the 22Na decay will produce 0.9 keV X-rays and 1274.6 keV rays simultaneously. Meanwhile, the positron will be converted to two 511 keV annihilation rays.
However, it is generally difficult to measure long-lived cosmogenics’ activities, such as those for 3H, directly from the data due to their long half-lives. Therefore, we simulated background spectra from cosmogenic isotopes listed in Table 3 (a) and used their shapes in the data fitting, while floating their unknown fractions. The details of their treatment in the background model for each NaI(Tl) crystal are discussed in section 4.
4 Comparison with measured data
To model the COSINE-100 detector backgrounds, we used data collected between Oct 21 and Dec 19 2016. We applied low energy noise cuts as described in Ref. cosinedet17 . The LS veto threshold was set at 20 keV for both single crystal and multiple crystal events. Events in coincidence with an LS signal (20 keV in LS) and/or more than 4 photo electrons in other crystals are defined as multiple events.
Crystals 1 and 2 have no short-lived cosmogenic contaminants and were used for comparisons. Since Crystal-3 and Crystal-4 have different production times and delivery times at the Y2L, their expected short-lived cosmogenic activities are quite different. But they are made of the same NaI powder and expected to have similar internal activities. Crystal-6 and Crystal-7 are twin crystals made up of the same NaI powder and at the same time. They are installed between Crystal-5 and 8 and expected to have similar external background. Both crystals are expected to have the same amount of internal, external and cosmogenic activities. We compare the activities of these crystal subdivisions.
We use a log likelihood method to fit the data. The fitting range is 6 keV–2MeV and we perform four simultaneous fits: single-hit low-energy, single-hit high-energy, multiple-hit low-energy and multiple-hit high-energy. Because different FADC systems are used for low- and high-energy data the resolutions are different. Low-energy means below 70 keV and high-energy means above 70 keV. The internal 238U, 232Th, and 40K levels are constrained to be within 20% of their measured values. We use a 10 m thickness to distinguish between surface and bulk components to study surface contamination in the crystals that is generated uniformly within the thickness; their levels are allowed to float. The 238U, 232Th, and 40K levels in the PMTs are constrained to be within 50% of their measurements, taking into account contributions from PMT surrounding parts. Cosmogenic and the external 238U, 232Th, 40K, and 60Co levels from other parts of the detector are free floated.
4.1 Background model for crystals 1 and 2
 |
 |
| (a) Single-hit events with low-energy data | (b) Single-hit events with high-energy data |
 |
 |
| (c) Multiple-hit events with low-energy data | (d) Multiple-hit events with high-energy data |
 |
 |
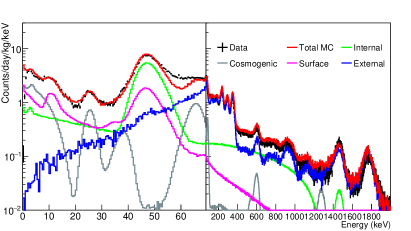
| (a) Crystal-1 | (b) Crystal-2 |
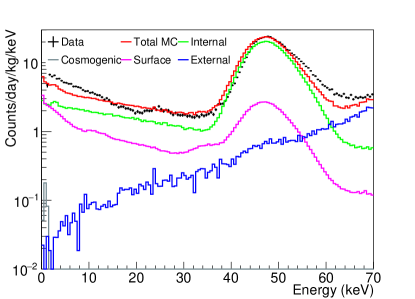
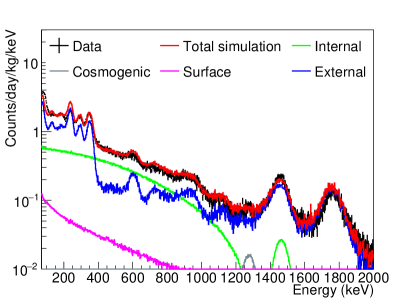
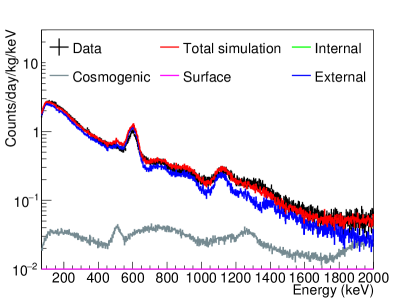
The surface exposure time of Crystal-1 is longer than Crystal-2 by more than a year and it is expected to have more long-lived cosmogenic isotopes such as 3H and . In addition, it was delivered by air while Crystal-2 was shipped by sea. At first we did not consider long-lived cosmogenic isotopes in the data fitting for Crystal-1 and the resulting four-channel fits are shown in Fig. 2. The overall energy spectrum is well matched to the data for both single-hit and multiple-hit events, except for the single-hit low-energy events. The agreement between the measured and fitted multiple-hit background spectra of Crystal-2, 3, 4, 6, and 7 is as good as shown for Crystal-1.
The peak around 46 keV is due to 210Pb in the crystals. However only a small part, 4.3%, is due to the 46.5 keV gamma-ray line; most of the events in the peak are from the conversion electrons, Auger electrons, and X-rays, followed by beta electrons from the decay to 210Bi. As a result, the peak is non-Gaussian. It is not well reproduced by the simulations using the Geant4 version 4.9.6.p02 and, thus, we will consider a higher version number for further modeling.
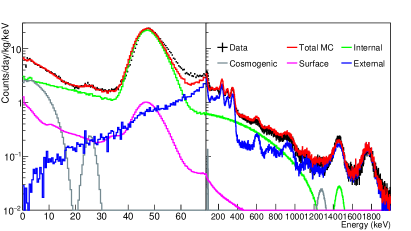
We found that it was not possible to model the Crystal-1 and 2 background spectra for energies below 30 keV with only bulk and surface 210Pb contaminations (see Fig. 2(a)). To get adequate fits to both crystals, we had to include significant contributions from 3H and 109Cd, as shown in Fig. 3(a) and 3(b). They are also included in the models for the other crystals.
Internal 210Pb contamination levels independently determined from the alpha activities in the crystals are listed in Table 1. To study surface contamination in the crystals both bulk and surface 210Pb components are free floated in the fit. The 40K contamination levels in the crystals are identified by coincident signals between a 3.2 keV emission in one NaI(Tl) detector and a 1460.8 keV gamma-ray in one of the other NaI(Tl) crystals or an energy deposition in the LS. Background from the readout PMTs and surrounding material is considered as external components.
4.2 Background model for crystals 3 and 4
 |
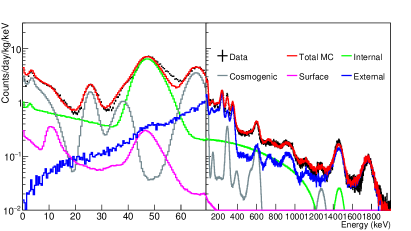 |
| (a) Crystal-3 | (b) Crystal-4 |
Although Crystal-3 and 4 were both grown with WIMP-Scint-II grade powder by Alpha Spectra in July 2014, they were delivered to the Y2L at different times. Cryst-al-3 has a complicated exposure history and was repaired once before arriving at Y2L in July 2015 and has remained underground ever since. On the other hand, Crystal-4 was delivered at the Y2L in March 2016 after being exposed to surface-level cosmic rays for about 2 years and was installed for COSINE-100 after just six months of cooling. As a result, Crystal-4 is expected to have short-lived cosmogenic isotopes as well as long-lived cosmogenic isotopes.
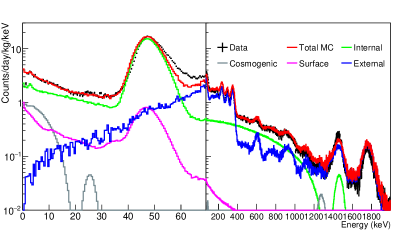
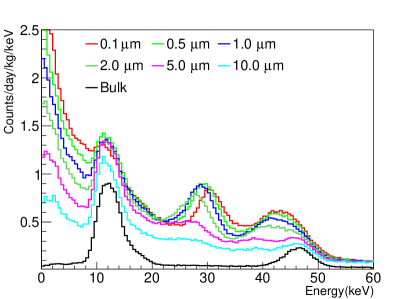
The background spectrum of Crystal-3, shown in Fig. 5a, has a peak around 10 keV that has not changed over time. To understand its origin, we studied the effect of surface 210Pb from PTFE reflective sheets that wrapped each crystal’s lateral surfaces in ten layers with 250 m total thickness. We simulated the background spectrum of 210Pb by generating it randomly within the layer of the PTFE sheets with various thicknesses: 0.1, 0.5, 1.0, 2.0, 3.0, 5.0 m, and also in the bulk. The simulated spectra are shown in Fig. 4, where each color represents the different surface depths and the bulk reflector (black solid line). The peaks at 12 keV and 46 keV, which are prominent for the bulk reflector, are due to the X-rays and 46.5 keV -ray from the decays of 210Pb, respectively. Conversion electrons contribute peaks around 30 keV and 43 keV and beta electrons contribute a continuum at peaks at low energy. Since the conversion electrons’ energy losses depend on the thickness of PTFE that they penetrate, these peaks move to lower energies as the depth increases. In the simulation we used the spectrum of 210Pb from the bulk reflector to model the 12 keV peak because the surfaces can be treated as a bulk with 10 layers of PTFE sheets.
The Crystal-4 spectrum, shown in Fig. 5b, has three correlated peaks from the decay of 109Cd: 3 keV and 25 keV binding energies from L-shell/K-shell electron captures and 88 keV gamma-ray line from the isomer transition of 109Ag. We also determined its half-life by measuring the change of 25 keV binding energies contribution over time with a result that is in a good agreement with the 462 day expectation. The activity from the fit to the data, found to be 0.090.06 mBq/kg, is consistent with the measurement.
4.3 Background model for crystals 6 and 7
 |
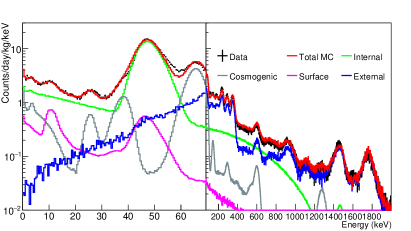 |
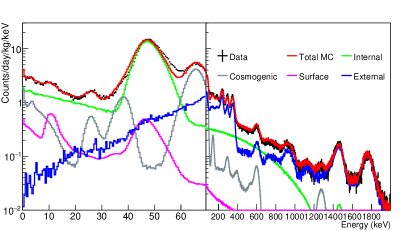
| (a) Crystal-6 | (b) Crystal-7 |
Crystal-6 and 7 are twin crystals made from WIMPSci-nt-III grade powder by Alpha Spectra at the same time. They were installed 7 months after their delivery to Y2L, similar to Crystal-4. However their surface exposure times were shorter than those of the other crystals. Figure 6 shows that the fitted simulation spectra accurately reproduce the measured data. As expected, they have similar contamination levels of short-lived cosmogenic isotopes.
5 Discussion of fitted background spectra
We have simulated background spectra from radioactive sources: full decay chains of 238U, 232Th, and 40K from the crystals, 16 PMTs, and the other external sources; bulk and surface 210Pb from the crystals; surface 210Pb from PTFE reflector; 125I, 121Te, 121mTe, 123mTe, 125mTe, 127mTe, 113Sn, 109Cd, 22Na, and 3H for cosmogenic isotopes, and have fitted them to the data to estimate their unknown contamination levels.
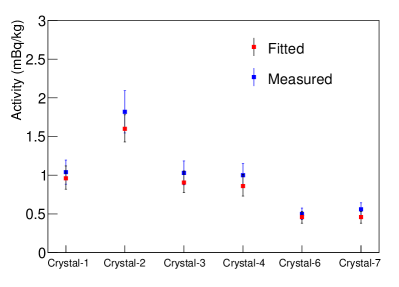
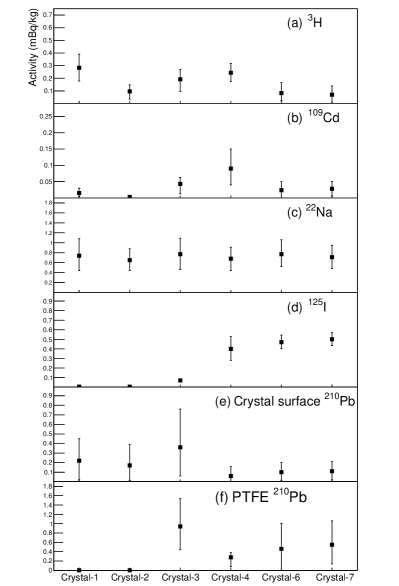
In Fig. 7 we compare the fitted activities of internal 40K and 210Pb to their measured levels for the six crystals, where there is agreement at the 20% level. The fitted activities of cosmogenic isotopes: 3H, 109Cd, 22Na, and 125I, surface 210Pb, and PTFE 210Pb for the six crystals are shown in Fig. 8. As explained in section 4, Crystal-1 and 4 have two-year-long exposure times and, thus, relatively high 3H levels (see Fig. 8(a)). The largest contribution of 109Cd is in Crystal-4 (Fig. 8(b)) and the fitted activity is in a good agreement with the measured value. The fitted activities of 125I in Crystal-4, 6, and 7 are similar to each other and higher than other crystals due to their relatively short cooling times underground, as shown in Fig. 8(c). There are more contributions from surface 210Pb in Crystal-1, 2, and 3, and small contributions from PTFE 210Pb in Crystal-1 and 2. Crystal-3 has large contributions from the surface 210Pb for both the crystal itself and the PTFE reflector, albeit with large errors.
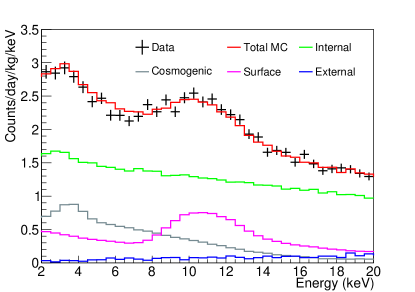
Based on the background model for the six NaI(Tl) detectors we determine the background levels in units of dru (counts/day/keV/kg) in the 2-6 keV energy interval and list them in Table 4. The dominant background contributions are from and ; representative background spectra of Crystal-7 in the 2-6 keV energy region are shown in Fig. 9. The overall simulated background spectra well describe the measured data for the six NaI(Tl) detectors.
 |
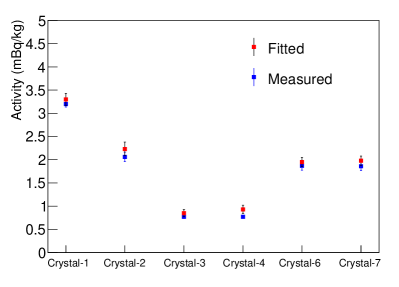 |
| (a) Internal 40K | (b) Bulk 210Pb |
| Crystal-1 | Crystal-2 | Crystal-3 | Crystal-4 | Crystal-6 | Crystal-7 | ||
|---|---|---|---|---|---|---|---|
| Internal | 0.10 0.02 | 0.20 0.02 | 0.10 0.01 | 0.10 0.01 | 0.05 0.01 | 0.05 0.01 | |
| 2.50 0.10 | 1.69 0.09 | 0.57 0.05 | 0.71 0.05 | 1.46 0.07 | 1.50 0.07 | ||
| Other () | 7.00.1 | 151 | 7.30.1 | 7.70.1 | 141 | 141 | |
| Cosmogenic | 2.35 0.90 | 0.81 0.40 | 1.54 0.77 | 1.97 0.66 | 0.69 0.67 | 0.58 0.54 | |
| 0.05 0.04 | 0.009 0.009 | 0.13 0.06 | 0.29 0.15 | 0.08 0.08 | 0.09 0.09 | ||
| Other | - | - | 0.02 0.01 | 0.09 0.04 | 0.06 0.03 | 0.05 0.03 | |
| Surface | 210Pb | 0.64 0.64 | 0.51 0.51 | 1.16 0.51 | 0.22 0.16 | 0.34 0.20 | 0.38 0.21 |
| External | 0.03 0.02 | 0.05 0.04 | 0.03 0.02 | 0.03 0.02 | 0.04 0.03 | 0.03 0.02 | |
| Total simulation | 5.68 1.04 | 3.28 0.67 | 3.57 0.76 | 3.41 0.75 | 2.74 0.61 | 2.70 0.51 | |
| Data | 5.64 0.10 | 3.27 0.07 | 3.35 0.07 | 3.19 0.05 | 2.62 0.05 | 2.64 0.05 |
6 Conclusion
We have studied, using the Geant4 toolkit, the background of the NaI(Tl) crystal detectors that are being used in the COSINE-100 dark matter search experiment. The crystals have different exposure histories and underground radioactivity cooling times.
In the background modeling the overall energy spectrum summed over all simulations is well matched to the data not only for single-hit events but also for multi-ple-hit events. Crystal-1 and Crystal-2 that had cooling times as long as three years at the Y2L are dominated by 210Pb and 3H for energies below 20 keV. The background contribution of 3H in Crystal-2 is smaller than that in Crystal-1 due to its shorter surface exposure time. Crystal-6 and 7 show clear contributions from 125I due to their short cooling times underground, as expected. Crystal-3 had an additional treatment for a repair that increased the background near 10 keV that is well modeled by surface 210Pb on the PTFE wrapping foil. Crystal-4 was exposed to surface cosmic rays for two years and only had a six month-long underground cooling time. As a result, this crystal has significant background contributions from both short-lived and long-lived cosmogenic isotopes.
Background contributions from external sources and internal 40K are reduced to the level of 0.03 dru and about 0.1 dru in the energy range of 2–6 keV, respectively, by the LS veto detector that surrounds the crystals.
The average background rate in the (2-6) keV energy range for the six crystals (with a total mass of 70 kg) studied here is 3.5 counts/day/keV/kg. The dominant contributions in this energy range are from 210Pb and 3H.
Acknowledgments
We thank the Korea Hydro and Nuclear Power (KHNP) Company for providing underground laboratory space at Yangyang. This work is supported by: the Institute for Basic Science (IBS) under project code IBS-R016-A1, Republic of Korea; UIUC campus research board, the Alfred P. Sloan Foundation Fellowship, NSF Grants no. PHY-1151795, PHY-1457995, DGE-1122492 and DGE-1256259, WIPAC, the Wisconsin Alumni Research Foundation, Yale University and DOE/NNSA Grant no. DE-FC52-08NA28752, United States; STFC Grant ST/N000277/1 and ST/K001337/1, United Kingdom; and CNPq and Grant no. 2017/02952-0 FAPESP, Brazil.
References
- (1) K. W. Kim et al. (KIMS Collaboration), Astropart. Phys. 62 (2015) 249.
- (2) P. Adhikari et al. (KIMS Collaboration), Eur. Phys. J. C 76 (2016) 185.
- (3) R. Bernabei et al., Eur. Phys. J. C 56 (2008) 333.
- (4) R. Bernabei et al., Eur. Phys. J. C 67 (2010) 39.
- (5) R. Bernabei et al., Eur. Phys. J. C 73 (2013) 2648.
- (6) R. Bernabei et al. (DAMA/LIBRA), arXiv:1805.10486.
- (7) G. Adhikari et al., Eur. Phys. J. C 78 (2018) 107.
- (8) E. Barbosa de Souza et al. (DM-Ice Collaboration), Phys. Rev. D 95 (2017) 032006.
- (9) J. Amare et al., Nucl. Instrum. Meth. Phys. Res., Sect. A 742 (2014) 187.
- (10) J. Amare et al., Eur. Phys. J. C 76 (2016) 429.
- (11) J. Cherwinka et al. (DM-Ice Collaboration), Phys. Rev. D 90 (2014) 092005.
- (12) K. Fushimi et al., Physics Procedia 61 (2015) 67.
- (13) C. Tomei et al. (SABRE Collaboration), Nucl. Instrum. Meth. A 845 (2017) 418.
- (14) G. Angloher et al., Eur. Phys. J. C 76 (2016) 441.
- (15) H. S. Lee et al. (KIMS Collaboration), Phys. Rev. Lett. 99 (2007) 091301.
- (16) S. C. Kim et al. (KIMS Collaboration), Phys. Rev. Lett. 108 (2012) 181301.
- (17) S. Agostinelli et al., Nucl. Instrum. Meth. Phys. Res., Sect. A 506 (2003) 250.
- (18) Alpha Spectra Inc., http://www.alphaspectra.com.
- (19) S. Chauvie et al., Conf. Rec. IEEE Nucl. Sci. Symp., pp. 1881-1885, 2004.
- (20) Tullio Basaglia et al., 2015 J. Phys.: Conf. Ser. 664 072037.
- (21) J. Allison et al., Nucl. Instrum. Meth. Phys. Res., Sect. A 835 (2016) 186.
- (22) G. Adhikari et al., Eur. Phys. J. C 77 (2017) 437.
- (23) Yeongduk Kim and Hong Joo Kim, Journal of the Korean Physical Society, Vol. 58, No. 4, April 2011, pp. 713-718
- (24) Walter C. Pettus, Ph.D. thesis, University of Wisconsin-Madison (2015)
- (25) J. Amare et al., JCAP 02 (2015) 046.
- (26) P. Villar et al., International Journal of Modern Physics A Vol. 33, No. 9 (2018) 1843006.
- (27) J. Amare at al., Astropart. Phys. 97 (2018) 96.