Sliding states of a soft-colloid cluster crystal: Cluster versus single-particle hopping
Abstract
We study a two-dimensional model for interacting colloidal particles which displays spontaneous clustering. Within this model we investigate the competition between the pinning to a periodic corrugation potential, and a sideways constant pulling force which would promote a sliding state. For a few sample particle densities and amplitudes of the periodic corrugation potential we investigate the depinning from the statically pinned to the dynamically sliding regime. This sliding state exhibits the competition between a dynamics where entire clusters are pulled from a minimum to the next and a dynamics where single colloids or smaller groups leave a cluster and move across the corrugation energy barrier to join the next cluster downstream in the force direction. Both kinds of sliding states can occur either coherently across the entire sample, or asynchronously: the two regimes result in different average mobilities. Finite temperature tends to destroy separate sliding regimes, generating a smoother dependence of the mobility on the driving force.
I Introduction
The standard atomistic approach to tribology, i.e. the study on friction dissipation and wear, usually focuses on indestructible “crushproof” particles, typically atoms or molecules Müser et al. (2003); Müser (2007); Vanossi et al. (2013a); Vigentini et al. (2014); Manini et al. (2015, 2016, 2017); Apostoli et al. (2017); Panizon et al. (2018). Recent works Bohlein et al. (2012); Hasnain et al. (2013, 2014); Brazda et al. (2017, 2018) have brought colloids into the realm of tribology, by letting repulsive hard-core particles interact with a periodic ”corrugation potential”, generated by means of optical forces, and driven by viscous drag. The conditions of that experiment match the single indestructible particle paradigm. Colloids and, more generally, soft matter systems would however allow one to investigate situations where complex objects, carrying an internal structure, under the stress produced by external interactions and driving, can alter their internal structure both in shape and even in the number of the component sub-particles. Thus one can expect the presence of a varied set of regimes of response of the system to the external perturbation. In the present work, we address precisely this last situation by means of molecular-dynamics (MD) simulations of a system forming micro phases. Micro phase formation can take place under a number of conditions on the interparticle interactions and on the state variables in three dimensions Sears and Gelbart (1999); Sciortino et al. (2004); Mladek et al. (2006); Archer and Wilding (2007); Archer et al. (2008) as well as in two Seul and Andelman (1995); Imperio and Reatto (2004, 2006); Diaz-Mendez et al. (2015). The microphases can be disordered Sears and Gelbart (1999); Archer and Wilding (2007); Imperio and Reatto (2004, 2006) as well as ordered in a crystalline-like state or other patterned structures like stripes and lamellae Leibler (1980); Fredrickson and Binder (1989); Imperio and Reatto (2004, 2006); Mladek et al. (2006); Diaz-Mendez et al. (2015) or even as an ordered bicontinous state Pini et al. (2015) in which both components of a two-component system span the space. Examples of micro-phase forming systems are block-polymers Leibler (1980); Fredrickson and Binder (1989) or hard colloids with competing interactions, e.g. short range attraction-long range repulsion like for some colloid-polymer mixtures Seul and Andelman (1995); Sears and Gelbart (1999); Archer and Wilding (2007); Imperio and Reatto (2004); Sciortino et al. (2004); Imperio and Reatto (2006). Certain soft-matter systems like star polymers or dendrimers in a good solvent can interpenetrate each other to a large extent so that the effective interaction between the centers of mass of two such entities has a soft-core character. Also such systems can form microphases in which the colloids spontaneously aggregate into clusters, and the clusters are organized in a crystalline state Lo Verso et al. (2006); Mladek et al. (2008). Rheological properties of cluster fluid phase Imperio et al. (2008) and of cluster crystal phase Nikoubashman et al. (2011) have been investigated but no study has yet addressed the tribology of such systems.
In the present work, we simulate a system of interacting colloidal particles, whose mutual interaction potential generates the spontaneous formation of clusters. In particular, we concentrate on a 2D geometry with repulsive interactions, like in many experiments carried out with colloids Mangold et al. (2003); Mikhael et al. (2008); Pertsinidis and Ling (2008); Mikhael et al. (2010); Bohlein et al. (2012); Bohlein and Bechinger (2012), but the concepts introduced here may be relevant for vortexes in superconductors Meng et al. (2017) too. The novelty compared to these experiments is the adoption of an interparticle interaction which supports the spontaneous formation of cluster phases. Cluster dynamics has been investigated in the past Reichhardt and Olson Reichhardt (2012, 2009a, 2009b): in these works clustering was forced by an external potential, while in the present work clustering is the intrinsic result of the particle-particle interaction, and is retained even when any external potentials are turned off.
Section II introduces and motivates the model. As a first step, in Sec. III we characterize the equilibrium states of the model free from external interactions. We study the ground-state energy of several regular arrangements of clusters formed by particles (with from 1 to 6, that we will refer to as -clusters) as a function of the mean colloids density, obtaining a phase diagram. Then Sect. IV reports the investigation of the dynamics of the resulting arrays of clusters interacting with a lattice-matched external periodic potential and an homogeneous pulling force. Specifically, we report the mobility curves for these cluster systems, as a function of the intensity of the pulling force, for a few values of the amplitude of the corrugation potential. We characterize in detail the different sliding regimes, with entire clusters advancing, or only parts of them. The main outcome of this research is that the clusters internal dynamics is indeed affecting significantly the depinning force and the overall mobility.
II The Model
II.1 The Interparticle Interaction
Spontaneous cluster formation can be the result of competitive interactions Seul and Andelman (1995); Sears and Gelbart (1999); Archer and Wilding (2007); Imperio and Reatto (2004); Sciortino et al. (2004); Imperio and Reatto (2006), but clusters can also form due to soft potentials Diaz-Mendez et al. (2015); Lo Verso et al. (2006); Mladek et al. (2008). Here we adopt an interaction of the latter type. We consider the following form for the pairwise interaction potential energy:
| (1) |
This interaction, depicted in Fig. 1, consists of two terms: a soft-core repulsive interaction, and a weak hard-core repulsion. The (purely soft-core) model has been fully characterized in two dimensions in Ref. Diaz-Mendez et al. (2015): its phase diagram consists in a high-temperature low-density regular fluid phase, and a low-temperature high-density cluster phase. The reason for the cluster phase is that when the inter-particle distance decreases under , the potential energy flattens out to a nearly constant energy, with the result of producing a quite small repulsive force. As a result, in one dimension a particle in between two other particles kept at fixed positions, when the distance between these fixed particles is not too large, may be better off energetically by coming closer to either of them, rather than remaining at the middle point. This suggests the mechanism whereby, in any dimensionality and at large enough density, a spontaneous symmetry breaking leading to clustering can be energetically favorable against a uniform fluid phase. A detailed mathematical criterion has been developed for the formation of cluster phases in the case of soft-core potentials in terms of their Fourier transform becoming negative in a range of finite wave vector Likos et al. (2001). At high , entropic effects and fluctuations tend to favor the uniform fluid phase against cluster formation. In the opposite extreme, for no mechanism keeps the colloids apart, and so the clustering tendency would reach the extreme limit of collapsed point-like clusters with all colloids of a cluster sitting exactly at the same position. To prevent this singular behavior we add the hard-core term of Eq. (1) for whose coefficient we adopt a relatively small value Consonni (2016) in order to perturb the phase diagram as little as possible, at least in the not-too-high-density region that we are interested in.
| Physical quantity | System units |
|---|---|
| Length | |
| Energy | |
| Mass | |
| Number density | |
| Force | |
| Time | |
| Velocity | |
| Viscous damping | |
| Mobility |
We take the repulsive-potential characteristic distance , and characteristic energy , and the mass of the colloidal particles as fundamental units. In the following we express all physical quantities in terms of suitable model units, as listed in Table 1.
II.2 The Equations of Motion
In simulations, we let the entire system evolve following the standard Langevin dynamics in two dimensions Gardiner (1985), under the effect of an external periodic corrugation potential and a constant driving force applied to each particle. The equation of motion for the particle is:
Here is the coefficient of viscous friction associated to the fluid where the colloids move; we generate an overdamped dynamics by adopting a large . The terms are Gaussian-distributed random forces with amplitude , where is the simulation time step: they simulate the collisions of the molecules in the fluid with the colloids, thus generating the appropriate Brownian dynamics. Together, the viscous and the random-force terms in Eq. (II.2) represent a standard Langevin thermostat Gardiner (1985). In simulations, the inter-particle potential is cutoffed smoothly (vanishing potential and potential derivative) at a distance Consonni (2016).
The periodic external potential simulates the effects of friction against a crystalline surface. In the laboratory, this interaction has been realized by means of a modulated light field constructed by laser interference, so that its spacing and intensity that can be tuned with considerable freedom Bohlein et al. (2012). In our simulations, we assume a corrugation potential of the form:
| (3) |
Here is the amplitude of the spatial modulation and is a 2D periodic function with hexagonal symmetry, period , and unit amplitude. Its explicit form is:
| (4) | |||||
This function is illustrated in Fig. 2.
Following the path in the direction a particle goes through alternating minima and saddle points of . This is the energetically less costly trajectory that a colloid can follow when pushed by an -directed force. Along this path, the external potential is a simple sinusoidal oscillation
| (5) |
The resulting energy barrier separating the saddle points from the minima is therefore . In this situation the static friction of an isolated particle at , i.e. the minimum force needed to push that particle across the potential corrugation when inertial effects are negligible, equals the largest value of , namely:
| (6) |
In the simulations and in the relative graphs we express all applied forces by comparison to the static friction of the single colloid, expressed in Eq. (6). For the lattice spacing we take , and select values of the particles density that favor arrays of clusters whose spacing matches precisely this separation, as discussed in Sect. II.3.
II.3 The Cell and the Initial Condition
We simulate the 2D model in a parallelogram-shaped supercell with periodic boundary conditions (PBC), thus fixing the average density. To respect the hexagonal symmetry that the arrays repulsive colloids (or clusters thereof) tend to adopt, we use a supercell generated by two primitive vectors of equal length and forming an angle of with each other. For we are free to adopt an arbitrary cell size: in the static simulations of Sect. III we will vary freely in order to evaluate the energetics as a function of the colloid density, and therefore determine the phase diagram of the free model.
For , this supercell needs to match the symmetry of the corrugation potential: we must stick to given by an integer multiple of . We settle for a compromise size , small enough to guarantee simulations involving a not-too-large number of particles (and therefore manageable simulation times), but large enough for a fair averaging over fluctuations and allowing for independent and possibly asynchronous movements of individual clusters. Accordingly, the cell contains corrugation minima in an area .
As discussed below, we find that a cluster-cluster spacing as optimal for favoring a well-defined -cluster phase. In the present work we focus on a lattice-matched condition between the cluster-cluster spacing and the spacing between adjacent minima of the corrugation. Therefore in all dynamical simulations of Sect. IV we settle for fixing , and therefore a supercell side , thus generating a supercell area . In this supercell, the potential has wells, each initially hosting a single particle or a to -particles cluster. We simulate a total particles, which thus sample the following discrete values for the average density:
| (7) |
For the initial condition, we start off with distances between the colloids within each cluster suggested by the inflection of the inter-particle potential, Fig. 1. This initial configuration relaxes very quickly to the equilibrium interparticle distances that depends on the state of the system. We start with a regular lattice of preformed clusters, because the alternative possibilities of starting, e.g., with the particles regularly or randomly distributed across the supercell leads to irregular patterns involving different cluster sizes, which may describe appropriately large temperature and/or phase-coexistence conditions, but surely do not represent the optimal single-type cluster phases at .
III Ground-state Energetics for the Free Model
While at finite temperature the number of colloids in each cluster fluctuates, at , for every given density , one expects that an hexagonal lattice of clusters with the same number of particles represents a local minimum of the total repulsive energy. We explore the density range from to . In the absence of corrugation potential () and driving force (), for every -cluster and every density (i.e. every lattice spacing of the cluster crystal), we execute a full relaxation by means of a damped dynamics, for at least a total time , but extending the relaxation for longer time until the residual kinetic energy is safely below . This method leads us very close to the precise ground state. Depending on and , the system may remain trapped in a local minimum characterized by some residual energy associated to the cluster’s orientational order, see Fig. 3. We verified that these orientational-order energies are quite small, of the order of per particle. For this reason and for the irrelevance (discussed below) to the driven dynamics, we do not investigate the details of the orientational order in the ground state of the clustered phases.
By running several energy minimizations starting from different cluster phases, we can follow the evolution of the ground-state energy as a function of the density . For each configuration we evaluate the total colloid-colloid repulsive energy, divide it by the number of colloids in the supercell, and obtain the energy per particle. Figure 4 displays the curves of the total energy per particle for each to , as a function of . We see that at each given density, several cluster configurations represent competitive local energy minima. However, at each density one of them is usually lowest in energy. Crossings between successive curves identify the coexistence density values where the -cluster and the -cluster have the same stability, and can therefore coexist. By carrying out a finer numerical analysis and a Maxwell construction one could also identify density ranges characterized by the phase coexistence of homogeneous domains consisting of clusters of different . We need not go into this detail: based on the obtained rough phase diagram, we identify the densities corresponding to stable -cluster states, characterized by a cluster-cluster spacing , and we adopt them for the driven simulations of Sect. IV.
IV Driven Dynamics
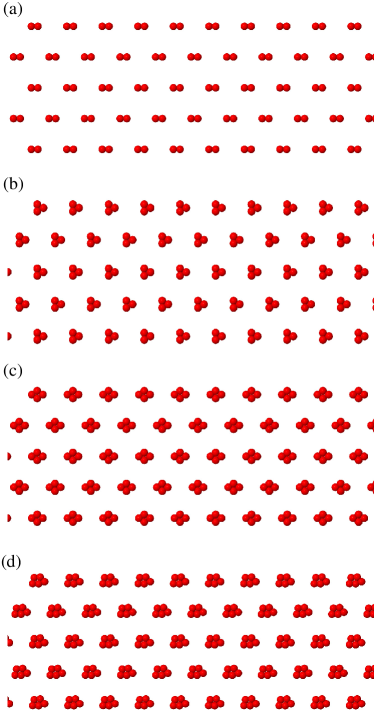
Starting from the equilibrated state obtained as discussed in Sect. III, we investigate the dynamics under the competing effects of the external periodic corrugation potential, which tends to immobilize the clusters at its minima, and the lateral driving force which, if there was no corrugation, would tend to establish a sliding state at speed . As expected of a commensurate, and even lattice-matched configuration, a static pinning threshold is always present. When is slowly raised from up to this pinning threshold, after an initial transient allowing for the cluster rearrangement, the steady sliding speed remains null. However, nontrivial rearrangements of the clusters are observed well in advance of depinning: the driving force clears all orientational orderings characteristic of the ground states. The clusters are forced to specific orientations, which are displayed in Fig. 5. These ferro-orientational Ozaki et al. (1999); Potočnik et al. (2012) arrangements are made energetically advantageous by the anisotropic energy landscape present at the regions in between the minimum and the saddle point of the corrugation potential of Fig. 2 where pushes the clusters. Precisely this force-induced ferro-orientational cluster arrangement observed for all prior to depinning Reichhardt and Olson Reichhardt (2009c) makes the orientational details of the free-model ground state (e.g. Fig. 3) irrelevant for the dynamics we address in the present work.
The most straightforward dynamical indicator for a driven model of this kind is the average mobility, i.e. the ratio of the average -directed velocity to the driving force, which we report for different numbers of colloids per cluster. If the corrugation potential was removed (), then for any nonzero force, the mobility would equal the free mobility , which equals with the present choice of the damping parameter. The addition of the corrugation leads to smaller values of mobility.
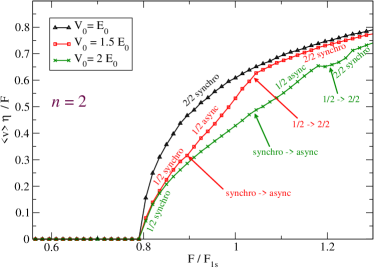
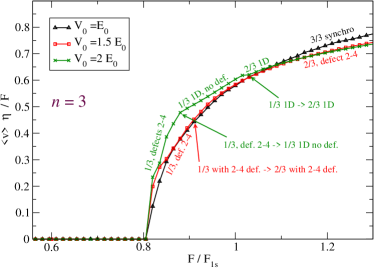
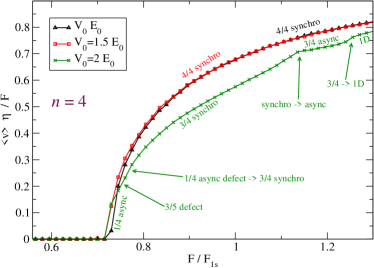
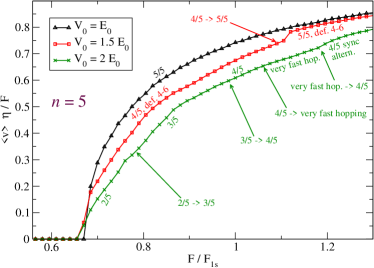
To evaluate the mobility, for each we execute three sequences of simulations, with the following amplitudes of the periodic external potential: , and . For each sequence, we increase the applied lateral force in a range proportional to , namely in small steps . At each step, the average velocity is evaluated by averaging over a total time after an initial transient time . Figures 6–9 report the resulting mobilities of the cluster lattices for the investigated numbers of colloids per cluster as a function of the applied driving force . In the initial small- simulations the driving force is insufficient to extract the colloid clusters from the potential wells of : thus a null mobility is obtained. Beyond a certain static friction threshold , the colloids unpin and start to advance, resulting in a finite mobility, which grows progressively approaching the free-particle value . The small “adiabatic”increase in allows us to evaluate with a relatively small uncertainty, and to identify the features of the particle motion as mobility increases after depinning.
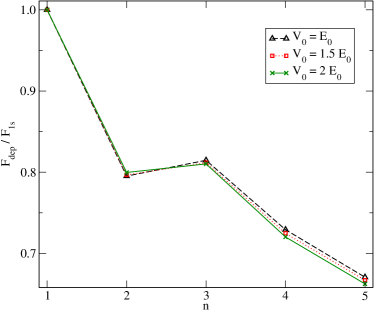
Consider the depinning force . Although its values can be read directly from Figs. 6–9, for ease of comparison Fig. 10 reports them as a function of . A first observation is that the clustering of the colloids causes a strong decrease of compared to the value of a single colloid, by about 20% for and up to 33% for . The static friction force peaks for . Above the depinning force tends to decrease as increases, as expected due to the growing size of the clusters.
The clusters mark an exception, as they depin at smaller force than . Also, in the comparison of the depinning force for three values of , we see that depinning for occurs at a smaller for than , contrary to all other cluster sizes. The reason for the special behavior of the cluster lays in its elongated conformation under traction, see Fig. 5. As a result, in the pulling direction the cluster extends over a longer distance than the size of . For this reason, when the cluster center of mass approaches the inflection point of the corrugation potential (the point beyond which the retaining force begins to taper off), the rightmost particle has moved forward more for than for .
After depinning, the mobility, on top of an overall smooth increase as a function of , exhibits sharp changes in slope, Figs. 6 - 9. These changes mark transitions between different sliding patterns, which can be examined by monitoring the advancement of the individual colloids. The following section describes precisely these sliding regimes.
IV.1 Sliding regimes
Under driving, the internal structure of the clusters makes them advance either as a single object, or less trivially with structural decompositions and recompositions. Depending on the corrugation amplitude and on the number of colloid per cluster we observe (or not) several of these decomposition-recomposition phenomena as the lateral force is increased. For convenience, we indicate the observed dynamical patterns on the mobility curves of Figs. 6 - 9, where the switching between patterns can induce visible mobility anomalies. We use labels indicating dynamical patterns which persist for an entire force interval. The labels in the mobility curves indicates that the advancement from one well to the next occurs with particles out of a cluster of jumping ahead, joining the next cluster, and leaving particles behind. Arrows point at transitions from one kind of dynamical behavior to the next.
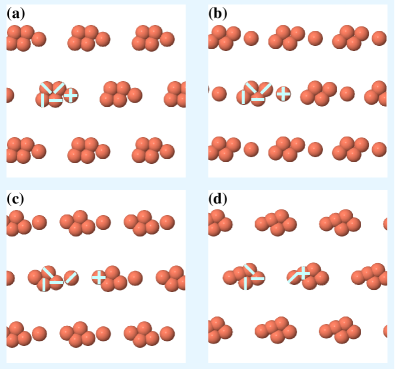
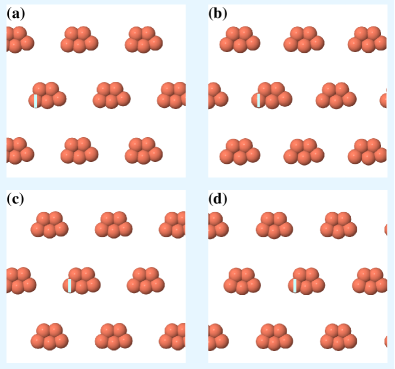
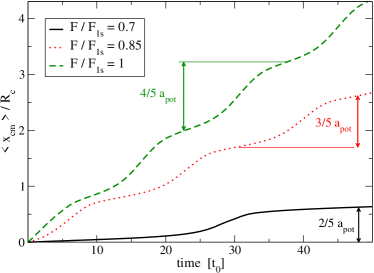
As a general rule, a small corrugation amplitude tends to favor the clusters advancing as a whole, namely in “” modes. In contrast, for larger amplitude the corrugation competes favorably with the energy advantage of the clusters to remain entire, and as a result for larger we do observe nontrivial decomposition-recomposition patterns. These decompositions can occur synchronously across the entire supercell (and in this case they are labeled synchro) or asynchronously (async label). Figures 11 and 12 report successive snapshots illustrating the two main kinds of dynamical patterns, as marked on the mobility plots. Specifically, Fig. 11 illustrates the most basic advancement mode: whole cluster advancement from one corrugation well to the next, as observed for weak corrugation . In contrast, Fig. 12 illustrates an advancement mode involving synchronous decompositions and recompositions of the clusters, with particles abandoning each cluster and jumping to the next corrugation well while leaving particles behind at each step. Examples of similar patterned movements involving different numbers of particles are reported in the Supplementary Material sup , as digital videos. Figure 13 illustrates the effect of these patterned movements on the -coordinate of the center of mass of the colloids. As the particle hoppings are synchronized across the entire sample, the center-of-mass position exhibits relatively fast jumps during the synchronized hoppings, alternating with plateaus during the clusters rearrangements. The heights of the observed steps are a fraction of , which matches precisely the specific dynamical ratio, e.g. the pattern (solid line in Fig. 13) exhibits -high steps.
When the driving force reaches relatively large values , its action on the system can force the collective dynamics into an effectively one-dimensional (1D) dynamics, with all colloids organized in rows parallel to the direction of the driving force (). We noted this mode on the mobility plots, using the appropriate 1D label, except for Fig. 6, because for the motion is quasi-1D for any . Similar quasi-1D dynamics was observed also in the different model of Ref. Reichhardt and Olson Reichhardt (2012, 2009c, 2009b). In contrast for , this quasi-1D advancement does not develop completely, because of a significant transverse (-directed) displacement persisting at all times due to the hard-core repulsion not leaving enough room for 5 colloids in a row of length . For , the large- dynamics can consist of a rapid and uninterrupted transfer of particles from one cluster to the next, as identified by the label very fast hop in Fig. 9. Alternatively we have observed a 4/5 sync altern motion, with groups of 4 colloids jumping across clusters arranged in an alternating pattern (3 above + 2 below) – (2 above + 3 below) along the rows, as illustrated in video cl5_4.44V2.avi in the Supplementary Material sup .
The synchronization of the well-to-well jumps can be promoted or disfavored by weak cluster-cluster interactions. As a consequence, we occasionally observe a de-synchronization of the well-to-well hoppings for different clusters. In the Supplementary Material sup we report examples of asynchronous dynamics, where the advancements at different rows occur at subsequent times. Contrasted to the synchronous advancement steps of Fig. 13, in asynchronous dynamics as a consequence of averaging no (or very small) steps are observed in the overall center-of-mass coordinate. The asynchronous jumps can occur in a regular sequence at different rows or with apparently chaotic hoppings as for example in the video cl4_2.71V2.avi provided as Supplementary Material sup . Note that any regularity in asynchronous motions (and possibly the overall synchronization itself when present) is favored by the specific supercell periodic boundary conditions adopted in simulation: as such, the synchronized or regular patterns may be considered artifacts of the simulated model.
This zero-temperature dynamics, often dominated by unique regular or chaotic attractors Alligood et al. (2000); Ott (2002) does not represent a realistic condition that one could put in relation to actual experiments. Indeed, in the more realistic finite-temperature simulations of Sect. IV.2 below, irregular asynchronous depinning occurs in most cases, due to the Brownian forces randomly anticipating or retarding the advancement of individual particles or clusters.
By cycling the driving force up and down, we investigated whether these dynamical systems retain some kind of dynamics memory, i.e. the sliding state is affected not only by the competition of the applied confinement potential and driving, but also by the initial sliding configuration. Indeed in these simulation we do find some small difference of the boundaries between specific dynamical modes between the decreasing- path and the increasing- path. To rule out non-physical underdamping effects, we verified that such hysteretic effects persist even under a doubled damping rate , indicating that a competition among multiple dynamical attractors is indeed present in this model.
In the present study the adopted -directed orientation of the driving force tends to drive the colloids straight across the saddle points of the corrugation potential. By exploring other more general pushing directions, depending on the angle formed by the force with the -direction, the colloids would be driven toward the corrugation maxima too. This kind of investigation has been carried out in the past for different models or experimental setups, typically finding locking to energetically and/or dynamically favorable advancement directions Reichhardt and Olson Reichhardt (2004, 2011); Bohlein and Bechinger (2012). We expect similar directional-locking phenomena in the present model. However, possible novel regimes realized by the current cluster model may include concurrent multiple decomposition paths for the clusters, with several particles leaving simultaneously a potential well to reach different neighboring ones. We leave the investigation of these regimes to future research.
IV.2 Thermal Effects
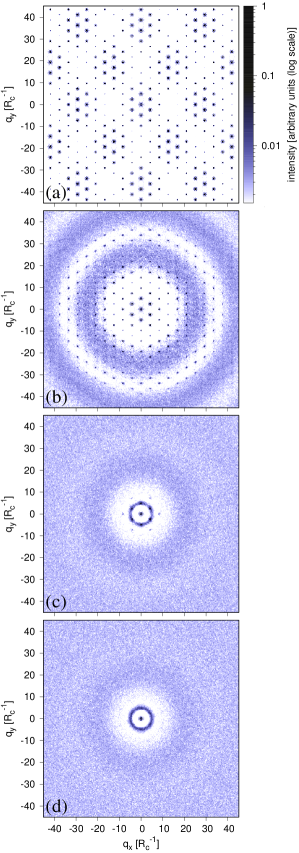
We simulate finite temperature by restoring the random forces in the equations of motion (II.2), and therefore sampling the canonical ensemble. The starting point of the simulations is the appropriate static configuration (a perfect cluster lattice) obtained in Sect. III. In the simulated scattering intensity reported in Fig. 14a, the modulation of the Bragg peaks reflects the structure factor of the orientationally ordered lozenge-shaped clusters at , see Fig. 5c. In the finite-temperature simulations of the free model (, ), it is straightforward to verify that even a low temperature, such as induces the melting of the orientational order of the clusters, as seen in the diffuse rings at integer multiples of reported in Fig. 14b. Further raising temperature leads rapidly to more disordering of the cluster crystal, and eventually to melting, which occurs between and , see Fig. 14c,d.
According to this analysis, we focus the investigation of the driven model on moderately-low temperature . In the simulations under driving, as we did in the protocol, successive runs at larger and larger driving force are started from the final configuration of the previous step in , which is increased “adiabatically” by at each step. For each step, the simulation duration is : the first 30% is dropped to prevent transient effects, and the remainder is used for the determination of the mobility, providing a fair averaging over thermal fluctuations.
Strictly speaking, at finite temperature there is no static friction, because thermal fluctuations would lead to a diffusive displacement of the layer even for , and to a slow systematic drift in the force direction for , if one had the patience to wait long enough for these thermally-activated rare events to occur. However, at the relatively small considered temperatures , the rate of well-to-well thermal-assisted hopping is extremely small, and as long as the applied force is small , we observe no such hoppings at all for the duration of our simulations. This allows us to define even for , as the threshold force beyond which a significant center-of-mass displacement is observed in the applied force direction within the simulation duration. For forces immediately before this threshold, the mobility is not precisely null, but it is really tiny, with overall advancements of the entire system by far less than one lattice spacing over the entire simulation time. We note also that all particle well-to-well displacements occur within horizontal rows: although a-priori possible, we never observe any particle abandoning their initial -oriented row and transferring to a well in the next row. These cross-row hopping would of course become frequent for larger . We do however observe particle jumps within rows, leading to a limited but nonzero random concentration of and “defective” clusters in the pre-depinning quasi-immobile state.
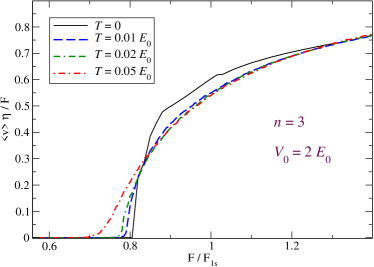
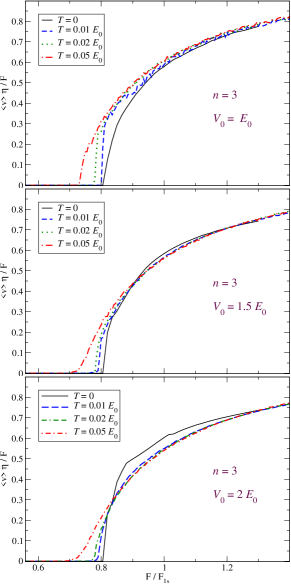
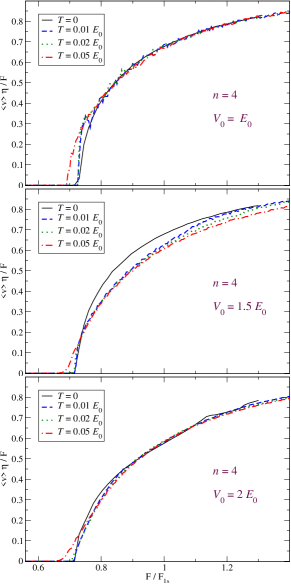
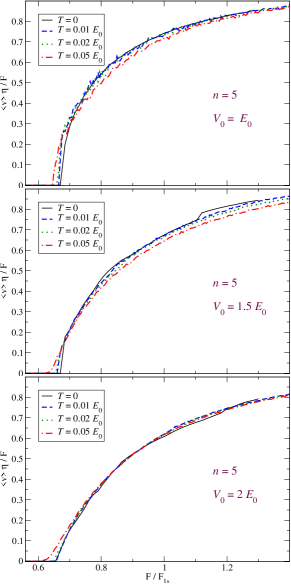
The mobility resulting in the finite-temperature simulations is exemplified in Fig. 15. This figure exhibits the following characteristic features, common to analogous simulations that we carried out for clusters of sizes to , and reported in Appendix: (i) The depinning threshold decreases for increasing temperature, because thermal fluctuations help the particles anticipate the barrier hopping, thus activating sliding even when the driving force is nominally insufficient to overcome the barrier. (ii) For , immediately above the threshold, thermal fluctuations tend to favor the sliding state, as shown by the higher mobility proving a sort of thermolubric effect Gnecco et al. (2000); Sang et al. (2001); Dudko et al. (2002); Riedo et al. (2003); Reimann and Evstigneev (2004); Krylov et al. (2005); Jinesh et al. (2008); Franchini et al. (2008); Pierno et al. (2014). However, depending on and the corrugation amplitude , for forces larger than the depinning threshold , increasing temperature can lead to either a slightly decreasing mobility, as in Fig. 15, or essentially -independent mobility, quite similar to the values obtained for , see Appendix A.
The main effect of finite temperature on the cluster dynamics is to suppress the synchronized advancements, especially those associated to the fractional-advancement modes. As a result, at the center-of-mass advancement is generally smoother, with no, or at least substantially smeared, steps like those occurring for the fractional sliding regimes reported in Fig. 13. Nonetheless, some amount of approximate synchronization is preserved in the special case of whole-cluster hopping, e.g. at the synchro pattern of Fig. 7 even extends down to smaller than for . Relatedly, the sharp transitions between different sliding modes observed at , at finite are replaced by smooth crossovers.
V Discussion and Conclusions
In the present work we introduce and study a driven model for friction at the micro scale where the protagonists are spontaneously formed clusters, rather than simple structureless objectsThompson and Robbins (1990); Shinjo and Hirano (1993); Smith et al. (1996); He et al. (1999); Müser and Robbins (2000); Consoli et al. (2000); Vanossi et al. (2000); Müser et al. (2001); Consoli et al. (2001); Vanossi et al. (2004); Guerra et al. (2010); Braun and Manini (2011); Manini and Braun (2011); van den Ende et al. (2012); Hasnain et al. (2014); Varini et al. (2015); Ma et al. (2015); Koren and Duerig (2016) or structured but unbreakable unitsBraun et al. (2008); Sivebaek and Samoilov (2012), as usually considered in previous investigations. We focus on a lattice-matched situation, with the external corrugation periodicity matching exactly the equilibrium spacing between the clusters. In the language of the Frenkel-Kontorova model Floría and Mazo (1996); Braun and Kivshar (1998, 2004); Popov et al. (2011); Vanossi et al. (2013a), this is the typical situation which maximizes the pinning effect of the corrugation, leading to a finite static friction regardless of how small the corrugation amplitude may be. We do find indeed a finite static friction in our simulations of the current model, with clustering affecting the static-friction threshold and the sliding mechanisms for driving force exceeding this threshold.
For small corrugation amplitude, the clustering tendency is dominating the dynamics, so that clusters tend to advance as a individual objects, with the partial exception of single-particle hopping induced by thermal fluctuations near the depinning threshold. In contrast, at larger corrugation amplitude, the stability of clusters is challenged when the driving force moves them in regions where the curvature of the external corrugation potential is negative: this leads to cluster decomposition and partial hoppings. In this regime, the internal structure of the clusters decomposes in several ways as a function of the driving force, thus producing a quite rich dynamics with complicate fractional advancement patterns for clusters of various size. We investigate the impact of these phenomena on the mobility of the system. At we observe and characterize well-defined regimes of sliding of entire clusters or of decomposition-recomposition processes, with deformation of the clusters. These processes can take place in a synchronous or in asynchronous way across the system. Thermal effects tend to destroy such distinct regimes: we observe a gradual change of sliding under increasing driving force, already for temperature as low as % of the temperature at which the transition from a cluster crystal to a uniform fluid occurs.
The phenomenon of cluster decomposition/recomposition under driving is not expected to be specific of the interparticle interaction adopted here. We therefore predict that experiments carried out in conditions where spontaneous clustering occurs should observe this kind of dynamical behavior.
In the future we plan to extend the investigation to lattice-mismatched configurations. In incommensurate conditions, for increasing corrugation amplitude there is room for an Aubry-type transition from a “superlubric” dynamics characterized by ”solitonic” sliding modes Aubry (1978); Peyrard and Aubry (1983); Floría and Mazo (1996); Braun and Kivshar (1998); Santoro et al. (2006); Vanossi et al. (2007a, b); Manini et al. (2007); Cesaratto et al. (2007); Castelli et al. (2008, 2009); Vanossi et al. (2012, 2013b); Mandelli et al. (2015a, b); Paronuzzi Ticco et al. (2016); Mandelli et al. (2017); Bonfanti et al. (2017). A similar condition could be realized by taking for the substrate a symmetry other than hexagonal, as e.g. in Ref. Persson (1993); Manini and Braun (2011); McDermott et al. (2013a, b). In the small- superlubric ground state, a finite fraction of clusters is supposed to sit near one of the maxima of the incommensurate corrugation potential, rather than all in a potential well as in the fully commensurate setup of the present paper. The novelty for a cluster-supporting condition is that, as is raised, two competing effects may arise: either an entire cluster near the maximum slides down toward a nearby potential well, thus leading to a relatively standard Aubry-type transition Mandelli et al. (2015a, 2017), or alternatively it decomposes under the action of divergent corrugation forces, leading to a structurally inequivalent ground state. Which of these mechanisms turns in earlier is open for investigation. These competing possibilities are likely to lead to a rich phase diagram.
Acknowledgements.
We acknowledge useful discussion with C. Bechinger, R. Guerra, and A. Vanossi. The COST Action MP1303 is also gratefully acknowledged.Appendix A Thermal effects on mobility
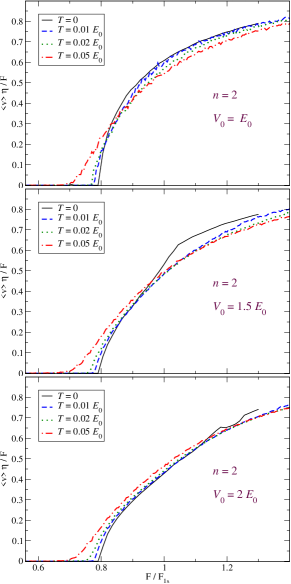
Figures 16 - 19 report simulated mobilities as a function of the driving force. The simulations are carried out at the values of the average particle density given by Eq. (7), for , compatible with clusters of particles arranged in a regular hexagonal lattice with spacing . Three different values of corrugation amplitude are considered, namely: , , and . Each figure compares the mobility (also shown in the Figs. 6-9) with the homologous quantity obtained in finite-temperature simulations, carried out at three comparably small temperatures: , , and .
References
- Müser et al. (2003) M. H. Müser, M. Urbakh, and M. O. Robbins, Adv. Chem. Phys. 126, 187 (2003).
- Müser (2007) M. H. Müser, in Fundamentals of Friction and Wear on the Nanoscale, edited by E. Gnecco and E. Meyer (Springer, New York, 2007) pp. 177–199.
- Vanossi et al. (2013a) A. Vanossi, N. Manini, M. Urbakh, S. Zapperi, and E. Tosatti, Rev. Mod. Phys. 85, 529 (2013a).
- Vigentini et al. (2014) A. Vigentini, B. Van Hattem, E. Diato, P. Ponzellini, T. Meledina, A. Vanossi, G. Santoro, E. Tosatti, and N. Manini, Phys. Rev. B 89, 094301 (2014).
- Manini et al. (2015) N. Manini, O. M. Braun, and A. Vanossi, “Nanotribology: Nonlinear mechanisms of friction,” in Fundamentals of Friction and Wear on the Nanoscale 2nd ed., edited by E. Gnecco and E. Meyer (Springer, Berlin, 2015) p. 175.
- Manini et al. (2016) N. Manini, O. M. Braun, E. Tosatti, R. Guerra, and A. Vanossi, J. Phys.: Condens. Matter 28, 293001 (2016).
- Manini et al. (2017) N. Manini, G. Mistura, G. Paolicelli, E. Tosatti, and A. Vanossi, Adv. Phys. X 2, 569 (2017).
- Apostoli et al. (2017) C. Apostoli, G. Giusti, J. Ciccoianni, G. Riva, R. Capozza, R. L. Woulaché, A. Vanossi, E. Panizon, and N. Manini, Beilstein J. Nanotechnol. 8, 2186 (2017).
- Panizon et al. (2018) E. Panizon, G. E. Santoro, E. Tosatti, G. Riva, and N. Manini, Phys. Rev. B 97, 104104 (2018).
- Bohlein et al. (2012) T. Bohlein, J. Mikhael, and C. Bechinger, Nat. Mater. 11, 126 (2012).
- Hasnain et al. (2013) J. Hasnain, S. Jungblut, and C. Dellago, Soft Matter 9, 5867 (2013).
- Hasnain et al. (2014) J. Hasnain, S. Jungblut, A. Tröster, and C. Dellago, Nanoscale 6, 10161 (2014).
- Brazda et al. (2017) T. Brazda, C. July, and C. Bechinger, Soft Matter 13, 4024 (2017).
- Brazda et al. (2018) T. Brazda, A. Silva, N. Manini, A. Vanossi, R. Guerra, E. Tosatti, and C. Bechinger, Phys. Rev. X 8, 011050 (2018).
- Sears and Gelbart (1999) R. Sears and W. Gelbart, J. Chem. Phys. 110, 4582 (1999).
- Sciortino et al. (2004) F. Sciortino, S. Mossa, E. Zaccarelli, and P. Tartaglia, Phys. Rev. Lett. 93, 055701 (2004).
- Mladek et al. (2006) B. M. Mladek, D. Gottwald, G. Kahl, M. Neumann, and C. N. Likos, Phys. Rev. Lett. 96, 045701 (2006).
- Archer and Wilding (2007) A. J. Archer and N. B. Wilding, Phys. Rev. E 76, 031501 (2007).
- Archer et al. (2008) A. J. Archer, C. Ionescu, D. Pini, and L. Reatto, J. Phys.: Condens. Matter 20, 415106 (2008).
- Seul and Andelman (1995) M. Seul and D. Andelman, Science 267, 476 (1995).
- Imperio and Reatto (2004) A. Imperio and L. Reatto, J. Phys. Condens. Matter 16, S3769 (2004).
- Imperio and Reatto (2006) A. Imperio and L. Reatto, J. Chem. Phys. 124, 164712 (2006).
- Diaz-Mendez et al. (2015) R. Diaz-Mendez, F. Mezzacapo, F. Cinti, W. Lechner, and G. Pupillo, Phys. Rev. E 92, 052307 (2015).
- Leibler (1980) L. Leibler, Macromolecules 13, 1602 (1980).
- Fredrickson and Binder (1989) G. Fredrickson and K. Binder, J. Chem. Phys. 91, 7265 (1989).
- Pini et al. (2015) D. Pini, A. Parola, and L. Reatto, J. Chem. Phys. 143, 034902 (2015).
- Lo Verso et al. (2006) F. Lo Verso, C. Likos, and L. Reatto, Progr. Colloid Polym. Sci. 133, 78 (2006).
- Mladek et al. (2008) B. M. Mladek, G. Kahl, and C. N. Likos, Phys. Rev. Lett. 100, 028301 (2008).
- Imperio et al. (2008) A. Imperio, L. Reatto, and S. Zapperi, Phys. Rev. E 78, 021402 (2008).
- Nikoubashman et al. (2011) A. Nikoubashman, G. Kahl, and C. N. Likos, Phys. Rev. Lett. 107, 068302 (2011).
- Mangold et al. (2003) K. Mangold, P. Leiderer, and C. Bechinger, Phys. Rev. Lett. 90, 158302 (2003).
- Mikhael et al. (2008) J. Mikhael, J. Roth, L. Helden, and C. Bechinger, Nature (London) 454, 501 (2008).
- Pertsinidis and Ling (2008) A. Pertsinidis and X. S. Ling, Phys. Rev. Lett. 100, 028303 (2008).
- Mikhael et al. (2010) J. Mikhael, M. Schmiedeberg, S. Rausch, J. Roth, H. Stark, and C. Bechinger, Proc. Natl. Acad. Sci. U.S.A. 107, 7214 (2010).
- Bohlein and Bechinger (2012) T. Bohlein and C. Bechinger, Phys. Rev. Lett. 109, 058301 (2012).
- Meng et al. (2017) Q. Meng, C. N. Varney, H. Fangohr, and E. Babaev, J. Phys.: Condens. Matter 29, 035602 (2017).
- Reichhardt and Olson Reichhardt (2012) C. Reichhardt and C. J. Olson Reichhardt, Phys. Rev. E 85, 051401 (2012).
- Reichhardt and Olson Reichhardt (2009a) C. Reichhardt and C. J. Olson Reichhardt, Phys. Rev. E 80, 022401 (2009a).
- Reichhardt and Olson Reichhardt (2009b) C. Reichhardt and C. J. Olson Reichhardt, Proc. SPIE 7400, 74000J (2009b).
- Likos et al. (2001) C. N. Likos, A. Lang, M. Watzlawek, and H. Löwen, Phys. Rev. E 63, 031206 (2001).
- Consonni (2016) L. Consonni, Meccanismi di depinning in un modello di colloidi soffici, B.Sc thesis, University Milan (2016), http://materia.fisica.unimi.it/manini/theses/consonni.pdf.
- Gardiner (1985) C. Gardiner, Handbook of Stochastic Methods for Physics, Chemistry and the Natural Sciences (Springer, Berlin, 1985).
- Ozaki et al. (1999) Y. Ozaki, M. Prager, and B. Asmussen, J. Phys. Chem. Solids 60, 1523 (1999).
- Potočnik et al. (2012) A. Potočnik, N. Manini, M. Komelj, E. Tosatti, and D. Arčon, Phys. Rev. B 86, 085109 (2012).
- Reichhardt and Olson Reichhardt (2009c) C. Reichhardt and C. J. Olson Reichhardt, Phys. Rev. E 79, 061403 (2009c).
- (46) See Supplemental Material at URL to be inserted by publisher for digital videos illustrating the driven dynamics of the model.
- Alligood et al. (2000) K. T. Alligood, T. D. Sauer, and J. A. Yorke, Chaos: An Introduction to Dynamical Systems (Springer, New York, 2000).
- Ott (2002) E. Ott, Chaos in Dynamical Systems (Cambridge Univ. Press, New York, 2002).
- Reichhardt and Olson Reichhardt (2004) C. Reichhardt and C. J. Olson Reichhardt, Phys. Rev. E 69, 041405 (2004).
- Reichhardt and Olson Reichhardt (2011) C. Reichhardt and C. J. Olson Reichhardt, Phys. Rev. Lett. 106, 060603 (2011).
- Gnecco et al. (2000) E. Gnecco, R. Bennewitz, T. Gyalog, C. Loppacher, M. Bammerlin, E. Meyer, and H.-J. Güntherodt, Phys. Rev. Lett. 84, 1172 (2000).
- Sang et al. (2001) Y. Sang, M. Dubé, and M. Grant, Phys. Rev. Lett. 87, 174301 (2001).
- Dudko et al. (2002) O. M. Dudko, A. Filippov, J. Klafter, and M. Urbakh, Chem. Phys. Lett. 352, 499 (2002).
- Riedo et al. (2003) E. Riedo, E. Gnecco, R. Bennewitz, E. Meyer, and H. Brune, Phys. Rev. Lett. 91, 084502 (2003).
- Reimann and Evstigneev (2004) P. Reimann and M. Evstigneev, Phys. Rev. Lett. 93, 230802 (2004).
- Krylov et al. (2005) S. Y. Krylov, K. B. Jinesh, H. Valk, M. Dienwiebel, and J. W. M. Frenken, Phys. Rev. E 71, 065101 (2005).
- Jinesh et al. (2008) K. B. Jinesh, S. Y. Krylov, H. Valk, M. Dienwiebel, and J. W. M. Frenken, Phys. Rev. B 78, 155440 (2008).
- Franchini et al. (2008) A. Franchini, V. Bortolani, G. Santoro, and M. Brigazzi, Phys. Rev. E 78, 046107 (2008).
- Pierno et al. (2014) M. Pierno, L. Bignardi, M. Righi, L. Bruschi, S. Gottardi, M. Stohr, O. Ivashenko, P. Silvestrelli, P. Rudolf, and G. Mistura, Nanoscale 6, 8062 (2014).
- Thompson and Robbins (1990) P. Thompson and M. O. Robbins, Science 250, 792 (1990).
- Shinjo and Hirano (1993) K. Shinjo and M. Hirano, Surf. Sci. 283, 473 (1993).
- Smith et al. (1996) E. D. Smith, M. O. Robbins, and M. Cieplak, Phys. Rev. B 54, 8252 (1996).
- He et al. (1999) G. He, M. H. Müser, and M. O. Robbins, Science 284, 1650 (1999).
- Müser and Robbins (2000) M. H. Müser and M. O. Robbins, Phys. Rev. B 61, 2335 (2000).
- Consoli et al. (2000) L. Consoli, H. J. F. Knops, and A. Fasolino, Phys. Rev. Lett. 85, 302 (2000).
- Vanossi et al. (2000) A. Vanossi, J. Röder, A. R. Bishop, and V. Bortolani, Phys. Rev. E 63, 017203 (2000).
- Müser et al. (2001) M. H. Müser, L. Wenning, and M. O. Robbins, Phys. Rev. Lett. 86, 1295 (2001).
- Consoli et al. (2001) L. Consoli, H. J. F. Knops, and A. Fasolino, Phys. Rev. E 64, 016601 (2001).
- Vanossi et al. (2004) A. Vanossi, G. Santoro, and V. Bortolani, J. Phys.: Condens. Matter 16, S2895 (2004).
- Guerra et al. (2010) R. Guerra, U. Tartaglino, A. Vanossi, and E. Tosatti, Nat. Mater. 9, 634 (2010).
- Braun and Manini (2011) O. M. Braun and N. Manini, Phys. Rev. E 83, 021601 (2011).
- Manini and Braun (2011) N. Manini and O. M. Braun, Phys. Lett. A 375, 2946 (2011).
- van den Ende et al. (2012) J. A. van den Ende, A. S. de Wijn, and A. Fasolino, J. Phys. Condens. Matter 24, 445009 (2012).
- Varini et al. (2015) N. Varini, A. Vanossi, R. Guerra, D. Mandelli, R. Capozza, and E. Tosatti, Nanoscale 7, 2093 (2015).
- Ma et al. (2015) M. Ma, A. Benassi, A. Vanossi, and M. Urbakh, Phys. Rev. Lett. 114, 055501 (2015).
- Koren and Duerig (2016) E. Koren and U. Duerig, Phys. Rev. B 93, 201404 (2016).
- Braun et al. (2008) O. M. Braun, N. Manini, and E. Tosatti, Phys. Rev. B 78, 195402 (2008).
- Sivebaek and Samoilov (2012) I. M. Sivebaek and V. N. Samoilov, B. N. J. Persson Phys. Rev. Lett. 108, 036102 (2012).
- Floría and Mazo (1996) L. Floría and J. Mazo, Adv. Phys. 45, 505 (1996).
- Braun and Kivshar (1998) O. M. Braun and Y. Kivshar, Phys. Rep. 306, 1 (1998).
- Braun and Kivshar (2004) O. M. Braun and Y. S. Kivshar, The Frenkel-Kontorova Model: Concepts, Methods, and Applications (Springer, Berlin, 2004).
- Popov et al. (2011) A. Popov, D. Viehman, and R. Hernandez, J. Chem. Phys. 134, 104703 (2011).
- Aubry (1978) S. Aubry, in Solitons and Condensed Matter Physics, edited by A. R. Bishop, T. Schneider, and S. S. in Solid State Sciences Vol. 8 (Springer, Berlin, 1978) pp. 264–277.
- Peyrard and Aubry (1983) M. Peyrard and S. Aubry, J. Phys. C: Solid State Phys. 16, 1593 (1983).
- Santoro et al. (2006) G. E. Santoro, A. Vanossi, N. Manini, G. Divitini, and E. Tosatti, Surf. Sci. 600, 2726 (2006).
- Vanossi et al. (2007a) A. Vanossi, G. E. Santoro, N. Manini, M. Cesaratto, and E. Tosatti, Surf. Sci. 601, 3670 (2007a).
- Vanossi et al. (2007b) A. Vanossi, N. Manini, F. Caruso, G. E. Santoro, and E. Tosatti, Phys. Rev. Lett. 99, 206101 (2007b).
- Manini et al. (2007) N. Manini, A. Vanossi, G. E. Santoro, and E. Tosatti, Phys. Rev. E 76, 046603 (2007).
- Cesaratto et al. (2007) M. Cesaratto, N. Manini, A. Vanossi, E. Tosatti, and G. E. Santoro, Surf. Sci. 601, 3682 (2007).
- Castelli et al. (2008) I. E. Castelli, N. Manini, R. Capozza, A. Vanossi, G. E. Santoro, and E. Tosatti, J. Phys.: Condens. Matter 20, 354005 (2008).
- Castelli et al. (2009) I. E. Castelli, R. Capozza, A. Vanossi, G. E. Santoro, N. Manini, and E. Tosatti, J. Chem. Phys. 131, 174711 (2009).
- Vanossi et al. (2012) A. Vanossi, N. Manini, and E. Tosatti, P. Natl. Acad. Sci. USA 109, 16429 (2012).
- Vanossi et al. (2013b) A. Vanossi, A. Benassi, N. Varini, and E. Tosatti, Phys. Rev. B 87, 045412 (2013b).
- Mandelli et al. (2015a) D. Mandelli, A. Vanossi, N. Manini, and E. Tosatti, Phys. Rev. Lett. 114, 108302 (2015a).
- Mandelli et al. (2015b) D. Mandelli, A. Vanossi, M. Invernizzi, S. Paronuzzi, N. Manini, and E. Tosatti, Phys. Rev. B 92, 134306 (2015b).
- Paronuzzi Ticco et al. (2016) S. Paronuzzi Ticco, G. Fornasier, N. Manini, G. E. Santoro, E. Tosatti, and A. Vanossi, J. Phys.: Condens. Matter 28, 134006 (2016).
- Mandelli et al. (2017) D. Mandelli, A. Vanossi, N. Manini, and E. Tosatti, Phys. Rev. B 95, 245403 (2017).
- Bonfanti et al. (2017) S. Bonfanti, A. Taloni, C. Negri, A. Sellerio, N. Manini, and S. Zapperi, J. Phys. Chem. Lett. 8, 5438 (2017).
- Persson (1993) B. N. J. Persson, Phys. Rev. B 48, 18140 (1993).
- McDermott et al. (2013a) D. McDermott, J. Amelang, C. J. Olson Reichhardt, and C. Reichhardt, Phys. Rev. E 88, 062301 (2013a).
- McDermott et al. (2013b) D. McDermott, J. Amelang, L. Lopatina, C. J. Olson Reichhardt, and C. Reichhardt, Soft Matter 9, 4607 (2013b).