AKARI color useful for classifying chemical types of Miras
Abstract
The AKARI/IRC color combining the and bands is useful for distinguishing between oxygen-rich and carbon-rich circumstellar dust. Ishihara and collaborators found in 2011 that this color, used together with the near-IR color , can be used to classify two groups of dust-enshrouded stars with different chemistry. They investigated the distributions of such dusty AGB stars in the Galaxy and found that those with oxygen-rich dust are more centrally concentrated. While this is consistent with previous studies, the map in Ishihara et al. shows that carbon-rich stars are also present in the Galactic bulge for which almost no carbon-rich stars were reported before. Here we focus on Mira variables whose distances can be well constrained based on the period-luminosity relation. Among some candidates of carbon-rich Miras selected by the AKARI color, we confirmed at least four carbon-rich Miras within the bulge with their optical spectra. This gives a new insight into the complicated nature of stellar populations in the bulge.
keywords:
stars: AGB and post-AGB, stars: late-type, Galaxy: bulge, Galaxy: stellar content, infrared: starsNoriyuki Matsunaga
1 Introduction
Miras are pulsating stars with long period ( d) and large amplitude ( mag in ). They appear at the last stage of the Asymptotic Giant Branch (AGB), and their period-luminosity relation serves as a good distance scale (Whitelock et al., 2008; Whitelock, 2013, and references therein). During their evolution, thermal pulses can dredge up carbon produced in the interior to the surface, and some of them (and also some non-Mira AGB stars) get more carbon than oxygen on the surface. Such stars show very different molecules from others with more oxygen; for example, C2 for carbon-rich (C-rich) stars, and H2O and TiO for oxygen-rich (O-rich) stars, in addition to CO molecules which are present in both groups. C-rich AGB stars with this canonical evolutionary path are aged at around 0.5–5 Gyr and thus represent intermediate-age stellar population (Mouhcine & Lançon, 2003; Marigo et al., 2008). There are other evolutionary paths for producing C-rich stars and their ages may be largely different (see e.g. McClure & Woodsworth, 1990; Green & Margon, 1994; Izzard et al., 2007).
Our focus is C-rich Miras in the Galactic bulge. Such objects would give us an insight into stellar population in the bulge and its evolution, although very few C-rich objects are known in this inner region of the Galaxy. A small number of C-rich giants were found in early 1990s (Azzopardi et al., 1991; Tyson & Rich, 1991), but their nature is still unclear (Whitelock, 1993; Ng, 1997). They are fainter than expected for Miras or the late-stage AGBs in the bulge, and evolutionary paths through binary interaction have been suggested. Miszalski et al. (2013) recently discovered a C-rich symbiotic Mira towards the bulge, although its membership to the bulge was questioned (also see below). The vast majority of Miras and late-stage AGBs in the bulge are considered to be O-rich. In order to find C-rich Miras among a large number of O-rich ones, it is necessary to identify good candidates of C-rich objects in an efficient way.
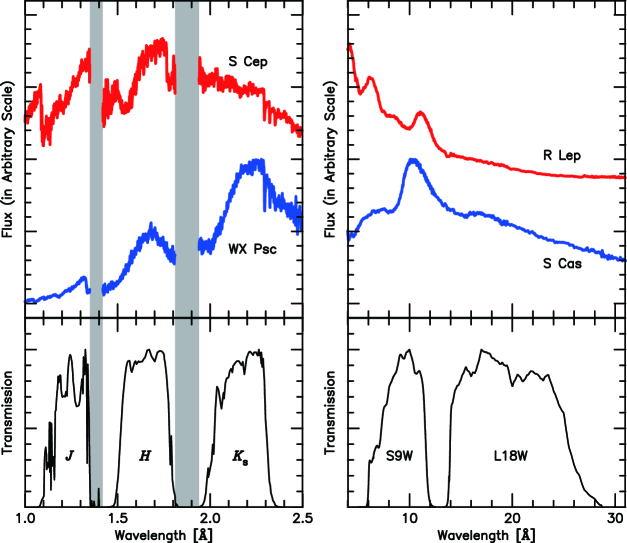
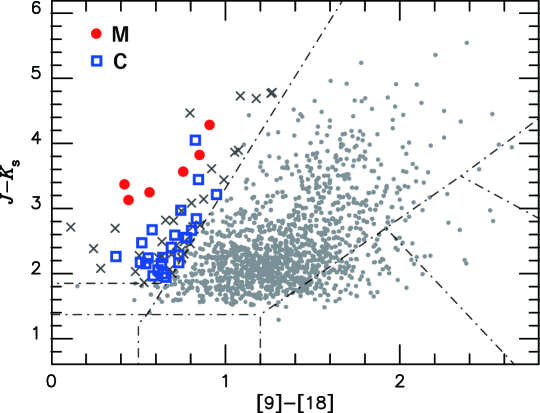
On the - diagram, C-rich and O-rich stars are separated into different color locations (Ishihara et al., 2011). In this paper, and stand for magnitudes in and bands, respectively, taken from the AKARI/IRC mid-IR all-sky survey catalog (Ishihara et al., 2010), while the near-IR colors, were taken from the 2MASS catalog (Skrutskie et al., 2006). The separation is mainly attributed to different color trend in the mid IR due to different chemical composition of their circumstellar dust shells. According to Ita et al. (2010), dusty C-rich stars often show the SiC emission band at 11.3 m within the [9] band in addition to a continuum excess due to amorphous carbon dust, while dusty O-rich stars have the silicate bands at 9.8 and 18 m. In the near-IR bands, C-rich AGB stars have strong C2 and CN bands in , whilst there are no correspondingly strong bands in . In contrast, O-rich AGB stars have strong H2O absorption which affects both and bands in addition to TiO and VO bands seen in . Figure 1 presents near-IR and mid-IR spectra of C-rich and and O-rich Miras showing their features well.
2 Selection and spectroscopic follow-up of C-rich Miras
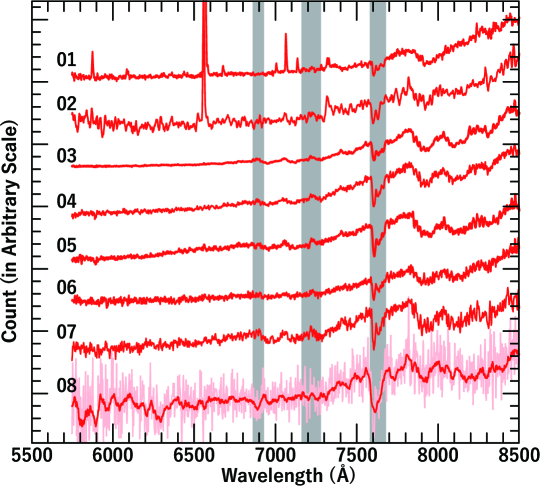
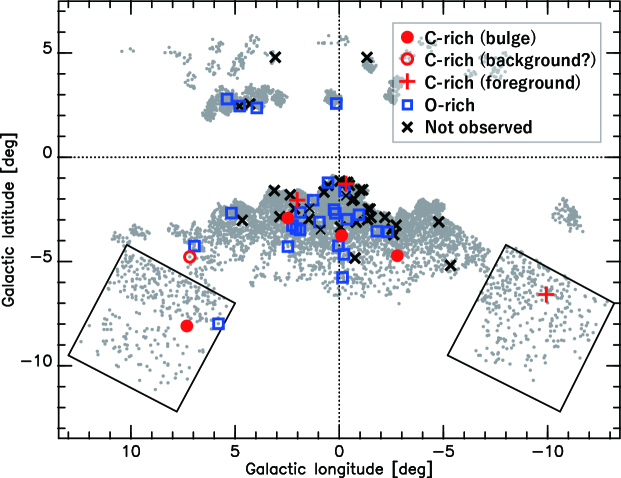
Based on the - diagram (Figure 2), we identified 66 candidates of C-rich Miras among more than 6500 Miras in the OGLE-III catalog of long-period variables in the bulge (Soszyński et al., 2013). 33 of them were observed by SpUpNIC spectrograph (Crause et al., 2016) attached to the 1.9-m telescope in South African Astronomical Observatory in 2016 July. In addition, we also obtained spectra of 3 Miras in Catchpole et al. (2016). These spectra in the optical range are of low resolution, but classification between C-rich and O-rich stars is fairly straightforward with clearly different molecular features of the two groups (e.g. CN and TiO bands for C-rich and O-rich stars, respectively). Figure 2 plots spectra of eight C-rich Miras we confirmed, while other 25 Miras were found to be O-rich and poor quality of the spectra prevented the classification for three. We also made near-IR photometric observations of most of these Miras using the 1.4-m Infrared Survey Facility (IRSF) in South African Astronomical Observatory, and used the time-series magnitudes to check their memberships to the bulge. Considering their locations on the color-magnitude and the period-wesenheit diagrams, among the eight C-rich Miras, three (including the symbiotic Mira in Miszalski et al., 2013) are foreground, four are very likely within the bulge, while the last one may be background (see figures in Matsunaga et al., 2017). These C-rich Miras in the bulge represents a rare stellar population in the bulge, although their origin and nature need to be further investigated. Figure 4 plots their locations in the Galactic coordinate.
3 Concluding remarks
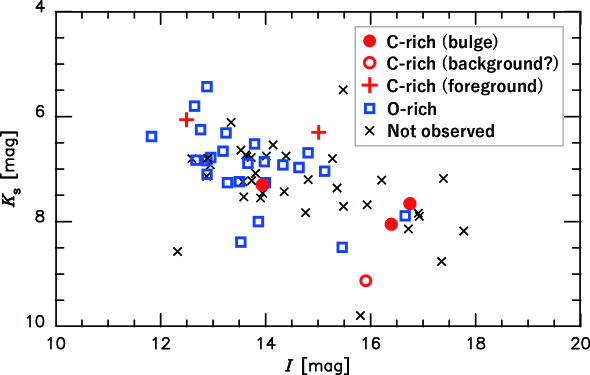
We confirmed that the - diagram which had been used for general dusty stars (Ishihara et al., 2011) is also useful for classifying between C-rich and O-rich Miras. For example, this tool allows one to efficiently identify rare C-rich Miras in the Galactic bulge where the majority is O-rich Miras (Matsunaga et al., 2017). The color classification often done by single-epoch photometric catalogs, however, may be confused by photometric errors and color variation, and spectroscopic follow-up is important to confirm the diagnosis. Even low-resolution spectra are useful because of very different broad molecular bands in the two groups of Miras. Small-sized telescopes equipped with low-resolution spectrograph can be useful for such follow-up, but some objects are highly attenuated by the circumstellar dust (and in some cases by interstellar dust for objects in the Galactic bulge and disk). Figure 5 compares -band and -band magnitudes of our candidate C-rich Miras in the bulge. Notably, C-rich Miras tend to be fainter than O-rich ones, and our spectroscopic observation with SpUpNIC at the 1.9-m SAAO telescope was limited by the faintness of our targets in . Dusty red targets remain relatively bright in , indicating the advantage of IR spectrographs.
Acknowledgments
This contribution is based on a paper by Matsunaga, Menzies, Feast, Whitelock, Onozato, Barway, & Aydi (2017). This work was supported as a Joint Research Project under agreement between the Japan Society for the Promotion of Science (JSPS) and National Research Foundation (NRF) in South Africa. NM is grateful to Grant-in-Aid (No. 26287028) from the JSPS. This research is based on observations with AKARI, a JAXA project with the participation of ESA.
References
- Azzopardi et al. (1991) Azzopardi, M., Lequeux, J., Rebeirot, E. et al. 1991, A&AS, 88, 265
- Carpenter (2001) Carpenter, J. M. 2001, AJ, 121, 2851
- Catchpole et al. (2016) Catchpole, R. M., Whitelock, P. A., Feast, M. W. et al. 2016, MNRAS, 455, 2216
- Crause et al. (2016) Crause, L. A., Carter, D., Daniels, A. et al. 2016, Proc. SPIE, 9908, id. 990827
- Green & Margon (1994) Green, P. J., & Margon, B. 1994, ApJ, 423, 723
- Ishihara et al. (2010) Ishihara, Onaka, T., Kataza, H. et al. 2010, A&A, 514, A1
- Ishihara et al. (2011) Ishihara, D. , Kaneda, H., Onaka, T. et al. 2011, A&A, 534, A79
- Ita et al. (2010) Ita, Y., Matsuura, M., Ishihara, D. et al. 2010, A&A, 514, A2
- Izzard et al. (2007) Izzar,d R. G., Jeffery, C. S., & Lattanzio, J. 2007, A&A, 470, 661
- Lançon & Wood (2000) Lançon, A., & Wood, P. R. 2000, A&AS, 146, 217
- Marigo et al. (2008) Marigo, P., Girardi, L., Bressan, A. et al. 2008, A&A, 482, 883
- Matsunaga et al. (2017) Matsunaga, N., Menzies, J. W., Feast, M. W. et al. 2017, MNRAS, 469, 4949
- McClure & Woodsworth (1990) McClure, R. D., & Woodsworth, A. W. 1990, ApJ, 352, 709
- Miszalski et al. (2013) Miszalski, B., Mikołajewska, J., & Udalski, A. 2013, MNRAS, 432, 3186
- Mouhcine & Lançon (2003) Mouhcine, M., & Lançon, A. 2003, MNRAS, 338, 572
- Ng (1997) Ng, Y. K. 1997, A&A, 328, 211
- Onaka et al. (2007) Onaka, T., Matsuhara, H., Wada, T. et al. 2007, PASJ, 59, S401
- Skrutskie et al. (2006) Skrutskie, M. F., Cutri, R. M., Stiening, R. et al. 2006, AJ, 131, 1163
- Sloan et al. (2003) Sloan, G. C., Kraemer, K. E., Price, S. D. et al. 2003, ApJS, 147, 379
- Soszyński et al. (2013) Soszyński, I., Udalski, A., Szymański, M. K. et al. 2013, AcA, 63, 21
- Tyson & Rich (1991) Tyson, N. D., & Rich, R. M. 1991, ApJ, 367, 547
- Whitelock (1993) Whitelock, P. A. 1993, IAUS, 153, 39
- Whitelock et al. (2008) Whitelock, P. A., Feast, M. W., & van Leeuwen, F. 2008, MNRAS, 386, 313
- Whitelock (2013) Whitelock, P. A. 2013, IAUS, 289, 209