∎
2 Dipartimento di Fisica, Universitá di Roma Tor Vergata, Via della Ricerca Scientifica 1, I-00133 Rome, Italy
3 INAF–Oservatorio Astronomico di Roma, Via Frascati 33, 00078 Monte Porzio Catone, Italy
4 Key Laboratory for Optical Astronomy, National Astronomical Observatories, Chinese Academy of Sciences, 20A Datun Road, Chaoyang District, Beijing 100012, China
5 Kavli Institute for Astronomy & Astrophysics and Department of Astronomy, Peking University, Yi He Yuan Lu 5, Hai Dian District, Beijing 100871, China
6 Department of Physics and Astronomy, Macquarie University, Balaclava Road, North Ryde, NSW 2109, Australia
7 International Space Science Institute, Beijing, 1 Nanertiao, Zhongguancun, Hai Dian District, Beijing 100190, China
8 Max-Planck Institute for Astronomy, Königstuhl 17, D-69117, Heidelberg, Germany
9 Miyagi University of Education, Aoba-ku, Sendai, Miyagi 980-0845, Japan
Impact of distance determinations on Galactic structure. I. Young and intermediate-age tracers
Abstract
Here we discuss impacts of distance determinations on the Galactic disk traced by relatively young objects. The Galactic disk, 40 kpc in diameter, is a cross-road of studies on the methods of measuring distances, interstellar extinction, evolution of galaxies, and other subjects of interest in astronomy. A proper treatment of interstellar extinction is, for example, crucial for estimating distances to stars in the disk outside the small range of the solar neighborhood. We’ll review the current status of relevant studies and discuss some new approaches to the extinction law. When the extinction law is reasonably constrained, distance indicators found in today and future surveys are telling us stellar distribution and more throughout the Galactic disk. Among several useful distance indicators, the focus of this review is Cepheids and open clusters (especially contact binaries in clusters). These tracers are particularly useful for addressing the metallicity gradient of the Galactic disk, an important feature for which comparison between observations and theoretical models can reveal the evolutionary of the disk.
Keywords:
Stars: variables Cepheids: distance scale1 Introduction
Understanding the Galaxy is important not only because it hosts our Solar system but also because we can investigate stellar populations and interstellar components in greater detail than in any other galaxies, and the Galaxy can be a benchmark for galaxy evolution. Recent large surveys of stellar populations in various regions of the Galaxy have been revolutionizing the study of its structure and evolution (e.g. Ivezić et al., 2012; Bland-Hawthorn and Gerhard, 2016). In addition to many exciting results on the halo, large-scale photometric and spectroscopic surveys also make it possible to test chemodynamical models of the disk with various physical processes like radial migration (e.g. Schönrich and Binney, 2009; Casagrande et al., 2011; Haywood et al., 2013). Radial migration is the mixing process induced by the non-axisymmetric potential of the Galaxy, which brings outwards the metal-rich objects formed in the inner disk and vice-versa (Sellwood and Binney, 2002; Grand et al., 2015). We need stellar tracers whose distances can be well measured over the large volume of the disk to study such a large-scale phenomenon. In this context, classical Cepheids and open clusters are useful distance indicators in order to trace the young stellar components of the disk. In particular, classical Cepheids and contact binaries found in open clusters are useful as we will see below. These objects are predominantly found in the disk.
1.1 Classical Cepheids
In this review, we focus on classical Cepheids, not type II Cepheids which are similar pulsating stars but belong to old stellar populations (Sandage and Tammann, 2006; Beaton et al., 2018). Classical Cepheids (hereinafter simply called Cepheids) are pulsating stars of 4–10 M⊙, which show well-defined relations between their intrinsic luminosity and the pulsation period. Such period–luminosity (PL) relations make them fundamental calibrators of the extragalactic distance scale (see the review by Subramanian et al., 2017). Besides this important role, Cepheids also have a number of properties that make them ideal probes of both the structure and the recent history of the Galaxy. In fact, Cepheids are luminous stars that can be seen to great distances even through the substantial interstellar extinction along the lines of sight. In addition to the distances, the ages of individual Cepheids can be determined on the basis of their periods (Bono et al., 2005). They are young stars (10–200 Myr), comparable with the characteristic dynamical time-scale or the orbital period (240 Myr at the solar location if one assumes the IAU recommended values of the Sun–Galactic Center distance kpc and the rotation speed km s-1) of the Galactic disk, thus they are still relatively close to the place where they were born as far as the distances from the Galactic Center (henceforth the GC) and to neighboring objects are concerned. These make the Cepheids ideal tracers for studying dynamical evolution of the young components like spiral arms (see e.g. Baba et al, 2018; Kawata et al, 2018). Furthermore, they are good chemical tracers. Their effective temperatures ( K) are relatively low when compared to similarly young stars, and allow us to measure many metallic lines in their spectra giving access to precise abundances of many different elements (e.g. Lemasle et al., 2013; da Silva et al., 2016).
1.2 Open clusters
Open clusters are aggregates of hundreds to tens of thousands of stars, all born together. Their members have similar ages, metallicities, and distances to us, which means that they usually show obvious main sequences in the Hertzsprung–Russell diagram. Based on the main sequence of a cluster, a unique theoretical isochrone can be identified to describe the evolutionary details of stars with different masses. In contrast to the Galactic globular clusters which are predominantly old, the ages of open clusters range from very young (a few Myr) to rather old (a few Gyr), and they are mostly located in the disk. Since their distances can be determined based on main-sequence or isochrone fitting, open clusters represent important tools to trace young structures such as spiral arms (see, e.g. Dias and Lépine, 2005; Carraro, 2014). Combining the proper motions, radial velocities, and metallicity information, open clusters can be used to study the kinematics and evolution of the young components of the Galaxy.
Furthermore, studies of variable stars in open clusters are interesting. In addition to Cepheids and other pulsating stars, eclipsing contact binaries are another type of variable often found in open clusters. One can expect PL (or PLC) relations for contact binaries (see §4.2), and recent studies actually found relatively tight relations, especially in the near-IR (Chen et al., 2016a). Such distance indicators, combined with the isochrone fitting method, can provide mutual verification of distance scales.
1.3 Other young tracers
There are a few other young and intermediate-age tracers which are useful to study Galactic structure.
-
•
Massive star-forming regions often host methanol (CH3OH) masers which enable us to measure the trigonometric parallaxes of the star-forming regions with VLBI (Very Long Baseline Interferometry) facilities (Reid et al., 2009; Honma et al., 2012; Reid and Honma, 2014). The high accuracy of VLBI measurements, in the best cases better than 10 as (e.g. Zhang et al., 2013; Sanna et al, 2017), allows us to map this youngest population over a large volume of the disk.
-
•
Long-period variables (LPVs hereinafter) include evolved asymptotic giant branch (AGB) stars with a wide range of ages between 100 Myr and over 10 Gyr. The lower limit to their ages, or the upper limit to the initial mass with which a star evolves into an AGB star, instead of a red supergiant, is unclear. LPVs (or also called Miras) obey PL relations and thus serve as distance indicators (Whitelock et al., 2008; Subramanian et al., 2017). Their high luminosities, especially in the infrared (hereinafter IR), make them useful tracers of the Galaxy’s structure. Some of them also show radio maser emission lines which are useful to study the kinematics of the Galaxy. In particular, a group of relatively massive LPVs (3–5 , age Gyr) are often called OH/IR stars because they have OH masers and are very bright in the IR. They have provided us with good insights, for example, into the inner part of the Galactic disk (Lindqvist et al., 1992; Sevenster et al., 2000).
-
•
Red clump (RC) giants are also useful tracers of stellar populations and very widely used for studying Galactic structure. They are core-helium-burning stars found spanning a wide range of ages from hundreds of Myr to 10 Gyr. Note that they are found as a clump in the color-magnitude diagram or in a luminosity function so that they can be identified only if a sizeable number of such stars in stellar population(s) are present. The specific frequency of the core-helium-burning stars, the number per unit stellar mass of the population, is maximum around 1 Gyr (Salaris and Girardi, 2002). Taking the total mass of stars at different ages into account, however, the age distribution of the RC stars tends to be extended unless the star formation history is represented by a sharp peak. The brightness of the clump depends on the age and metallicity, but the dependency is mild against the rather wide range of their ages, 1.5–10 Gyr (Salaris and Girardi, 2002). The error of distance estimation caused by the age distribution of stars tends to be averaged out, which is an advantage in estimating distances to systems with various stellar populations mixed, but makes it hard to separate RCs formed by stars with different ages. These complicate the use of the RC for studying the distribution of stars at a specific age in the Galaxy.
These objects are not discussed in the rest of the review. On massive star-forming regions, readers are referred to Reid et al. (2014, and references therein). On LPVs and RC giants, Subramanian et al. (2017) discuss their characteristics and applications. Some other kinds of young stars are also investigated as distance indicators, e.g. blue supergiants (Kudritzki et al, 2003, 2008) and red supergiants (Yang and Jiang, 2012). In the following we focus on Cepheids and open clusters. We can measure the individual distances to these objects based on optical to IR photometric data, which is important for characterizing the interstellar extinction that shows very patchy patterns on the sky.
1.4 The goal of this review
The purpose of this review is to discuss the impact of distance determinations of Cepheids and open clusters (Cepheids and contact binaries in the clusters, in particular) for revealing the structure and evolution of the disk, which is a relatively unexplored frontier of Galactic archeology mainly because many previous surveys in the optical wavelengths were seriously affected by interstellar extinction.
After their birth, stars in the Galaxy change their orbits through secular evolution processes, but their chemical abundances remain almost unaltered from their compositions at birth (except for a few elements that may be affected by stellar evolution processes; for Cepheids, e.g., see Takeda et al. 2013). This motivates the science of Galactic archeology, a recently emerging field in astronomy which aims at studying the imprints of chemodynamical evolution from the chemistry and kinematics of a large number of stars. In fact, we are now experiencing a quantum jump both in the wealth and in the quality of available information for billions of stars in the Galaxy thanks to the efforts of dedicated spectroscopic surveys (e.g APOGEE, GALAH, LAMOST, Gaia-ESO, and in the future 4MOST), capable of obtaining detailed chemical compositions, and to some extent distances and ages, of individual evolved stars (e.g. RC giants, 1–10 Gyr, and red giant branch stars, 10–13 Gyr) throughout the entire Galactic disk.
However, a similarly detailed map of the interstellar gas and young stars is still lacking. While we can obtain abundances of only a few elements (e.g. oxygen and nitrogen) for interstellar gas, we can measure the detailed abundance for the young stars, which should still reflect the composition of their birth material. A critical observable feature for investigating the large-scale disk evolution is the metallicity gradient, i.e. metallicity distribution as a function of Galactocentric distance (). In fact, an inside-out formation scenario for the Galactic disk will produce metal-rich stars in the inner part and metal-poor ones in the outer part of the Galactic disk (e.g. Tsujimoto et al., 1995; Chiappini et al., 2001, and references therein). Such a trend observed in interstellar gas and youngest stars reflects the present-epoch and recent chemical structure of the disk, and the time-dependent trend traced in stars with various ages can tell us the chemical structure in the past and the evolution of the disk. However, observational reconstruction of the metallicity gradient as a function of time is challenging, at least, for the following two reasons: (1) Good tracers with accurate estimates of distance, age, and metallicity need to be found and well characterized. (2) The interstellar extinction hampers accurate distance determination and detailed observations of tracers spread across the disk. Young tracers like Cepheids and open clusters embedded in the Galactic disk, and those at large distances, several kpc or more distant, are severely affected by extinction as we will see below.
In this review, we will summarize up-to-date observational results and current problems about the interstellar extinction in §2. Then, recent developments of the distance measurements and some important problems are discussed for Cepheids in the Galactic disk (§3), Cepheids in open clusters (§4.1), and contact binaries in open clusters (§4.2). Then, in §5, we discuss how the distance determination and the characterization of the interstellar extinction are important to study the metallicity gradient. Section 6 summarizes the review.
2 The Interstellar Extinction Law
A detailed understanding of the interstellar extinction law, or the wavelength dependence of the interstellar extinction, is crucial to most aspects of observational astronomy. Dust grains attenuate the light from an object seen through them, and the amount of attenuation depends on wavelength and the lines of sight. Equations that fit the observed wavelength dependence of the extinction are required to test dust grain models and to predict the amount of extinction in certain spectral regions.
A large impact of the extinction law on Galactic structure can be highlighted by comparing the classical law in Cardelli et al. (1989), for example, with those derived in recent studies. Nishiyama et al (2008) reported an extinction ratio of , a factor of 1.9 larger than the value of in Cardelli et al. (1989) for . Considering the column density toward the GC obtained in X-ray observations (Porquet et al, 2008), Fritz et al. (2011) derived a lower limit of . The difference between the new results and previous ones (Rieke and Lebofsky, 1985; Cardelli et al., 1989) can be clearly seen in Fig. 8 in Fritz et al. (2011). In addition, a recent study by Hosek et al (2018) claims that even Nishiyama et al (2008) underestimated the optical-to-near IR extinction ratio. These results suggest that when we use the classical extinction law where it is not appropriate, the amount of extinction may be associated with an error of more than 50 %.
In this section, we review the extinction law in wavelength order: the ultra-violet (UV) and optical range (§2.1), the near IR (§2.2), and the mid IR (§2.3). In the UV and optical wavelengths, the difference of the interstellar extinction law among various lines of sight was already known in early studies (e.g. Johnson and Morgan, 1955; Johnson and Borgman, 1963; Nandy, 1965). For several decades, in contrast, the extinction law in the near- and mid-IR wavelengths was believed to show a very little, if any, variation from one line of sight to another. The “universality” of the IR extinction law implies that the dust grains responsible for the near- and mid-IR extinction have almost the same size distributions along all sightlines. In addition, the IR extinction was thought to follow a power law of from 1 m to m in early studies (e.g. Draine, 1989). Some recent results, however, suggest that the IR extinction law is not so simple as we will see in this section, while there are still results supporting the “universality” of the IR extinction law (§6).
2.1 The interstellar extinction law: UV and optical
Johnson and Borgman (1963) found a variation of the ratio of the total-to-selective extinction in the and bands, from 3.1 to 7.4. Bless and Savage (1972) examined the extinction law from the UV to the near-IR for bright early-type stars, and clearly demonstrated large variations of the extinction law. The parameter depends on the dust properties along the lines of sight. Large grains produce gray extinction, i.e., small wavelength dependence, leading to large .
In spite of such large variations of the UV/optical extinction law, Cardelli et al. (1989) suggested that the variation of the extinction law at UV–optical wavelengths can be described by a functional form with only one parameter, . Their suggestion was based on the fact that there is a good linear correlation between and () over an entire range of wavelengths from the UV to the near-IR. Cardelli et al. (1989) provided the -dependent coefficients, and , from the UV to the near-IR, which allows us to calculate if the value of is known for the sight line.
The one-parameter extinction law was welcomed by the astronomical community. This makes it easier to correct the amount of extinction not only in the commonly used photometric bands actually measured by Cardelli et al. (1989) but for any band or wavelength. However, Fitzpatrick and Massa (2007) pointed out that the correlation found by Cardelli et al. (1989) is “partially illusory”, and the extinction law is not a one-parameter function. The functional form of Cardelli et al. (1989) was proposed because of a good correlation between and . However, was determined based on the color-excess ratio and as
Since is used to calculate , some degree of apparent correlation is expected between and in any case.
More than 300 curves for the extinction law from UV to optical wavelengths were obtained for different objects by Fitzpatrick and Massa (2007). The curves range from nearly gray to strongly -dependent. Fitzpatrick and Massa (2007) concluded that there is no functional relationship between and the UV extinction law, and that the UV extinction cannot be represented by only a single parameter. It is possible to derive a typical or average extinction law; however, any mean curve is subject to a bias caused by the selection of sample used for producing the curve. Hence their conclusion is that there is no unique or best estimate of the mean extinction law in our Galaxy, at least, at UV–optical wavelengths.
2.2 The interstellar extinction law: near-IR
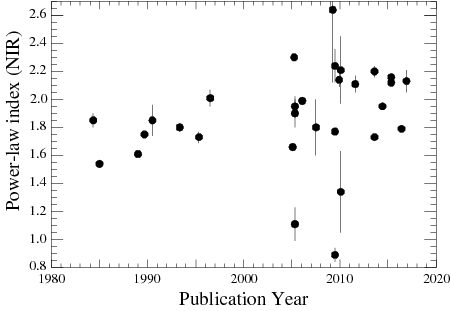
It has been considered that the near-IR extinction law can be approximated by the power-law form, . Fig. 1 shows the power-law index as a function of publication year since 1984. Before , many studies had converged to the IR extinction law that is nearly constant and universal (with ). However, steeper extinction law has been derived in many recent works, e.g. for stars behind translucent clouds at high Galactic latitude (Larson and Whittet, 2005), 1.9 for late-type stars with SiO maser emission (Messineo et al., 2005), 1.99 toward the GC (Nishiyama et al., 2006).
A simple comparison of the extinction law in different lines of sight can be done by using reddening vectors in color-color diagrams. To determine slopes of reddening vectors precisely, Kenyon et al. (1998) introduced a reddening probability function, in which the distribution of strongly reddened stars in a color-color diagram is compared with those of stars in a reference (off-cloud) field. The derived slopes are for the Ophiuchi dark cloud (Kenyon et al., 1998), for the Chameleon I cloud (Gómez and Kenyon, 2001), and for Coalsack Globule 2 (Racca et al., 2002). Using the same technique but different telescopes and instruments, Naoi et al. (2006, 2007) also obtained a steeper reddening slope in toward Coalsack Globule 2 than in other dark clouds. In addition, they found a change in the reddening slope; smaller slopes are seen toward sightlines with larger optical depth. This trend had been implied by previous studies (e.g. Kenyon et al., 1998). These results suggest spatial variation of the near-IR extinction law, at least, from a line of sight to another.
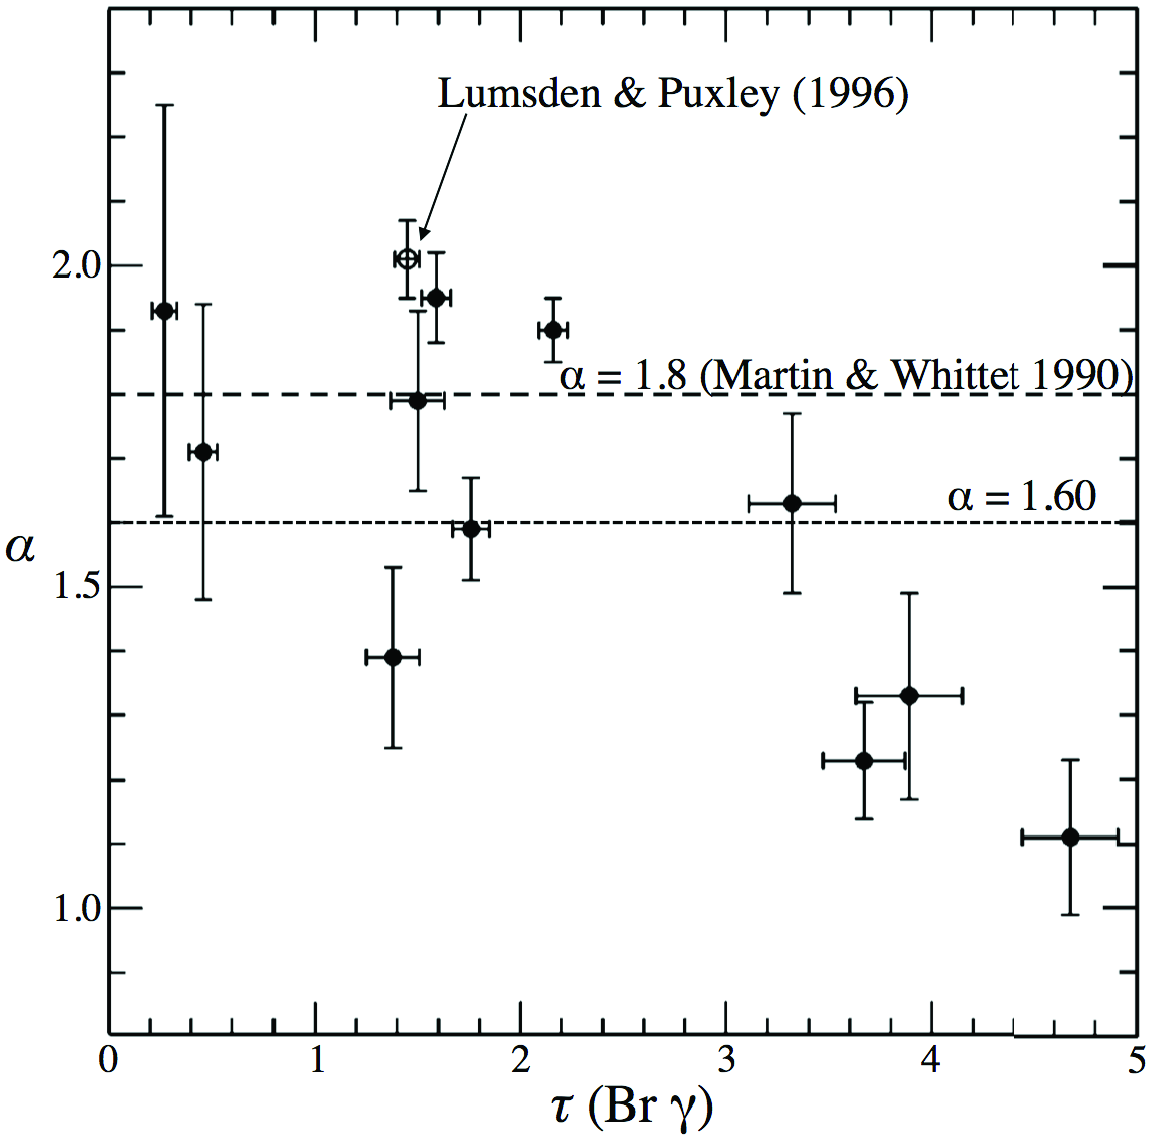
Spectroscopic studies of the near-IR extinction law for nine ultra compact H II regions and two planetary nebulae were carried out by Moore et al. (2005). The amounts of extinction for their target regions are larger than mag. They derived the power-law index by using hydrogen line ratios, and found that varies from 1.11 to 1.95, with a mean of 1.6, depending on (Br) as seen in (Fig. 2).
Fitzpatrick and Massa (2009) examined extinction law from UV to near-IR wavelengths for 14 early-type stars. They fit the extinction law in the form (their Equation 2)
When the three parameters, , , and are left free in the fits, varies from 0.89 to 2.24 (with a mean value of 1.77 and a typical uncertainty of 0.15). According to their conclusion, the extinction law from the band to the band is well represented by a simple power-law for each sightline, but varies significantly among 14 lines of sight, and there is no universal power-law index for the near-IR extinction law. They also found that depends on , being smaller for a larger . This trend is consistent with the dependency on (Br) found by Moore et al. (2005) because larger values are found toward lines of sight with strong extinction as mentioned above. Fitzpatrick and Massa (2009) also demonstrated that the extrapolations of the power-law fits from shorter wavelengths (0.6–0.95 m) are inconsistent with the near-IR () data points. Including data sets in the band or shorter wavelengths always lead to a smaller value. On the other hand, Fitzpatrick and Massa (2009) also investigated the form (their Equation 5)
to represent the extinction law with two free parameters, and . This is not a power-law, but it is successful in reproducing the extinction law in the optical wavelengths longer than the band, as well as in the near IR. They demonstrated that, unlike the UV case (Fitzpatrick and Massa, 2007), the optical–near IR extinction law may be well represented by a formula with only a few parameters (based on the data towards a limited number of sightlines), but establishing such a formula needs further investigation.
2.3 The interstellar extinction law: mid-IR
The mid-IR extinction law had been scarcely studied before the launch of Spitzer Space Telescope in 2003. Some earlier works (Landini et al., 1984; Rieke and Lebofsky, 1985; Martin and Whittet, 1990) suggested that a power-law extends from the near-IR to the and bands, whereas others (Lutz et al., 1996; Lutz, 1999) found shallower extinction law at m.
Precise and wide-field studies of the mid-IR extinction law had become very active with Spitzer. The mid-IR camera, InfraRed Array Camera (IRAC), can collect images in four bands ([3.6], [4.5], [5.8], and [8,0]), and deep mid-IR photometry for strongly obscured objects has become possible thanks to its high sensitivity. Indebetouw et al. (2005) pioneered in the extinction studies with the Spitzer. They observed the giant H II region RCW 49 and two lines of sight, and , and derived a flat extinction law at 3–8 m. A similar flat behavior has been supported by observations of various targets and regions: dark clouds and star forming regions (Flaherty et al., 2007; Román-Zúñiga et al., 2007; Cambrésy et al., 2011; Ascenso et al., 2013; Wang et al., 2013), the GC and Galactic bulge (Nishiyama et al., 2009; Chen et al., 2013), and different locations of Galactic plane (Gao et al., 2009; Xue et al., 2016).
The flattening of the extinction law for 3–8 m has also been confirmed by observations with other instruments. For example, Jiang et al. (2006) found values larger than suggested by the power-law extension. Schödel et al. (2010) found a clear change of the power-law index from the to bands toward the GC: inferred from data sets in and bands, and from those in and bands. Fritz et al. (2011) confirmed the flattening at m toward the GC, using 18 hydrogen emission lines at m. The extinction law obtained by Davenport et al. (2014) shows a spatial variation but also shows a flattening in the WISE (3.35 m) and (4.46 m) bands.
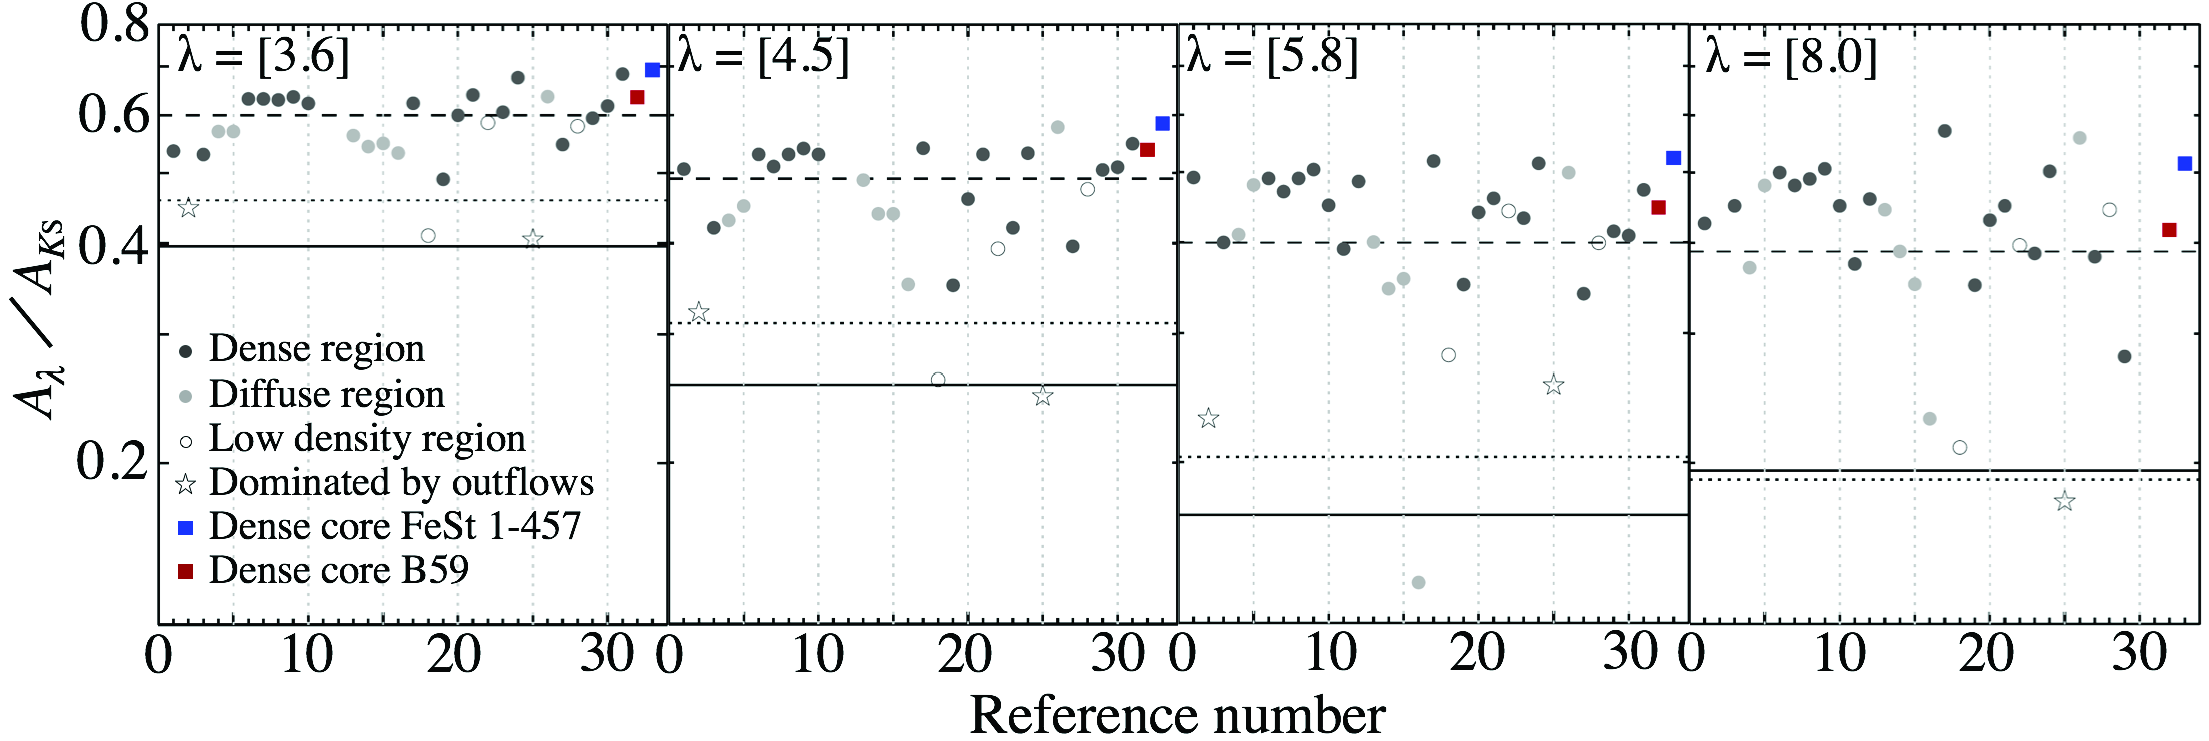
Ascenso et al. (2013) compiled the values for the mid-IR range from the literature between 1999 and 2013 (Fig. 3). Most of the studies use Spitzer/IRAC data sets, but those based on other data sets at similar wavelengths are also included (Bertoldi et al., 1999; Lutz, 1999; Fritz et al., 2011; Olofsson and Olofsson, 2011). If the mid-IR extinction law is an extension of the near-IR power-law, Fig. 3 should show a decrease of from the left to right panels (see the solid lines, , Draine 2003a, b). However, the change of from [3.6] to [8.0] is rather small. This together with the above results allows us to conclude that the extinction law at m is not a simple extrapolation of a power-law from shorter wavelengths and the extinction is most often larger than expected from the power-law.
A color-excess ratio at mid-IR wavelengths, , was investigated by Flaherty et al. (2007) for five star forming regions. They found that the ratio toward Ophiuchus, , is significantly smaller than those toward the other regions, which range from 2.49 to 2.61. This result strongly suggests variation of the mid-IR extinction law among dense star-forming regions.
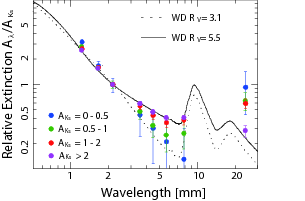
An interesting result for the variation of the mid-IR extinction law was obtained by Chapman et al. (2009, reference #18–21 in Fig. 3). They explored changes of the near-IR and mid-IR extinction laws in three molecular clouds, Ophiuchus, Perseus, and Serpens. They found that the extinction law tends to be flatter along lines of sight with stronger extinction (Fig. 4). For , the data points lie almost on top of the power-law extension from shorter wavelengths. On the other hand, the extinction laws become as flat as those found in other studies for .
Using red giants and RC giants, Gao et al. (2009) determined the color-excess ratios, and , for the four IRAC bands ( [3.6], [4.5], [5.8], [8.0]). By assuming and , they derived average values for 131 fields along the Galactic plane. The mean extinction ratio is consistent with the previous studies but shows a slightly flatter wavelength dependence. They also found a variation of along the Galactic plane. In the case of red giants, varies in the range from 0.07 to 0.16 for the four bands, with a typical uncertainty of 0.001. They also suggest systematic variations of with Galactic longitude. seems to be smaller at around the Galactic longitudes corresponding to the tangent positions of spiral arms, which can be explained by grain growth in the arms.
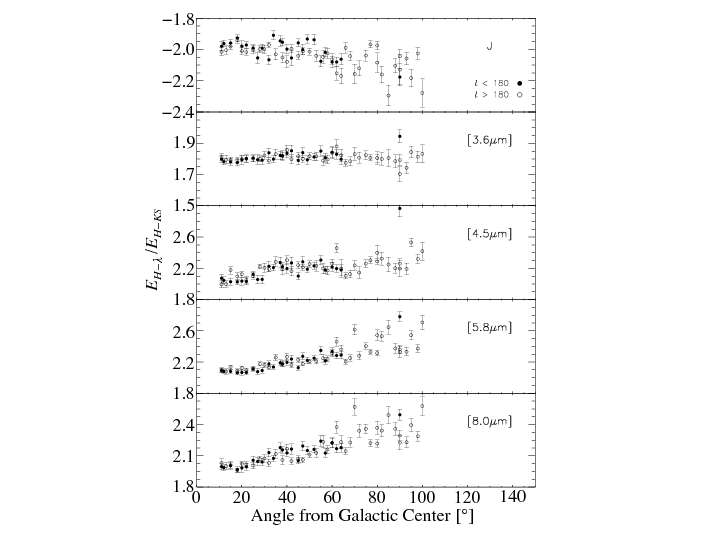
Zasowski et al. (2009) showed that color-excess ratios vary as a function of Galactic longitude. They used RC giants as tracers of extinction, along the Galactic plane () in the first (), and the third to fourth quadrants (). Fig. 5 plots the observed color-excess ratios, . Here the color-excess ratios are not converted to the ratio of the amount of extinction, such as , allowing us to compare the extinction law without uncertainties from either the extinction ratio or the ratio of total-to-selective extinction. It is shown that the wavelength dependence of the extinction gets steeper with increasing Galactic longitude, while the ratio is nearly constant. The trend of the ratios looks identical between positive and negative Galactic longitudes.
The mid-IR extinction law has been found to be flatter in denser molecular cloud regions (e.g. Chapman et al., 2009; McClure, 2009). The flattening can be interpreted as a result of grain growth from either the coagulation of grains or the accumulation of refractory ice mantles. The steeper extinction law found by Zasowski et al. (2009) for larger angles from the GC indicates a steady decrease of the mean dust grain size in the outer Galaxy.
Chen et al. (2013) investigated the variation of the extinction ratio for the four Spitzer/IRAC bands. They combined the IRAC data with GLIMPSE-II and VVV data sets for the Galactic bulge, and . Their main purpose was to construct a 3D extinction map by comparing observed photometric data (2MASS, VVV, GLIMPSE) with the Besançcon Galactic model. Since they made extinction maps using a color excess , they can derive the ratio of the extinction, , using the color-excess ratios, when the near-IR ratio is assumed. They found variations in , and the variations show similar behaviors in all the IRAC bands. As a function of Galactic latitude, there is a strong peak toward the Galactic plane. This suggests a stronger variation of along the Galactic latitude than along the Galactic longitude within their target region toward the bulge. The strongest variation is found at 5.8 m, while the variation at 8.0 m is less pronounced. The extinction at around 5.8 m appears as continuum extinction. The extinction at around 8.0 m, in contrast, is largely attributed to the 9.7 m silicate absorption feature. The smaller variation of the extinction at the latter wavelength suggests that the ratio of the silicate absorption to the total extinction does not vary so much along the Galactic latitude.
Note that results on the variations in the ratio of the amount of extinctions, such as at mid-IR wavelengths, may depend not only on the mid-IR extinction law itself but also on the variation in the near-IR extinction law. In many cases, what we can determine directly from observations is a color-excess ratio, e.g. . Such a ratio can be translated into as
We thus need either a ratio of the amount of extinction (in this case, ) or the ratio of the total-to-selective extinction (). These values are, however, usually difficult to determine directly from observations. As shown in Fig. 10 in Nishiyama et al. (2009), the variation of the ratio of the amount of extinction at mid-IR wavelengths, , may be attributed to differences in the near-IR law, . Using color-excess ratios allows one to investigate the extinction law without obtaining or assuming the ratios with amount(s) of extinction involved (e.g. and ) as demonstrated, e.g. by Zasowski et al. (2009). The color-excess ratios depend much less on the filter wavelength than the power-law index. Some observational approaches in which parameters like are directly measured will be discussed in §6.
It should be borne in mind that the mid-IR wavelength region contains various emission and absorption features. The most prominent one is the 9.7 m silicate absorption feature. When we observe the line of sight toward the GC, absorption features such as H2O, CO2, NH3, and CH4 are seen from 3 to 8 m (Chiar et al, 2000), which are in the range of the Spitzer/IRAC bands. The mid-IR hosts the Polycyclic Aromatic Hydrocarbon (PAH) emission features in the range of 3–20 m. For wavelengths longer than 8 m, the extinction may also be underestimated because of the possible presence of dust emission. The late-type giants may have thin shell(s) of silicate dust, and they may exhibit the 9.7 m silicate emission. In addition, the observation could be affected by dust thermal emission. Although the extinction is near a minimum in the wavelength range of 3–8 m, it is necessary to take into consideration the potential impact of the emission and absorption features described above when we try to derive the mid-IR extinction law.
In summary, the extinction law in the mid-IR is still less well established compared to that at optical and the near-IR mainly because the opportunities of obtaining precise photometric measurements are limited. However, the extinction at 3–4 m is about half of that in the band, and therefore the effects of the remaining uncertainties can be also small. This encourages one to further investigate the extinction law in the mid-IR and applications to various tracers.
3 Cepheids in the Galactic Disk
Cepheids have already played a prominent role in our understanding of the Galactic disk’s structure and evolution: their three-dimensional distribution in the disk delineates the spiral pattern (Joy, 1939; Majaess et al., 2009; Dambis et al., 2015); their kinematics provides firm estimates of the Oort constants (Kovacs et al., 1990; Metzger et al., 1991; Feast and Whitelock, 1997; Pont et al., 1997; Metzger et al., 1998), while their chemical abundances can be used for accurate measurements of the radial abundance gradient across the disk (Genovali et al., 2014, 2015; Andrievsky et al., 2016; da Silva et al., 2016).
The sample of known Cepheids in the Galaxy is not only limited (600) but also strongly biased. Over 10,000 Cepheids are expected to populate the Galaxy (Windmark et al., 2011), but only 5 % (predominately nearby ones) have been identified so far. The currently known Cepheids are concentrated mostly within a few kpc around the Sun since they have been discovered based on optical surveys which are hampered by the high interstellar extinction toward the Galactic plane. Moreover, such surveys were performed by using different instruments and photometric techniques, producing strongly inhomogeneous data sets which can be hardly merged for a statistically coherent analysis.
Fortunately, the Cepheid sample is improving rapidly, especially thanks to the ongoing effort from large-sky time-domain surveys. Near-IR variability surveys have produced small catalogs to date, but they have discovered Cepheids in the most obscured regions of the Galaxy, challenging the current observational bias. In particular, near-IR surveys using the Infrared Survey Facility (IRSF) in South Africa toward the Galactic plane led to the discovery of four new Cepheids in the Nuclear Stellar Disk (Matsunaga et al., 2011, 2015), three at 3–5 kpc from the GC (Tanioka et al., 2017), 13 beyond the GC (Matsunaga et al., 2016), and five parallel to the Galactic central bar (Inno et al. in prep). Near-IR data collected by the ESO public survey VVV (Minniti et al., 2010) have also been used to discover 37 Cepheids located beyond the GC (Dékány et al., 2015a, b). With optical surveys, on the other hand, the Optical Gravitational Lensing Experiment (OGLE) has recently announced the discovery of 2,000 Cepheids found in the Southern disk (Udalski, 2017) in addition to new Cepheids in less obscured regions toward the Galactic bulge (Soszyński et al., 2017). The Pan-STARRS1 3 survey in bands also has a great potential for identifying a large number of new Cepheids in the northern hemisphere and the exploitation of its data set is pioneering for future all-sky photometric surveys (e.g. LSST). In the near future, Gaia will allow us to discover a large number of Cepheids and other variables across the sky. Its limiting magnitude is deep enough to detect Cepheids to some distances, roughly a few kpc toward the inner Galaxy and more in the outer Galaxy, even in reddened regions of the Galactic disk, although it cannot reach the GC and beyond (Windmark et al., 2011).
While these surveys are widening the census of Galactic Cepheids, they (even the Gaia’s all-sky survey) are still characterized by unknown selection functions, given the uncertainty in the extinction throughout the Galactic disk and the different cuts in RA, Dec, magnitudes etc. For example, Matsunaga et al. (2016) discussed a gap between the optical and IR surveys toward the bulge. Moreover, the interstellar extinction not only limits the completeness of Cepheid surveys but also introduces large uncertainties on the Cepheids’ distances. A relatively small error in the extinction law can lead to significant errors in distances to Cepheids in obscured regions even when IR data are used for distance estimation. A good example of such a problem is found by Matsunaga et al. (2016) who discussed conflicting estimates for distances to new Cepheids, which are more distant than the GC, in their survey and to Cepheids reported by Dékány et al. (2015b). Readers are also referred to Matsunaga (2017) about these Cepheids as well as general discussions on the effects of interstellar extinction in the context of variable stars in the disk.
Although Matsunaga et al. (2016) found that the extinction law toward the bulge should be close to the one obtained by Nishiyama et al. (2006, cf. ), the situation may be different for the Galactic disk due to the spatial variation as we discussed in §2. Such a spatial variation creates a very challenging problem for drawing a map across a wide range of the disk. For example, Tanioka et al. (2017) considered a large range of values, from 1.44 (Nishiyama et al., 2006) to 1.83 (Cardelli et al., 1989), toward the inner disk, and . This large uncertainty in the extinction law prevented them from obtaining an accurate distance to moderately obscured Cepheids; the error in the distance modulus is as large as 0.8 mag with mag. Such large errors limit the use of Cepheids, and of any other tracers whose distances are obtained based on photometric data, to draw a map of stellar distribution in the disk. The characterization of the extinction law is an urgent task to exploit the outcomes of the ongoing large-scale surveys. Combining more multi-band magnitudes including mid-IR ones (partly done in Tanioka et al. 2017 using 3.6 m data) would reduce such errors once the extinction coefficients in the mid-IR bands are investigated as well as in the near-IR bands.
4 Open Clusters
A collection of 2,167 open clusters with relatively reliable parameters is found in Dias et al. (2002, see the version updated in January 2016), which encompasses an update to the previously published catalogs of Lyngå and Palous (1987) and Mermilliod (1995). Kharchenko et al. (2013) derived open cluster parameters for 3,007 clusters based on 2MASS photometry and PPMXL proper motions. The samples contained in both of these catalogs are complete out to 1.8 kpc. With new near-IR data, such as the VVV’s, hundreds of open clusters that are more distant and heavily obscured have been found (Borissova et al., 2011; Barbá et al., 2015).
Since open clusters can provide valuable information on age, distance, and extinction based on the isochrone fitting, they can serve as vital probes of the Galactic disk. Interesting results of such applications are found in various papers from long ago to very recent (Reddy et al., 2016, and references therein). In the past few years, a number of clusters containing red supergiants have been found in the interface of the Galactic (long) bar and the inner disk (e.g. Davies et al., 2009, 2012). The formation of these clusters are suggested to be triggered by the interaction between the bar and the disk. Characterizing the parameters of the clusters is, however, quite expensive. Although we already have a large number of samples which are ready to draw a comprehensive picture of the Galactic structure in the solar neighborhood (Joshi, 2005; Joshi et al., 2016), samples beyond several kpc are still being discovered and a continuous effort needs to be made as to follow-up observations. An outstanding effort in the spectroscopic approach is, for example, done by the Gaia-ESO survey (Magrini et al., 2017), whose samples are still rather limited compared to the potential sample size of open clusters. In this review, we focus on Cepheids and contact binaries in open clusters, these two kinds of stellar tracers can give distances by themselves and those in the clusters are useful for establishing the distance scales (e.g. mutual calibration of different distance indicators).
4.1 Cepheids in open clusters
The method of estimating distances to open clusters based on the main-sequence fitting also provides us with an opportunity to calibrate (or cross-validate) the PL relations of Cepheids. Since the first Cepheids were found in the open clusters NGC 6087 and M 25 by Irwin (1955), many researchers have contributed to this field (e.g. van den Bergh, 1957; Tsarevsky et al., 1966; Turner, 1986; Turner et al., 1993; Turner, 2010; Baumgardt et al., 2000; Hoyle et al., 2003; Tammann et al., 2003; An et al., 2007; Majaess et al., 2008). In particular, Tammann et al. (2003) derived -band Cepheid PL relations based on 25 cluster Cepheids, whereas Anderson et al. (2013) identified five new cluster Cepheids based on an eight-dimensional parameter search and obtained a -band PL relation for 18 cluster Cepheids; the membership confidence is evaluated for each open cluster–Cepheid pair based on spatial position (two-dimensional angular distance and parallax), kinematics (radial velocity and two-dimensional proper motion), and population (age and metallicity). Recently, Chen et al. (2015, 2017) found nine new cluster Cepheids based on the near-IR 2MASS and VVV catalogs. To date, approximately 40 cluster Cepheids have been found and confirmed, of which 30 can be used to derive PL relations in various photometric filters. In the last decade, more and more attention has been paid to the near-IR or even to mid-IR PL relations, since at these longer wavelengths, the PL relations have much smaller intrinsic scatter and are less affected by interstellar extinction. Based on 31 cluster Cepheids, Chen et al. (2015, 2017) derived new PL relations, which represented improvements of up to 40 % compared with previous determinations. These relations were used by Wang et al. (2017) to derive mid-IR PL relations of hundreds of Galactic Cepheids.
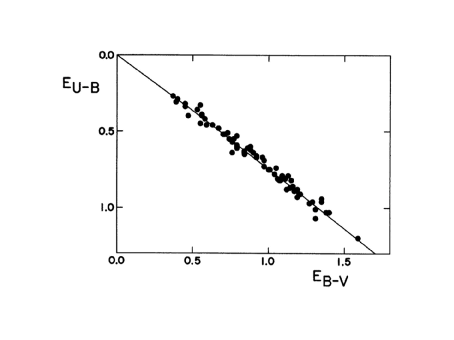
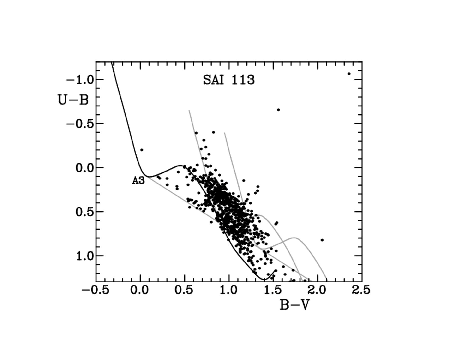
As already discussed in §3, the uncertainty in the extinction law has a large impact on distances to objects obscured by severe interstellar extinction. Here, open clusters can play an important role in disentangling this problem; they can provide an independent reddening value as well as a distance. Once the spectral types of cluster members are obtained, their color excesses can be estimated based on the difference between apparent and intrinsic colors. Based on two or more color-excess values, a more accurate extinction ratio can be estimated for stars within each particular cluster. If spectroscopic observations of most clusters are difficult to obtain, the optimal reddening value can instead be evaluated based on application of the isochrone fitting method. Turner (1989) used photometry of six open clusters or associations to study the reddening relation, . He found that the second-order term is almost negligible, and that ranges from 0.62 to 0.80. This method allows one to estimate the reddening ratio for each open cluster independently based on detailed analysis of its cluster members. Fig. 6 shows the reddening relation derived for early-type stars in the clusters NGC 6611 and Sgr OB1. Fig. 7 presents another example which can be used to derive the reddening ratio based on the color–color diagram. The color–color diagram also shows a ‘kink’ feature as the color–color diagram (Turner, 2011) , so this is a potential approach for investigating variations in the near-IR extinction law. Turner (2011) provided an empirical magnitudes and colors of ZAMS in his Table 1, and applied them to five open clusters. Chen et al. (2015) also used the color–color diagram to study the near-IR extinction for 17 open clusters. Most of previously studied clusters have relatively small color excesses, e.g. in Chen et al. (2015). This limits the ability to constrain the extinction law. Hopefully, with new near-IR instruments and projects such as the VVV survey, more heavily reddened open clusters can be found and investigated. More individual near-IR extinction laws for individual open clusters may be obtained in the next few years.
A particularly interesting cluster in our context is VdBH 222 in which a long-period Cepheid ( days) was reported by Clark et al. (2015). Prior to their work, two possible kinematic distances were suggested by Marco et al. (2014), 6 kpc and 10 kpc, based on the radial velocity of the cluster, but they suggested that the distance of 10 kpc is more consistent with Galactic structure. As regards the age of VdBH 222 (based on the isochrone fitting), the distance of 10 kpc would suggest 14 Myr, while the distance of 6 kpc corresponds to 20 Myr. The Cepheid provides two constraints, an independent and direct distance to the cluster and a constraint on its age. Based on the Cepheid PL relation and the best-fitting reddening value from Marco et al. (2014), a distance of kpc was estimated, while an age of Myr was determined by adoption of the Cepheid period–age relation of Bono et al. (2005). This Cepheid is thus consistent with a comparably high isochrone age and a small distance. The distance of 6 kpc places VdBH 222 in the 3-kpc inner arm, which was unexpected since star formation was considered to be suppressed in this arm (see the discussions in Clark et al., 2015). The properties of VdBH 222 also suggest that of stars have been formed in the last 20 Myr, which provides further evidence of active star formation at the interface of the bar and the disk. As regards the problem on the extinction law, the color excess of the cluster, , is larger than those of other clusters investigated so far. This would allow us to give a more tight constraint on the extinction law, although such a study has not been done.
4.2 Contact binaries in open clusters
For contact binaries, one can expect PL (or PLC) relations as follows. Let us start with the basic equations which govern contact binaries:
where and are masses of the two components, is the semi-major axis, is the orbital period, is the total luminosity of the system, and is the total projected area seen by an observer. In each contact binary system, material transfer is ongoing in their common envelopes, and both components have filled their Roche lobes. The two components typically have the same temperature, . For a very simple case of two stars with the identical mass, , and radius, then gets close to the radius of each component and is proportional to at the maximum light. In such a case, the above two relations can be combined to give
where is the maximum luminosity and is the mass ratio, , but for the simplest case. Main-sequence stars follow a mass-temperature relation, (, Eker et al 2015), which leads to a period–luminosity–temperature relation (or to a PLC relation),
Moreover, is also correlated with mass and radius in case of main-sequence stars (Eker et al, 2015), and the period–luminosity–temperature relation can be reduced to a PL relation for the simple case being discussed. In realistic case of contact binaries, it has long been known since a seminal work by Eggen (1967) that they show a correlation between period and color (and thus temperature) although Eggen (1967) also suggested that the correlation is blurred by the degree of contact.
The above explanation is of course oversimplified. First, two components are no longer spheres but fill the Roche equipotentials. Furthermore, the mass ratio and the degree of contact affect the relation between the total area and the semi-major axis , and the gravity-darkening effect (Lucy, 1967) and other effects need to be taken into account. Nevertheless, at least a large fraction of contact binary systems show tight correlations between the physical parameters, and are governed by simple relations as demonstrated here. In his classical textbook, Kopal (1959) calculated the geometry of contact binary systems, in particular those with both components filling the Roche lobes. Table 3-3, in Section III.4 in the book, lists the radii of both components, and , in units of the major axis () for various mass ratios between 0 and 1. The simple projected area, , at the maximum can be estimated as , and it is nearly constant for within % while it significantly increases towards at lower . Systems with small tend to be missed, or can be ignored if necessary, because of their small amplitudes; see the relation between and amplitude in Rucinski (2001). Furthermore, as discussed by Eggleton (1983), shows only a little variation over a wide range of . This constraint is analogous to the period–mean density relation of pulsating stars. Combined with the limited distribution of main-sequence stars and contact binaries themselves (Eyer and Mowlavi, 2008) on the HR diagram, like the instability strip for Cepheids, one can expect a PL (or at least a PLC) relation. For more detailed calculations, readers are referred to, e.g., van Hamme and Wilson (1985), Rucinski (1994, 2004), and Chen et al. (2016a).
Contact binaries are divided into early and late types based on their spectral types; the two groups have different temperatures of the two stars in each system, and their orbital periods also tend to be different (longer for the former and shorter for the latter). Late-type contact binaries are also called W Ursa Majoris (W UMa) type, and most well-studied contact binaries belong to this type. Early-type contact binaries are relatively rare and poorly studied compared with W UMa type. Contact binaries are still ubiquitous in the Universe; their number is larger than those of any other variable stars, without solar-like oscillation or other tiny variations into account. Their density is approximately 0.2 % in the solar neighborhood and the Galactic bulge but may be slightly lower in the Galactic plane, 0.1 % (Rucinski, 2006). In intermediate-age open clusters, contact binaries can be as abundant as 0.4 %, but they are rare in young (100 Myr) and old (10 Gyr) open clusters. Because they are abundant and can be easily identified, contact binaries are useful as potential distance indicators.
To establish their PL relation, parallaxes and isochrone-fitting distances to open clusters hosting contact binaries are two independent distance estimates that can be used. Rucinski (1994) used 18 W UMa binaries in open clusters to obtain a -band PLC relation, whereas Rucinski and Duerbeck (1997) obtained a -band PLC relation, , based on 19 binaries with Hipparcos parallax accuracy better than 0.25 mag in distance modulus. The latter relation has particularly been used to anchor distances of contact binaries, although its color dependency is high. About one decade later, Rucinski (2006) tried to reduce the PLC relation to a PL relation and obtained a -band PL relation, , based on 17 W UMa binaries. This PL relation has larger uncertainties in both coefficients, which limits its application. Since then, with some questions on the reliability and the accuracy of W UMa binaries, their application as a distance indicator hasn’t been active compared to classical distance indicators like Cepheids.
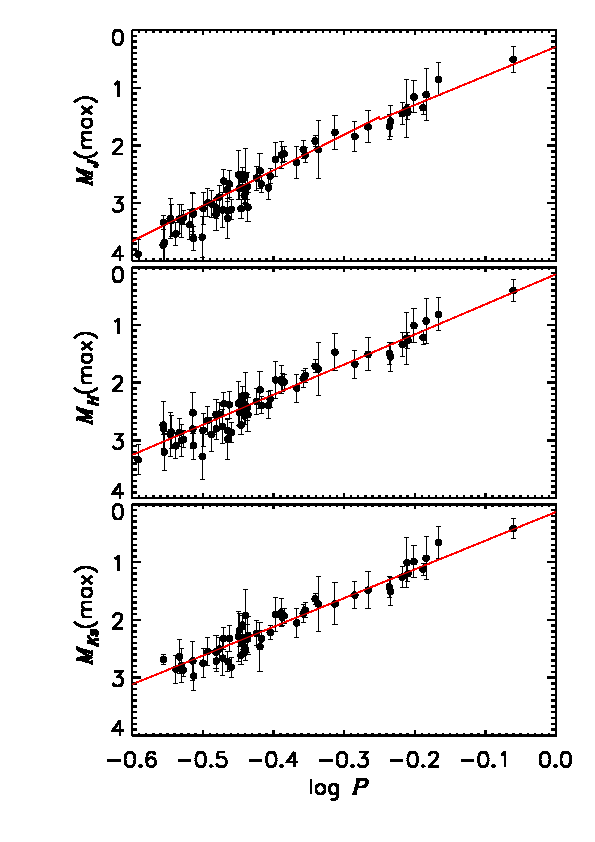
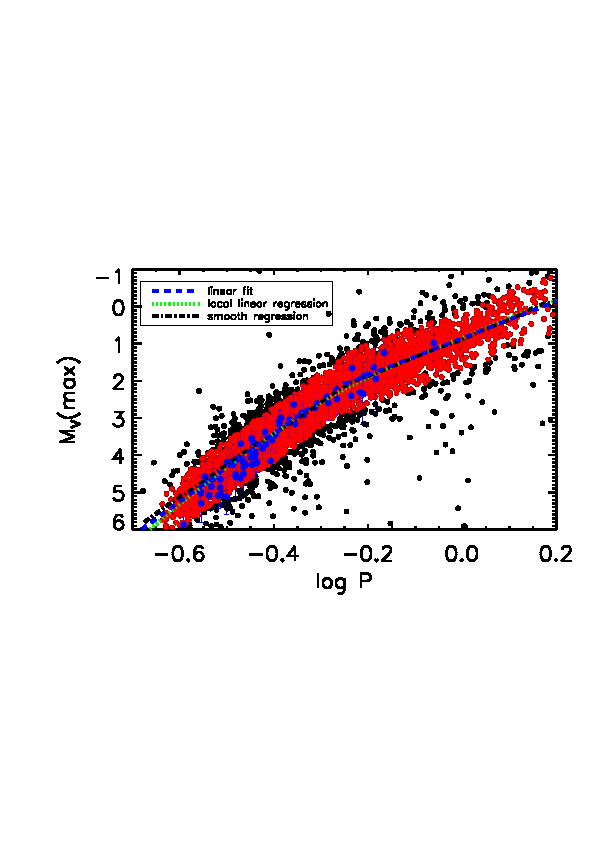
Chen et al. (2016b) discussed physical parameters of contact binaries in NGC 188 in detail, and suggested the presence of an accurate PL relation, whose slope is shallower than that derived by Rucinski (2006), considering five confirmed contact binaries in NGC 188 combined with seven in two other clusters (M 67 and Berkeley 39; see Fig. 7 in Chen et al. 2016b). Then, Chen et al. (2016a) collected data for 66 contact binaries with accurate independent distances and derived the near-IR PL relations,
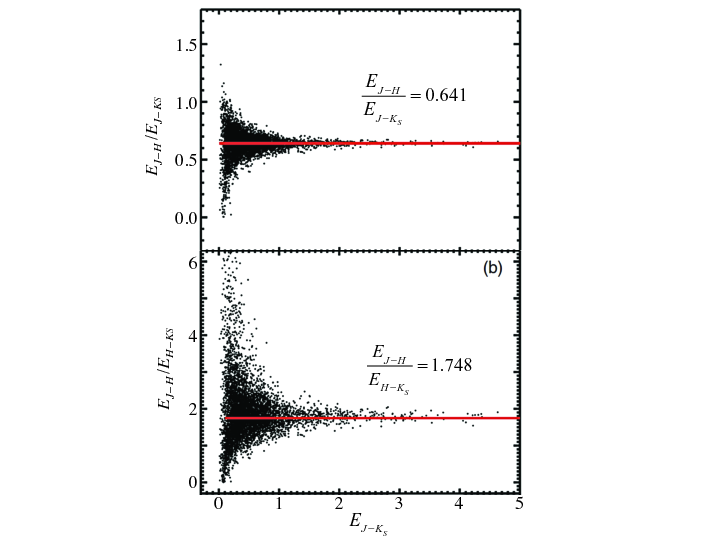
with 1 residual scatter of 0.08–0.09 mag (Fig. 8). These PL relations are fairly tight and can be used to measure distances of individual objects with 5 % accuracy. The metallicity effect on these relations is also discussed in Chen et al. (2016a), but it is unclear or not significantly larger than the scatters of the relations (see Fig. 6 in Chen et al., 2016a). In addition, to derive the -band PL relation (Fig. 9), they estimated the near-IR mean distance and mean extinction of 6090 contact binaries with -band data.
with residual scatter of 0.30 and 0.35 mag. The early- and late-type contact binaries (separated at , Rucinski 2006) follow different PL relations in the band, while this discrepancy disappears in the bands.
Applying the -band PL relation to 102 early-type contact binaries in the Large Magellanic Cloud (LMC), Chen et al. (2016a) obtained an LMC distance modulus of mag. This distance modulus is in accordance with the current best distance to the LMC, mag (summarized by de Grijs et al. 2014). More than 30,000 (Chen et al., 2016b) contact binaries have been found thus far and several hundred contact binaries are found every year in individual papers. With follow-up observations such as spectroscopy, contact binaries can also provide age and kinematic information. They are thus very powerful tracers of stellar populations in the Galaxy.
5 Metallicity Gradient
When distances to many individual stellar tracers like Cepheids and open clusters become available, an important scientific step is then to derive the chemical abundance patterns of these tracers in the disk. In particular, the radial distributions of different elements (e.g. [Fe/H], [/H], etc.) are fundamental observables to constrain the recent disk chemical enrichment, since they can be directly compared with models (Chiappini et al., 1997; Matteucci and Recchi, 2001; Cescutti et al., 2007; Kudritzki et al., 2015). For example, the gradient is affected by the radial migration (see the Introduction). Constraining empirically the efficiency of the radial migration is difficult because stars in the disk quickly lose dynamical signatures of this process. On the other hand, the radial migration affects the chemical abundance patterns and increases the observed metallicity dispersion at any given radius. Observational data of the abundance gradients for stars in a wide range of ages would allow us to constrain the efficiency of orbit migration for blurring the initial abundance pattern.
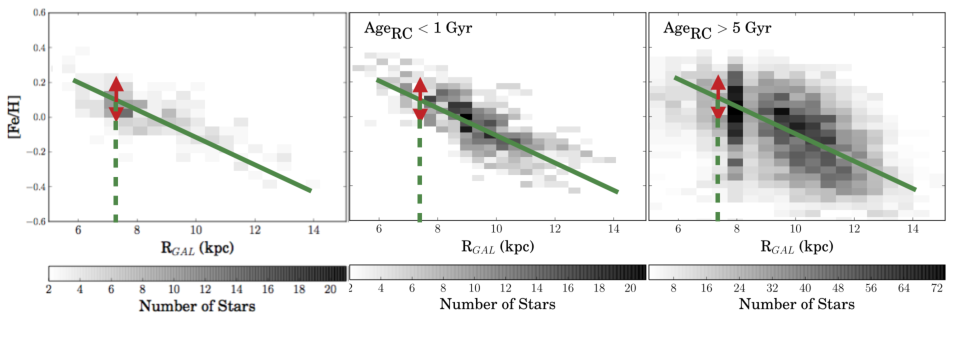
Because of their young age, Cepheids should not have been mixed so much yet, thus their chemical abundances can be used to set a boundary condition to the radial migration effects. In Fig. 10, we compare the iron abundances of Cepheids in the sample of Genovali et al. (2015) with those resulting from RC stars derived on the basis of APOGEE spectra by Ness et al. (2016). On the basis of their content in -element abundances with respect to the iron abundances, Ness et al. (2016) distinguished between RC stars in the thick and thin disk. Moreover, they were also able to determine the ages with an accuracy of better than 40 % for the thin disk sample. The left panel in Fig. 10 shows the density distribution of the iron abundance of Cepheids as a function of , which follows a well established linear gradient (Genovali et al., 2015), while the middle and right panels show the distributions of young and old RC stars, respectively (Ness et al., 2016). This plot clearly illustrates the effect of radial migration in the Galactic disk. In fact, it shows how the dispersion around the radial metallicity gradient increases when we move from the younger (left) to the older stellar populations (right).
The metallicity distribution of open clusters also shows the radial gradient (Friel and Janes, 1993; Twarog et al., 1997). Unlike Cepheids, there are clusters with various ages from a few Myr to a few Gyr. This makes it possible to study the time evolution of the metallicity gradient (e.g. Tsujimoto et al., 2010; Jacobson et al., 2011). Compared to Cepheids, however, the number of open clusters with their locations and metallicities well determined is still limited (see recent progress, e.g., in Magrini et al. 2017). In addition, open clusters can be disrupted because of internal (e.g. SN explosion) and external (e.g. Galactic potential) effects, thus the observed galactic population may be biased.
An interesting new feature was found in recent IR surveys revealing a rich group of massive stellar clusters which hosts several red supergiants (e.g. Davies et al., 2012, see also §4). They seem to be preferentially found around the near- and far-side ends of the Galactic bar although the global distribution of such massive clusters in the inner part of the Galaxy remains to be concluded after more complete surveys and detailed studies have been done. Surprisingly low metallicities have been reported for some of these massive clusters (Davies et al., 2009; Origlia et al., 2013, 2016), around dex or even lower in contrast to the high metallicities, 0.3 dex at a similarly inner part of the disk (Bono et al., 2013, Fig. 3 and discussions therein). No firm scenario to explain such low metallicities has been proposed yet. There is a large room of improvement for the near future both in characterization of open clusters (especially their distances and metallicities) and finding new clusters. In addition, red supergiants in the inner Galaxy and even wider areas will be useful as bright tracers of stellar populations whether or not they belong to clusters (see e.g. Messineo et al, 2016, 2017).
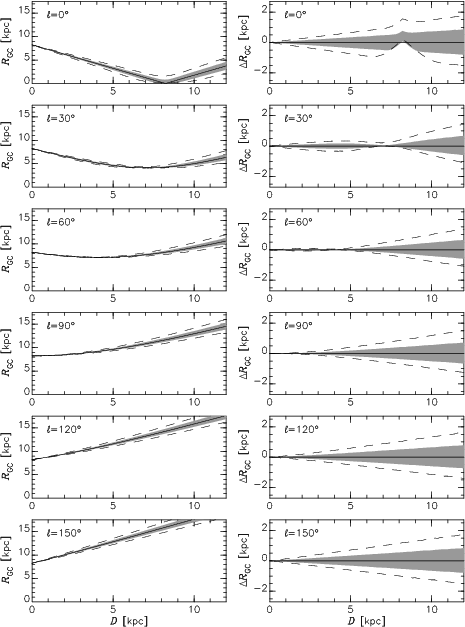
How is the study of the metallicity gradient affected by uncertainties in the distance determination? Fig. 11 plots how the errors in distance are translated to the errors in . Note that we only consider the Galactic plane, i.e. , and it is assumed that the Sun is located at kpc (Reid and Honma, 2014). The relation between the two errors depends on Galactic longitude. For example, up to 5 kpc, a line of sight at runs at almost the same and thus the error in tends to be small. In the direction of , the kink corresponds to the location of the GC where the error in is always positive. At around a distance of 10 kpc or beyond, the sightline dependency of becomes small, and the errors of 0.15 and 0.30 mag in distance modulus correspond to the errors of approximately 0.4 and 1 kpc, respectively, while these errors are less than half at the distance of 5 kpc. The metallicity gradient is 0.06 dex kpc-1, for example, in the case of Cepheids (Genovali et al., 2014) and the scatter of the metallicity of individual Cepheids around the average trend is 0.1 dex. Detailed studies of substructures (see e.g. Genovali et al., 2014) would require a higher precision, 0.03 dex, at each . Errors in would introduce an artificial scatter in the metallicity gradient. The Cepheids investigated by Genovali et al. (2014) and other previous investigations are not highly reddened, and the careful distance determination by Genovali et al. (2014) gives an error size of 5 % or smaller, i.e. 0.1 mag in distance modulus. This error corresponds to roughly kpc at several kpc, so that the effect on the metallicity gradient is very small. For Cepheids affected by severe interstellar extinction, like those in Tanioka et al. (2017), large errors due to the extinction correction, 0.5 mag or even larger, would introduce large errors in (1 kpc at the distance of 5 kpc and more than 2 kpc at kpc). Such large errors would limit the discussions on the chemical structure of the disk traced by Cepheids, and efforts to reduce the uncertainty is required.
It is worthwhile to discuss the metallicity effect on the PL relations of Cepheids in the context of the metallicity gradient. Recent studies made use of near-IR PL relations (or period-Wesenheit relations) to estimate distances to individual Cepheids in a wide range of the disk (e.g. Genovali et al., 2014), and the same approach will be adopted even in the Gaia era because of the high extinction in the optical for relatively distant Cepheids. If the metallicity effect on the PL relations introduces a systematic error into distances to Cepheids depending their metallicities, such an error would introduce an additional scatter to the radial distribution of the Cepheids’ metallicities and/or skew the gradient from the inner, metal-rich, to the outer, metal-poor, parts of the disk. However, the metallicity effect on the near-IR PL relations is considered to be negligible (see e.g. Bono et al, 2010; Subramanian et al., 2017). Even a very conservative upper limit, 0.1 mag dex-1, for the near-IR relations would lead to the small relative error of 0.1 mag, which is negligible as discussed above, when the most metal-rich ([Fe/H] dex) and the most metal-poor ([Fe/H] dex) Cepheids are compared. The study of the metallicity gradient is therefore not significantly affected by the possible metallicity effect on the PL relations. Instead, the metallicity gradient provides us with a sample of Cepheids with a sufficiently wide range of metallicity within a few kpc for which Gaia will deliver accurate parallaxes. Such a sample would be useful to provide constraints on the metallicity effect on the PL relations.
In addition to the more robust estimation of distance, the availability of new large catalogs of Cepheids in the Galaxy calls for a new approach in the determination of their chemical abundances. In fact, a comprehensive and detailed survey of element abundances for hundreds and thousands of Cepheids and young open clusters throughout the disk would offer the unique opportunity to map how chemically homogeneous the Galactic ISM is at a given time in a given place (e.g. spiral arm). This can be achieved with large (single-object or multi-object) spectroscopic surveys. However, such surveys are usually designed to be single-epoch in order to maximize the survey coverage, while Cepheids are pulsating stars affected by dynamical phenomena (pulsation, shock, etc.), and their spectra change as function of phase. Thus, we need to correctly quantify the spectral variations due to the observed pulsation phase. This can be achieved by obtaining phase-resolved spectroscopy of well-understood Cepheids of different periods, which allows for empirical calibration of their variations in effective temperature, gravity and radial velocity. Recent works (Luck and Lambert, 2011) show that the metallicities of a given well-known star based on spectra at different epochs show a reasonable agreement with each other, but small scatters of about 0.1 dex may still be attributed to a systematic phase-dependent effect (see, e.g., the latest work in Vasilyev et al 2018).
It is worthwhile to spend a few more words on the spectroscopic approach to study Cepheids. A new spin in modelling dynamical atmospheres is required to properly analyze Cepheid spectra. Even when considering simple LTE (Local Thermodynamic Equilibrium) 1D atmospheric models of giant stars, the parameter space (low gravity, cool temperature) where the Cepheids are located, is significantly under-sampled. Thus, extrapolation algorithms capable of filling the parameter-space model grid are necessary to derive Cepheid abundances. An alternative approach is to use data-driven spectral models, which can be constructed on the basis of the already available data-sets and applied blindly to new data-sets (Ness et al., 2015). Given their importance, Cepheids have already been included as a specific class of targets in one of the future largest spectroscopic surveys, the 4MOST survey (PI: C. Chiappini), which will deliver final abundances for thousands of new Cepheids (including those which will be discovered by Gaia).
6 Concluding Remarks
Young and intermediate-age distance indicators are crucial to study the Galactic disk. Among a few kinds of promising distance indicators, we have mainly discussed Cepheids and open clusters (and contact binaries therein). Cepheids are well established distance indicators; they have been, for example, the most successful tracers used for delineating the metallicity gradient of the disk. Open clusters and contact binaries are also very useful tracers and their advantage is that their ages are spread in a wide range (a few Myr to several Gyr) in contrast to Cepheids being 10–200 Myr old. Making use of them properly requires detailed studies on individual clusters, but they would provide us with important clues into the evolution of the Galactic disk.
When we use distance tracers discovered in large-scale surveys to investigate a large volume of the Galactic disk, the interstellar extinction poses a very challenging problem. Our review has summarized massive efforts to characterize the interstellar extinction dedicated for a long time by many astronomers, but it is also clear that many uncertainties remain. For the rest of this review, we’ll discuss two promising approaches to determine the extinction law with newly available data sets today and in the future: (1) spectroscopic data, and (2) a priori distances of reddened distance indicators.
With the advent of the APOGEE survey, for example, much progress is going to be made in the studies of the IR extinction law. APOGEE is a high resolution (; Majewski et al., 2017), -band () spectroscopic survey of stars in our Galaxy. Using APOGEE spectra, we can measure stellar parameters, such as the effective temperature , surface gravity , and metal abundance . This allows us to precisely determine and the intrinsic colors of late-type giants. It should be noted that spectroscopic data for early-type stars has been often used for studying the extinction law (e.g. Fitzpatrick and Massa, 2007). This kind of approach remains important, while the advantage of using late-type giants is they are ubiquitous and much more abundant across the disk so that we can study the spatial variation of the extinction law, if any, almost continuously. To extend such studies to more obscured regions across the Galactic disk, new-generation near-IR high-resolution spectrographs, e.g. CRIRES+ (Dorn et al, 2016) and WINERED (Ikeda et al, 2016), will be useful thanks to their high sensitivity.
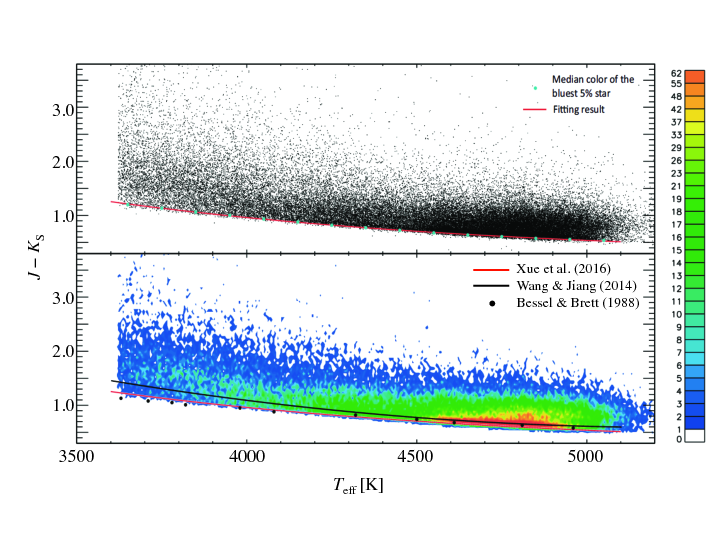
By combining the stellar parameters from APOGEE and the observed colors from 2MASS, Wang and Jiang (2014) determined the intrinsic colors of K giants. The bluest edge of the color index in the -color diagram is considered to represent the intrinsic colors of the red giants, i.e., the bluest stars suffer from negligible interstellar extinction (Fig. 12). The color excesses , , and are derived for 5942 stars at and . Their interesting results are shown in the color-excess ratio versus color-excess plot, such as the versus diagram (Fig. 13). Wang and Jiang (2014) found no tendency of with , for mag (which corresponds to less than 2.5 mag). A systematic change is not found in and , which are often used as a measure of the near-IR extinction law. The dispersion at low is likely explained fully by observational errors. Wang and Jiang (2014) claimed that these results confirm the “universality” of the near-IR extinction law in the , , and bands, from the diffuse to the dense interstellar medium. The variations found in the previous studies could be due partly to differences in the effective wavelength in different photometric systems, or to effects of stellar metallicity, which was restricted to in Wang and Jiang (2014). Schultheis et al. (2015) also found no evidence for any trend of the variation of the near-IR extinction law. They used stellar properties derived from the Gaia-ESO survey, mainly to probe the 3D distribution of the interstellar extinction in our Galaxy. The fields of the survey are located at high Galactic latitude, . They show a plot of versus angle from the GC, and claim no variation of the extinction coefficient along different lines of sight.
Such a spectroscopic approach has been extended to the mid-IR wavelengths. Xue et al. (2016) applied the method of Wang and Jiang (2014), i.e. estimating the intrinsic stellar colors in a spectroscopic way for studying the extinction law, to mid-IR data. The mid-IR data sets they used are from Spitzer/IRAC, Spitzer/MIPS, WISE, and AKARI. In their analysis, G- and K-type giants are used. To examine the variation of the extinction law, Xue et al. (2016) divided their data sets into three groups: , , and . Then they compared the color-excess ratios in the three groups, for the WISE, AKARI, and Spitzer nine bands. They also compared the extinction laws in the form under the assumption that is universal for the three groups. Xue et al. (2016) found remarkably constant color-excess ratios among the three groups. This is also seen in .
McClure (2009), in contrast, detected variations in mid-IR extinction using Spitzer/MIPS spectra of 31 late-type giants behind dense molecular clouds. Their conclusion is that the median curves for specific ranges of the amount of extinction characterize the shape of the extinction law. They claimed that they found a “real” variation of the extinction law, as a function of in the mid-IR waverange; the extinction law also becomes flat with increasing . The difference from the results in Xue et al. (2016) may simply reflect the difference between the extinction by relatively diffuse interstellar medium and that by dense molecular clouds. The targets of McClure (2009) are molecular clouds in star forming regions, and the clouds are dense enough for grain growth to occur. As predicted by grain models (e.g. Weingartner and Draine, 2001), the grain growth is likely to alter the shape of the extinction law. On the other hand, Wang and Jiang (2014) and Xue et al. (2016) do not distinguish among interstellar environments. Even though there still remain uncertainties, massive spectroscopic data available today and in the future may be critical to determine the extinction law in a precise and robust way.
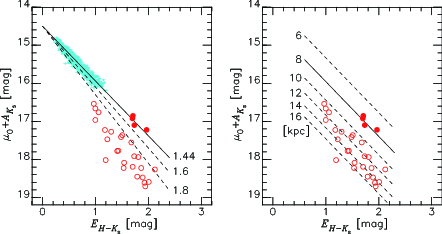
Besides the spectroscopic approaches, reddened objects with known distance are also useful to determine the extinction law. In order to give observational constraints on the total-to-selective extinction ratio (e.g. ), distance indicators whose distances can be addressed by more than one methods are very useful. For example, Matsunaga et al. (2016); Matsunaga (2017) adopted the extinction law in Nishiyama et al. (2006), and rejected some other laws, based on observational data for Cepheids in the Nuclear Stellar Disk, within 230 pc around the GC (Launhardt et al., 2002). For these Cepheids, while distance estimation based on the PL relation of Cepheids is affected by the extinction law, their distances should agree with that of GC within the size of the Nuclear Stellar Disk because of their membership to this relatively small-sized disk. There are many independent estimates of the distance to the GC, as discussed in de Grijs and Bono (2016, kpc), including Keplerian stellar orbits around the central supermassive black hole (Boehle et al., 2016; Gillessen et al., 2017; Parsa et al., 2017) which is unaffected by the extinction law. Considering how different extinction laws ( to be more specific) lead to different estimates of distance in comparison with the assumed distance from that of GC limits an acceptable range of the extinction law. Matsunaga et al. (2016) concluded that found by Nishiyama et al. (2006) or slightly smaller values would be consistent with their observational data for the Cepheids in the Nuclear Stellar Disk. Larger values would put the four Cepheids (with mag) significantly more distant than expected; in Nishiyama et al. (2009) lead to larger by mag, 15 % larger in distance, or even a larger difference is introduced by in Cardelli et al. (1989).
Nishiyama et al. (2006) themselves obtained and other parameters of the extinction law based on a similar but slightly different principle. They compared RC peaks toward many sightlines for which the amounts of extinction are spread in a wide range, 0.3–1.2 in . They assumed that the RC peaks along the sightlines toward the bulge trace the same distance, because of the concentration toward the center of the bulge, even with the different amounts of extinction. The difference of magnitudes 1.3 between the least and most reddened RC peaks observed by Nishiyama et al. (2006) leads to their extinction law, . Note that they didn’t use the distance to the GC (or the bulge) but used the relative extinction and reddening of RC peaks assumed to be at the same distance. The results of Matsunaga et al. (2016) and Nishiyama et al. (2006) are summarized in an illustrative way in Fig. 14. These works have demonstrated that distance indicators play a crucial role in determining the extinction law especially when their distances can be estimated by more than one method; Gaia parallaxes in the near future, for example, will provide us with great data sets also for problems of the extinction law.
Acknowledgements.
We thank the organizers and participants of ISSI-BJ for the inspiring discussions therein. NM is grateful to Grant-in-Aid, KAKAENHI No. 26287028, from the Japan Society for the Promotion of Science (JSPS). RdG acknowledges research support from the National Natural Science Foundation of China (grants U1631102, 11373010, and 11633005). SN was supported by JSPS KAKENHI (Nos. 25707012, 15K13463).References
- Alonso-García et al. (2017) Alonso-García J, Minniti D, Catelan M, Contreras Ramos R, Gonzalez OA, Hempel M, Lucas PW, Saito RK, Valenti E, Zoccali M (2017) Extinction Ratios in the Inner Galaxy as Revealed by the VVV Survey. ApJ849:L13, DOI 10.3847/2041-8213/aa92c3, 1710.04854
- An et al. (2007) An D, Terndrup DM, Pinsonneault MH (2007) The Distances to Open Clusters from Main-Sequence Fitting. IV. Galactic Cepheids, the LMC, and the Local Distance Scale. ApJ671:1640–1668, DOI 10.1086/522304, 0707.3144
- Anderson et al. (2013) Anderson RI, Eyer L, Mowlavi N (2013) Cepheids in open clusters: an 8D all-sky census. MNRAS434:2238–2261, DOI 10.1093/mnras/stt1160, 1212.5119
- Andrievsky et al. (2016) Andrievsky SM, Martin RP, Kovtyukh VV, Korotin SA, Lépine JRD (2016) Oxygen, -element and iron abundance distributions in the inner part of the Galactic thin disc - II. MNRAS461:4256–4259, DOI 10.1093/mnras/stw1631, 1607.00129
- Ascenso et al. (2013) Ascenso J, Lada CJ, Alves J, Román-Zúñiga CG, Lombardi M (2013) The mid-infrared extinction law in the darkest cores of the Pipe Nebula. A&A549:A135, DOI 10.1051/0004-6361/201220658, 1211.6556
- Baba et al (2018) Baba J, Kawata D, Matsunaga N, Grand RJJ, Hunt JAS (2018) Gaia DR1 Evidence of Disrupting the Perseus Arm. ApJ853:L23, DOI 10.3847/2041-8213/aaa839, 1712.04714
- Barbá et al. (2015) Barbá RH, Roman-Lopes A, Nilo Castellón JL, Firpo V, Minniti D, Lucas P, Emerson JP, Hempel M, Soto M, Saito RK (2015) Hundreds of new cluster candidates in the VISTA Variables in the Vía Láctea survey DR1. A&A581:A120, DOI 10.1051/0004-6361/201424048, 1505.02764
- Baumgardt et al. (2000) Baumgardt H, Dettbarn C, Wielen R (2000) Absolute proper motions of open clusters. I. Observational data. A&AS146:251–258, DOI 10.1051/aas:2000362, astro-ph/0010306
- Beaton et al. (2018) Beaton RL, Bono G, Braga VF, Dall’Ora M, Fiorentino F, Jang IS, Martínez-Vázquez CE, Matsunaga N, Monelli M, Neeley J, Salariz M (2018) Old-Aged Primary Distance Indicators. Submitted to Space Sci. Rev.
- Bertoldi et al. (1999) Bertoldi F, Timmermann R, Rosenthal D, Drapatz S, Wright CM (1999) Detection of HD in the Orion molecular outflow. A&A346:267–277, astro-ph/9904261
- Bessell and Brett (1988) Bessell MS, Brett JM (1988) JHKLM photometry - Standard systems, passbands, and intrinsic colors. PASP100:1134–1151, DOI 10.1086/132281
- Bland-Hawthorn and Gerhard (2016) Bland-Hawthorn J, Gerhard O (2016) The Galaxy in Context: Structural, Kinematic, and Integrated Properties. ARA&A54:529–596, DOI 10.1146/annurev-astro-081915-023441, 1602.07702
- Bless and Savage (1972) Bless RC, Savage BD (1972) Ultraviolet Photometry from the Orbiting Astronomical Observatory. II. Interstellar Extinction. ApJ171:293, DOI 10.1086/151282
- Boehle et al. (2016) Boehle A, Ghez AM, Schödel R, Meyer L, Yelda S, Albers S, Martinez GD, Becklin EE, Do T, Lu JR, Matthews K, Morris MR, Sitarski B, Witzel G (2016) An Improved Distance and Mass Estimate for Sgr A* from a Multistar Orbit Analysis. ApJ830:17, DOI 10.3847/0004-637X/830/1/17, 1607.05726
- Bono et al. (2005) Bono G, Marconi M, Cassisi S, Caputo F, Gieren W, Pietrzynski G (2005) Classical Cepheid Pulsation Models. X. The Period-Age Relation. ApJ621:966–977, DOI 10.1086/427744, astro-ph/0411756
- Bono et al (2010) Bono G, Caputo F, Marconi M, Musella I (2010) Insights into the Cepheid Distance Scale. ApJ715:277–291, DOI 10.1088/0004-637X/715/1/277, 1004.0363
- Bono et al. (2013) Bono G, Matsunaga N, Inno L, Lagioia EP, Genovali K (2013) Stellar Populations in the Galactic Center. In: Torres DF, Reimer O (eds) Cosmic Rays in Star-Forming Environments, Astrophysics and Space Science Proceedings, vol 34, p 115, DOI 10.1007/978-3-642-35410-6-9, 1304.6211
- Borissova et al. (2011) Borissova J, Bonatto C, Kurtev R, Clarke JRA, Peñaloza F, Sale SE, Minniti D, Alonso-García J, Artigau E, Barbá R, Bica E, Baume GL, Catelan M, Chenè AN, Dias B, Folkes SL, Froebrich D, Geisler D, de Grijs R, Hanson MM, Hempel M, Ivanov VD, Kumar MSN, Lucas P, Mauro F, Moni Bidin C, Rejkuba M, Saito RK, Tamura M, Toledo I (2011) New Galactic star clusters discovered in the VVV survey. A&A532:A131, DOI 10.1051/0004-6361/201116662, 1106.3045
- Cambrésy et al. (2011) Cambrésy L, Rho J, Marshall DJ, Reach WT (2011) Variation of the extinction law in the Trifid nebula. A&A527:A141, DOI 10.1051/0004-6361/201015863, 1101.1089
- Cardelli et al. (1989) Cardelli JA, Clayton GC, Mathis JS (1989) The relationship between infrared, optical, and ultraviolet extinction. ApJ345:245–256, DOI 10.1086/167900
- Carraro (2014) Carraro G (2014) The Milky Way thin disk structure as revealed by stars and young open clusters. In: Feltzing S, Zhao G, Walton NA, Whitelock P (eds) Setting the scene for Gaia and LAMOST, IAU Symposium, vol 298, pp 7–16, DOI 10.1017/S1743921313006157, 1307.0569
- Carraro et al. (2017) Carraro G, Turner DG, Majaess DJ, Baume GL, Gamen R, Molina Lera JA (2017) Extinction in the Star Cluster SAI 113 and Galactic Structure in Carina. AJ153:156, DOI 10.3847/1538-3881/aa5c3a, 1701.08319
- Casagrande et al. (2011) Casagrande L, Schönrich R, Asplund M, Cassisi S, Ramírez I, Meléndez J, Bensby T, Feltzing S (2011) New constraints on the chemical evolution of the solar neighbourhood and Galactic disc(s). Improved astrophysical parameters for the Geneva-Copenhagen Survey. A&A530:A138, DOI 10.1051/0004-6361/201016276, 1103.4651
- Cescutti et al. (2007) Cescutti G, Matteucci F, François P, Chiappini C (2007) Abundance gradients in the Milky Way for elements, iron peak elements, barium, lanthanum, and europium. A&A462:943–951, DOI 10.1051/0004-6361:20065403, astro-ph/0609813
- Chapman et al. (2009) Chapman NL, Mundy LG, Lai SP, Evans NJ II (2009) The Mid-Infrared Extinction Law in the Ophiuchus, Perseus, and Serpens Molecular Clouds. ApJ690:496-511, DOI 10.1088/0004-637X/690/1/496, 0809.1106
- Chen et al. (2013) Chen BQ, Schultheis M, Jiang BW, Gonzalez OA, Robin AC, Rejkuba M, Minniti D (2013) Three-dimensional interstellar extinction map toward the Galactic bulge. A&A550:A42, DOI 10.1051/0004-6361/201219682, 1211.3092
- Chen et al. (2015) Chen X, de Grijs R, Deng L (2015) A search for open cluster Cepheids in the Galactic plane. MNRAS446:1268–1282, DOI 10.1093/mnras/stu2165, 1410.4489
- Chen et al. (2016a) Chen X, de Grijs R, Deng L (2016a) Contact Binaries as Viable Distance Indicators: New, Competitive (V)JHK s Period-Luminosity Relations. ApJ832:138, DOI 10.3847/0004-637X/832/2/138, 1609.02267
- Chen et al. (2016b) Chen X, Deng L, de Grijs R, Zhang X, Xin Y, Wang K, Luo C, Yan Z, Tian J, Sun J, Liu Q, Zhou Q, Luo Z (2016b) Physical Parameter Study of Eight W Ursae Majoris-type Contact Binaries in NGC 188. AJ152:129, DOI 10.3847/0004-6256/152/5/129, 1607.06152
- Chen et al. (2017) Chen X, de Grijs R, Deng L (2017) New open cluster Cepheids in the VVV survey tightly constrain near-infrared period-luminosity relations. MNRAS464:1119–1126, DOI 10.1093/mnras/stw2390
- Chiappini et al. (1997) Chiappini C, Matteucci F, Gratton R (1997) The Chemical Evolution of the Galaxy: The Two-Infall Model. ApJ477:765–780, DOI 10.1086/303726, astro-ph/9609199
- Chiappini et al. (2001) Chiappini C, Matteucci F, Romano D (2001) Abundance Gradients and the Formation of the Milky Way. ApJ554:1044–1058, DOI 10.1086/321427, astro-ph/0102134
- Chiar et al (2000) Chiar JE, Tielens AGGM, Whittet DCB, Schutte WA, Boogert ACA, Lutz D, van Dishoeck EF, Bernstein MP (2000) The Composition and Distribution of Dust along the Line of Sight toward the Galactic Center. ApJ537:749–762, DOI 10.1086/309047, astro-ph/0002421
- Clark et al. (2015) Clark JS, Negueruela I, Lohr ME, Dorda R, González-Fernández C, Lewis F, Roche P (2015) A long-period Cepheid variable in the starburst cluster VdBH222. A&A584:L12, DOI 10.1051/0004-6361/201527360, 1510.06643
- da Silva et al. (2016) da Silva R, Lemasle B, Bono G, Genovali K, McWilliam A, Cristallo S, Bergemann M, Buonanno R, Fabrizio M, Ferraro I, François P, Iannicola G, Inno L, Laney CD, Kudritzki RP, Matsunaga N, Nonino M, Primas F, Przybilla N, Romaniello M, Thévenin F, Urbaneja MA (2016) Neutron-capture elements across the Galactic thin disk using Cepheids. A&A586:A125, DOI 10.1051/0004-6361/201527300, 1510.06314
- Dambis et al. (2015) Dambis AK, Berdnikov LN, Efremov YN, Kniazev AY, Rastorguev AS, Glushkova EV, Kravtsov VV, Turner DG, Majaess DJ, Sefako R (2015) Classical Cepheids and the spiral structure of the milky way. Astronomy Letters 41:489–500, DOI 10.1134/S1063773715090017, 1505.01782
- Damineli et al. (2016) Damineli A, Almeida LA, Blum RD, Damineli DSC, Navarete F, Rubinho MS, Teodoro M (2016) Extinction law in the range 0.4-4.8 m and the 8620 Å DIB towards the stellar cluster Westerlund 1. MNRAS463:2653–2666, DOI 10.1093/mnras/stw2122, 1607.04639
- Davenport et al. (2014) Davenport JRA, Ivezić Ž, Becker AC, Ruan JJ, Hunt-Walker NM, Covey KR, Lewis AR, AlSayyad Y, Anderson LM (2014) The SDSS-2MASS-WISE 10-dimensional stellar colour locus. MNRAS440:3430–3438, DOI 10.1093/mnras/stu466, 1403.1875
- Davies et al. (2009) Davies B, Origlia L, Kudritzki RP, Figer DF, Rich RM, Najarro F, Negueruela I, Clark JS (2009) Chemical Abundance Patterns in the Inner Galaxy: The Scutum Red Supergiant Clusters. ApJ696:2014–2025, DOI 10.1088/0004-637X/696/2/2014, 0902.2378
- Davies et al. (2012) Davies B, de La Fuente D, Najarro F, Hinton JA, Trombley C, Figer DF, Puga E (2012) A newly discovered young massive star cluster at the far end of the Galactic Bar. MNRAS419:1860–1870, DOI 10.1111/j.1365-2966.2011.19840.x, 1111.2630
- de Grijs and Bono (2016) de Grijs R, Bono G (2016) Clustering of Local Group Distances: Publication Bias or Correlated Measurements? IV. The Galactic Center. ApJS227:5, DOI 10.3847/0067-0049/227/1/5, 1610.02457
- de Grijs et al. (2014) de Grijs R, Wicker JE, Bono G (2014) Clustering of Local Group Distances: Publication Bias or Correlated Measurements? I. The Large Magellanic Cloud. AJ147:122, DOI 10.1088/0004-6256/147/5/122, 1403.3141
- Dékány et al. (2015a) Dékány I, Minniti D, Hajdu G, Alonso-García J, Hempel M, Palma T, Catelan M, Gieren W, Majaess D (2015a) Discovery of a Pair of Classical Cepheids in an Invisible Cluster Beyond the Galactic Bulge. ApJ799:L11, DOI 10.1088/2041-8205/799/1/L11, 1412.8658
- Dékány et al. (2015b) Dékány I, Minniti D, Majaess D, Zoccali M, Hajdu G, Alonso-García J, Catelan M, Gieren W, Borissova J (2015b) The VVV Survey Reveals Classical Cepheids Tracing a Young and Thin Stellar Disk across the Galaxy’s Bulge. ApJ812:L29, DOI 10.1088/2041-8205/812/2/L29, 1509.08402
- Dias and Lépine (2005) Dias WS, Lépine JRD (2005) Direct Determination of the Spiral Pattern Rotation Speed of the Galaxy. ApJ629:825–831, DOI 10.1086/431456, astro-ph/0503083
- Dias et al. (2002) Dias WS, Alessi BS, Moitinho A, Lépine JRD (2002) New catalogue of optically visible open clusters and candidates. A&A389:871–873, DOI 10.1051/0004-6361:20020668, astro-ph/0203351
- Dorn et al (2016) Dorn RJ, Follert R, Bristow P, Cumani C, Eschbaumer S, Grunhut J, Haimerl A, Hatzes A, Heiter U, Hinterschuster R, Ives DJ, Jung Y, Kerber F, Klein B, Lavaila A, Lizon JL, Löwinger T, Molina-Conde I, Nicholson B, Marquart T, Oliva E, Origlia L, Pasquini L, Paufique J, Piskunov N, Reiners A, Seemann U, Stegmeier J, Stempels E, Tordo S (2016) The “+” for CRIRES: enabling better science at infrared wavelength and high spectral resolution at the ESO VLT. In: Ground-based and Airborne Instrumentation for Astronomy VI, Proc. SPIE, vol 9908, p 99080I, DOI 10.1117/12.2232837
- Draine (1989) Draine BT (1989) Interstellar extinction in the infrared. In: Böhm-Vitense E (ed) Infrared Spectroscopy in Astronomy, ESA Special Publication, vol 290
- Draine (2003a) Draine BT (2003a) Scattering by Interstellar Dust Grains. I. Optical and Ultraviolet. ApJ598:1017–1025, DOI 10.1086/379118, astro-ph/0304060
- Draine (2003b) Draine BT (2003b) Scattering by Interstellar Dust Grains. II. X-Rays. ApJ598:1026–1037, DOI 10.1086/379123, astro-ph/0308251
- Eggen (1967) Eggen OJ (1967) Contact binaries, II. MmRAS70:111
- Eggleton (1983) Eggleton PP (1983) Approximations to the radii of Roche lobes. ApJ268:368, DOI 10.1086/160960
- Eker et al (2015) Eker Z, Soydugan F, Soydugan E, Bilir S, Yaz Gökçe E, Steer I, Tüysüz M, Şenyüz T, Demircan O (2015) Main-Sequence Effective Temperatures from a Revised Mass-Luminosity Relation Based on Accurate Properties. AJ149:131, DOI 10.1088/0004-6256/149/4/131, 1501.06585
- Eyer and Mowlavi (2008) Eyer L, Mowlavi N (2008) Variable stars across the observational HR diagram. In: Journal of Physics Conference Series, Journal of Physics Conference Series, vol 118, p 012010, DOI 10.1088/1742-6596/118/1/012010, 0712.3797
- Feast and Whitelock (1997) Feast M, Whitelock P (1997) Galactic kinematics of Cepheids from HIPPARCOS proper motions. MNRAS291:683, DOI 10.1093/mnras/291.4.683, astro-ph/9706293
- Fitzpatrick and Massa (2007) Fitzpatrick EL, Massa D (2007) An Analysis of the Shapes of Interstellar Extinction Curves. V. The IR-through-UV Curve Morphology. ApJ663:320–341, DOI 10.1086/518158, 0705.0154
- Fitzpatrick and Massa (2009) Fitzpatrick EL, Massa D (2009) An Analysis of the Shapes of Interstellar Extinction Curves. VI. The Near-IR Extinction Law. ApJ699:1209–1222, DOI 10.1088/0004-637X/699/2/1209, 0905.0133
- Flaherty et al. (2007) Flaherty KM, Pipher JL, Megeath ST, Winston EM, Gutermuth RA, Muzerolle J, Allen LE, Fazio GG (2007) Infrared Extinction toward Nearby Star-forming Regions. ApJ663:1069–1082, DOI 10.1086/518411, astro-ph/0703777
- Friel and Janes (1993) Friel ED, Janes KA (1993) Metallicities and radial velocities of old open clusters. A&A267:75–91
- Fritz et al. (2011) Fritz TK, Gillessen S, Dodds-Eden K, Lutz D, Genzel R, Raab W, Ott T, Pfuhl O, Eisenhauer F, Yusef-Zadeh F (2011) Line Derived Infrared Extinction toward the Galactic Center. ApJ737:73, DOI 10.1088/0004-637X/737/2/73, 1105.2822
- Froebrich et al. (2007) Froebrich D, Murphy GC, Smith MD, Walsh J, Del Burgo C (2007) A large-scale extinction map of the Galactic Anticentre from 2MASS. MNRAS378:1447–1460, DOI 10.1111/j.1365-2966.2007.11886.x, 0704.2993
- Gao et al. (2009) Gao J, Jiang BW, Li A (2009) Mid-Infrared Extinction and its Variation with Galactic Longitude. ApJ707:89–102, DOI 10.1088/0004-637X/707/1/89, 0910.3037
- Genovali et al. (2014) Genovali K, Lemasle B, Bono G, Romaniello M, Fabrizio M, Ferraro I, Iannicola G, Laney CD, Nonino M, Bergemann M, Buonanno R, François P, Inno L, Kudritzki RP, Matsunaga N, Pedicelli S, Primas F, Thévenin F (2014) On the fine structure of the Cepheid metallicity gradient in the Galactic thin disk. A&A566:A37, DOI 10.1051/0004-6361/201323198, 1403.6128
- Genovali et al. (2015) Genovali K, Lemasle B, da Silva R, Bono G, Fabrizio M, Bergemann M, Buonanno R, Ferraro I, François P, Iannicola G, Inno L, Laney CD, Kudritzki RP, Matsunaga N, Nonino M, Primas F, Romaniello M, Urbaneja MA, Thévenin F (2015) On the -element gradients of the Galactic thin disk using Cepheids. A&A580:A17, DOI 10.1051/0004-6361/201525894, 1503.03758
- Gillessen et al. (2017) Gillessen S, Plewa PM, Eisenhauer F, Sari R, Waisberg I, Habibi M, Pfuhl O, George E, Dexter J, von Fellenberg S, Ott T, Genzel R (2017) An Update on Monitoring Stellar Orbits in the Galactic Center. ApJ837:30, DOI 10.3847/1538-4357/aa5c41, 1611.09144
- Gómez and Kenyon (2001) Gómez M, Kenyon SJ (2001) A Near-Infrared Imaging Survey of the Chamaeleon I Dark Cloud. AJ121:974–983, DOI 10.1086/318776, astro-ph/0011112
- Gosling et al. (2009) Gosling AJ, Bandyopadhyay RM, Blundell KM (2009) The complex, variable near-infrared extinction towards the Nuclear Bulge. MNRAS394:2247–2254, DOI 10.1111/j.1365-2966.2009.14493.x, 0901.1987
- Grand et al. (2015) Grand RJJ, Kawata D, Cropper M (2015) Impact of radial migration on stellar and gas radial metallicity distribution. MNRAS447:4018–4027, DOI 10.1093/mnras/stv016, 1410.3836
- Haywood et al. (2013) Haywood M, Di Matteo P, Lehnert MD, Katz D, Gómez A (2013) The age structure of stellar populations in the solar vicinity. Clues of a two-phase formation history of the Milky Way disk. A&A560:A109, DOI 10.1051/0004-6361/201321397, 1305.4663
- He et al. (1995) He L, Whittet DCB, Kilkenny D, Spencer Jones JH (1995) Interstellar Extinction from 0.35 to 2.2 Microns: A Study Based on Luminous Southern Stars. ApJS101:335, DOI 10.1086/192243
- Honma et al. (2012) Honma M, Nagayama T, Ando K, Bushimata T, Choi YK, Handa T, Hirota T, Imai H, Jike T, Kim MK, Kameya O, Kawaguchi N, Kobayashi H, Kurayama T, Kuji S, Matsumoto N, Manabe S, Miyaji T, Motogi K, Nakagawa A, Nakanishi H, Niinuma K, Oh CS, Omodaka T, Oyama T, Sakai N, Sato K, Sato M, Shibata KM, Shiozaki S, Sunada K, Tamura Y, Ueno Y, Yamauchi A (2012) Fundamental Parameters of the Milky Way Galaxy Based on VLBI astrometry. PASJ64:136, DOI 10.1093/pasj/64.6.136, 1211.3843
- Hosek et al (2018) Hosek MW Jr, Lu JR, Anderson J, Do T, Schlafly EF, Ghez AM, Clarkson WI, Morris MR, Albers SM (2018) The Optical/Near-infrared Extinction Law in Highly Reddened Regions. ApJ855:13, DOI 10.3847/1538-4357/aaabbb, 1801.08574
- Hoyle et al. (2003) Hoyle F, Shanks T, Tanvir NR (2003) Distances to Cepheid open clusters via optical and K-band imaging. MNRAS345:269–291, DOI 10.1046/j.1365-8711.2003.06939.x, astro-ph/0002521
- Ikeda et al (2016) Ikeda Y, Kobayashi N, Kondo S, Otsubo S, Hamano S, Sameshima H, Yoshikawa T, Fukue K, Nakanishi K, Kawanishi T, Nakaoka T, Kinoshita M, Kitano A, Asano A, Takenaka K, Watase A, Mito H, Yasui C, Minami A, Izumu N, Yamamoto R, Mizumoto M, Arasaki T, Arai A, Matsunaga N, Kawakita H (2016) High sensitivity, wide coverage, and high-resolution NIR non-cryogenic spectrograph, WINERED. In: Ground-based and Airborne Instrumentation for Astronomy VI, Proc. SPIE, vol 9908, p 99085Z, DOI 10.1117/12.2230886
- Indebetouw et al. (2005) Indebetouw R, Mathis JS, Babler BL, Meade MR, Watson C, Whitney BA, Wolff MJ, Wolfire MG, Cohen M, Bania TM, Benjamin RA, Clemens DP, Dickey JM, Jackson JM, Kobulnicky HA, Marston AP, Mercer EP, Stauffer JR, Stolovy SR, Churchwell E (2005) The Wavelength Dependence of Interstellar Extinction from 1.25 to 8.0 m Using GLIMPSE Data. ApJ619:931–938, DOI 10.1086/426679, astro-ph/0406403
- Irwin (1955) Irwin JB (1955) Cepheid Variables and Galactic Structure. Monthly Notes of the Astronomical Society of South Africa 14:38
- Ivezić et al. (2012) Ivezić Ž, Beers TC, Jurić M (2012) Galactic Stellar Populations in the Era of the Sloan Digital Sky Survey and Other Large Surveys. ARA&A50:251–304, DOI 10.1146/annurev-astro-081811-125504, 1308.6386
- Jacobson et al. (2011) Jacobson HR, Pilachowski CA, Friel ED (2011) A Chemical Abundance Study of 10 Open Clusters Based on WIYN-Hydra Spectroscopy. AJ142:59, DOI 10.1088/0004-6256/142/2/59, 1107.4139
- Jiang et al. (2006) Jiang BW, Gao J, Omont A, Schuller F, Simon G (2006) Extinction at 7 m and 15 m from the ISOGAL survey. A&A446:551–560, DOI 10.1051/0004-6361:20053501, astro-ph/0509657
- Johnson and Borgman (1963) Johnson HL, Borgman J (1963) The law of interstellar extinction. Bull. Astron. Inst. Netherlands17:115
- Johnson and Morgan (1955) Johnson HL, Morgan WW (1955) Some Evidence for a Regional Variation in the Law of Interstellar Reddening. ApJ122:142, DOI 10.1086/146063
- Joshi (2005) Joshi YC (2005) Interstellar extinction towards open clusters and Galactic structure. MNRAS362:1259–1266, DOI 10.1111/j.1365-2966.2005.09391.x, astro-ph/0507069
- Joshi et al. (2016) Joshi YC, Dambis AK, Pandey AK, Joshi S (2016) Study of open clusters within 1.8 kpc and understanding the Galactic structure. A&A593:A116, DOI 10.1051/0004-6361/201628944, 1606.06425
- Joy (1939) Joy AH (1939) Rotation Effects, Interstellar Absorption, and Certain Dynamical Constants of the Galaxy Determined from Cepheid Variables. ApJ89:356, DOI 10.1086/144060
- Kawata et al (2018) Kawata D, Bovy J, Matsunaga N, Baba J (2018) Galactic Local Circular Velocity from Gaia DR1 Cepheids and Effects of Non-Axisymmetry. ArXiv e-prints 1803.05927
- Kenyon et al. (1998) Kenyon SJ, Lada EA, Barsony M (1998) The near-infrared extinction law and limits on the pre-main-sequence population of the Rho Ophiuchi dark cloud. AJ115:252, DOI 10.1086/300188
- Kharchenko et al. (2013) Kharchenko NV, Piskunov AE, Schilbach E, Röser S, Scholz RD (2013) Global survey of star clusters in the Milky Way. II. The catalogue of basic parameters. A&A558:A53, DOI 10.1051/0004-6361/201322302, 1308.5822
- Kopal (1959) Kopal Z (1959) Close binary systems
- Kovacs et al. (1990) Kovacs G, Kisvarsanyi EG, Buchler JR (1990) Cepheid radial velocity curves revisited. ApJ351:606–616, DOI 10.1086/168499
- Kudritzki et al (2003) Kudritzki RP, Bresolin F, Przybilla N (2003) A New Extragalactic Distance Determination Method Using the Flux-weighted Gravity of Late B and Early A Supergiants. ApJ582:L83–L86, DOI 10.1086/367690, astro-ph/0212042
- Kudritzki et al (2008) Kudritzki RP, Urbaneja MA, Bresolin F, Przybilla N, Gieren W, Pietrzyński G (2008) Quantitative Spectroscopy of 24 A Supergiants in the Sculptor Galaxy NGC 300: Flux-weighted Gravity-Luminosity Relationship, Metallicity, and Metallicity Gradient. ApJ681:269-289, DOI 10.1086/588647, 0803.3654
- Kudritzki et al. (2015) Kudritzki RP, Ho IT, Schruba A, Burkert A, Zahid HJ, Bresolin F, Dima GI (2015) The chemical evolution of local star-forming galaxies: radial profiles of ISM metallicity, gas mass, and stellar mass and constraints on galactic accretion and winds. MNRAS450:342–359, DOI 10.1093/mnras/stv522, 1503.01503
- Landini et al. (1984) Landini M, Natta A, Salinari P, Oliva E, Moorwood AFM (1984) A spectroscopic determination of the IR extinction curve in the direction of G333.6 - 0.2. A&A134:284–289
- Larson and Whittet (2005) Larson KA, Whittet DCB (2005) Reddening and the Extinction Law at High Galactic Latitude. ApJ623:897–910, DOI 10.1086/428877
- Launhardt et al. (2002) Launhardt R, Zylka R, Mezger PG (2002) The nuclear bulge of the Galaxy. III. Large-scale physical characteristics of stars and interstellar matter. A&A384:112–139, DOI 10.1051/0004-6361:20020017, astro-ph/0201294
- Lemasle et al. (2013) Lemasle B, François P, Genovali K, Kovtyukh VV, Bono G, Inno L, Laney CD, Kaper L, Bergemann M, Fabrizio M, Matsunaga N, Pedicelli S, Primas F, Romaniello M (2013) Galactic abundance gradients from Cepheids. and heavy elements in the outer disk. A&A558:A31, DOI 10.1051/0004-6361/201322115, 1308.3249
- Lindqvist et al. (1992) Lindqvist M, Habing HJ, Winnberg A (1992) OH/IR stars close to the Galactic Centre. II - Their spatial and kinematic properties and the mass distribution within 5-100 PC from the galactic centre. A&A259:118–127
- Luck and Lambert (2011) Luck RE, Lambert DL (2011) The Distribution of the Elements in the Galactic Disk. III. A Reconsideration of Cepheids from to . AJ142:136, DOI 10.1088/0004-6256/142/4/136, 1108.1947
- Lucy (1967) Lucy LB (1967) Gravity-Darkening for Stars with Convective Envelopes. ZAp65:89
- Lumsden and Puxley (1996) Lumsden SL, Puxley PJ (1996) Near-infrared spectroscopy of the ultracompact HII region G45.12+0.13. MNRAS281:493–508, DOI 10.1093/mnras/281.2.493, astro-ph/9603115
- Lutz (1999) Lutz D (1999) ISO observations of the Galactic Centre. In: Cox P, Kessler M (eds) The Universe as Seen by ISO, ESA Special Publication, vol 427, p 623
- Lutz et al. (1996) Lutz D, Feuchtgruber H, Genzel R, Kunze D, Rigopoulou D, Spoon HWW, Wright CM, Egami E, Katterloher R, Sturm E, Wieprecht E, Sternberg A, Moorwood AFM, de Graauw T (1996) SWS observations of the Galactic center. A&A315:L269–L272
- Lyngå and Palous (1987) Lyngå G, Palous J (1987) The local kinematics of open star clusters. A&A188:35–38
- Magrini et al. (2017) Magrini L, Randich S, Kordopatis G, Prantzos N, Romano D, Chieffi A, Limongi M, François P, Pancino E, Friel E, Bragaglia A, Tautvaišiene G, Spina L, Overbeek J, Cantat-Gaudin T, Donati P, Vallenari A, Sordo R, Jiménez-Esteban FM, Tang B, Drazdauskas A, Sousa S, Duffau S, Jofré P, Gilmore G, Feltzing S, Alfaro E, Bensby T, Flaccomio E, Koposov S, Lanzafame A, Smiljanic R, Bayo A, Carraro G, Casey AR, Costado MT, Damiani F, Franciosini E, Hourihane A, Lardo C, Lewis J, Monaco L, Morbidelli L, Sacco G, Sbordone L, Worley CC, Zaggia S (2017) The Gaia-ESO Survey: radial distribution of abundances in the Galactic disc from open clusters and young-field stars. A&A603:A2, DOI 10.1051/0004-6361/201630294, 1703.00762
- Maíz Apellániz (2015) Maíz Apellániz J (2015) Deriving extinction laws with O stars: from the IR to the UV. In: Cenarro AJ, Figueras F, Hernández-Monteagudo C, Trujillo Bueno J, Valdivielso L (eds) Highlights of Spanish Astrophysics VIII, pp 402–410, 1410.5184
- Majaess et al. (2008) Majaess DJ, Turner DG, Lane DJ (2008) Assessing potential cluster Cepheids from a new distance and reddening parametrization and Two Micron All Sky Survey photometry. MNRAS390:1539–1548, DOI 10.1111/j.1365-2966.2008.13834.x, 0808.2937
- Majaess et al. (2009) Majaess DJ, Turner DG, Lane DJ (2009) Characteristics of the Galaxy according to Cepheids. MNRAS398:263–270, DOI 10.1111/j.1365-2966.2009.15096.x, 0903.4206
- Majewski et al. (2017) Majewski SR, Schiavon RP, Frinchaboy PM, Allende Prieto C, Barkhouser R, Bizyaev D, Blank B, Brunner S, Burton A, Carrera R, Chojnowski SD, Cunha K, Epstein C, Fitzgerald G, García Pérez AE, Hearty FR, Henderson C, Holtzman JA, Johnson JA, Lam CR, Lawler JE, Maseman P, Mészáros S, Nelson M, Nguyen DC, Nidever DL, Pinsonneault M, Shetrone M, Smee S, Smith VV, Stolberg T, Skrutskie MF, Walker E, Wilson JC, Zasowski G, Anders F, Basu S, Beland S, Blanton MR, Bovy J, Brownstein JR, Carlberg J, Chaplin W, Chiappini C, Eisenstein DJ, Elsworth Y, Feuillet D, Fleming SW, Galbraith-Frew J, García RA, García-Hernández DA, Gillespie BA, Girardi L, Gunn JE, Hasselquist S, Hayden MR, Hekker S, Ivans I, Kinemuchi K, Klaene M, Mahadevan S, Mathur S, Mosser B, Muna D, Munn JA, Nichol RC, O’Connell RW, Parejko JK, Robin AC, Rocha-Pinto H, Schultheis M, Serenelli AM, Shane N, Silva Aguirre V, Sobeck JS, Thompson B, Troup NW, Weinberg DH, Zamora O (2017) The Apache Point Observatory Galactic Evolution Experiment (APOGEE). AJ154:94, DOI 10.3847/1538-3881/aa784d, 1509.05420
- Marco et al. (2014) Marco A, Negueruela I, González-Fernández C, Maíz Apellániz J, Dorda R, Clark JS (2014) VdBH 222: a starburst cluster in the inner Milky Way. A&A567:A73, DOI 10.1051/0004-6361/201423897, 1405.7266
- Martin and Whittet (1990) Martin PG, Whittet DCB (1990) Interstellar extinction and polarization in the infrared. ApJ357:113–124, DOI 10.1086/168896
- Matsunaga (2017) Matsunaga N (2017) Time-series surveys and pulsating stars: The near-infrared perspective. In: European Physical Journal Web of Conferences, European Physical Journal Web of Conferences, vol 152, p 01007, DOI 10.1051/epjconf/201715201007, 1705.02547
- Matsunaga et al. (2011) Matsunaga N, Kawadu T, Nishiyama S, Nagayama T, Kobayashi N, Tamura M, Bono G, Feast MW, Nagata T (2011) Three classical Cepheid variable stars in the nuclear bulge of the Milky Way. Nature477:188–190, DOI 10.1038/nature10359, 1111.6359
- Matsunaga et al. (2015) Matsunaga N, Fukue K, Yamamoto R, Kobayashi N, Inno L, Genovali K, Bono G, Baba J, Fujii MS, Kondo S, Ikeda Y, Hamano S, Nishiyama S, Nagata T, Aoki W, Tsujimoto T (2015) Kinematics of Classical Cepheids in the Nuclear Stellar Disk. ApJ799:46, DOI 10.1088/0004-637X/799/1/46, 1411.3789
- Matsunaga et al. (2016) Matsunaga N, Feast MW, Bono G, Kobayashi N, Inno L, Nagayama T, Nishiyama S, Matsuoka Y, Nagata T (2016) A lack of classical Cepheids in the inner part of the Galactic disc. MNRAS462:414–420, DOI 10.1093/mnras/stw1548, 1606.07943
- Matteucci and Recchi (2001) Matteucci F, Recchi S (2001) On the Typical Timescale for the Chemical Enrichment from Type Ia Supernovae in Galaxies. ApJ558:351–358, DOI 10.1086/322472, astro-ph/0105074
- McClure (2009) McClure M (2009) Observational 5-20 m Interstellar Extinction Curves Toward Star-Forming Regions Derived From Spitzer IRS Spectra. ApJ693:L81–L85, DOI 10.1088/0004-637X/693/2/L81, 0810.4561
- Mermilliod (1995) Mermilliod JC (1995) The database for galactic open clusters (BDA). In: Egret D, Albrecht MA (eds) Information & On-Line Data in Astronomy, Astrophysics and Space Science Library, vol 203, pp 127–138, DOI 10.1007/978-94-011-0397-8_12
- Messineo et al. (2005) Messineo M, Habing HJ, Menten KM, Omont A, Sjouwerman LO, Bertoldi F (2005) 86 GHz SiO maser survey of late-type stars in the inner Galaxy. III. Interstellar extinction and colours of the SiO targets. A&A435:575–585, DOI 10.1051/0004-6361:20040533, astro-ph/0503179
- Messineo et al (2016) Messineo M, Zhu Q, Menten KM, Ivanov VD, Figer DF, Kudritzki RP, Chen CHR (2016) Discovery of an Extraordinary Number of Red Supergiants in the Inner Galaxy. ApJ822:L5, DOI 10.3847/2041-8205/822/1/L5
- Messineo et al (2017) Messineo M, Zhu Q, Menten KM, Ivanov VD, Figer DF, Kudritzki RP, Chen CHR (2017) Red Supergiants in the Inner Galaxy: Stellar Properties. ApJ836:65, DOI 10.3847/1538-4357/836/1/65
- Metzger et al. (1991) Metzger MR, Caldwell JAR, McCarthy JK, Schechter PJ (1991) Radial velocities of 26 northern Milky Way Cepheids. ApJS76:803–811, DOI 10.1086/191581
- Metzger et al. (1998) Metzger MR, Caldwell JAR, Schechter PL (1998) The shape and scale of Galactic rotation from Cepheid kinematics. AJ115:635, DOI 10.1086/300198, astro-ph/9710055
- Minniti et al. (2010) Minniti D, Lucas PW, Emerson JP, Saito RK, Hempel M, Pietrukowicz P, Ahumada AV, Alonso MV, Alonso-Garcia J, Arias JI, Bandyopadhyay RM, Barbá RH, Barbuy B, Bedin LR, Bica E, Borissova J, Bronfman L, Carraro G, Catelan M, Clariá JJ, Cross N, de Grijs R, Dékány I, Drew JE, Fariña C, Feinstein C, Fernández Lajús E, Gamen RC, Geisler D, Gieren W, Goldman B, Gonzalez OA, Gunthardt G, Gurovich S, Hambly NC, Irwin MJ, Ivanov VD, Jordán A, Kerins E, Kinemuchi K, Kurtev R, López-Corredoira M, Maccarone T, Masetti N, Merlo D, Messineo M, Mirabel IF, Monaco L, Morelli L, Padilla N, Palma T, Parisi MC, Pignata G, Rejkuba M, Roman-Lopes A, Sale SE, Schreiber MR, Schröder AC, Smith M, LS Jr, Soto M, Tamura M, Tappert C, Thompson MA, Toledo I, Zoccali M, Pietrzynski G (2010) VISTA Variables in the Via Lactea (VVV): The public ESO near-IR variability survey of the Milky Way. New A15:433–443, DOI 10.1016/j.newast.2009.12.002, 0912.1056
- Moore et al. (2005) Moore TJT, Lumsden SL, Ridge NA, Puxley PJ (2005) The near-infrared extinction law in regions of high AV. MNRAS359:589–596, DOI 10.1111/j.1365-2966.2005.08923.x, astro-ph/0502407
- Nandy (1965) Nandy K (1965) Interstellar Obscuration. Nature208:274–275, DOI 10.1038/208274a0
- Naoi et al. (2006) Naoi T, Tamura M, Nakajima Y, Nagata T, Suto H, Murakawa K, Kandori R, Sasaki S, Baba D, Kato D, Kurita M, Nagashima C, Nagayama T, Nakaya H, Nishiyama S, Oasa Y, Sato S, Sugitani K (2006) Near-Infrared Extinction Law in the Ophiuchi and Chamaeleon Dark Clouds. ApJ640:373–382, DOI 10.1086/500112
- Naoi et al. (2007) Naoi T, Tamura M, Nagata T, Nakajima Y, Suto H, Murakawa K, Kandori R, Sasaki S, Nishiyama S, Oasa Y, Sugitani K (2007) Near-Infrared Extinction in the Coalsack Globule 2. ApJ658:1114–1118, DOI 10.1086/512030, astro-ph/0612620
- Ness et al. (2015) Ness M, Hogg DW, Rix HW, Ho AYQ, Zasowski G (2015) The Cannon: A data-driven approach to Stellar Label Determination. ApJ808:16, DOI 10.1088/0004-637X/808/1/16, 1501.07604
- Ness et al. (2016) Ness M, Hogg DW, Rix HW, Martig M, Pinsonneault MH, Ho AYQ (2016) Spectroscopic Determination of Masses (and Implied Ages) for Red Giants. ApJ823:114, DOI 10.3847/0004-637X/823/2/114, 1511.08204
- Nishiyama et al. (2006) Nishiyama S, Nagata T, Kusakabe N, Matsunaga N, Naoi T, Kato D, Nagashima C, Sugitani K, Tamura M, Tanabé T, Sato S (2006) Interstellar Extinction Law in the J, H, and Ks Bands toward the Galactic Center. ApJ638:839–846, DOI 10.1086/499038, astro-ph/0601174
- Nishiyama et al (2008) Nishiyama S, Nagata T, Tamura M, Kandori R, Hatano H, Sato S, Sugitani K (2008) The Interstellar Extinction Law toward the Galactic Center. II. V, J, H, and Ks Bands. ApJ680:1174-1179, DOI 10.1086/587791, 0802.3559
- Nishiyama et al. (2009) Nishiyama S, Tamura M, Hatano H, Kato D, Tanabé T, Sugitani K, Nagata T (2009) Interstellar Extinction Law Toward the Galactic Center III: J, H, KS Bands in the 2MASS and the MKO Systems, and 3.6, 4.5, 5.8, 8.0 m in the Spitzer/IRAC System. ApJ696:1407–1417, DOI 10.1088/0004-637X/696/2/1407, 0902.3095
- Olofsson and Olofsson (2011) Olofsson S, Olofsson G (2011) The mid-infrared extinction in molecular clouds. Case study of B 335. A&A534:A127, DOI 10.1051/0004-6361/201015564, 1112.0155
- Origlia et al. (2013) Origlia L, Oliva E, Maiolino R, Mucciarelli A, Baffa C, Biliotti V, Bruno P, Falcini G, Gavriousev V, Ghinassi F, Giani E, Gonzalez M, Leone F, Lodi M, Massi F, Montegriffo P, Mochi I, Pedani M, Rossetti E, Scuderi S, Sozzi M, Tozzi A (2013) GIANO-TNG spectroscopy of red supergiants in the young star cluster RSGC2. A&A560:A46, DOI 10.1051/0004-6361/201322586, 1311.1639
- Origlia et al. (2016) Origlia L, Oliva E, Sanna N, Mucciarelli A, Dalessandro E, Scuderi S, Baffa C, Biliotti V, Carbonaro L, Falcini G, Giani E, Iuzzolino M, Massi F, Sozzi M, Tozzi A, Ghedina A, Ghinassi F, Lodi M, Harutyunyan A, Pedani M (2016) GIANO-TNG spectroscopy of red supergiants in the young star cluster RSGC3. A&A585:A14, DOI 10.1051/0004-6361/201526649, 1510.06870
- Parsa et al. (2017) Parsa M, Eckart A, Shahzamanian B, Karas V, Zajaček M, Zensus JA, Straubmeier C (2017) Investigating the Relativistic Motion of the Stars Near the Supermassive Black Hole in the Galactic Center. ApJ845:22, DOI 10.3847/1538-4357/aa7bf0, 1708.03507
- Pont et al. (1997) Pont F, Queloz D, Bratschi P, Mayor M (1997) Rotation of the outer disc from classical cepheids. A&A318:416–428
- Porquet et al (2008) Porquet D, Grosso N, Predehl P, Hasinger G, Yusef-Zadeh F, Aschenbach B, Trap G, Melia F, Warwick RS, Goldwurm A, Bélanger G, Tanaka Y, Genzel R, Dodds-Eden K, Sakano M, Ferrando P (2008) X-ray hiccups from Sagittarius A* observed by XMM-Newton. The second brightest flare and three moderate flares caught in half a day. A&A488:549–557, DOI 10.1051/0004-6361:200809986, 0806.4088
- Racca et al. (2002) Racca G, Gómez M, Kenyon SJ (2002) A Near-Infrared Imaging Survey of Coalsack Globule 2. AJ124:2178–2184, DOI 10.1086/342738, astro-ph/0207099
- Reddy et al. (2016) Reddy ABS, Lambert DL, Giridhar S (2016) The evolution of the Milky Way: new insights from open clusters. MNRAS463:4366–4382, DOI 10.1093/mnras/stw2287, 1609.02619
- Reid and Honma (2014) Reid MJ, Honma M (2014) Microarcsecond Radio Astrometry. ARA&A52:339–372, DOI 10.1146/annurev-astro-081913-040006, 1312.2871
- Reid et al. (2009) Reid MJ, Menten KM, Zheng XW, Brunthaler A, Moscadelli L, Xu Y, Zhang B, Sato M, Honma M, Hirota T, Hachisuka K, Choi YK, Moellenbrock GA, Bartkiewicz A (2009) Trigonometric Parallaxes of Massive Star-Forming Regions. VI. Galactic Structure, Fundamental Parameters, and Noncircular Motions. ApJ700:137-148, DOI 10.1088/0004-637X/700/1/137, 0902.3913
- Reid et al. (2014) Reid MJ, Menten KM, Brunthaler A, Zheng XW, Dame TM, Xu Y, Wu Y, Zhang B, Sanna A, Sato M, Hachisuka K, Choi YK, Immer K, Moscadelli L, Rygl KLJ, Bartkiewicz A (2014) Trigonometric Parallaxes of High Mass Star Forming Regions: The Structure and Kinematics of the Milky Way. ApJ783:130, DOI 10.1088/0004-637X/783/2/130, 1401.5377
- Rieke and Lebofsky (1985) Rieke GH, Lebofsky MJ (1985) The interstellar extinction law from 1 to 13 microns. ApJ288:618–621, DOI 10.1086/162827
- Román-Zúñiga et al. (2007) Román-Zúñiga CG, Lada CJ, Muench A, Alves JF (2007) The Infrared Extinction Law at Extreme Depth in a Dark Cloud Core. ApJ664:357–362, DOI 10.1086/518928, 0704.3203
- Rucinski (1994) Rucinski SM (1994) MV = MV(log P, log Te) calibrations for W Ursae Majoris systems. PASP106:462–471, DOI 10.1086/133401
- Rucinski (2001) Rucinski SM (2001) The Photometric Amplitude and Mass Ratio Distributions of Contact Binary Stars. AJ122:1007–1022, DOI 10.1086/321153, astro-ph/0104483
- Rucinski (2004) Rucinski SM (2004) Contact binary stars of the W UMa-type as distance tracers. New A Rev.48:703–709, DOI 10.1016/j.newar.2004.03.005, astro-ph/0311085
- Rucinski (2006) Rucinski SM (2006) Luminosity function of contact binaries based on the All Sky Automated Survey (ASAS). MNRAS368:1319–1322, DOI 10.1111/j.1365-2966.2006.10207.x, astro-ph/0602045
- Rucinski and Duerbeck (1997) Rucinski SM, Duerbeck HW (1997) Absolute Magnitude Calibration for the W UMa-Type Systems Based on HIPPARCOS Data. PASP109:1340–1350, DOI 10.1086/134014, astro-ph/9710214
- Salaris and Girardi (2002) Salaris M, Girardi L (2002) Population effects on the red giant clump absolute magnitude: the K band. MNRAS337:332–340, DOI 10.1046/j.1365-8711.2002.05917.x, astro-ph/0208057
- Sandage and Tammann (2006) Sandage A, Tammann GA (2006) Absolute Magnitude Calibrations of Population I and II Cepheids and Other Pulsating Variables in the Instability Strip of the Hertzsprung-Russell Diagram. ARA&A44:93–140, DOI 10.1146/annurev.astro.43.072103.150612
- Sanna et al (2017) Sanna A, Reid MJ, Dame TM, Menten KM, Brunthaler A (2017) Mapping spiral structure on the far side of the Milky Way. Science 358:227–230, DOI 10.1126/science.aan5452, 1710.06489
- Schödel et al. (2010) Schödel R, Najarro F, Muzic K, Eckart A (2010) Peering through the veil: near-infrared photometry and extinction for the Galactic nuclear star cluster. Accurate near infrared H, Ks, and L’ photometry and the near-infrared extinction-law toward the central parsec of the Galaxy. A&A511:A18, DOI 10.1051/0004-6361/200913183
- Schönrich and Binney (2009) Schönrich R, Binney J (2009) Chemical evolution with radial mixing. MNRAS396:203–222, DOI 10.1111/j.1365-2966.2009.14750.x, 0809.3006
- Schultheis et al. (2015) Schultheis M, Kordopatis G, Recio-Blanco A, de Laverny P, Hill V, Gilmore G, Alfaro EJ, Costado MT, Bensby T, Damiani F, Feltzing S, Flaccomio E, Lardo C, Jofre P, Prisinzano L, Zaggia S, Jimenez-Esteban F, Morbidelli L, Lanzafame AC, Hourihane A, Worley C, Francois P (2015) The Gaia-ESO Survey: Tracing interstellar extinction. A&A577:A77, DOI 10.1051/0004-6361/201425333, 1502.03223
- Sellwood and Binney (2002) Sellwood JA, Binney JJ (2002) Radial mixing in galactic discs. MNRAS336:785–796, DOI 10.1046/j.1365-8711.2002.05806.x, astro-ph/0203510
- Sevenster et al. (2000) Sevenster MN, Dejonghe H, Van Caelenberg K, Habing HJ (2000) Distribution functions for evolved stars in the inner galactic plane. A&A355:537–551, astro-ph/0001073
- Soszyński et al. (2017) Soszyński I, Udalski A, Szymański MK, Wyrzykowski Ł, Ulaczyk K, Poleski R, Pietrukowicz P, Kozlowski S, Skowron D, Skowron J, Mróz P, Pawlak M, Rybicki K, Jacyszyn-Dobrzeniecka A (2017) The OGLE Collection of Variable Stars. Classical, Type II, and Anomalous Cepheids Toward the Galactic Center. ArXiv e-prints 1712.01307
- Stead and Hoare (2009) Stead JJ, Hoare MG (2009) The slope of the near-infrared extinction law. MNRAS400:731–742, DOI 10.1111/j.1365-2966.2009.15530.x, 0908.1601
- Subramanian et al. (2017) Subramanian S, Marengo M, Bhardwaj A, Huang Y, Inno L, Nakagawa A, Storm J (2017) Young and Intermediate-Age Distance Indicators. Space Sci. Rev.212:1817–1869, DOI 10.1007/s11214-017-0427-8, 1709.07265
- Takeda et al. (2013) Takeda Y, Kang DI, Han I, Lee BC, Kim KM (2013) C, N, O and Na abundances of Cepheid variables: implications on the mixing process in the envelope. MNRAS432:769–792, DOI 10.1093/mnras/stt528, 1303.6593
- Tammann et al. (2003) Tammann GA, Sandage A, Reindl B (2003) New Period-Luminosity and Period-Color relations of classical Cepheids: I. Cepheids in the Galaxy. A&A404:423–448, DOI 10.1051/0004-6361:20030354, astro-ph/0303378
- Tanioka et al. (2017) Tanioka S, Matsunaga N, Fukue K, Inno L, Bono G, Kobayashi N (2017) New Classical Cepheids in the Inner Part of the Northern Galactic Disk, and Their Kinematics. ApJ842:104, DOI 10.3847/1538-4357/aa7260, 1705.02571
- Tsarevsky et al. (1966) Tsarevsky GS, Ureche V, Efremov YN (1966) A search for cepheids - New possible members of open clusters: preliminary results. Astronomicheskij Tsirkulyar 367:1–3
- Tsujimoto et al. (1995) Tsujimoto T, Yoshii Y, Nomoto K, Shigeyama T (1995) Abundance gradients in the star-forming viscous disk and chemical properties of the bulge. A&A302:704
- Tsujimoto et al. (2010) Tsujimoto T, Bland-Hawthorn J, Freeman KC (2010) Evidence of Early Enrichment of the Galactic Disk by Large-Scale Winds. PASJ62:447–456, DOI 10.1093/pasj/62.2.447, 1002.3181
- Turner (1986) Turner DG (1986) Galactic clusters with associated Cepheid variables. I - NGC 6087 and S Normae. AJ92:111–118, DOI 10.1086/114141
- Turner (1989) Turner DG (1989) Comments on the cluster main-sequence fitting method. III - Empirical UBV reddening lines for early-type stars. AJ98:2300–2305, DOI 10.1086/115300
- Turner (2010) Turner DG (2010) The PL calibration for Milky Way Cepheids and its implications for the distance scale. Ap&SS326:219–231, DOI 10.1007/s10509-009-0258-5, 0912.4864
- Turner (2011) Turner DG (2011) The usefulness of 2MASS JHKs photometry for open cluster studies. Rev. Mexicana Astron. Astrofis.47:127–137, 1102.0347
- Turner et al. (1993) Turner DG, van den Bergh S, Younger PF, Danks TA, Forbes D (1993) A search for OB associates near southern long-period Cepheids. IV - XY Carinae, GT Carinae, WZ Sagittarii, and SW Velorum. ApJS85:119–136, DOI 10.1086/191756
- Twarog et al. (1997) Twarog BA, Ashman KM, Anthony-Twarog BJ (1997) Some Revised Observational Constraints on the Formation and Evolution of the Galactic Disk. AJ114:2556, DOI 10.1086/118667, astro-ph/9709122
- Udalski (2017) Udalski A (2017) OGLE Cepheids and RR Lyrae Stars in the Milky Way. ArXiv e-prints 1703.02980
- van den Bergh (1957) van den Bergh S (1957) A search for Cepheids in galactic clusters. ApJ126:323, DOI 10.1086/146404
- van Hamme and Wilson (1985) van Hamme W, Wilson RE (1985) Accuracy of close binary mass determinations from parallaxes. Ap&SS110:169–175, DOI 10.1007/BF00660626
- Vasilyev et al (2018) Vasilyev V, Ludwig HG, Freytag B, Lemasle B, Marconi M (2018) Spectroscopic properties of a two-dimensional time-dependent Cepheid model. II. Determination of stellar parameters and abundances. A&A611:A19, DOI 10.1051/0004-6361/201732201, 1711.00236
- Wang and Jiang (2014) Wang S, Jiang BW (2014) Universality of the Near-infrared Extinction Law Based on the APOGEE Survey. ApJ788:L12, DOI 10.1088/2041-8205/788/1/L12
- Wang et al. (2013) Wang S, Gao J, Jiang BW, Li A, Chen Y (2013) The Mid-infrared Extinction Law and its Variation in the Coalsack Nebula. ApJ773:30, DOI 10.1088/0004-637X/773/1/30, 1306.4441
- Wang et al. (2017) Wang S, Chen X, de Grijs R, Deng L (2017) The Near-infrared Optimal Distances Method Applied to Galactic Classical Cepheids Tightly Constrains Mid-infrared Period–Luminosity Relations. ArXiv e-prints 1711.06966
- Weingartner and Draine (2001) Weingartner JC, Draine BT (2001) Dust Grain-Size Distributions and Extinction in the Milky Way, Large Magellanic Cloud, and Small Magellanic Cloud. ApJ548:296–309, DOI 10.1086/318651, astro-ph/0008146
- Whitelock et al. (2008) Whitelock PA, Feast MW, Van Leeuwen F (2008) AGB variables and the Mira period-luminosity relation. MNRAS386:313–323, DOI 10.1111/j.1365-2966.2008.13032.x, 0801.4465
- Whittet et al. (1993) Whittet DCB, Martin PG, Fitzpatrick EL, Massa D (1993) Interstellar extinction in the infrared - The molecular cloud toward HD 62542. ApJ408:573–578, DOI 10.1086/172615
- Windmark et al. (2011) Windmark F, Lindegren L, Hobbs D (2011) Using Galactic Cepheids to verify Gaia parallaxes. A&A530:A76, DOI 10.1051/0004-6361/201116929, 1104.2348
- Xue et al. (2016) Xue M, Jiang BW, Gao J, Liu J, Wang S, Li A (2016) A Precise Determination of the Mid-infrared Interstellar Extinction Law Based on the APOGEE Spectroscopic Survey. ApJS224:23, DOI 10.3847/0067-0049/224/2/23, 1602.02928
- Yang and Jiang (2012) Yang M, Jiang BW (2012) The Period-Luminosity Relation of Red Supergiant Stars in the Small Magellanic Cloud. ApJ754:35, DOI 10.1088/0004-637X/754/1/35, 1205.1275
- Zasowski et al. (2009) Zasowski G, Majewski SR, Indebetouw R, Meade MR, Nidever DL, Patterson RJ, Babler B, Skrutskie MF, Watson C, Whitney BA, Churchwell E (2009) Lifting the Dusty Veil with Near- and Mid-Infrared Photometry. II. A Large-Scale Study of the Galactic Infrared Extinction Law. ApJ707:510–523, DOI 10.1088/0004-637X/707/1/510, 0910.4403
- Zhang et al. (2013) Zhang B, Reid MJ, Menten KM, Zheng XW, Brunthaler A, Dame TM, Xu Y (2013) Parallaxes for W49N and G048.60+0.02: Distant Star Forming Regions in the Perseus Spiral Arm. ApJ775:79, DOI 10.1088/0004-637X/775/1/79, 1312.3856