Resolving the nuclear obscuring disk in the Compton-thick Seyfert galaxy NGC 5643 with ALMA
Abstract
We present ALMA Band 6 12CO(2–1) line and rest-frame 232 GHz continuum observations of the nearby Compton-thick Seyfert galaxy NGC 5643 with angular resolutions (pc). The CO(2–1) integrated line map reveals emission from the nuclear and circumnuclear region with a two-arm nuclear spiral extending on each side. The circumnuclear CO(2–1) kinematics can be fitted with a rotating disk, although there are regions with large residual velocities and/or velocity dispersions. The CO(2–1) line profiles of these regions show two different velocity components. One is ascribed to the circular component and the other to the interaction of the AGN outflow, as traced by the [O iii]5007Å emission, with molecular gas in the disk a few hundred parsecs from the AGN. On nuclear scales, we detected an inclined CO(2–1) disk (diameter 26 pc, FWHM) oriented almost in a north-south direction. The CO(2–1) nuclear kinematics can be fitted with a rotating disk which appears to be tilted with respect to the large scale disk. There are strong non-circular motions in the central with velocities of up to . In the absence of a nuclear bar, these motions could be explained as radial outflows in the nuclear disk. We estimate a total molecular gas mass for the nuclear disk of and an H2 column density toward the location of the AGN of , for a standard CO-to-H2 conversion factor. We interpret this nuclear molecular gas disk as the obscuring torus of NGC 5643 as well as the collimating structure of the ionization cone.
1 Introduction
The key piece of the Unified Model for active galactic nuclei (AGN) is the torus of dust and molecular gas that obscures the direct view of the AGN along certain lines of sight and explains the observational properties of AGN (Antonucci, 1993). ALMA observations detected the torus in the nearby Seyfert NGC 1068 in both cold dust and molecular line emission (García-Burillo et al., 2016; Gallimore et al., 2016; Imanishi et al., 2018). The measured torus diameter at different ALMA molecular transitions and dust continuum (pc) is approximately a factor of two larger than the size derived from the modelling of the nuclear unresolved near-to-mid infrared emission (Ramos Almeida et al., 2011; Alonso-Herrero et al., 2011; Ichikawa et al., 2015) and mid-infrared interferometry (Tristram et al., 2009; Burtscher et al., 2013; López-Gonzaga et al., 2014). Therefore, the full extent of the torus is larger than that of the warm dust probed by the near and mid-infrared continuum. Indeed, Fuller et al. (2016) showed that when including data to m the parameterization of the torus does indeed alter, further demonstrating the need for a broad wavelength sampling of the torus emission.
Cold molecular gas is detected in the nuclear and circumnuclear regions of nearby Seyfert galaxies on physical scales of tens to hundreds of parsecs (e.g., Tacconi et al., 1994; Schinnerer et al., 2000; Krips et al., 2007; García-Burillo et al., 2005, 2014; Sani et al., 2012; Combes et al., 2013; Izumi et al., 2016; Lin et al., 2016; Zschaechner et al., 2016; Salak et al., 2017). This gas is believed to be associated with the AGN fuelling processes. Indeed, in local AGN the hot (K, see Mouri, 1994) molecular gas, as traced by the near-IR rovibrational m 1–0 S(1) H2 line, is more centrally concentrated than in non active galaxies and believed to be related to the Unified Model obscuring torus (Hicks et al., 2009, 2013).
A natural consequence of the accumulation of material in the central regions of active galaxies is the presence of nuclear ( pc) on-going/recent star formation activity (e.g., Davies et al., 2007; Esquej et al., 2014). Since the nuclear star formation rate is found to be correlated with the velocity dispersion of the nuclear hot molecular gas disks (Hicks et al., 2013), then the nuclear molecular gas disks could be maintained by inflows of material into the nuclear region and/or by intense, short-lived nuclear star formation through stellar feedback.
We have started several ALMA programs to observe the cold molecular gas in the nuclear and circumnuclear regions of a hard X-ray selected sample of nearby Seyfert galaxies drawn from the X-ray Swift/BAT all sky 70 month catalog (Baumgartner et al., 2013). The goal of these ALMA programs is to understand the connections between the cold and hot molecular gas, the AGN torus and nuclear/circumnuclear star formation activity in AGN. As explained above, the near-infrared H2 lines provide useful information about the morphology and kinematics of the hot molecular gas in the nuclear regions of Seyfert galaxies. However, they only probe a small fraction of the total molecular gas fraction in galaxies (see e.g., Dale et al., 2005).
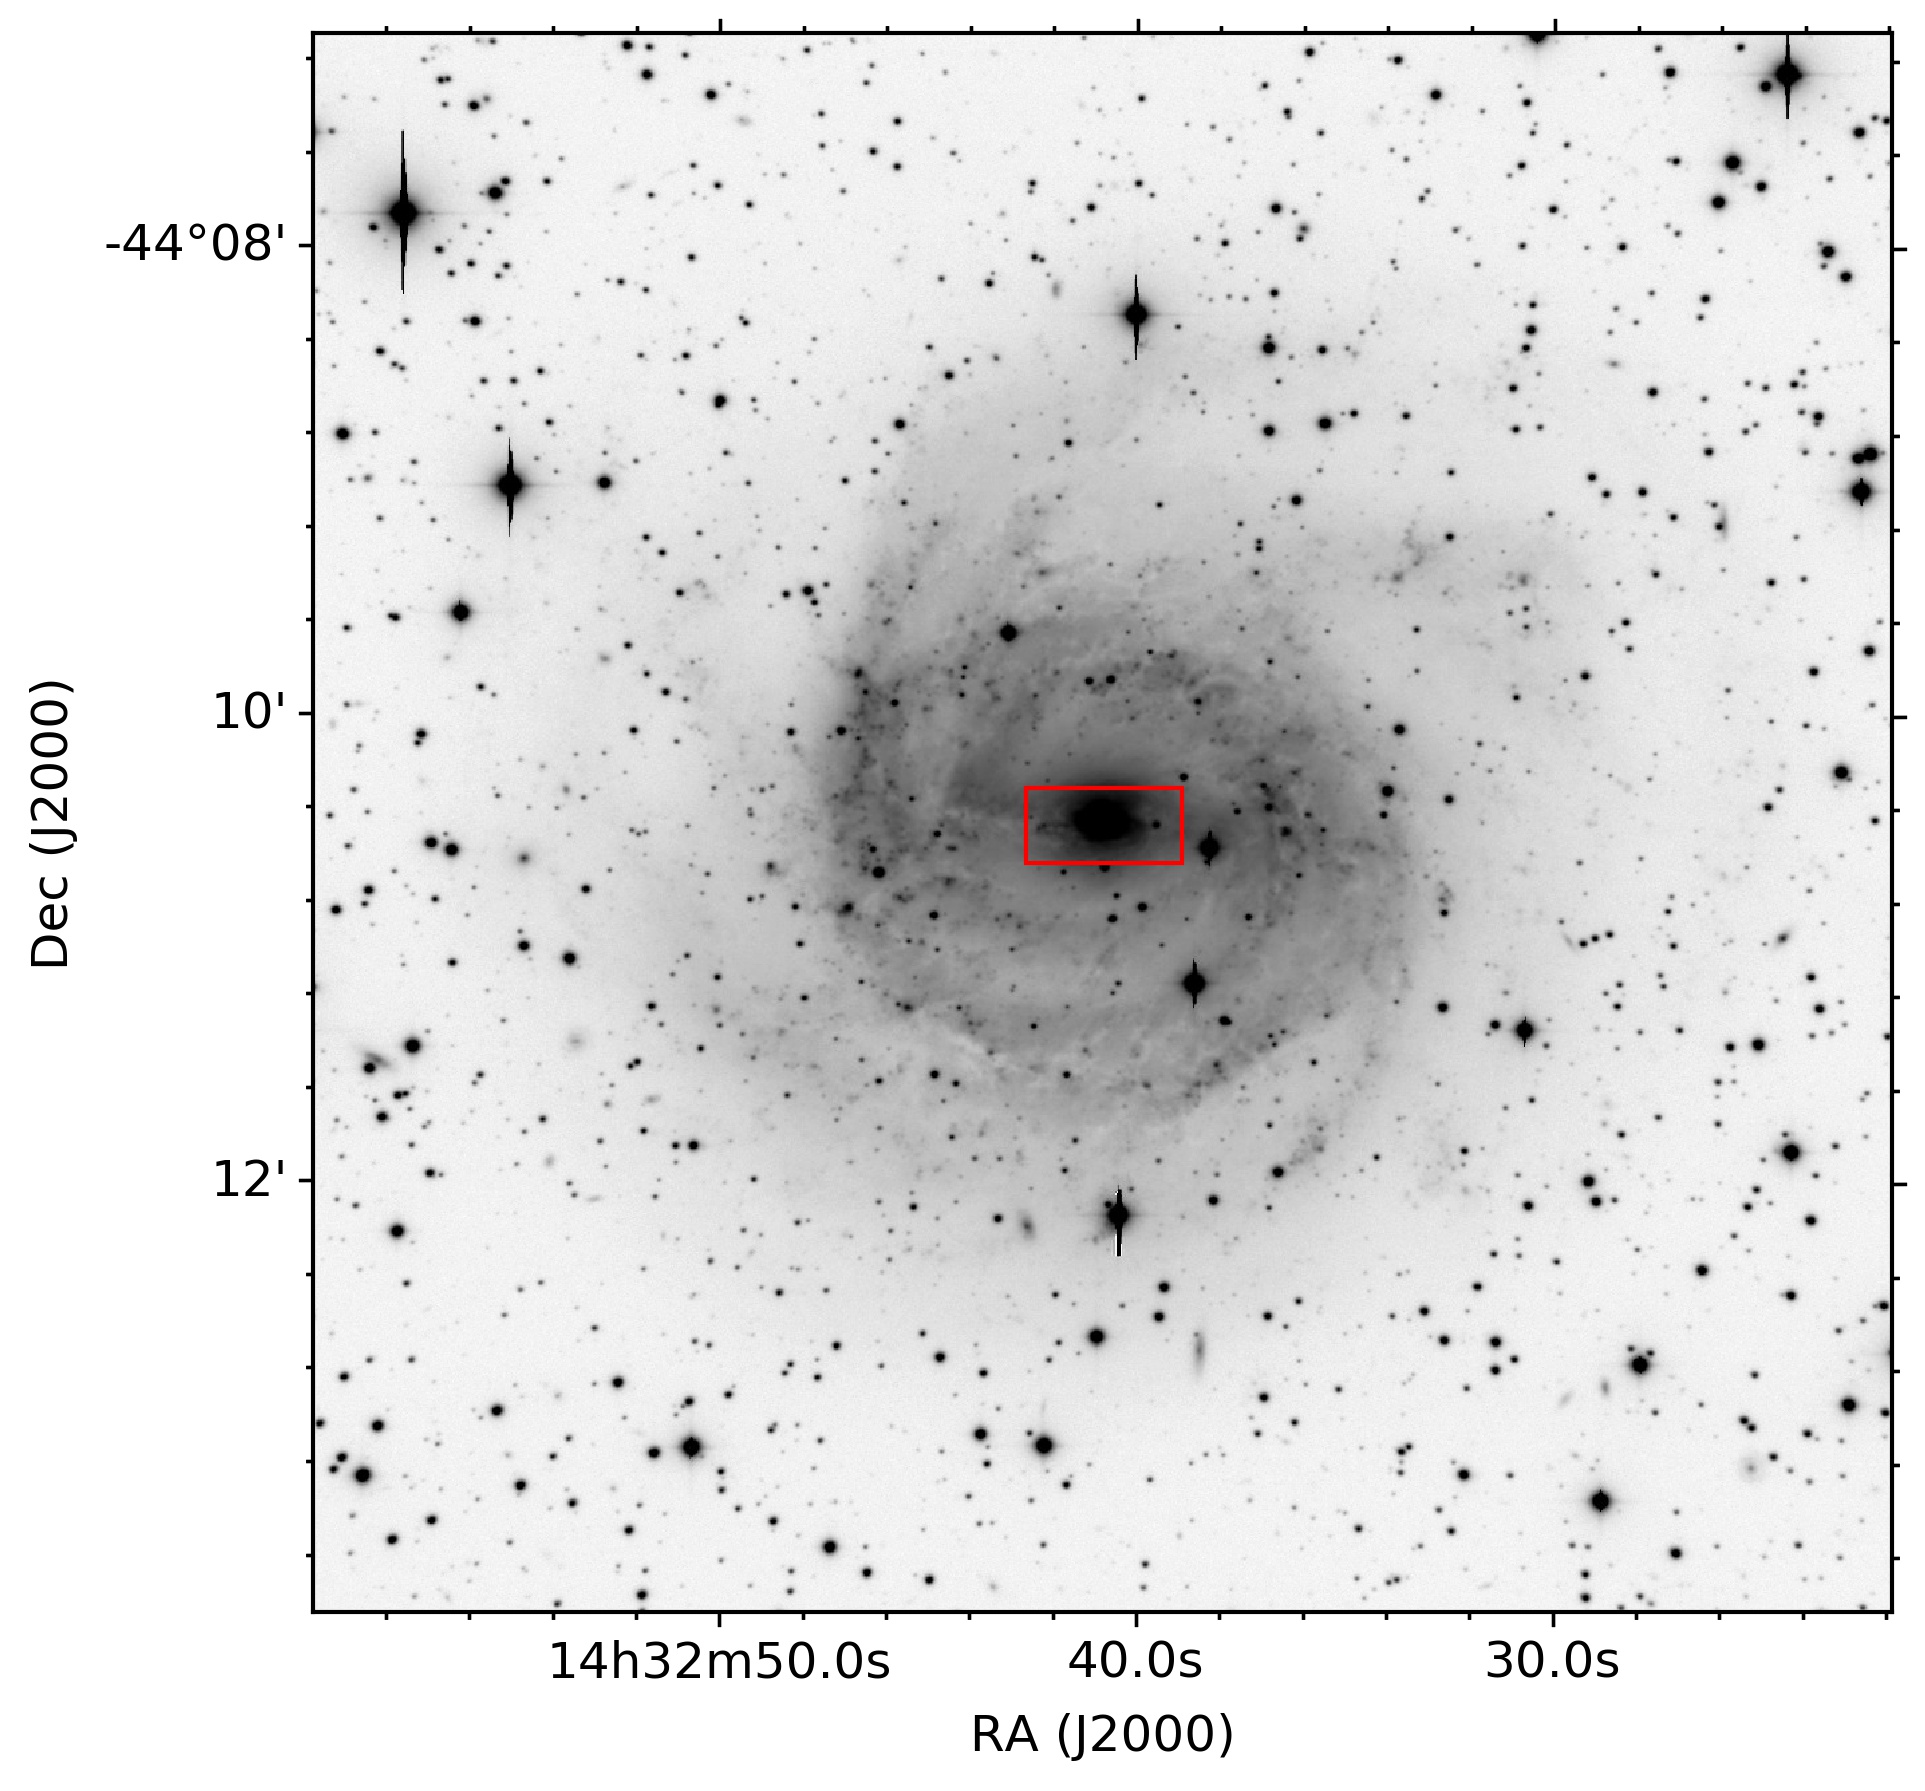
In this work we present ALMA Band 6 continuum and 12CO(2–1) observations of the nearby (Mpc, pc) Seyfert 2 galaxy NGC 5643. Although this galaxy is classified as an SAB(rs)c, it has a large-scale stellar bar identified in the near-infrared (Mulchaey et al., 1997; Jungwiert et al., 1997). It is a Compton-thick (see Guainazzi et al., 2004; Ricci et al., 2015; Annuar et al., 2015) galaxy with a moderate intrinsic X-ray luminosity (). Optical broad lines in polarized light have not been detected in this galaxy (Ramos Almeida et al., 2016). These authors explained it as a combination of its Compton-thick nature and relatively low AGN luminosity or different properties of the scattering material.
The m 1–0 S(1) H2 hot molecular gas in the central region of NGC 5643 shows anomalous kinematics in an area at about northeast of the nucleus with high velocity dispersion (Davies et al., 2014). This might be a signature of the presence of molecular gas being excited near the edge of the ionization cone traced by the optical [O iii]5007Å line (Simpson et al., 1997). The radio emission of NGC 5643 shows an almost east-west orientation extending for about 30″ on both sides of the nucleus (Morris et al., 1985; Leipski et al., 2006). This radio structure appears to be impacting on the disk on the east side of the galaxy producing positive feedback as revealed by the presence of H ii regions at approximately 5 and 10″ east of the nucleus (Cresci et al., 2015). The soft X-ray emission is also extended and mostly detected in the east side of the galaxy following the [O iii] emission (Bianchi et al., 2006; Gómez-Guijarro et al., 2017).
The paper is organized as follows. Section 2 describes the ALMA observations as well as archival optical integral field spectroscopy. In Sections 3 and 4 we present the analysis of the ALMA CO(2–1) morphology and kinematics of the circumnuclear and nuclear region of NGC 5643, respectively. In Section 5 we discuss the results and give our conclusions.
2 Observations
2.1 ALMA Band 6 observations
We obtained Band 6 ALMA observations of NGC 5643 on 24 December 2016 and 18 July 2017 using the 12-m array in compact (baselines between 15 and 492 m) and extended (baselines between 17 and 3700 m) configurations through the project 2016.1.00254.S (PI: A. Alonso-Herrero). The on-source integrations times were 11 and 36 min, respectively. We defined two spectral windows of 1.875 GHz bandwidth (3.9 MHz 5 km/s channels), namely one at 228 GHz at the observed frequency of the 12CO(2–1) transition and the other at observed frequency of 230 GHz to measure the sub-millimeter continuum.
We calibrated the data using the ALMA reduction software CASA (v.4.7; McMullin et al. 2007). For both configurations, we used J1427-4206 as bandpass and phase calibrator. The amplitude was calibrated using J1427-4206 for the extended configuration assuming a flux density of 1.92 Jy at 228.6 GHz and a spectral index of –0.59. For the compact configuration, we used Callisto as amplitude calibrator assuming the Butler-JPL-Horizons 2012 model.
For the CO(2–1) spectral window, we subtracted the continuum (rest-frame 232 GHz) in the plane by fitting the continuum with a constant in the line free channels. Then, we combined and cleaned the data from the two configurations using the CASA clean task. The output frequency reference frame was set to the kinematic local standard of rest (LSRK).
We produced three sets of cleaned data For the first one we used natural weight to emphasize the large scale emission of NGC 5643. For the other two we used the Briggs weighting (Briggs, 1995), with robustness parameters of and to increase sequentially the angular resolution at slightly decreased sensitivity. For the data set we kept the original spacings of the frequency channel whereas for the set we rebinned the data by a factor of 3 in frequency to increase the signal-to-noise ratio. This resulted in an approximate resolution in velocities of 5 km s-1 and CO(2–1) full-width half-maximum (FWHM) of 016011 with beam position angle () of –67° for the data set, and 15 km s-1 and FWHM of 026017 with ° for the data set. For the continuum images, the beams FWHM are 016010 at for and and 023013 at for . The pixel sizes were set to 003 and 004 to properly sample the beam sizes, for the and data sets, respectively. The achieved 1 sensitivities are 1.2 and 0.5 mJy beam-1 channel-1 in the CO(2–1) cubes and 76 and 37 Jy beam-1 in the continuum images for the and data sets respectively. For all three data cubes we produced maps of the CO(2–1) integrated intensity, mean velocity field and velocity dispersion. For all these maps we used pixels at all frequencies with detections . We applied the primary beam (FWHM=27″) correction to the data.
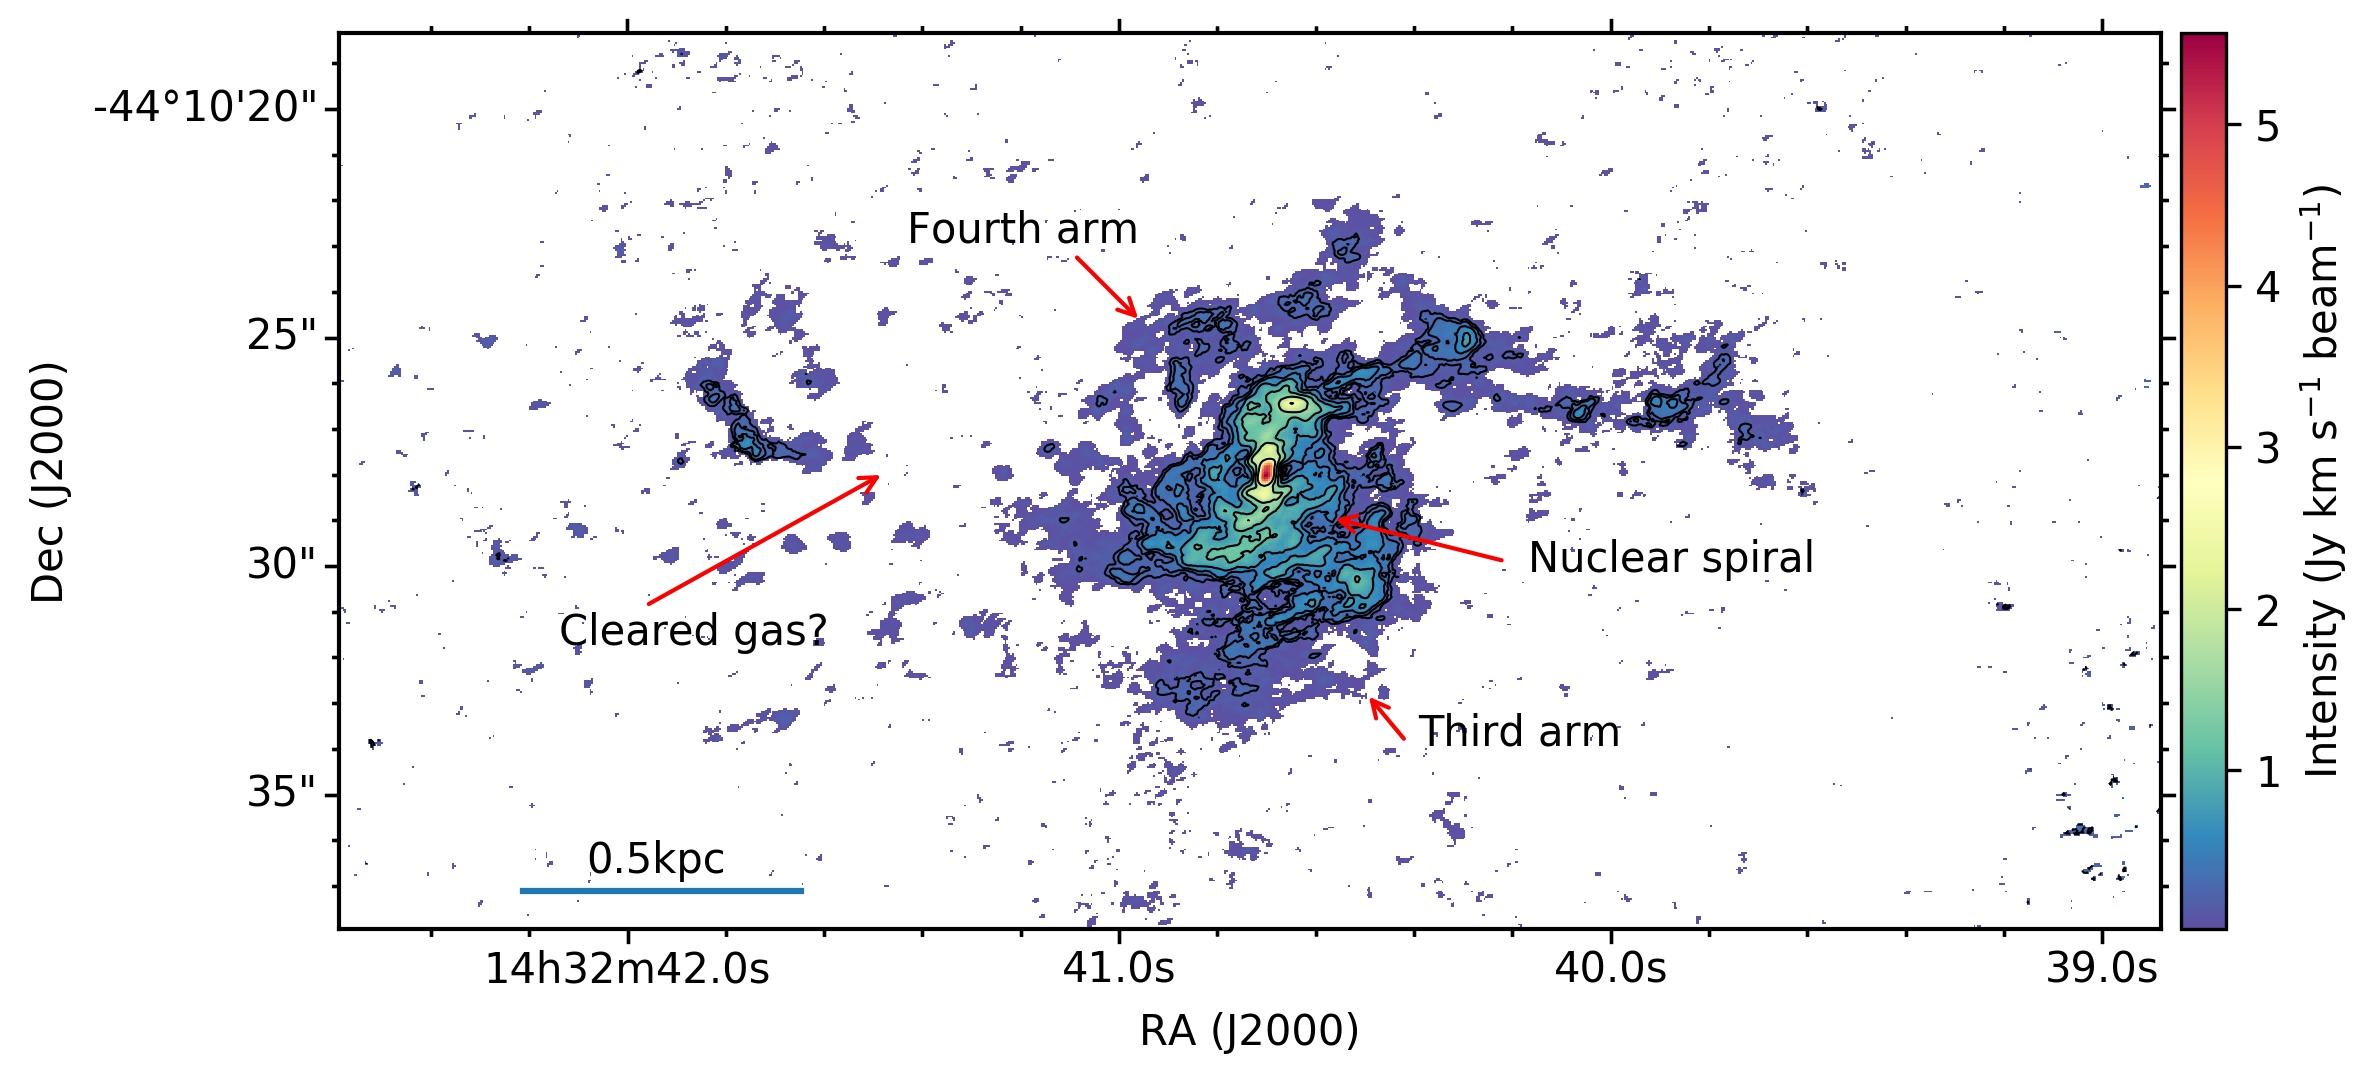
In Figure 1 (lower panel) we show the integrated CO(2–1) molecular line map created with the natural-weight data. The field of view (FoV) is approximately () with an angular resolution of at . We note that the primary beam of the observations is smaller than this FoV. However, most of the detected emission is well inside the FoV of the primary beam. The line map shows a bright nuclear source, a nuclear two-arm spiral already seen in optical to near-IR color maps as a dusty nuclear spiral extending for several arcseconds (Quillen et al., 1999; Martini et al., 2003; Davies et al., 2014) as well as emission in the spiral arms on larger scales. We measure a CO(2–1) line intensity over a region of 480 Jy km s-1. For comparison the single-dish measurement for a beam size of is Jy km s-1 (Monje et al., 2011). Thus we recovered approximately 50% of the single-dish observation flux which is typical of this kind of comparisons.
2.2 Archival VLT/MUSE integral field spectroscopy
NGC 5643 was observed with the Multi Unit Spectroscopic Explorer (MUSE, Bacon et al., 2010) on the Very Large Telescope (VLT) of the European Southern Observatory (ESO) on 12 May 2015. These observations were part of the program 095.B-0532(A) (PI: Carollo). We downloaded the pipeline processed data cube from the ESO data archive. We estimate a seeing of 05 from the foreground stars in the FoV. Four dithered exposures of 875 s were taken and later combined into a single cube by the pipeline. This final combined cube covers a 1′1′ FoV with a pixel size of 02. The observed spectral range is 475–935 nm and the spectral resolution varies between at 480 nm and at 930 nm.
We produced line emission maps and velocity fields of the [O iii]4959 and 5007 doublet (the latter will be refered to as [O iii] hence forward), the [N ii]6549 and 6583 doublet, and H at 6563 Å. We fitted a single Gaussian profile to each of these transitions in each spaxel. The underlying local continuum was approximated by a straight line. The flux ratio of the doublets was fixed to the expected theoretical ratio of 0.35 and 0.34 for the [O iii] and [N ii] doublets respectively. The [N ii] and H transitions were fitted simultaneously.
Finally we aligned the MUSE images using the peak of the continuum images to match the coordinates of the ALMA continuum peak at rest-frame 232 GHz (1.3 mm) RA(J2000) =14h 32m 40.70s and Dec(J2000) = 10 27.9.
3 Circumnuclear region
In this section we focus on the CO(2–1) emission in the circumnuclear region of NGC 5643 over a FoV of (central ) and use the data set. We selected this region to compare the cold molecular gas emission with the VLT/SINFONI integral field spectroscopy study of this galaxy done by Davies et al. (2014) with this FoV. Nevertheless, as can be seen from Figure 1 (lower panel), most of the ALMA CO(2–1) emission () arises from this region. Based on the kinematics of the hot molecular gas line H2 at m Davies et al. (2014) found evidence of outflowing material on scales from the nucleus. This material appears to be at the edge of the eastern ionization cone probed by the [O iii] emission observed with the Hubble Space Telescope (HST) by Simpson et al. (1997) and more recently with MUSE by Cresci et al. (2015).
3.1 Morphology
Figure 2 (left panel) shows in color the CO(2–1) velocity-integrated intensity map. The brightest emission comes from the central region (see Section 4.1 for a detailed discussion) from which the nuclear two-arm spiral structure is clearly connected. The spiral structure extends for more than 10″ on both sides of the galaxy (see lower panel of Figure 1), although the east side spiral arm shows a region void of CO(2–1) emission gas. We will come back to this in Section 5. The spiral arms are oriented in an almost east-west direction as is the large-scale stellar bar (see e.g. Mulchaey et al., 1997; Jungwiert et al., 1997, and also upper panel of Figure 1). There is also CO(2–1) emission in a third spiral-like structure in the circumnuclear region located to the west of the nucleus. We marked this third arm in Figure 1 (lower panel). This structure was first detected in H2 at m emission by Davies et al. (2014). They interpreted as a transient structure resulting from a recent perturbation to the galaxy. Alternatively it might be attributed to the far side of the ionization cone (that is, the counter-cone) where it is bisecting the galaxy and perturbing the ambient gas. In the nuclear region the tips of the nuclear spiral arms connect with dusty arc-like structures in size. In the innermost region a disk-like structure ( diameter) in the north-south direction is detected. These will be discussed in detail in Section 4.
We superimposed on the CO(2–1) map in Figure 2 as black contours our MUSE continuum-subtracted [O iii] line emission map (see Section 2.2). We note that this new MUSE data set was observed under better seeing conditions than the Cresci et al. (2015) one (0.5″ versus 0.88″). As discussed by these authors and also seen in our figure, the ionization cone traced by the [O iii] emission is more clearly seen to the east of the nucleus due to obscuration produced by the host galaxy in the west direction. However, the MUSE [O iii] image also traces the counter-cone emission on scales of a few arcsec to the west of the nucleus (Cresci et al., 2015). This comparison shows that most of the CO(2–1) bright emission seems to avoid the regions of ionized [O iii] gas. This would suggest that the CO(2–1) emission is in the plane of the galaxy whereas most of the [O iii] emission is outflowing perpendicular to the accretion disk and intercepts the host galaxy disk, since the ionization cone has an inclination of approximately 40° with respect to the galaxy disk (see also Fischer et al., 2013, and Section 3.2). Similar situations of the molecular gas avoiding the ionization cone have been reported in the literature for NGC 4253 and M 51 (see Krause et al., 2007; Querejeta et al., 2016, respectively).
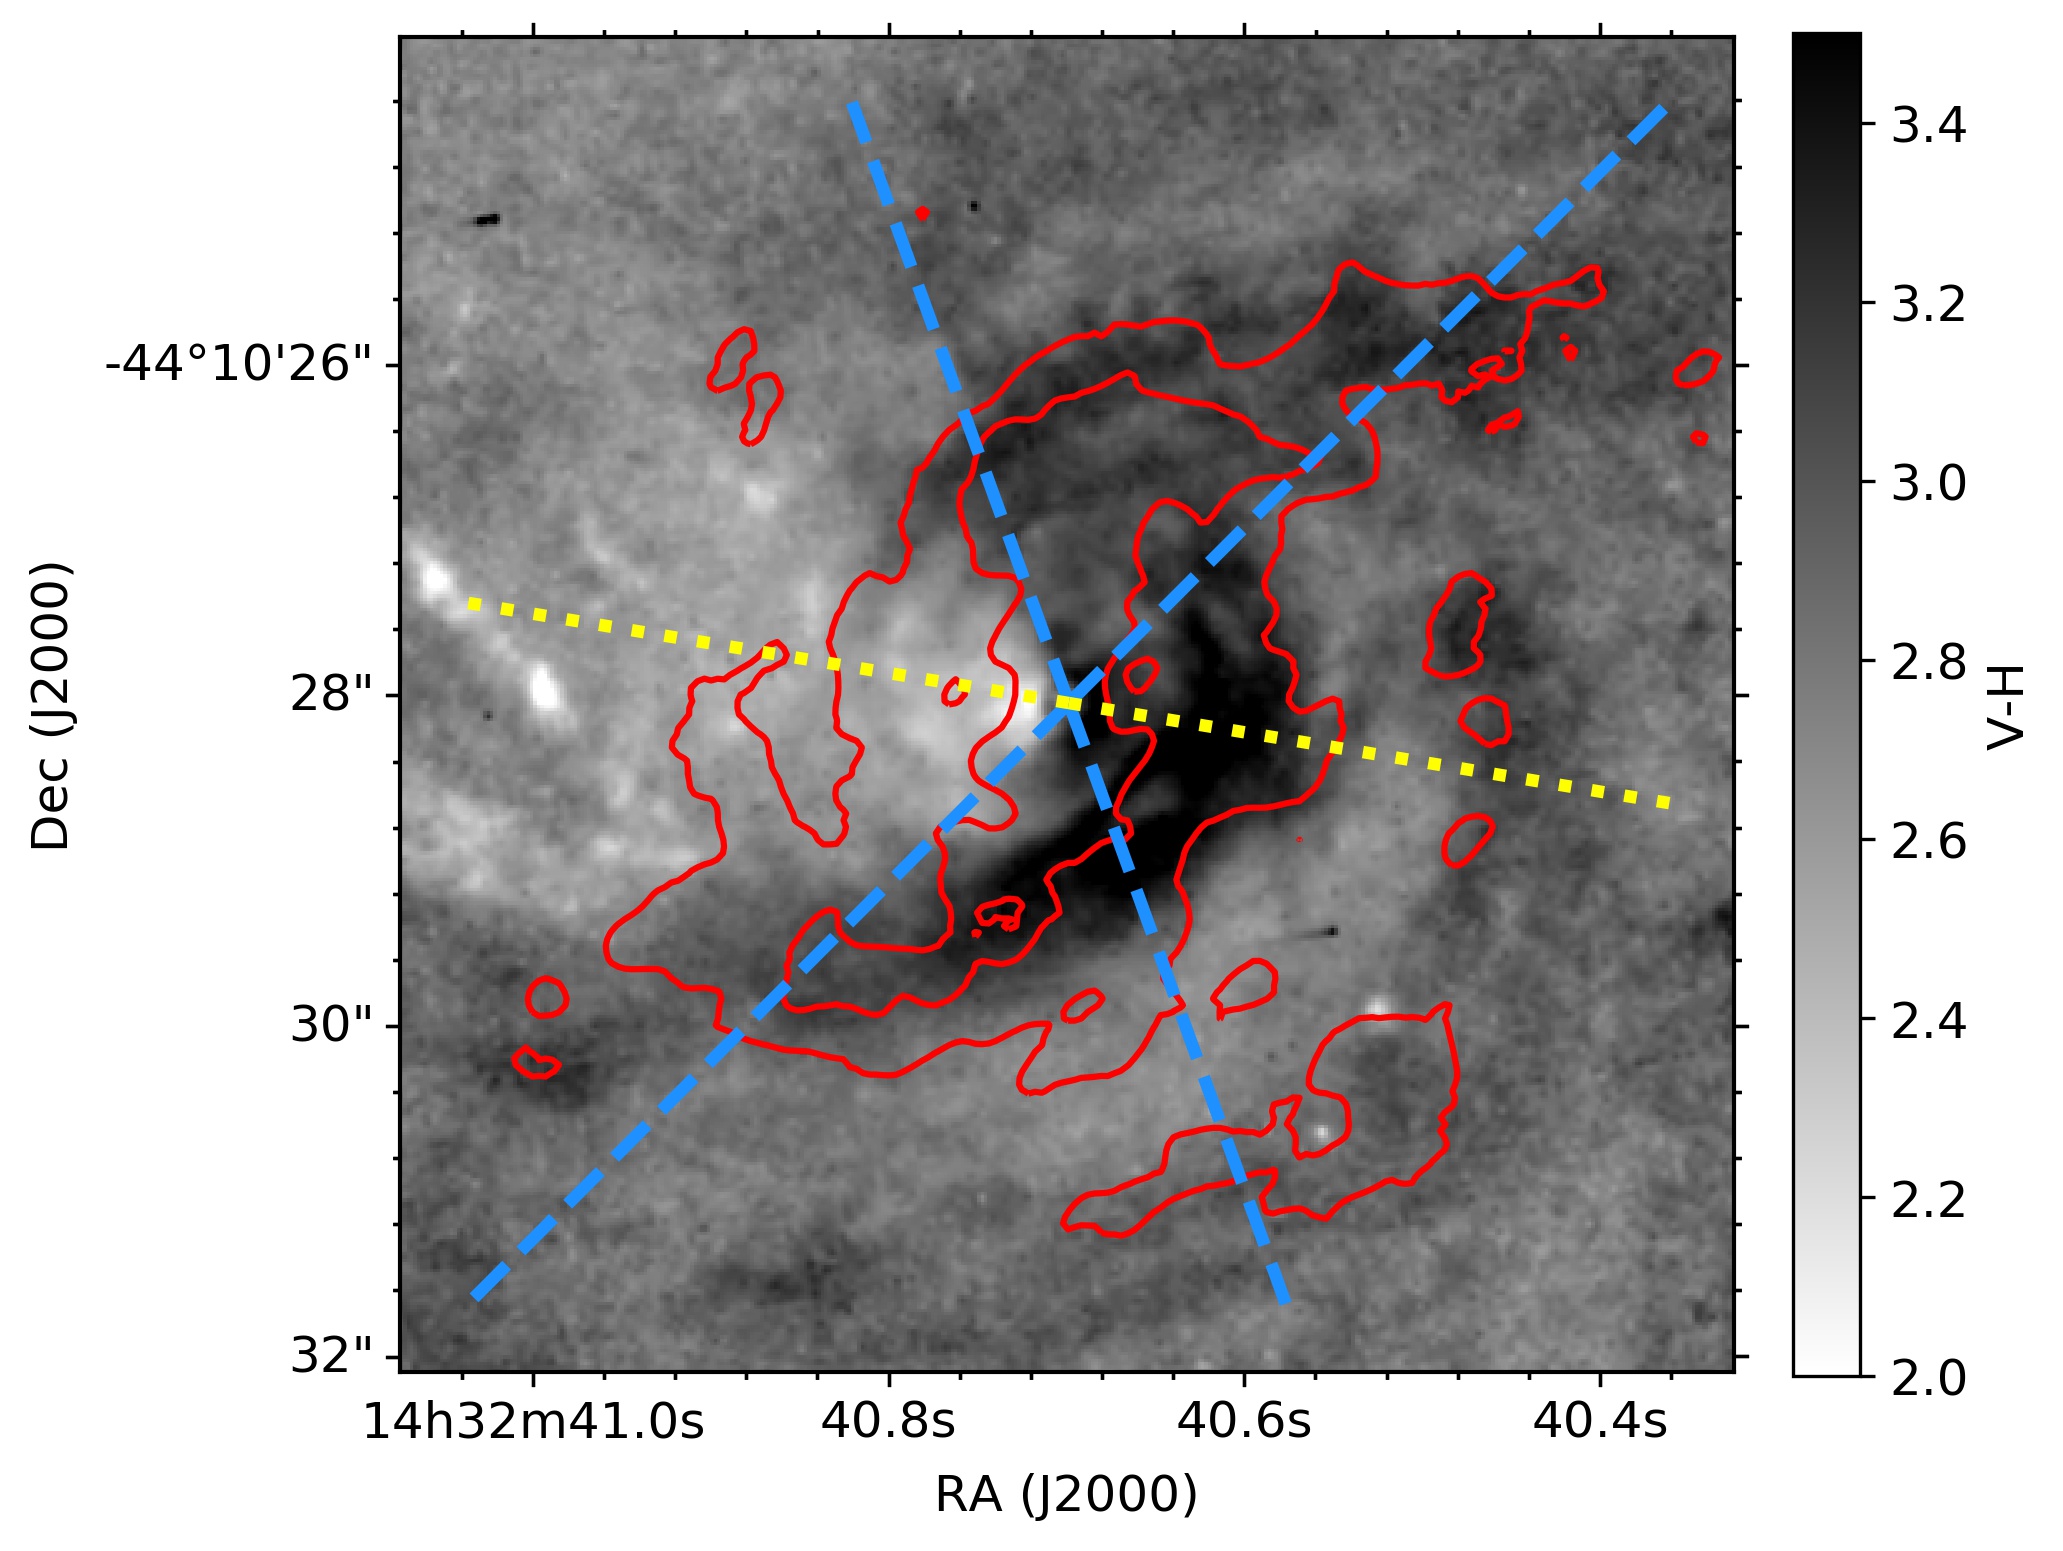
The right panel of Figure 2 is the HST color map (in grey scale) from Martini et al. (2003) and Davies et al. (2014). We overlaid on this image two contours showing the CO(2–1) integrated emission (that of the left panel) to guide the eye. Clearly the nuclear spiral structure outlined by the nearly horizontal dust lanes (dark regions) entering the nuclear region is coincident with the CO(2–1) molecular gas emission. The third spiral-like structure is traced by both the CO(2–1) cold gas emission and the dust lanes. Also there is evidence that this third spiral structure might have a fainter counterpart (i.e., a fourth arm) on the east side of the galaxy again seen in both dust and cold molecular gas (see also Figure 1 for a larger FoV).
3.2 Kinematics
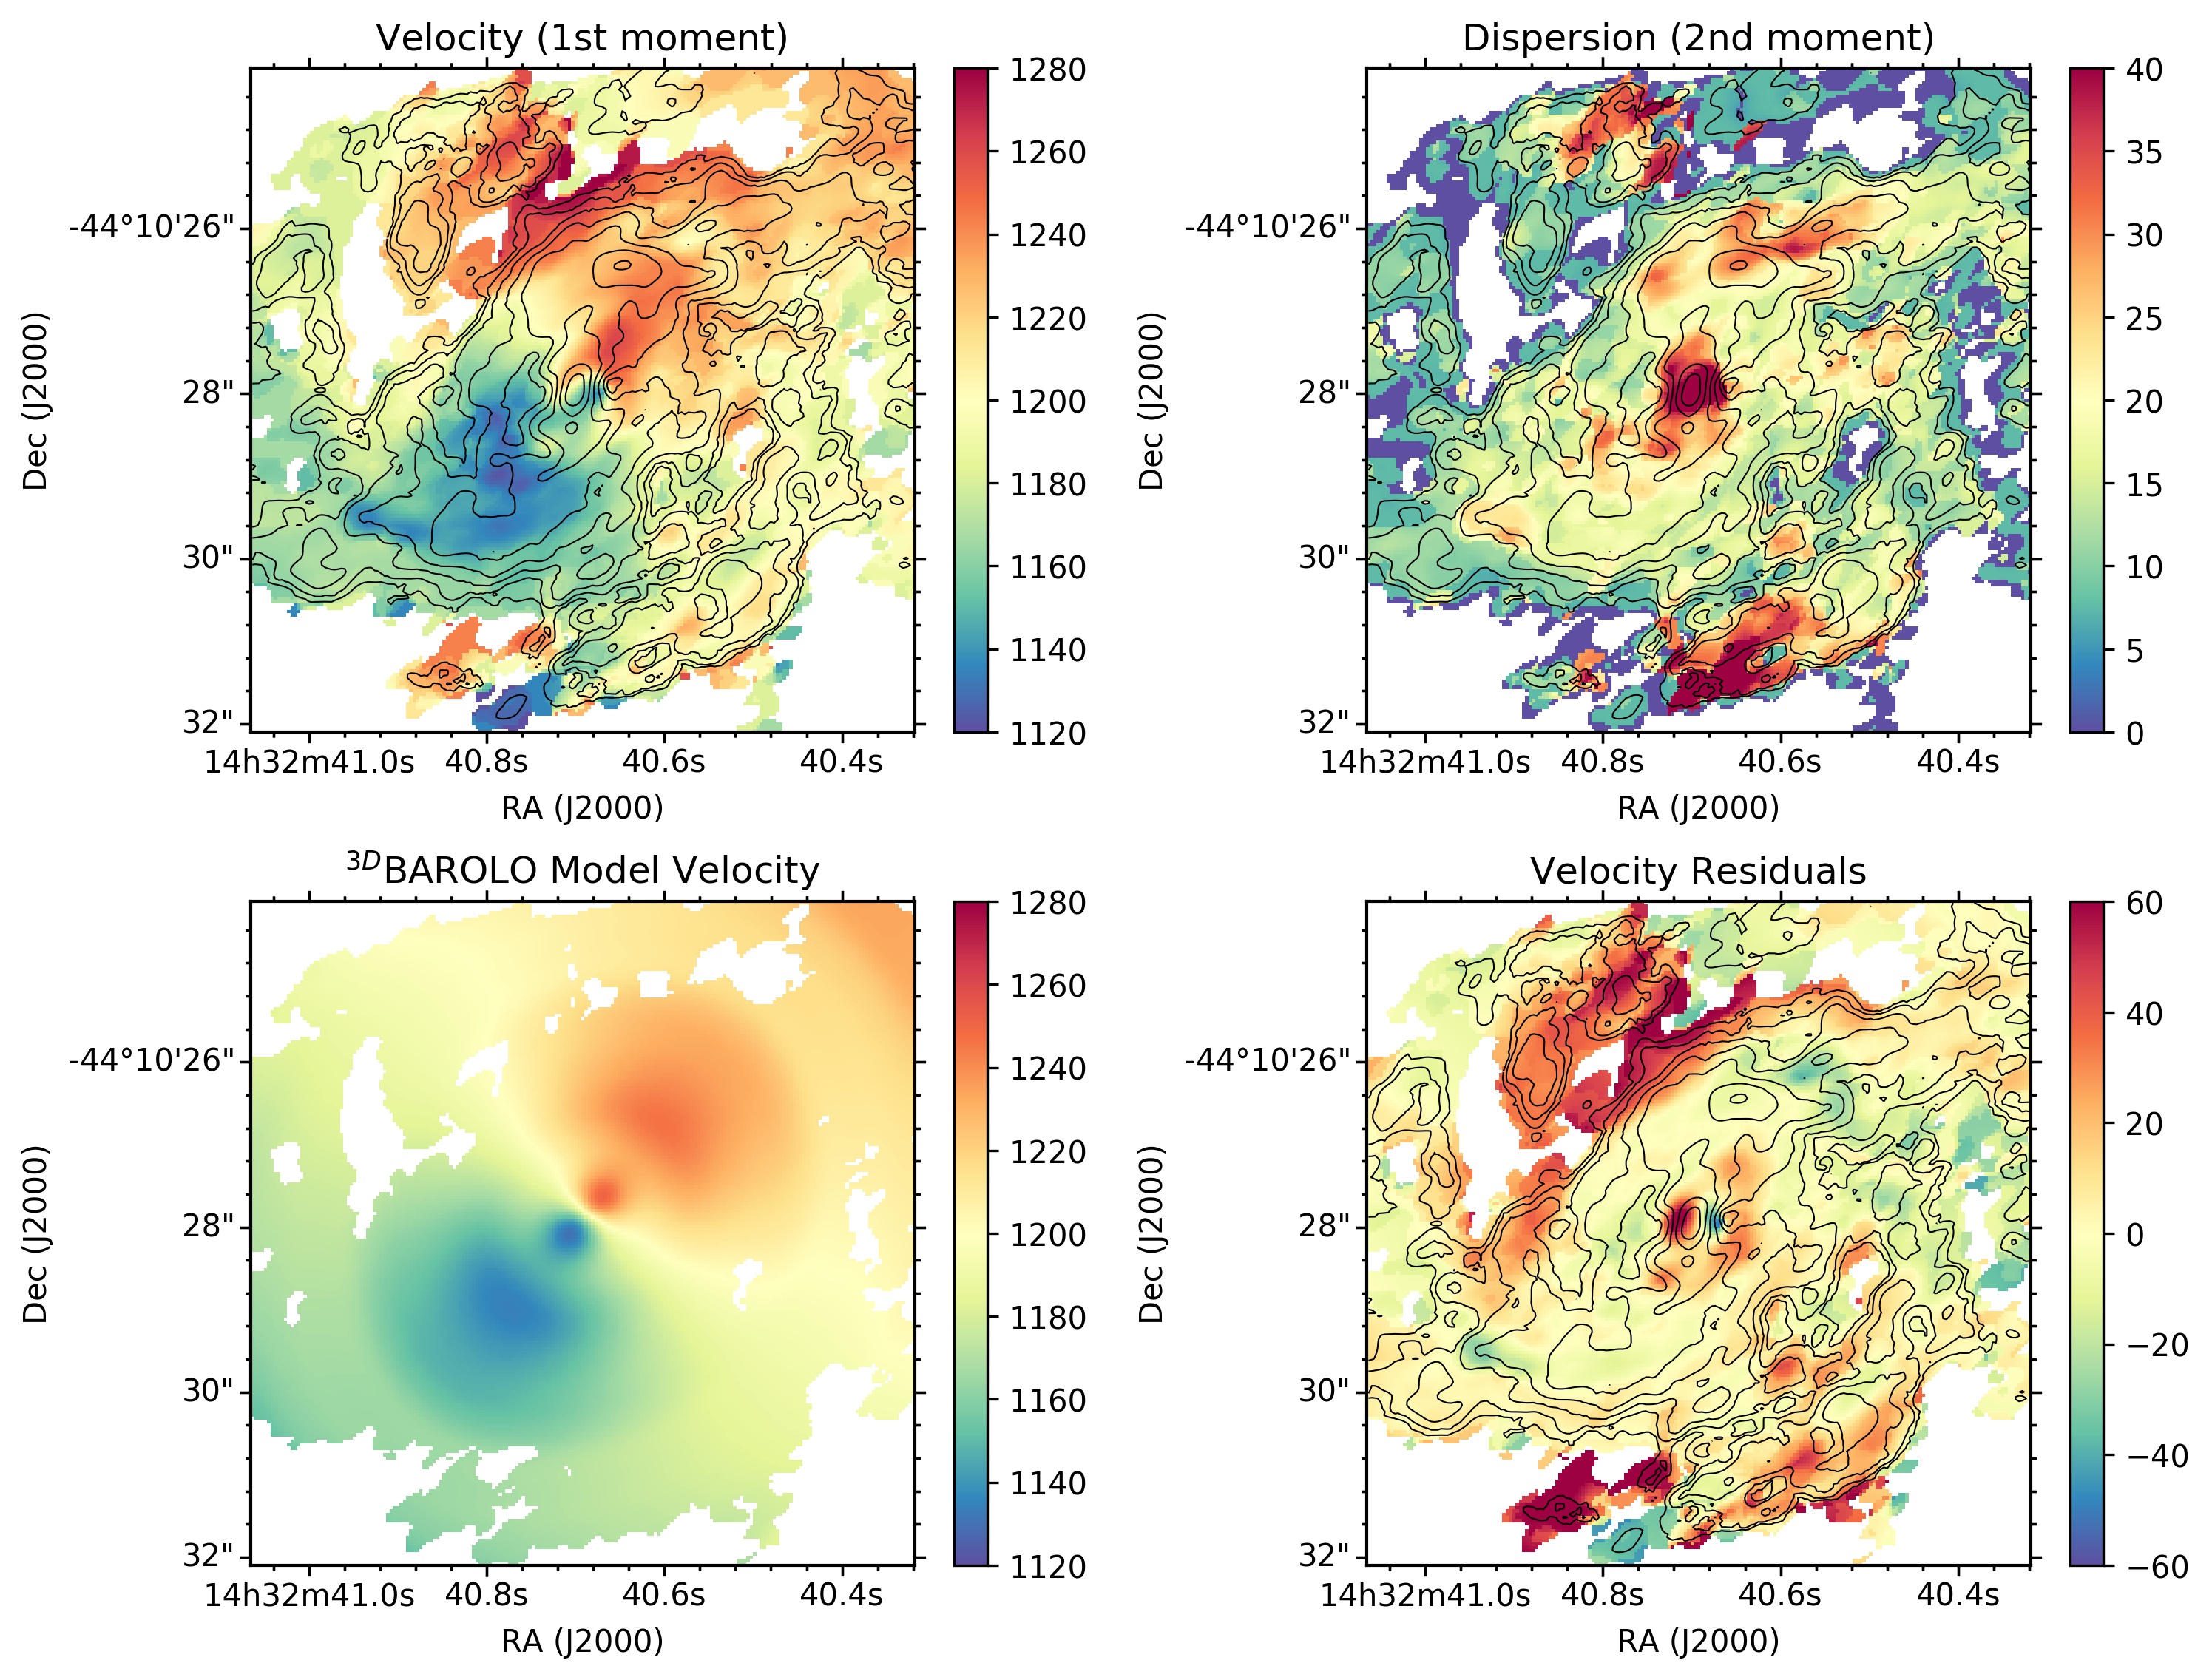
We used the 3DBAROLO code (Di Teodoro & Fraternali, 2015) to model the CO(2–1) kinematics of the central region of NGC 5643 using the ALMA data cube. 3DBAROLO was designed to fit simple disk models using 3D tilted rings to a variety of emission line data, including ALMA data cubes. The fit is done in two steps. During the first step for each ring 3DBAROLO fits the free parameters, namely, the kinematic center, the systemic velocity, the disk inclination and PA of the major axis, the scale height of the disk, the circular velocity and velocity dispersion. The second step fixes the kinematic center and systemic velocity to the mean fitted values from the first iteration and finds the best solution for the other free parameters. 3DBAROLO also allows the user to fix any of the above parameters during the first iteration. After fitting the data cube, 3DBAROLO creates, among other products, a map of the observed velocity-integrated intensity (0th moment), a map of the observed mean velocity field (1st moment) and velocity dispersion field (2nd moment) as well as the same maps for the best fit model.
We first run 3DBAROLO on the CO(2–1) data cube using the disk PA and inclination derived from the near-infrared stellar kinematics by Davies et al. (2014) over the same FoV allowing for relatively small variations (approximately for the disk PA and for the disk inclination). After the first run we fixed the disk PA and inclination to the average fitted values of and , which are compatible with those inferred from the stellar kinematics (Davies et al., 2014). We also fixed the systemic velocity to (mean value of the first run) and rerun 3DBAROLO to fit the observed velocity field.
The results are shown in Figure 3. The top panels are the 3DBAROLO maps of the observed mean CO(2–1) velocity field (1st moment map, left) and velocity dispersion (2nd moment map, right). These can be compared directly with the H2 m hot molecular gas maps in Figure 8 of Davies et al. (2014). Both the mean velocity fields of the cold and hot molecular gas are similar and display a clear rotational pattern with evidence of some non-circular motions. The velocity dispersion maps of the cold and hot molecular gas show a peak at the nucleus position with a value of . However, the H2 map shows the highest velocity dispersion value, , at about 2 to the northeast of the nucleus. This peak is not as clearly seen in the map of CO(2–1) velocity dispersion due to low signal-to-noise ratio in that region of our map. Nevertheless, there is a region to the north-northeast of the AGN at about pc with a CO(2–1) velocity dispersion value similar to that of the nucleus (see below).
We constructed a CO(2–1) residual mean-velocity field map (see Figure 3, bottom right panel) by subtracting the 3DBAROLO disk model (bottom left panel of Figure 3) from the 3DBAROLO first moment map. Some of the residual velocity field seen in the central few arcseconds could be an artifact of the simple disk geometry assumed in our modelling with 3DBAROLO. In particular, a model which accounted for the presence of a bar potential would predict better the streaming motions linked to the gas response to the bar along the leading edges of the nuclear spiral (see for instance, Emsellem et al., 2001). However, it would not be able to reproduce the strong redshifted velocity residuals () seen northeast of the AGN. This redshifted component was also observed in the velocity field of the hot molecular gas H2 at m (Davies et al., 2014) and shows high CO(2–1) velocity dispersion.
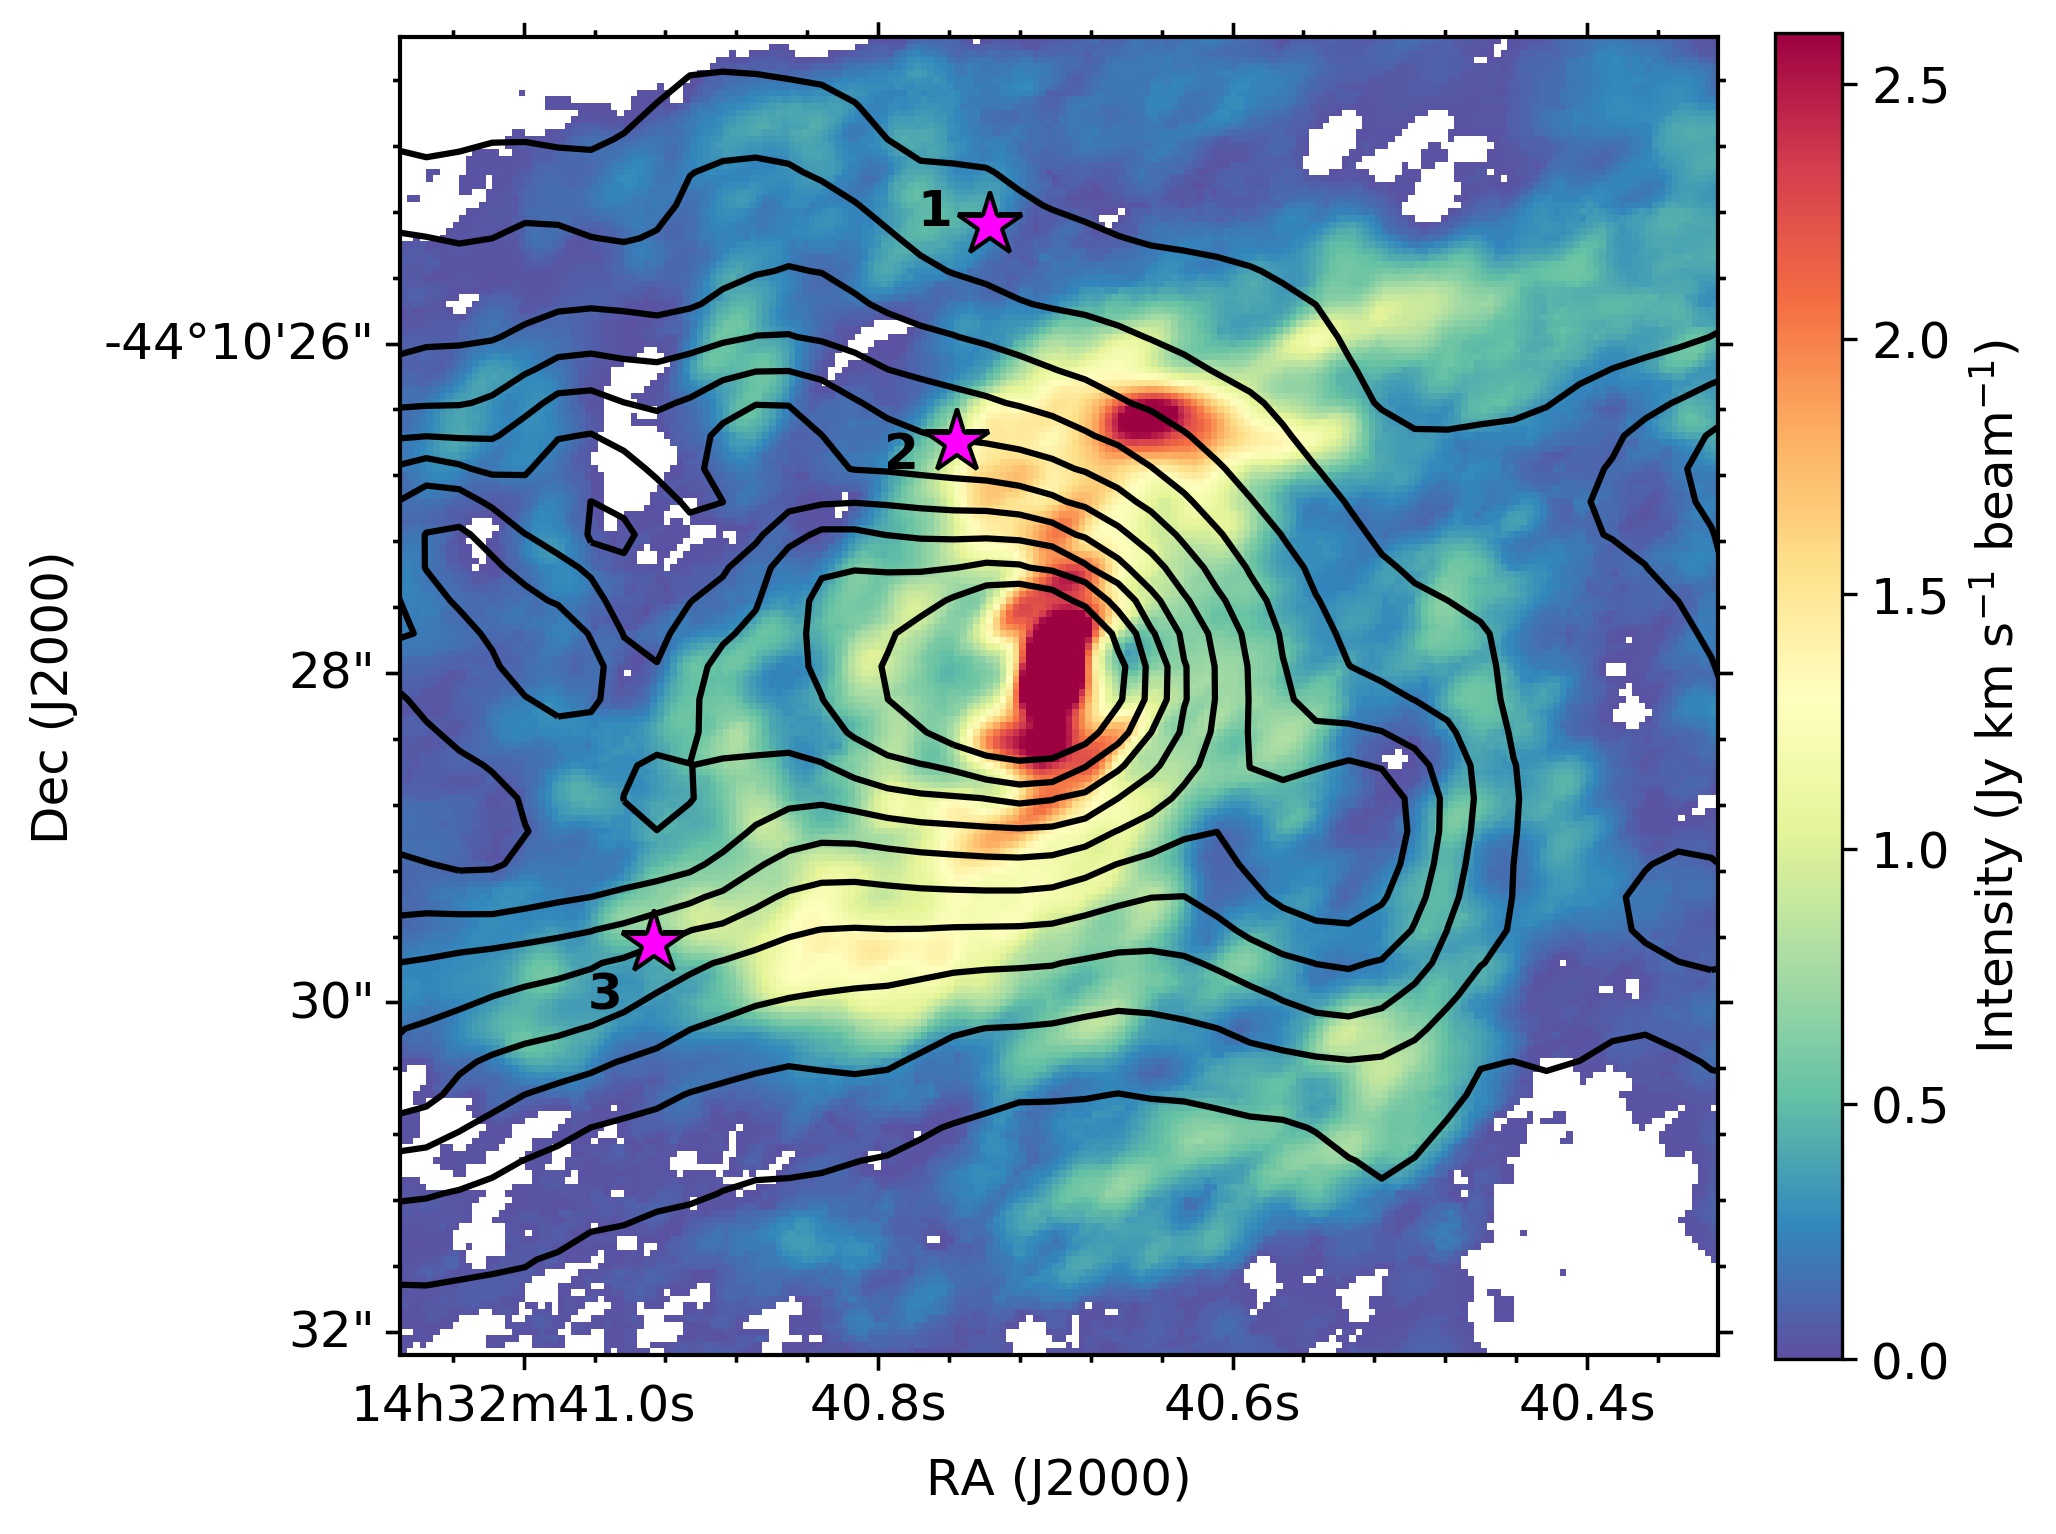
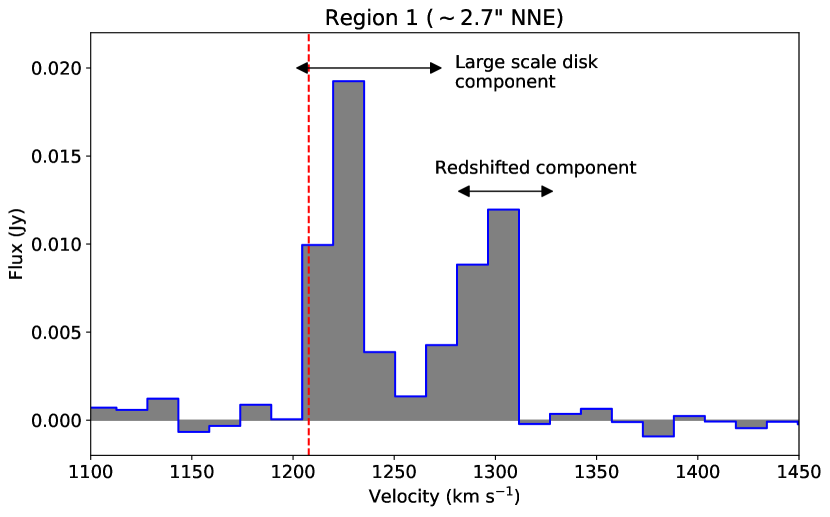
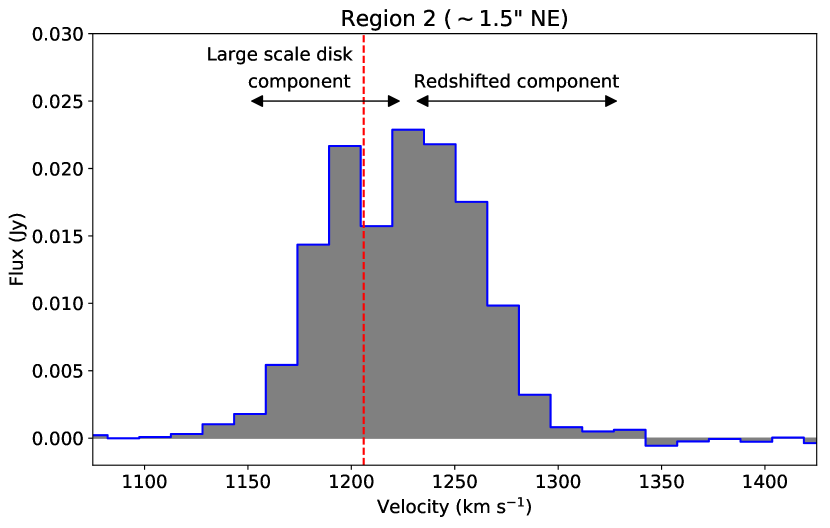
To look further into the gas kinematics of regions with the large velocity residuals with respect to a simple rotating disk and/or velocity dispersions, we extracted CO(2–1) line profiles at three positions. The first two have redshifted components and are located approximately northnortheast and northeast ( and pc respectively, and see Figure 2 for the locations) from the peak of the CO(2–1) emission. The top and middle panels of Figure 4 show the line profiles obtained with a square aperture of 10 pixels or 0.4″. Both regions clearly show two distinct velocity components, one associated with the rotation of the large scale disk and a second one redshifted by approximately . The morphology of the nuclear spiral structure indicates that the rotation in the disk of the galaxy is counterclockwise. Assuming that the non-circular motions seen in these regions to the northeast of the center are co-planar with the galaxy disk then the redshifted components imply radial outward movements in the disk of the galaxy near the edge of the [O iii] ionization cone (see Figures 2 and 3). The simplest explanation for the CO(2–1) velocity residuals would be radial movements of material that is being pushed outwards in the galaxy disk by the outflowing material traced by the [O iii] emission.
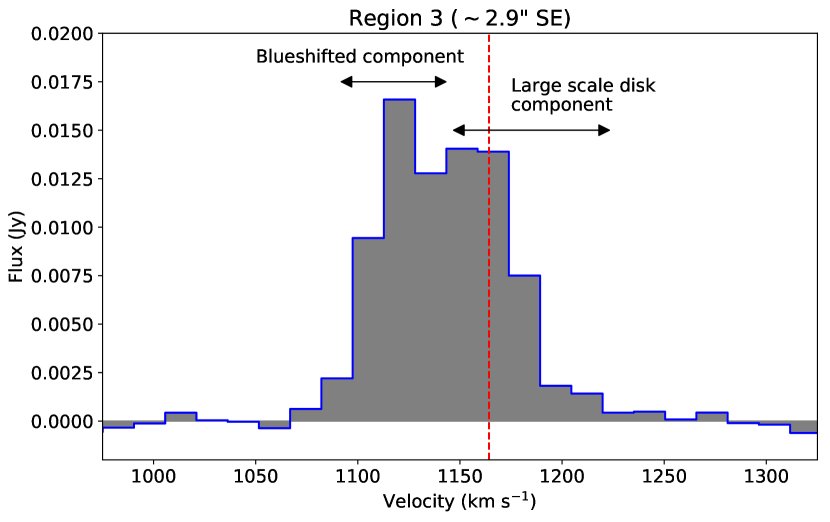
The third region is in the nuclear spiral at ″ southeast of the nucleus (see Figure 2) and presents blue velocity residuals and an excess velocity dispersion, which are explained by the presence of two velocity components (see bottom panel of Figure 4). This location is in a region where the [O iii] outflow (identified by the presence of blueshifted components) and the radio jet appear to be interacting with the disk of the galaxy (Cresci et al., 2015). We note that this CO(2–1) blueshifted region is not coincident with the H knots resulting from positive feedback induced by the jet that are located further away from the nucleus.
4 The nuclear obscuring disk
To study the properties of the nuclear emission we use the ALMA data cube with the highest angular resolution of which corresponds to at the assumed distance of NGC 5643. As already seen from Figures 1 and 2, NGC 5643 shows bright CO(2–1) line emission arising from the nuclear regions.
4.1 Morphology
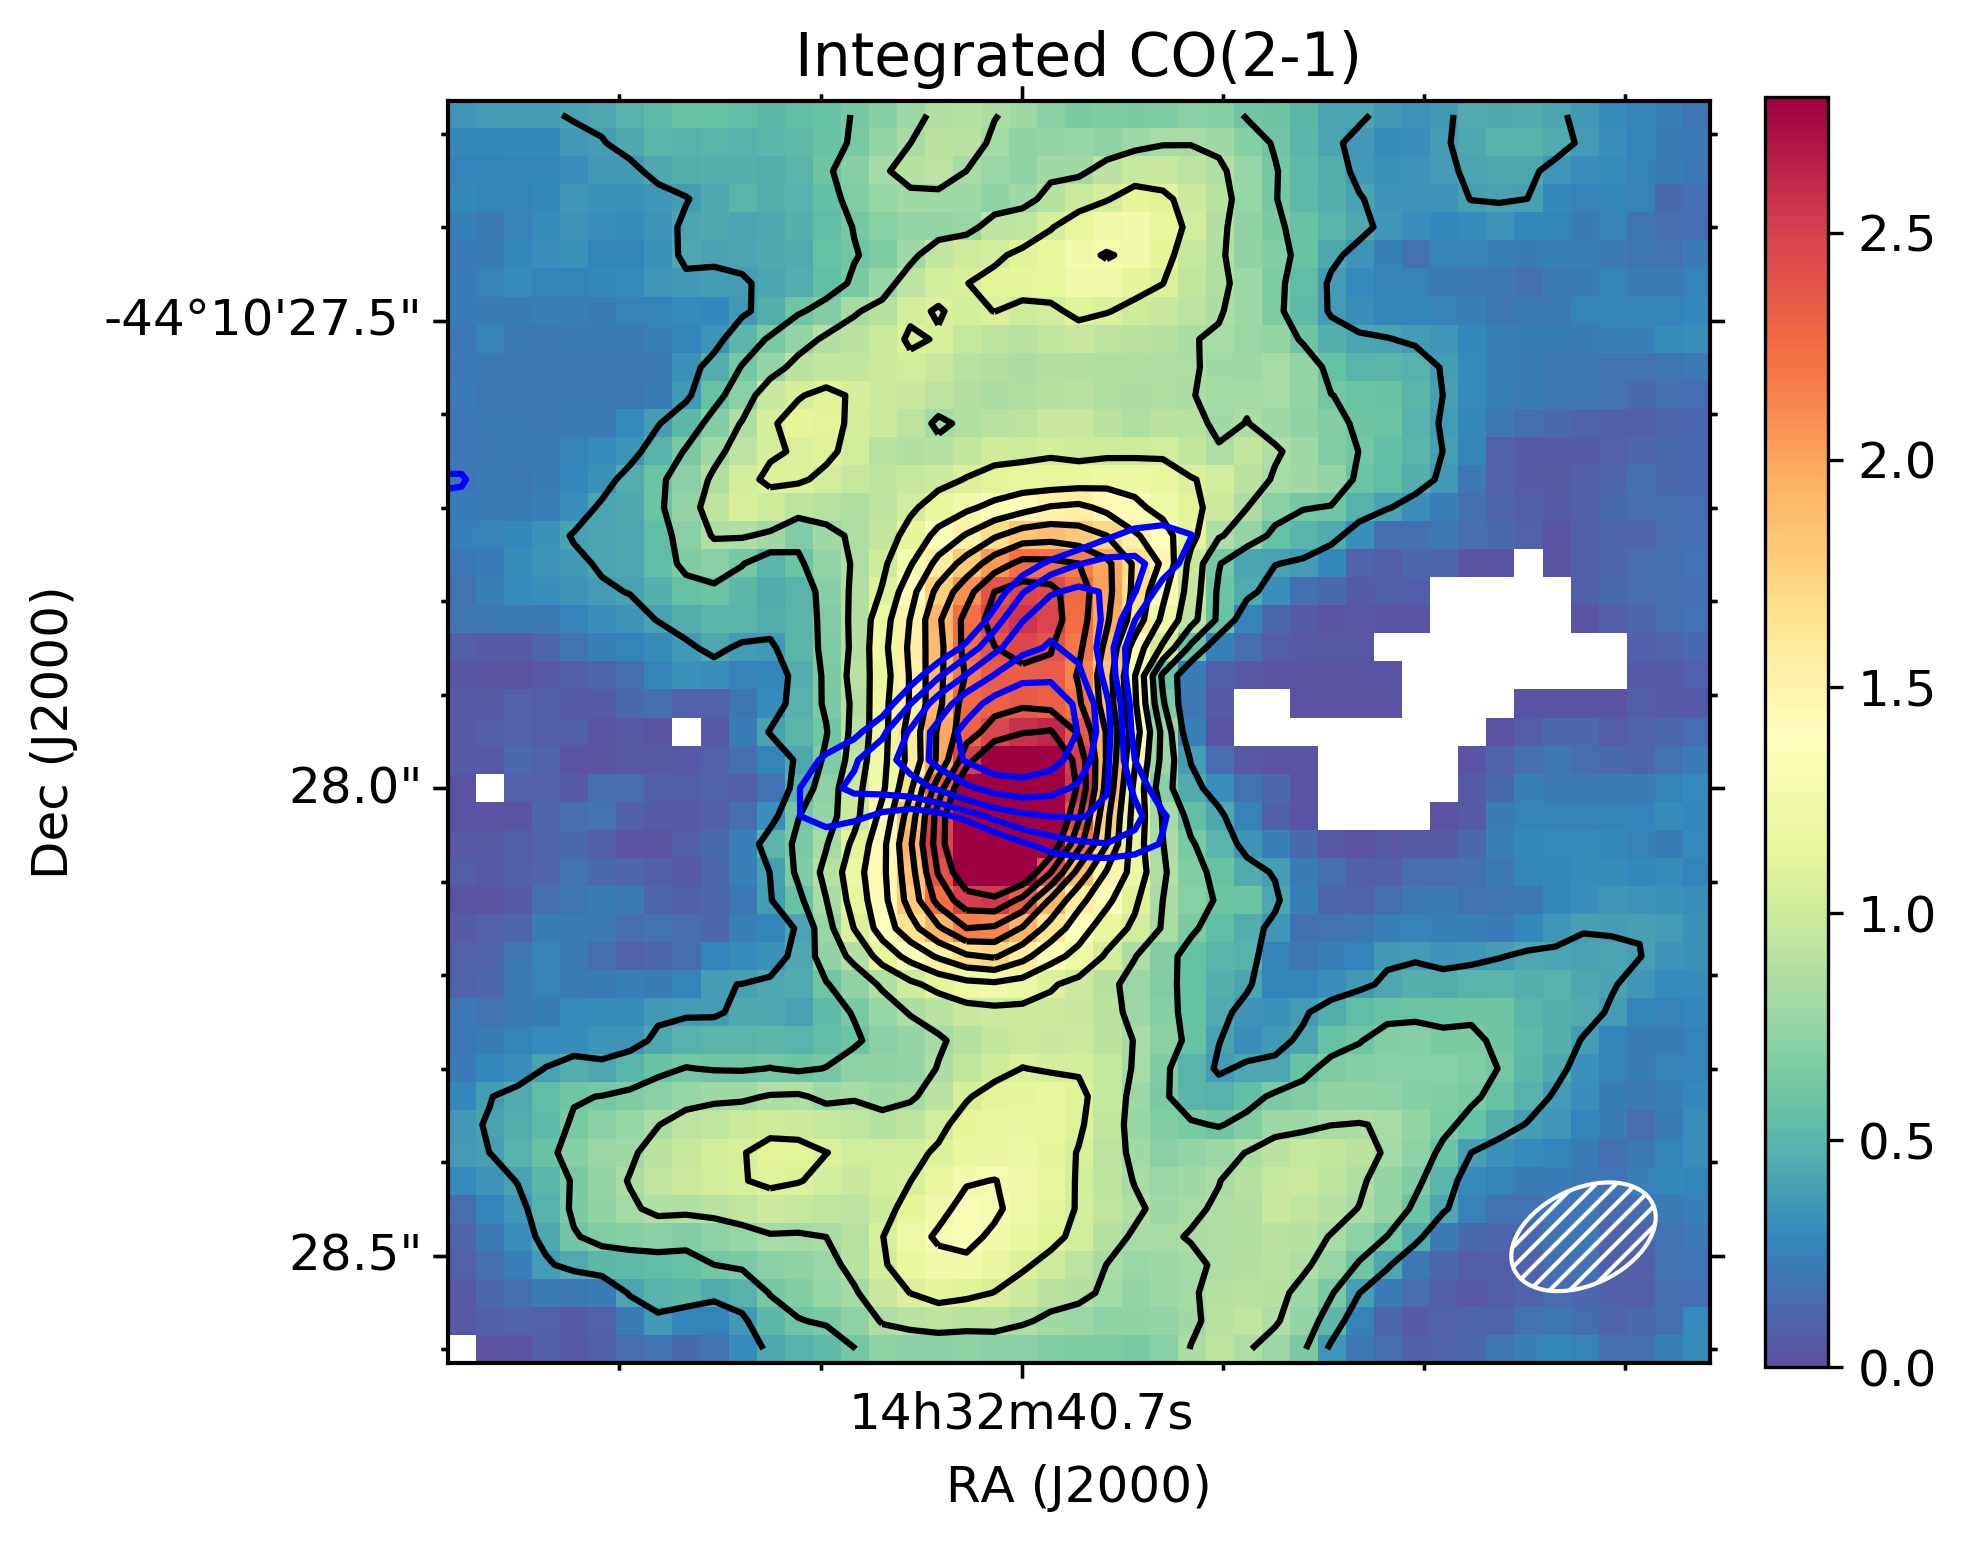
We focus here on the central region which corresponds approximately to the central , and encloses the arc-like structures and the nuclear disk (see the map of the CO(2–1) integrated intensity in Figure 5). The arc-like structures trace where the nearly horizontal nuclear spiral arms (oriented as the large-scale bar) come in (see also Figure 2). These are coincident with dusty features suggesting the direction of the inflowing material (Davies et al., 2014). The presence of these straight dust lane/gas features near the nucleus are predicted by hydrodynamical models of gas flow in a barred potential (Regan & Mulchaey, 1999; Maciejewski, 2004).
The innermost region shows a disk-like morphology. This nuclear disk is fully resolved with a measured FWHM of in the approximate north-south direction and in the east-west direction which corresponds to a projected size of . These values have not been corrected for the beam size of the observations. It also appears to be tilted with respect to the large scale galaxy disk (see Section 4.2). The presence of this nuclear disk was previously suggested by the dusty structure in the nuclear region (Davies et al., 2014; Cresci et al., 2015). Alternatively we could interpret the CO(2–1) nuclear structure as an inner bar (see discussion in Section 5.2).
The nuclear disk of NGC 5643 is further resolved into two peaks of CO(2–1) with an asymmetric structure. The rest-frame 232 GHz continuum, which likely pinpoints the location of the AGN111The coordinates agree with those of the H2O maser within their reported uncertainties (Greenhill et al., 2003)., is located in between the two CO(2–1) peaks. This kind of lopsided gas morphology is the characteristic modes predicted by numerical simulations of gas dynamics on scales of a few parsecs from an accreting super massive black hole and are due to angular momentum transfer (Hopkins & Quataert, 2010). However, we cannot rule out the possibility that the two CO(2–1) peaks reflect different gas excitation conditions in the nuclear region.
As can be see from Figure 5, the 232 GHz (1.3 mm) continuum emission is produced by a compact source, although some resolved emission seems to be present. To quantify this, we modeled the continuum in the uv plane using the UVMULTIFIT library (Martí-Vidal et al., 2014) with a Gaussian function. The best fit produced a continuum flux of mJy, with a deconvolved size (FWHM) along the major axis of ″ and a size along the minor axis of ″ at °. The orientation of the continuum extended emission would appear to follow the orientation of the inner contours of the MUSE [O iii] emission. It could thus be interpreted as either polar dust emission or synchrotron emission or both. We note that radio emission in this direction is however observed both to the east and west of the AGN position (Morris et al., 1985; Leipski et al., 2006). Unfortunately the angular resolution of these radio observations () does not allow us to make any further comparisons with the ALMA continuum emission.
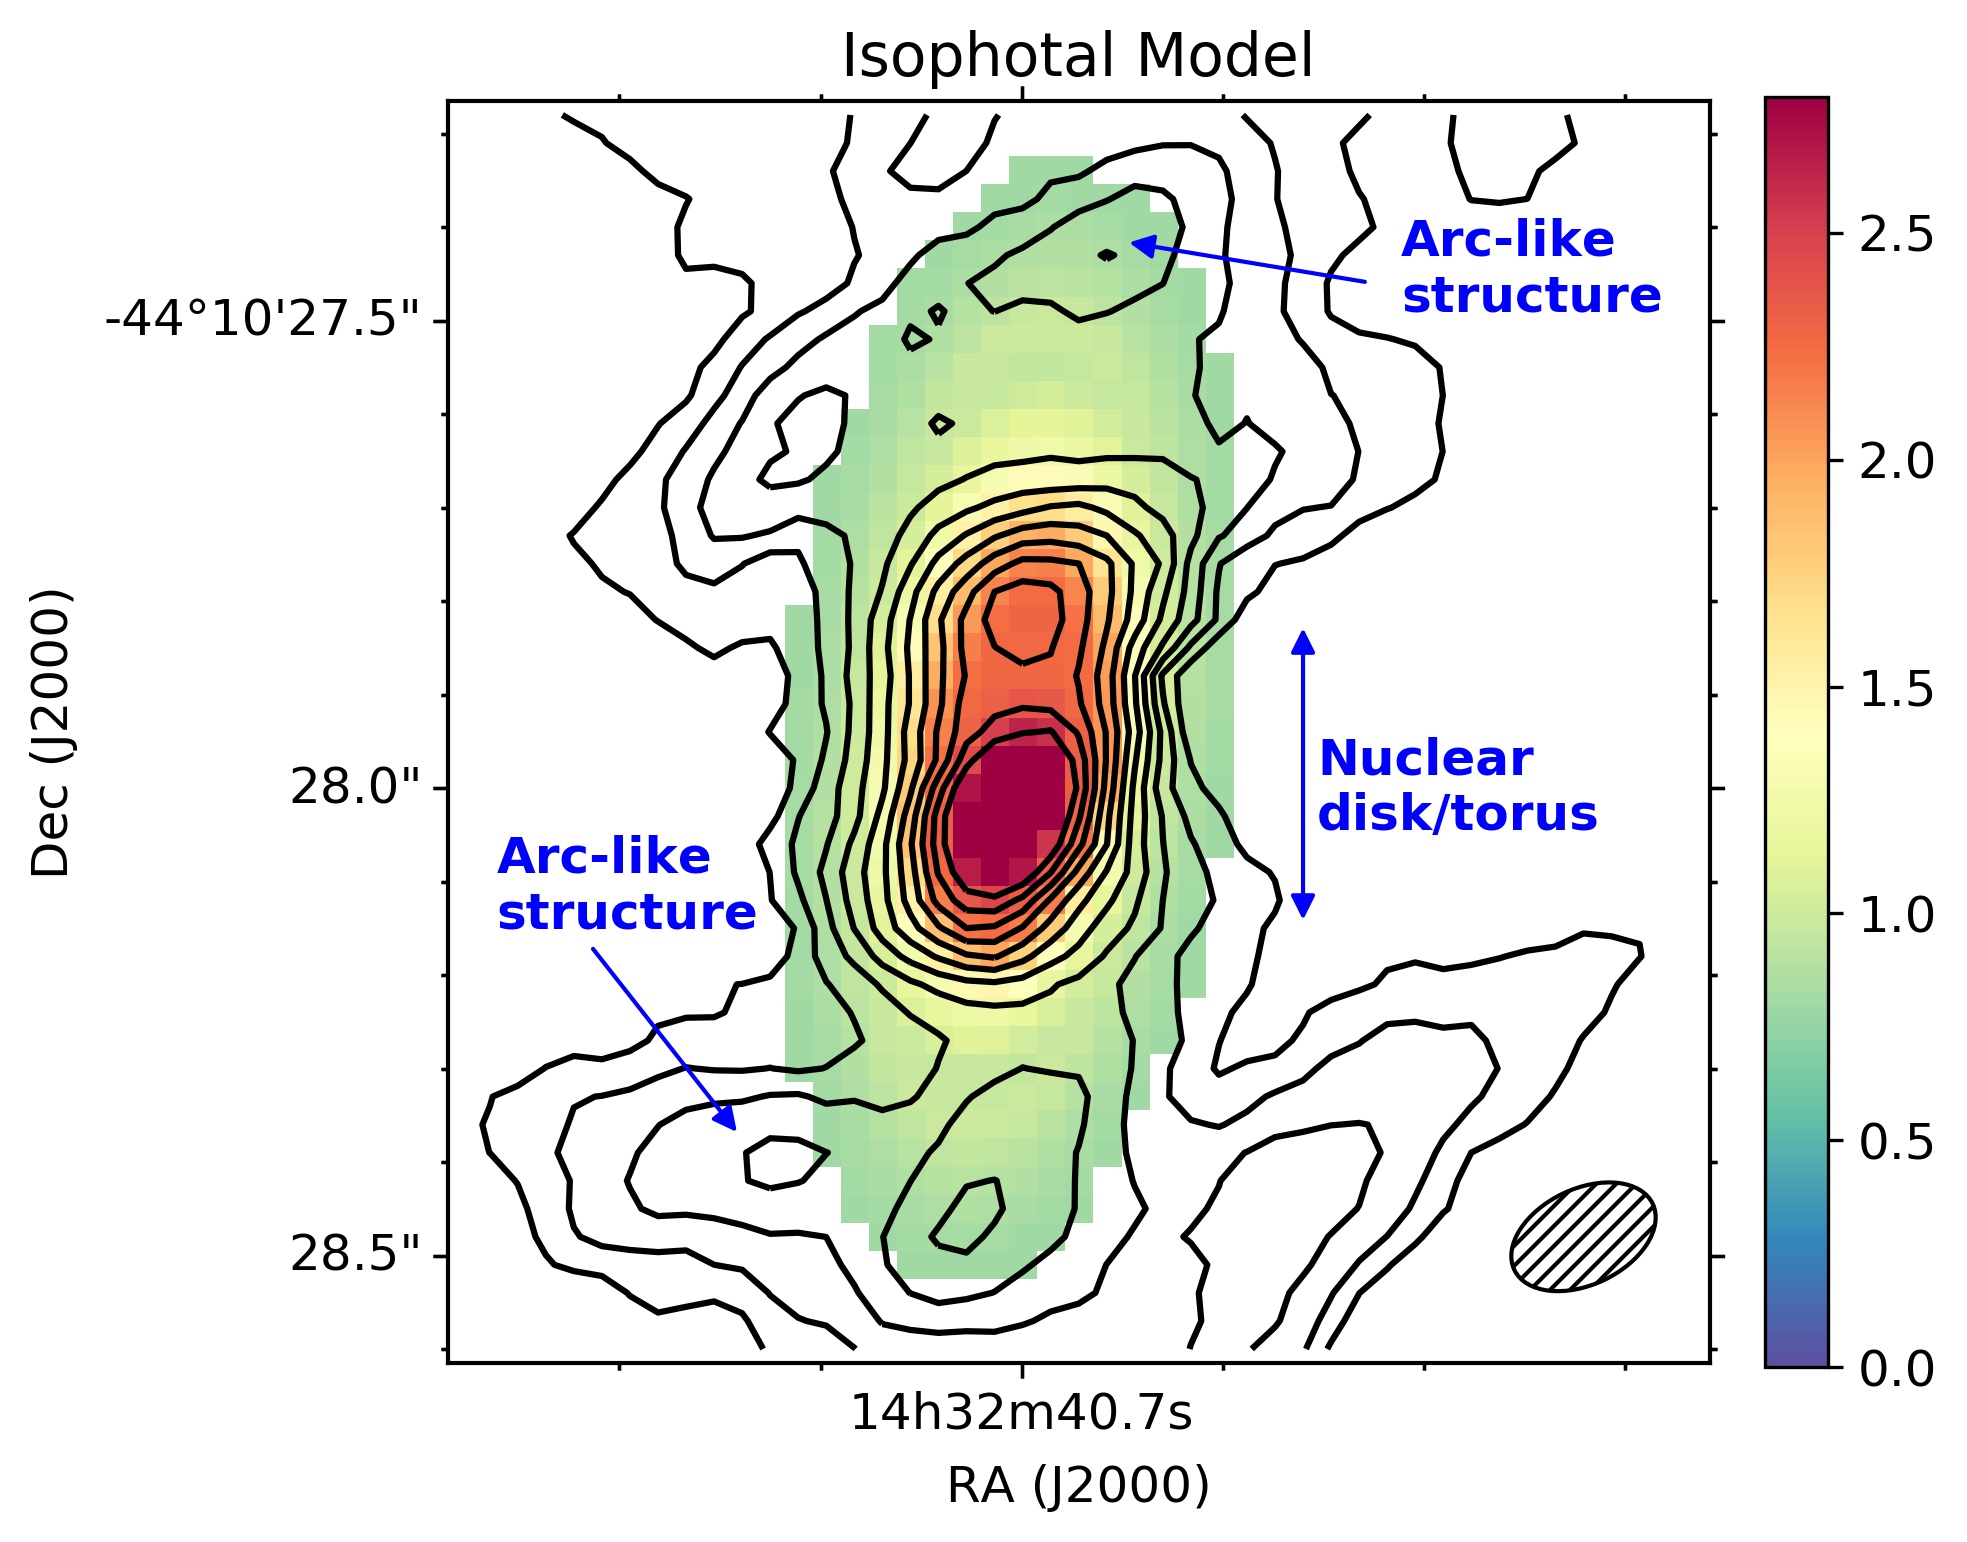
4.2 Kinematics
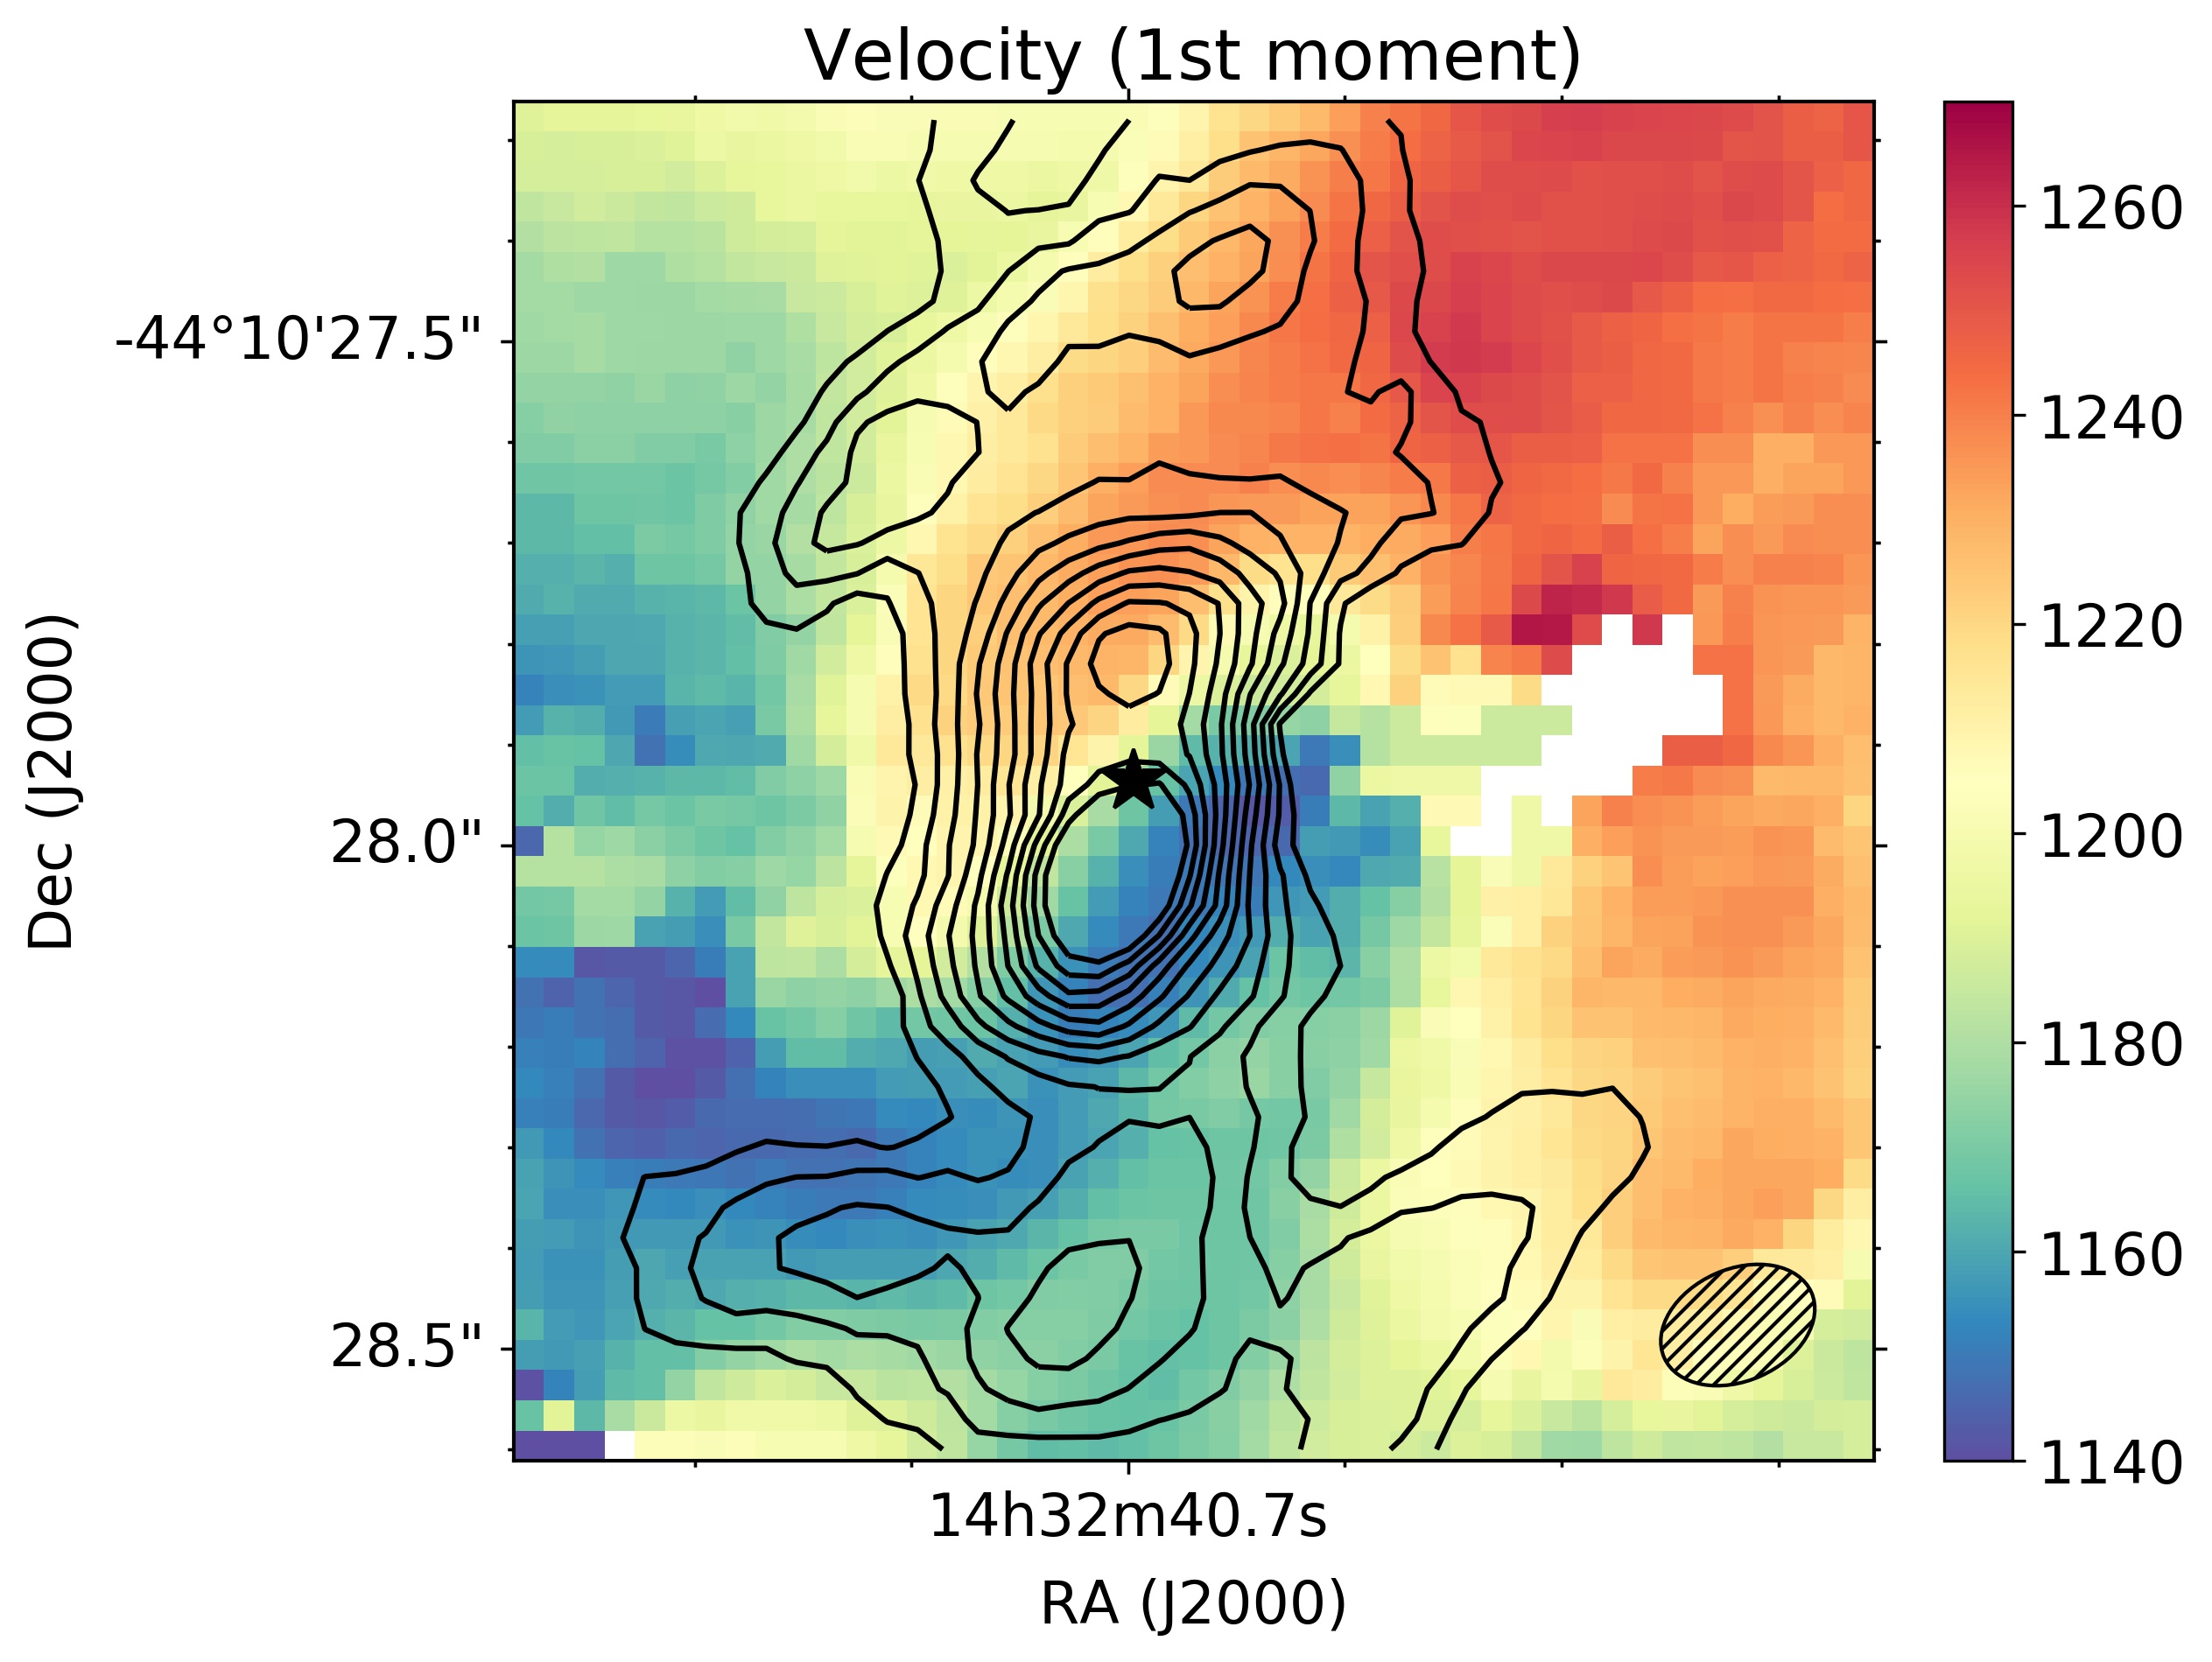
Figure 6 (left panel) shows the mean velocity field (1st moment map derived with 3DBAROLO) of the CO(2–1) molecular gas in the nuclear region. A comparison with the larger scale CO(2–1) kinematics shown in Figure 3 suggests that the nuclear disk might be tilted with respect to the host galaxy disk. We used again 3DBAROLO to construct a disk model to fit the kinematics of the nuclear region. We first fitted a simple isophotal model with the iraf ellipse task to the nuclear CO(2–1) emission (see Figure 5, right panel). The aim is to provide 3DBAROLO with initial values of the nuclear disk PA and inclination. From the outer isophotes of the nuclear disk (central ) we can see that the nuclear disk is almost in a north-south orientation () and the measured ellipticity () implies a relatively high inclination.
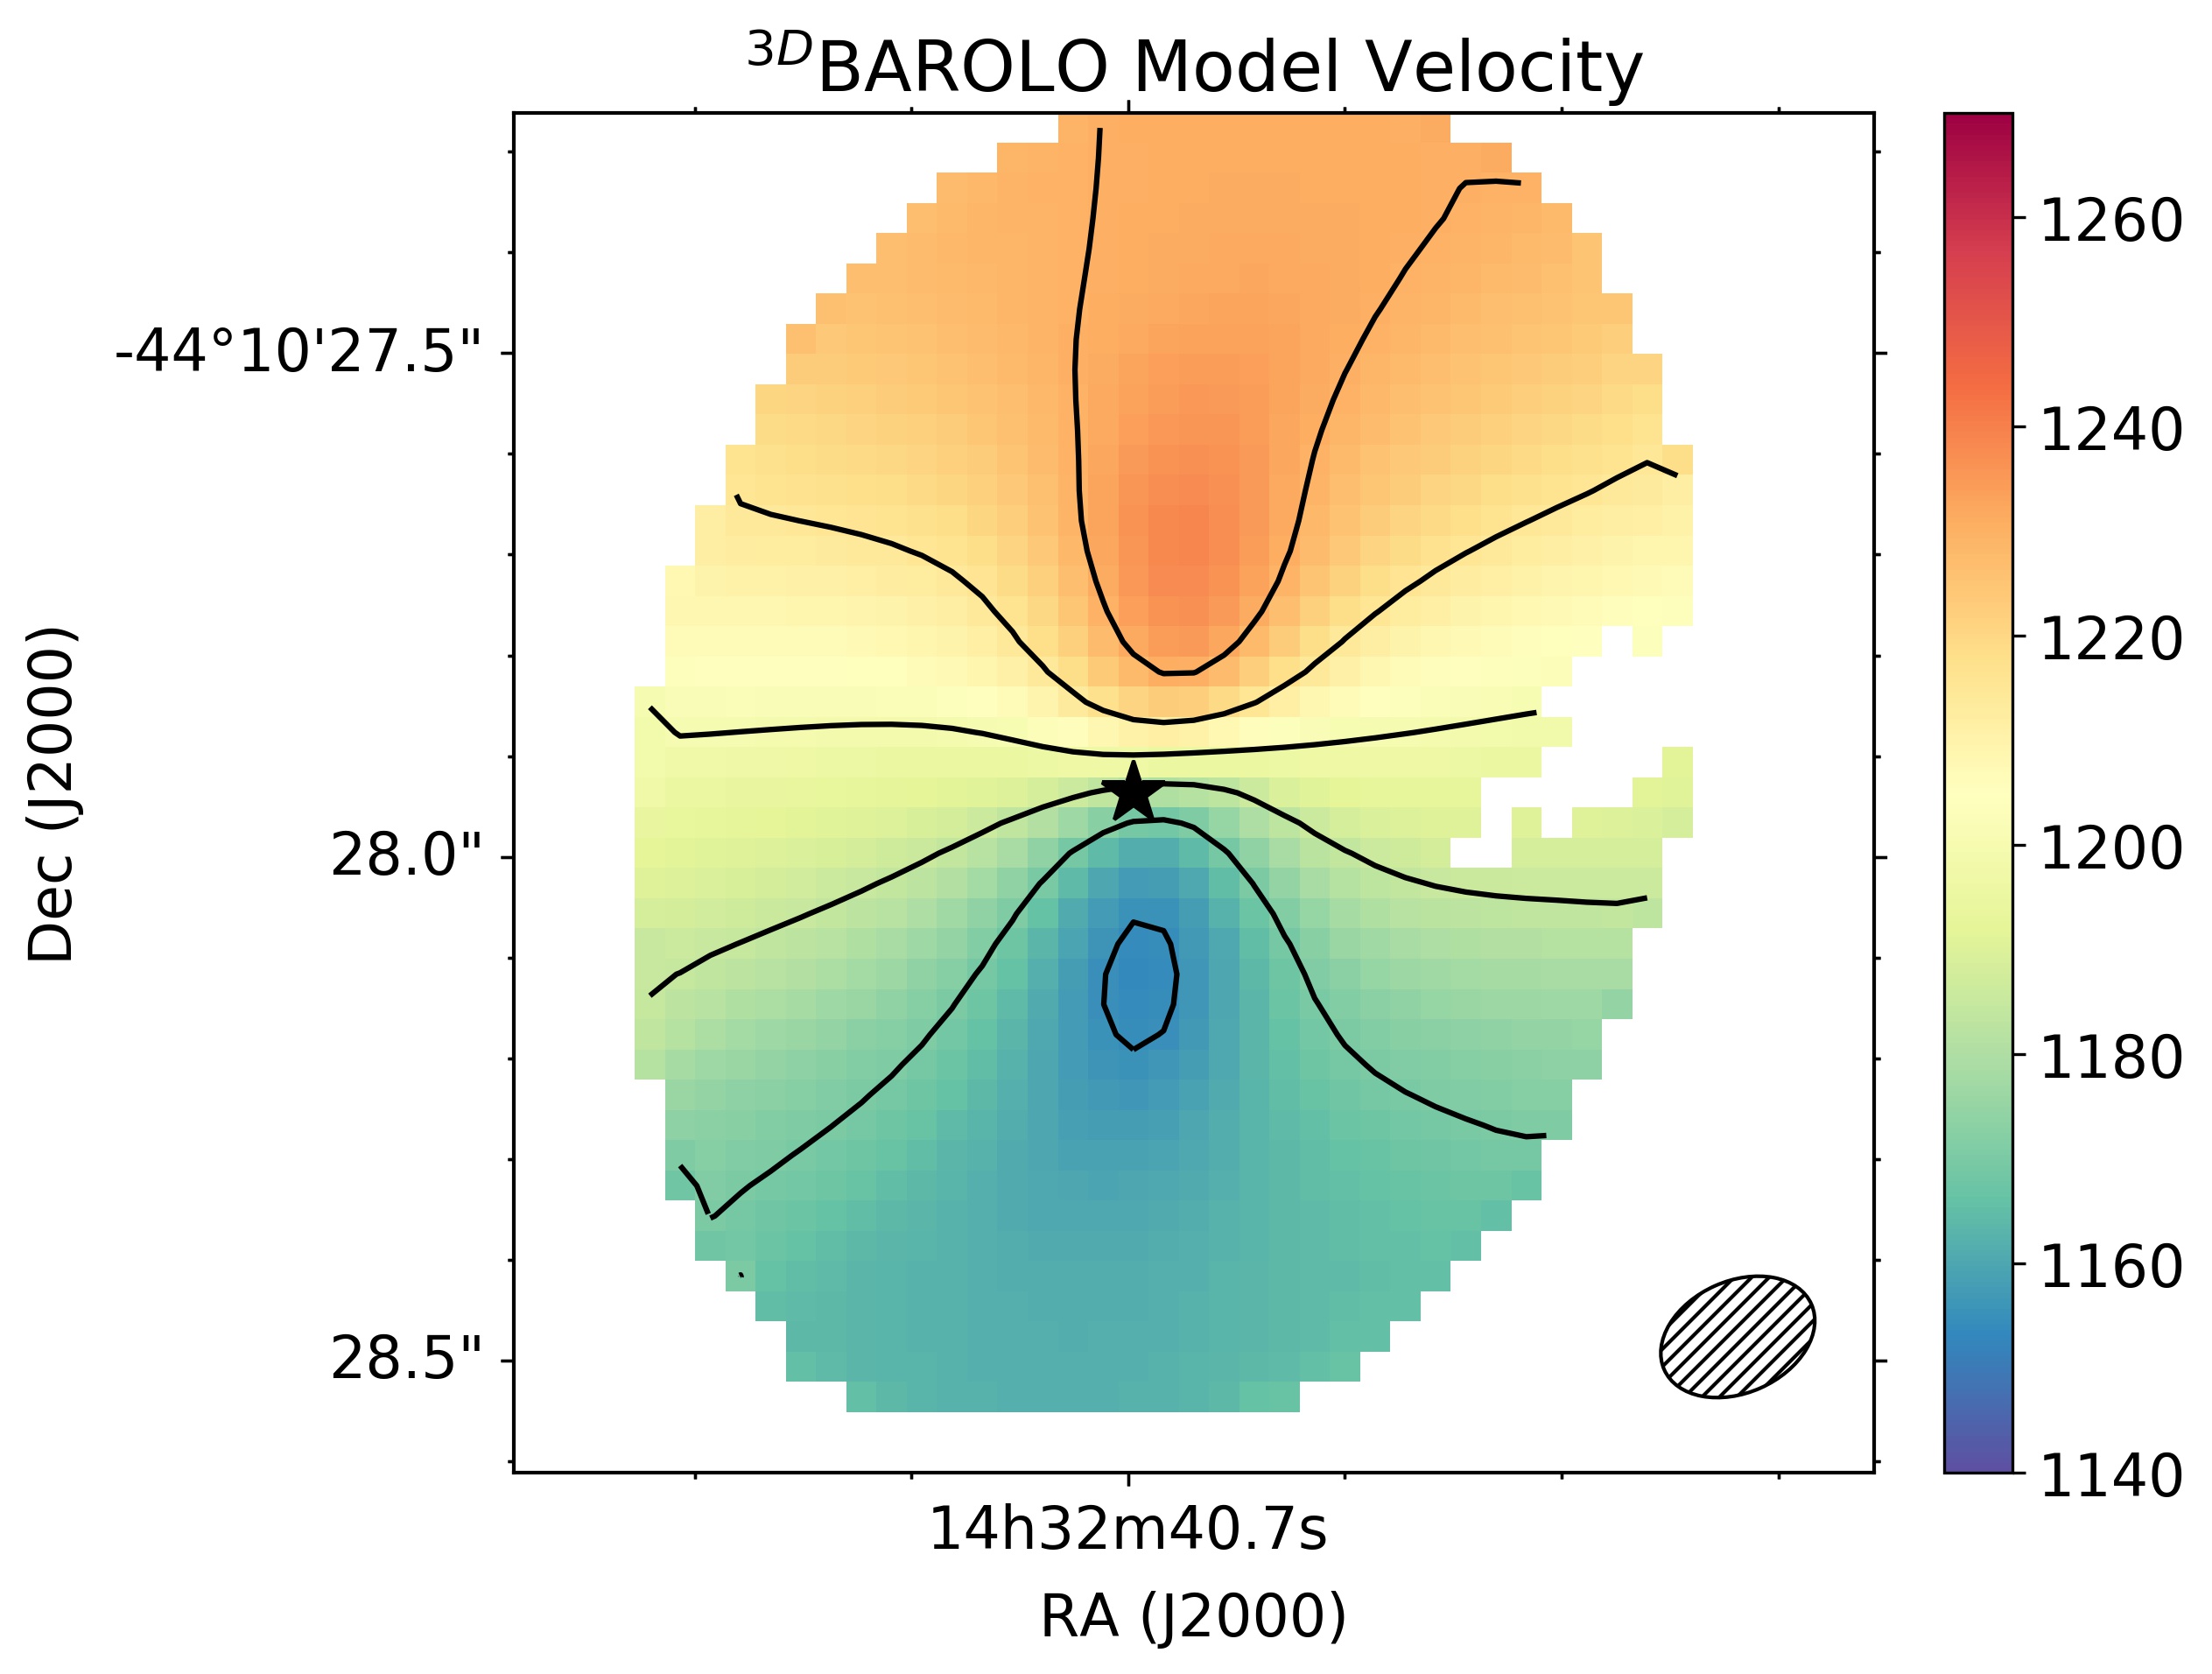
We followed the same procedure as explained in Section 3.2 to model the kinematics. For the nuclear disk we fixed the kinematic center to the position of the continuum peak. To derive the final 3DBAROLO model we fixed the nuclear disk geometry to and , and the systemic velocity to km s-1. These were the average values derived when running 3DBAROLO leaving these parameters as well as the circular velocity and velocity dispersion free. We note that the inclination of the nuclear disk is in good agreement with the inclination of ionization cone derived by Fischer et al. (2013) from the modelling of the narrow line region (NLR) kinematics, . If the cone is perpendicular to the collimating nuclear disk then this is equivalent to a nuclear disk inclination of 65. Finally, the detection of a H2O megamaser (Greenhill et al., 2003) implies a highly inclined view to the AGN.
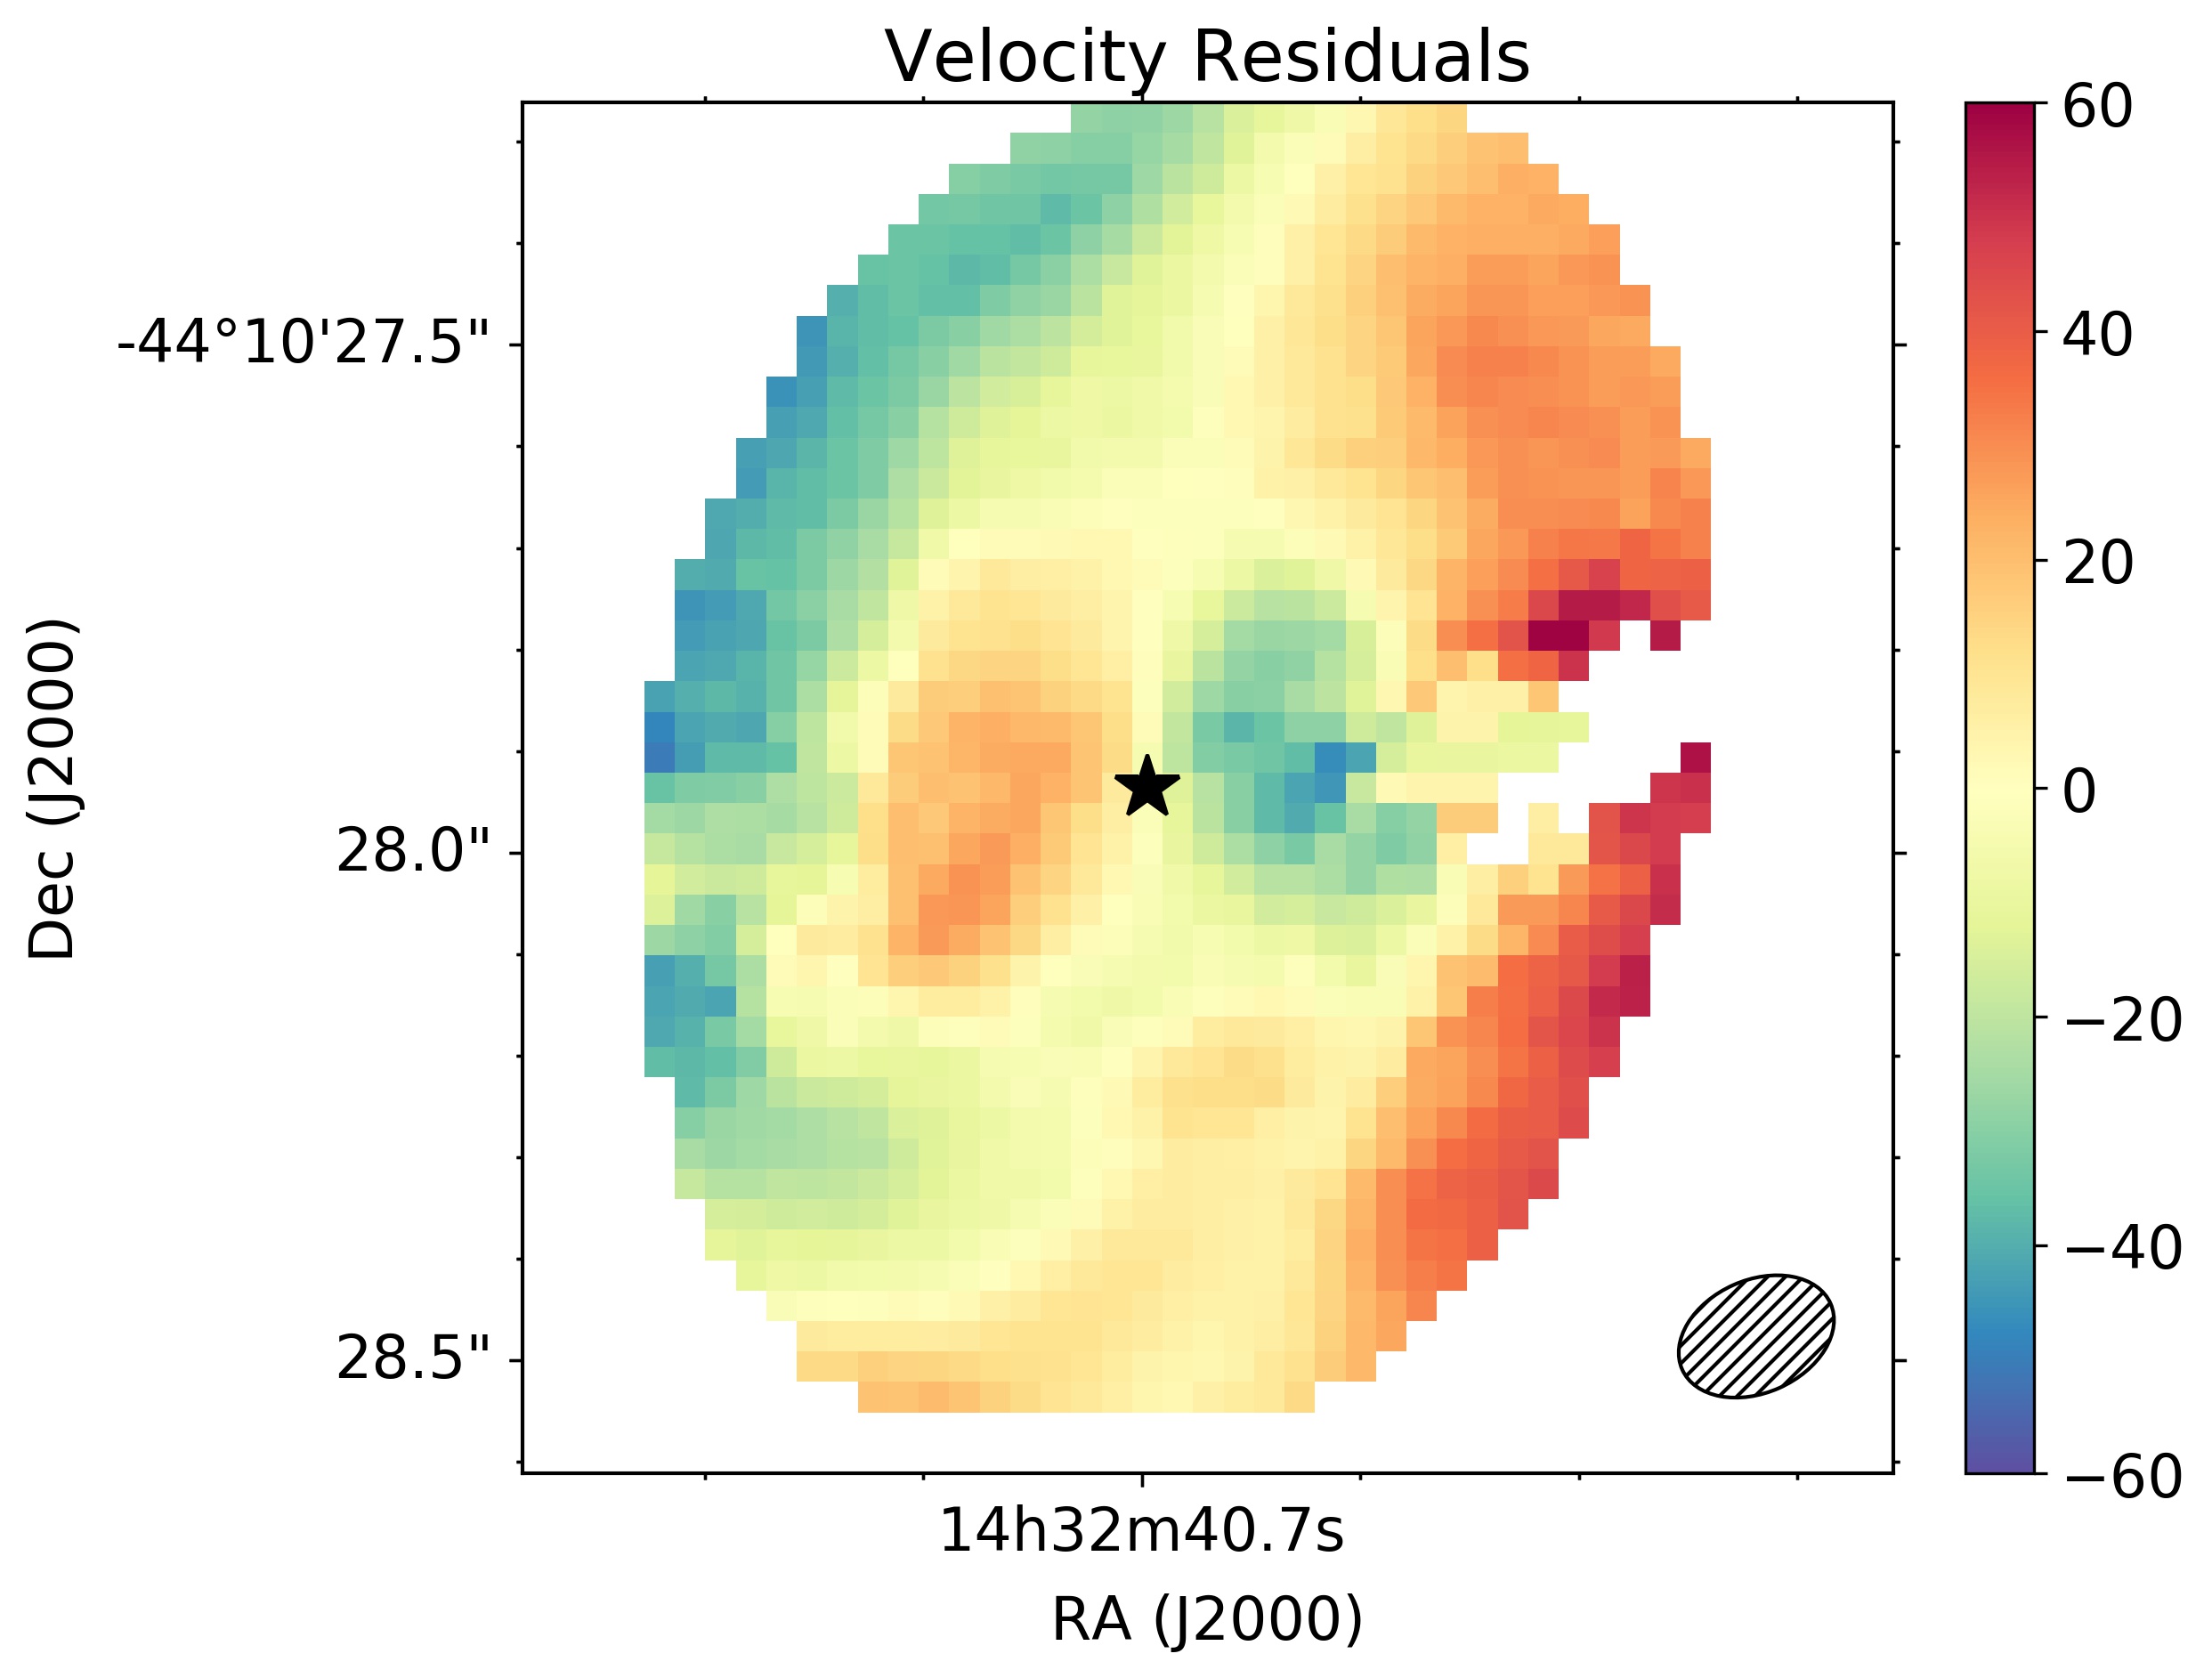
We show the 3DBAROLO model and the residual mean-velocity field in Figure 6 (middle and right panels). Since the nuclear disk appears to be seen almost edge-on we should not see velocity residuals along the minor axis of the nuclear disk if the velocity field was perfectly circular. The residuals are thus indicative of the presence of non-circular motions in the nuclear disk. As can be seen from this figure, near the AGN peak there are redshifted residuals to the east and blueshifted residuals to the west. Outside the nuclear disk the residuals are related to the velocity field of the larger scale disk of the galaxy which has a different inclination and position angle, as discussed in Section 3.2.
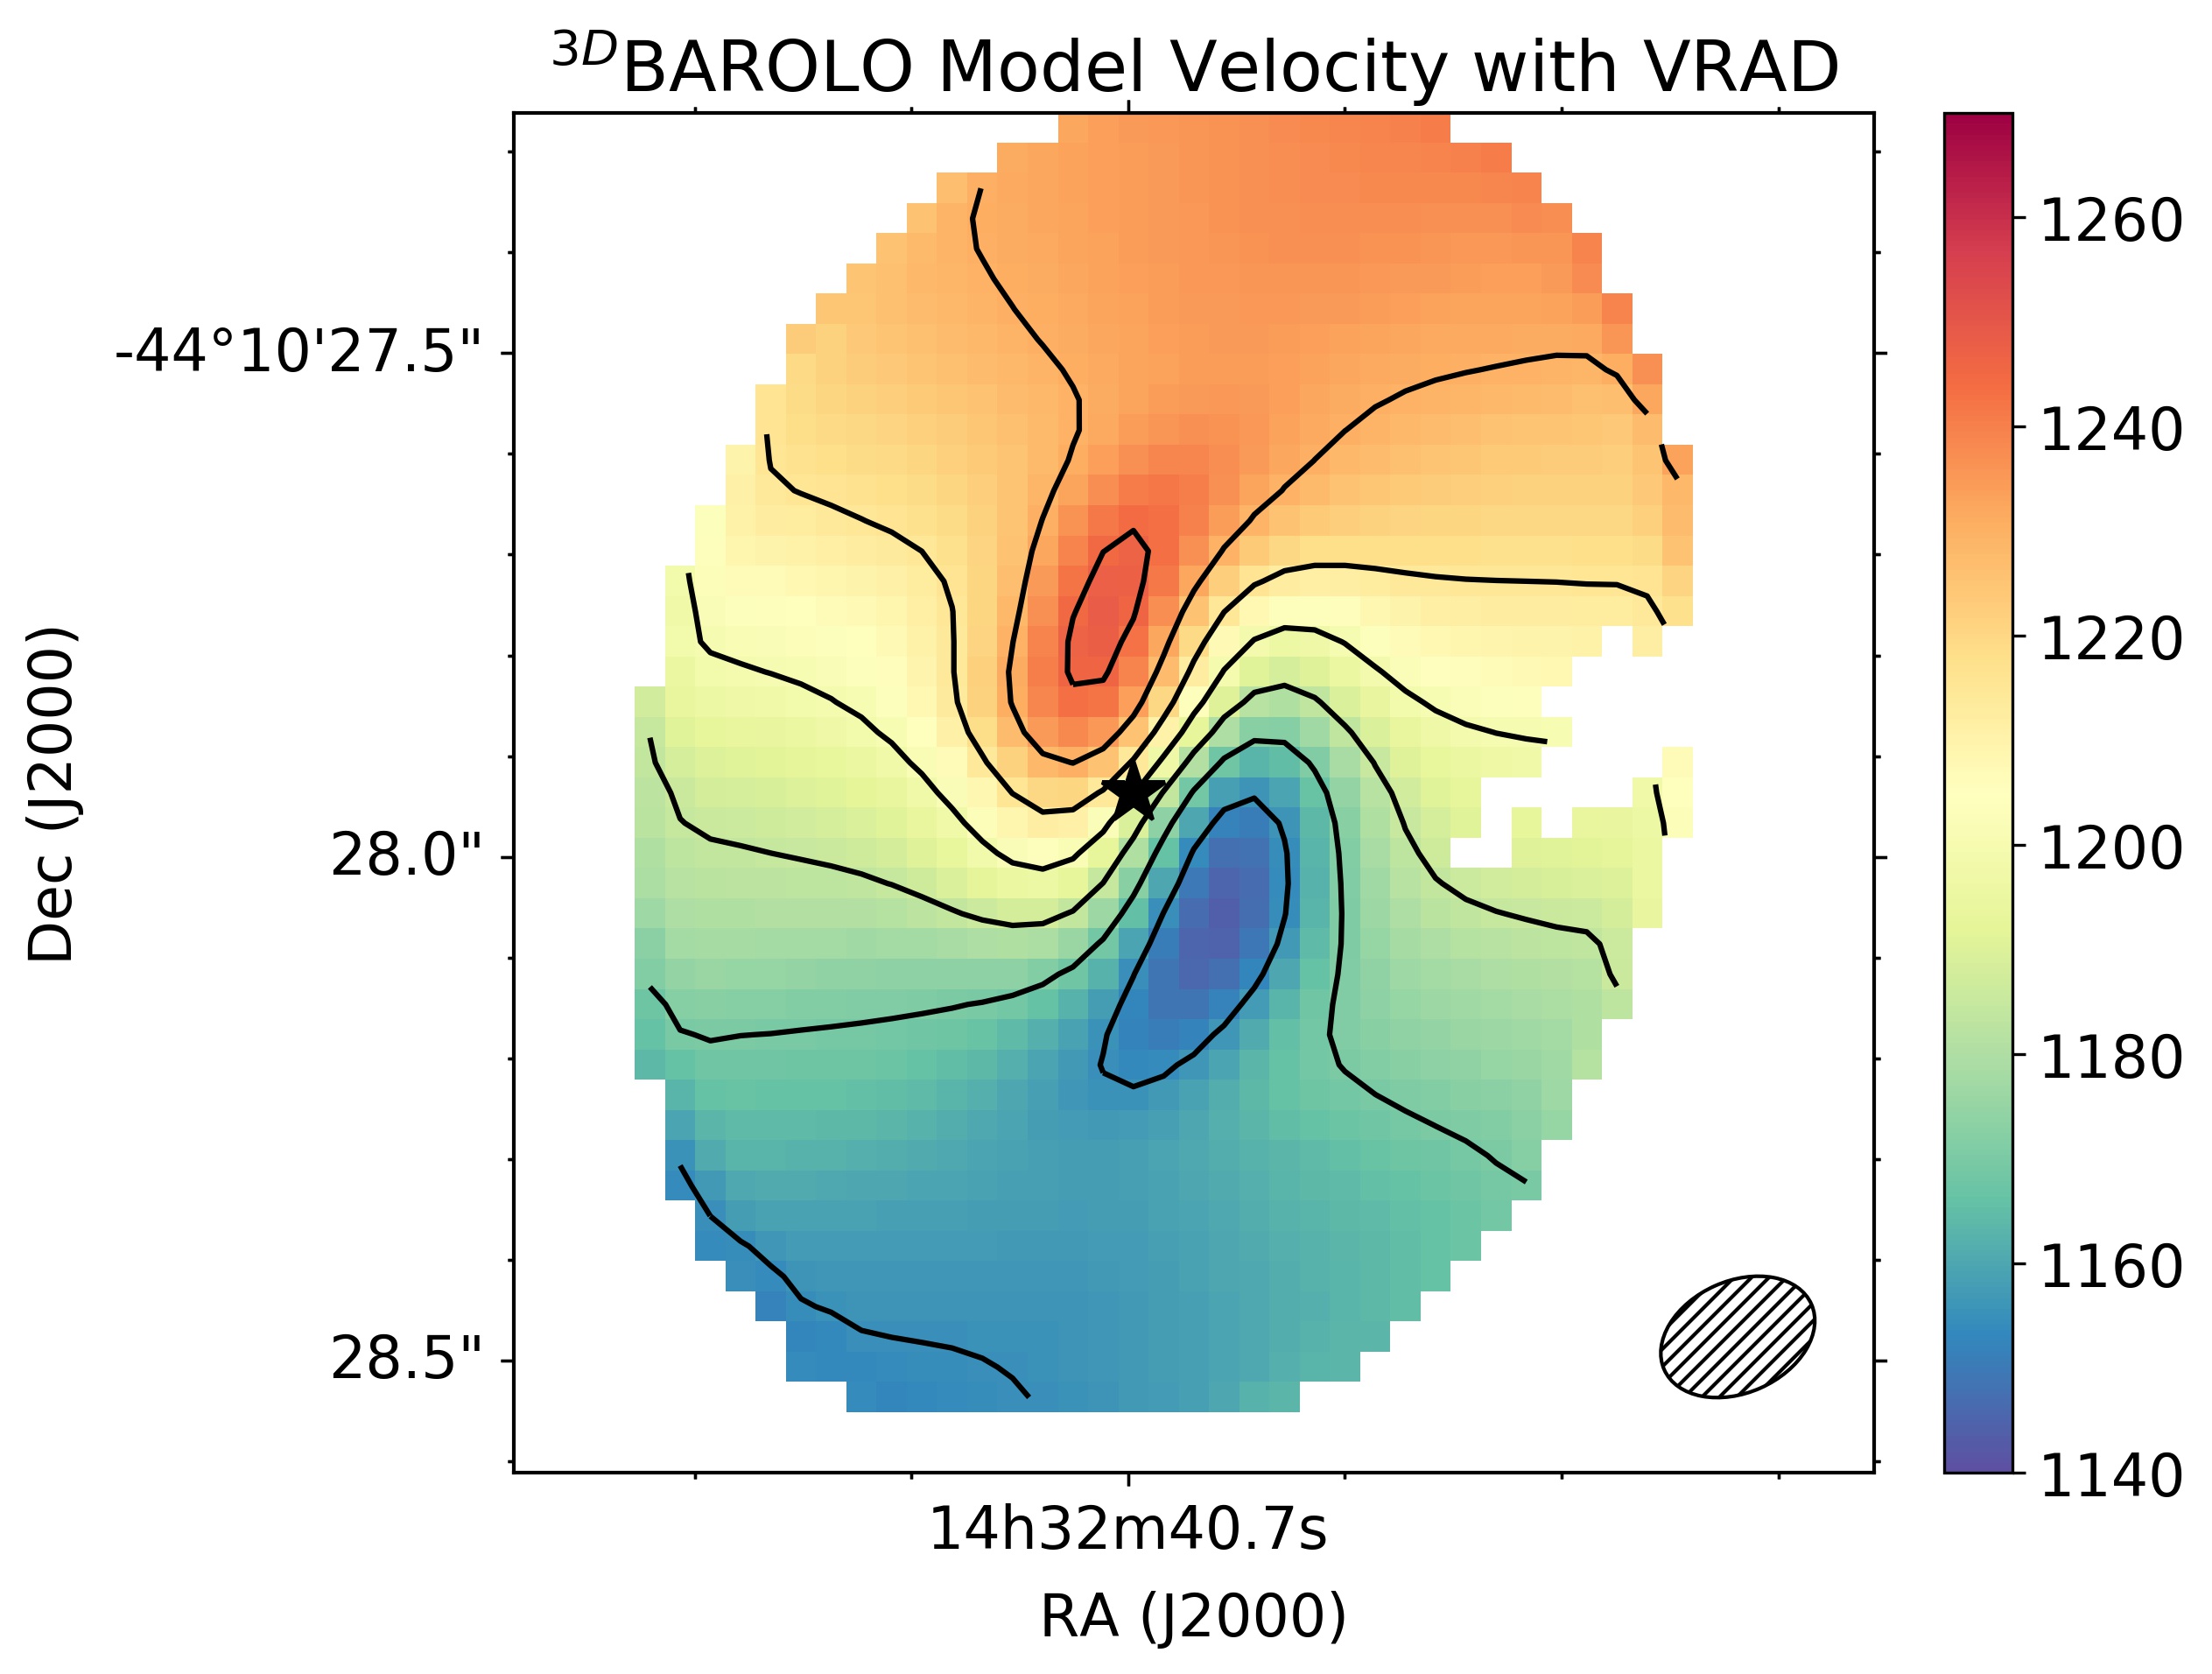
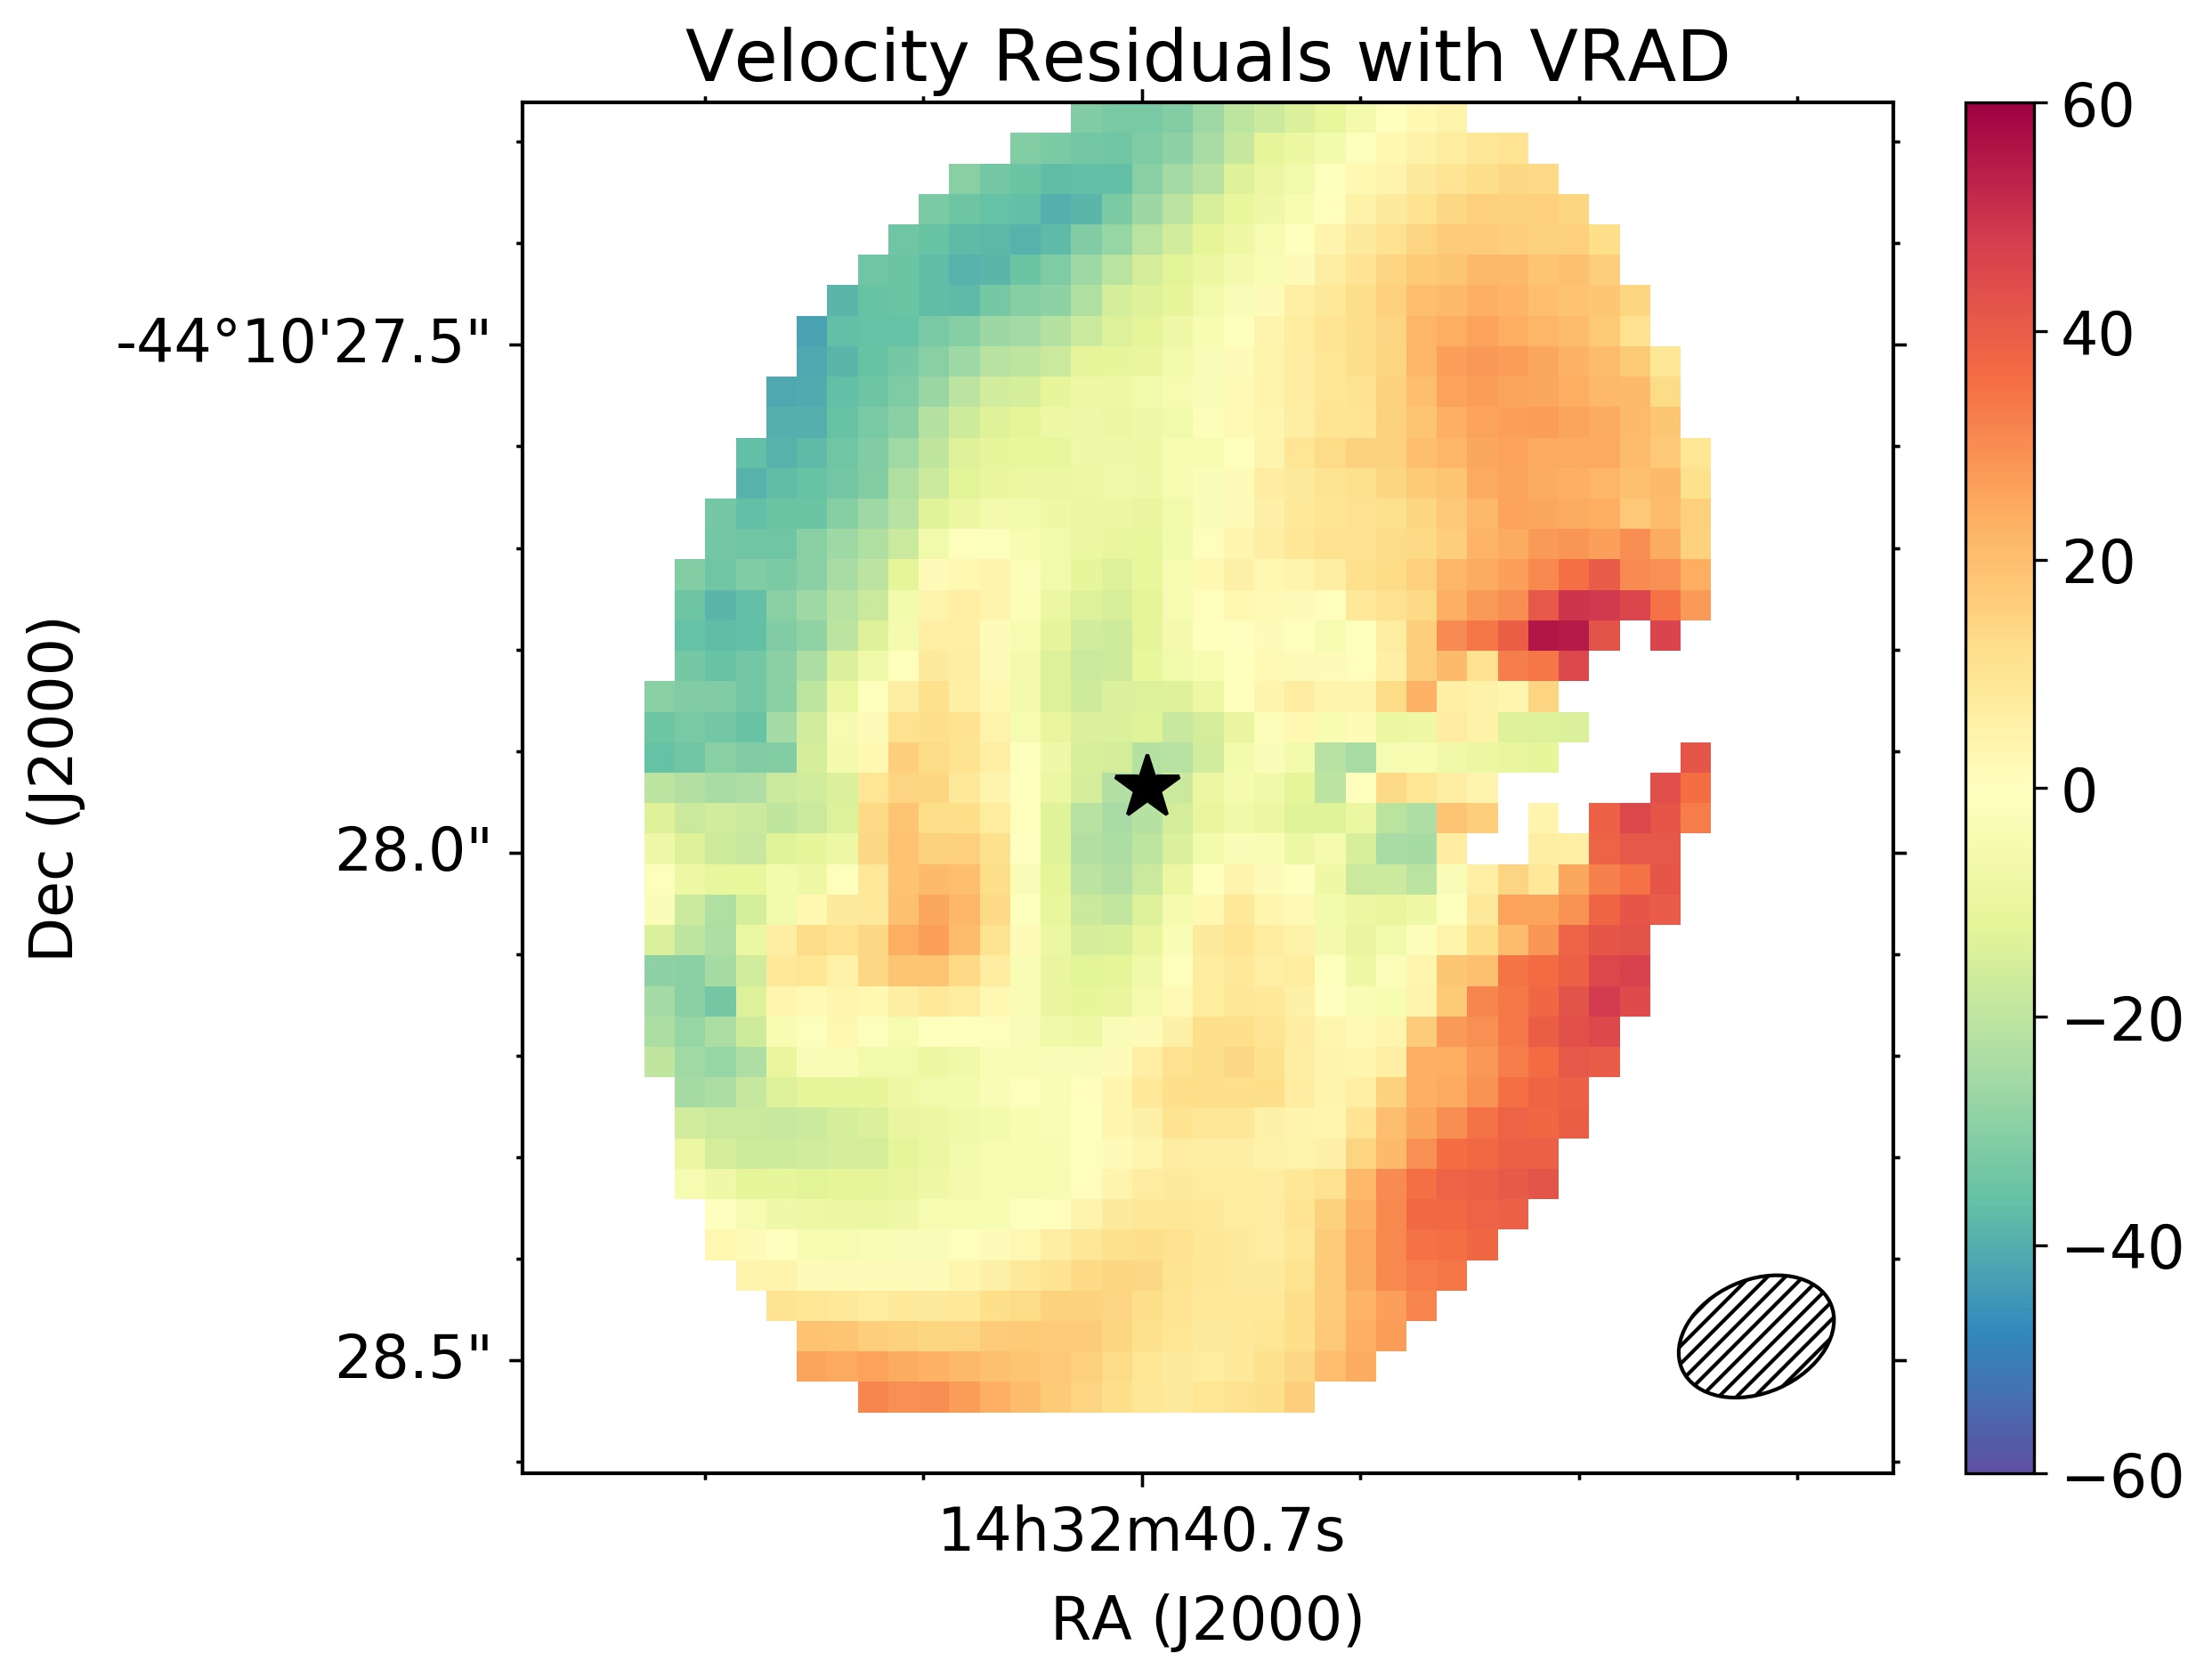
To account for the non-circular motions seen in the nuclear disk, we rerun 3DBAROLO including a radial velocity component with the same assumptions for the rotating disk as above. An inspection of Figure 7 reveals that the model with the extra radial velocity component reproduces better the observed velocity field with the residuals in the region of the nuclear disk being of the order of or less. The typical axisymmetric value of the radial velocity fitted by 3DBAROLO is of the order of 70 km s-1.
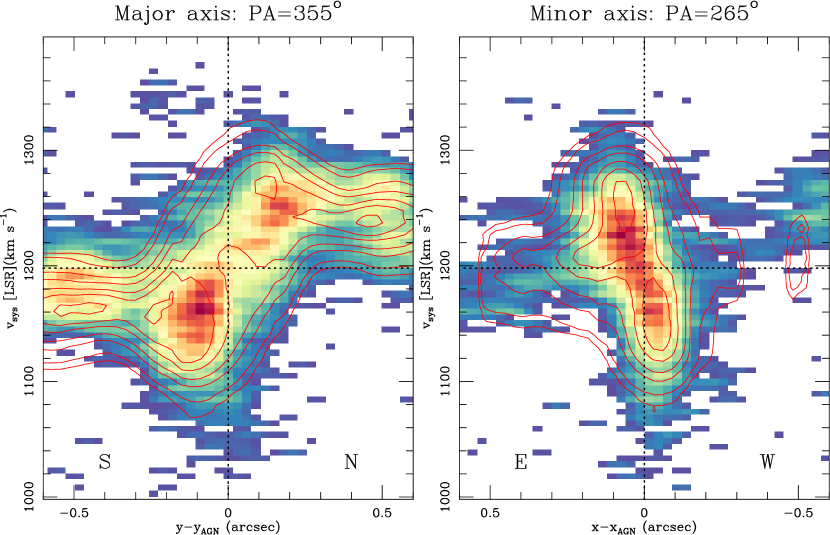
We also constructed position-velocity (p-v) diagrams taken along the kinematic major and minor axes of the nuclear CO(2–1) disk oriented, according to the fits obtained by 3DBAROLO along and , respectively. We used an aperture size of 0.2″ which is approximately equal to the beam size of the data cube. As seen from Figure 8, the CO(2–1) emission in the nuclear disk is spread over a wide range of velocities more or less symmetrically around km s-1: km s-1. The two p-v diagrams illustrate the kinematic decoupling of the nuclear CO(2–1) disk relative to the larger scale disk of the galaxy. The amplitude and even the sign of the characteristic mean line-of-sight velocities of the emission show a significant change beyond (30 pc) and (14 pc) in the major and minor axis p-v diagrams, respectively. These physical scales coincide with those derived from the morphology of the CO(2–1) intensity (Figure 5).
The behavior seen in the p-v diagram identifies the transition from the nuclear disk to the larger scale disk modeled in Section 3.2. Furthermore, the CO(2–1) nuclear disk shows strong non-circular motions. An inspection of the minor-axis p-v diagram indicates that the maximum observed deviations from rotational motions reach . The emission appears blueshifted (redshifted) on the western (eastern) side of the nuclear disk, as also seen in the mean velocity residual map in Figure 6. In Figure 8, we also plotted as contours the p-v diagram resulting from the 3DBAROLO fit with the radial velocity component. It is clear that this model is able to reproduce fairly well the non-circular motions in the nuclear region. We discuss the possible interpretations of this radial velocity component in Section 5.2.
4.3 Molecular gas mass
We measured a CO(2–1) line intensity over the nuclear region approximately of Jy km s-1 over a region of . Assuming a CO(1–0)/CO(2–1) brightness temperature ratio of one and using the relation of Sakamoto et al. (1999) with a Galactic CO-to-H2 conversion factor of (K km s we derived a molecular gas mass in the nuclear disk of . The typical uncertainty for the X-factor is 2–3 for gas clouds in our Galaxy (Bolatto et al., 2013). The nuclear disk of NGC 5643 is about a factor of 10 more massive than the torus in NGC 1068 (García-Burillo et al., 2016; Imanishi et al., 2018). This is not surprising given the different sizes measured in CO(2–1) for NGC 5643 (see Section 4.1) and in NGC 1068 using dense molecular gas tracers (García-Burillo et al., 2016; Imanishi et al., 2018). However, the size of the torus of NGC 1068 measured in the CO(2–1) and CO(3–2) transitions is about 20 pc and thus comparable to NGC 5643 (García-Burillo et al. 2018, in preparation). On the other hand, the derived molecular gas mass of the nuclear disk in NGC 5643 agrees well with the average gas mass for a sample of Seyfert galaxies from dynamical constraints assuming a gas fraction of 10% (Hicks et al., 2009).
We also estimated the dynamical mass enclosed in the nuclear disk regions by assuming a spheroid, in with R expressed in kpc, V in km s-1 (Lequeux, 1983). For the velocity we took the terminal value of km s-1 at ″ (see Figure 8) which is more appropriate for inclined disks. This leads to a dynamical mass of approximately , which would imply a gas fraction of approximately 20%.
The high molecular gas surface density in the nuclear disk of NGC 5643 would imply some star formation activity in the nuclear region as found for other Seyferts (Hicks et al., 2009). The detection of emission from the m polycyclic aromatic hydrocarbon (PAH) feature in the central pc (see Hönig et al., 2010; González-Martín et al., 2013) might be indicating on-going or recent star formation activity in the nuclear region.
4.4 Column Density
Having the molecular gas mass in the disk and the approximate size we computed an average column density of . This value is the column density averaged over the nuclear disk size of . The averaged column density is similar to those derived for Seyfert galaxies by Hicks et al. (2009) on similar physical scales using the near-infrared H2 line. If we only focus on the AGN position, as given by the 232 GHz continuum peak (see Figure 5) and at our angular resolution, we would derive a column density of . At the peak of the CO(2–1) emission the value of the column density is .
The derived H2 column density is short of the value derived from X-ray observations which provides a lower limit for the obscuring column density toward the AGN in NGC 5643 of (Annuar et al., 2015). However, the X-ray column is modelled through a narrow pencil beam towards the accretion disk. For type 2 AGN one would expect it to intersect high column clouds in the torus (or even the broad line region). On the other hand, the column measured from our ALMA data is averaged over a larger area which is defined by the beam of of the observations.
Another source of uncertainty in this comparison is the assumed CO-to-H2 conversion factor. Wada et al. (2018) computed the CO line chemistry from their radiation-driven fountain model fitted to the Circinus galaxy to derive the CO-to-H2 conversion factor. They demonstrated that this conversion factor depends strongly on the integrated intensity of the line for a given line of sight. For the brightness temperature derived at the location of the AGN or the peak of the CO(2–1) emission of NGC 5643 the predictions for CO-to-H2 conversion factor for the CO(2–1) line are 5-10 higher than the Galactic value with a large scatter (see their figure 5). We note that the inclinations of NGC 5643 and Circinus are similar (° vs. °). We note, however, that empirically the CO conversion factor tends to be lower in the centers of galaxies (Sandstrom et al., 2013).
5 Discussion and Conclusions
5.1 Circumnuclear scales
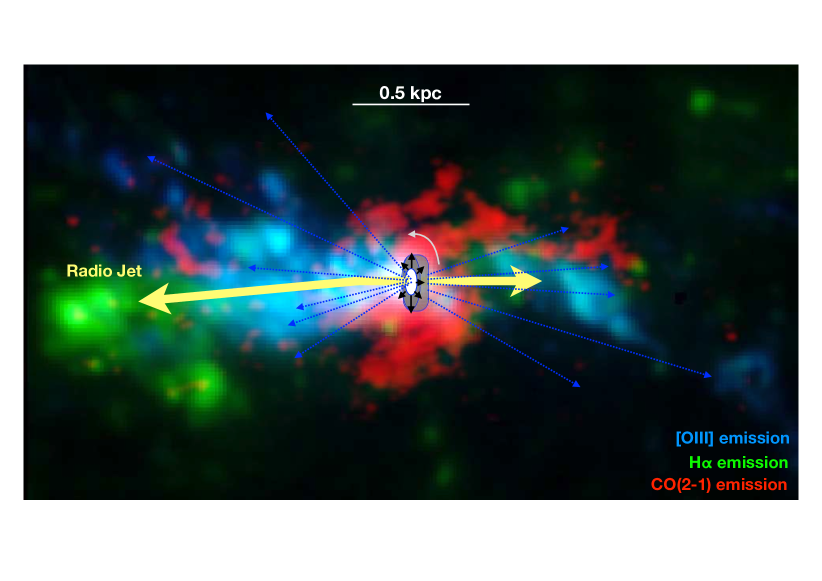
To further understand the connection between the cold molecular gas in the circumnuclear region of NGC 5643 and the outflow detected in ionized gas we produced a red-green-blue (RGB) image using the MUSE [O iii] image in blue, the MUSE H image in green (see Section 2.2), and the ALMA CO(2–1) image in red. The result is shown in Figure 9 with a FoV approximately equal to that of the lower panel of Figure 1. The RGB image shows nicely the ionization cone as traced by the [O iii] emission on the east side of the galaxy. Close to the AGN position the [O iii] emission from the counter-cone to the west is obscured by material in the host galaxy which is traced by the CO(2–1) nuclear spiral. The H emission on this side of the galaxy is less obscured, as expected (see Cresci et al., 2015, for an in-depth discussion).
Fischer et al. (2013) interpreted the extended [O iii] emission observed in some Seyfert galaxies as the result of the intersection between the disk of the host galaxy and the bicone. From their modeling of the NLR kinematics of NGC 5643 they inferred an angle between the NLR bicone axis and the normal to the host galaxy disk of . We derived an angle difference between the normals of the galaxy disk and the nuclear disk fitted with 3DBAROLO of ( if we take the value they used for the inclination of the galaxy). They also derived a cone half outer opening angle of . This implies that this rather wide ionization cone would intercept the host galaxy but only to the southeast of the AGN where the radio jet is also impacting on the host galaxy and producing positive feedback (Cresci et al., 2015).
To the northeast of the galaxy nucleus, some of the [O iii] filaments are coincident with the regions with CO(2–1) with redshifted velocity components (see Figures 2 and 4) and are mostly along the minor axis of the host galaxy. As interpreted for the hot molecular gas H2 emission by Davies et al. (2014), these components are probably due to gas excited on the edge of the cone. The spiral morphology of the CO(2–1) emission suggests that this emission is in the disk of the galaxy, and so is the gas with the redshifted velocity component. With this geometry the non-circular motions are due to molecular gas being pushed outwards in the disk of the galaxy (note that northeast is the far side of the galaxy disk and southwest the near side) by the AGN wind near the fourth spiral arm in the circumnuclear region. The region with the blueshifted velocity component to the southwest of the AGN can also be explained as gas being pushed outwards by the ionized outflow and moving towards us. A similar interaction between the outflow detected in ionized gas and the cold molecular gas in the galaxy disk with blueshifted and redshifted velocity components has been observed in the Circinus galaxy (Zschaechner et al., 2016).
We also plotted in the cartoon of Figure 9 the approximate orientation of the radio emission/jet (Morris et al., 1985; Leipski et al., 2006) pointing to the location of the H ii regions with bright H emission. Cresci et al. (2015) proposed that these regions are the result of positive feedback induced by gas compression by the AGN outflow. Although faint, we detected CO(2–1) emission at the location of these star-forming clumps. The passage of the radio jet through the disk of the galaxy might be responsible for clearing the CO(2–1) molecular gas in the eastern side spiral arm in a region the nucleus of NGC 5643 (see Figure 1).
5.2 Nuclear scales
We have detected a massive () nuclear disk in NGC 5643. The size of the nuclear disk measured from the Band 6 CO(2–1) integrated emission is approximately 26 pc (FWHM). This is in fairly good agreement with the typical sizes (radius of 30 pc) derived for nuclear disks from hot molecular gas H2 m by Hicks et al. (2009). The disk/torus of NGC 5643 is a factor of two-to-three larger than that detected by ALMA in CO(6–5) in the Seyfert 2 galaxy NGC 1068 (pc, see García-Burillo et al., 2016). One possible explanation is that the CO(6–5) line traces denser gas than CO(2–1) and thus it probes molecular gas that needs to be closer to the AGN to be excited. Indeed, our new ALMA CO(2–1) and CO(3–2) observations of NGC 1068 reveal a larger structure (diameter pc) than seen in CO(6–5) which is also well connected with the circumnuclear disk (García-Burillo et al. 2018, in preparation). The molecular gas column density averaged over the ALMA beam of our observations and at the AGN location is . The material in the nuclear disk is likely responsible, at least in part, for obscuring the AGN in NGC 5643.
The modeling of the CO(2–1) kinematics in the nuclear region clearly implies the presence of non-circular motions, with a maximum amplitude of , in the inner (16 pc). However, their interpretation requires a detailed knowledge of the nuclear potential and in particular whether there is a nuclear bar in NGC 5643 or not. Using near-infrared imaging observations, Jungwiert et al. (1997) detected an isophotal twist between radial distances of and . This feature could be indicative of the presence of a nuclear bar with . In fact, it is possible that the nuclear arc structures could be associated with such a bar although they are on smaller scales (see Figure 5). In this scenario the radial motions seen in the inner 1″ could be interpreted as gas elliptical stream lines in a nuclear bar. In a dynamically decoupled nuclear bar the observed kinematics could be explained as both inflowing and outflowing radial motions.
In the absence of a putatively decoupled nuclear stellar bar, the canonical gas response to the large scale bar in the framework of the epicyclic approximation inside the inner Lindblad resonance would favor the presence of inward radial motions (see Figure 3 of Wong et al., 2004). Therefore, in a coplanar geometry with the nuclear disk (see the assumed orientation of the nuclear disk in Figure 9) the non-circular motions are not due to the large scale bar and could be explained as due to material outflowing in the plane of the nuclear disk. This reproduces the blueshifted velocities on the western side of the nuclear disk and redshifted velocities on the eastern side of the nuclear disk (see p-v along the minor axis of the nuclear disk in Fig. 8). The ionized gas in NGC 5643 is outflowing (blueshifted emission at the AGN location in the MUSE [O iii] emission) perpendicular to the nuclear disk (Cresci et al., 2015). The different location for the molecular gas and ionized gas is predicted by the radiation-driven fountain model simulations done for the Circinus galaxy (Wada et al., 2016, 2018). In particular this model shows that most of the nuclear molecular gas emission is expected in the equatorial plane of the nuclear disk with no dense molecular winds outflowing along the rotational axis, while the ionized gas is outflowing perpendicular to the disk. A similar equatorial outflow has been observed in the Seyfert 2 galaxy NGC 5929 by Riffel et al. (2014) on scales even larger (pc) than in NGC 5643.
We conclude that the Band 6 CO(2–1) observations have resolved a massive nuclear molecular gas rotating disk/torus in NGC 5643 with strong non-circular motions. The inclination of the nuclear disk agrees with the inclination required to model the ionization cone emission traced by [O iii] and H emission (Fischer et al., 2013). Thus the CO(2-1) disk/torus is likely collimating the ionization cone of NGC 5643 as well as obscuring the AGN. In the framework of the AGN Unified Model (Antonucci, 1993), the detected disk could be interpreted as the obscuring torus.
References
- Alonso-Herrero et al. (2011) Alonso-Herrero, A., Ramos Almeida, C., Mason, R. et al. 2011, ApJ, 736, 82
- Annuar et al. (2015) Annuar, A. et al. 2015, ApJ, 815, 36
- Antonucci (1993) Antonucci, R. 1993, ARA&A, 31, 473
- Bacon et al. (2010) Bacon, R., Accardo, M., Adjali, L., et al. 2010, Proc. SPIE, 7735, 773508
- Baumgartner et al. (2013) Baumgartner, W. H. et al. 2013, ApJS, 207, 19
- Bianchi et al. (2006) Bianchi, S., Guainazzi, M., & Chiargerge, M. 2006, A&A, 448, 499
- Bolatto et al. (2013) Bolatto, A. D., Wolfire, M., & Leroy, A. K. 2013, ARA&A, 51, 207
- Briggs (1995) Briggs, D. S. 1995, PhD thesis, New Mexico Institute of Mining and Technology
- Burtscher et al. (2013) Burtscher, L., et al. 2013, A&A, 558, A149
- Combes et al. (2013) Combes, F., et al. 2013, A&A, 558, A124
- Cresci et al. (2015) Cresci, G., Marconi, A., Zibetti, S. et al. 2015, A&A, 582, A63
- Dale et al. (2005) Dale, D. A. et al. 2005, AJ, 129, 2197
- Davies et al. (2007) Davies, R. I., Mueller Sánchez, F., Genzel, R., Tacconi, L. J., Hicks, E. K. S., Friedrich, S. 2007, ApJ, 671, 1388
- Davies et al. (2014) Davies, R. I., Maciejewski, W., Hicks, E. K. S. et al., 2014, ApJ, 792, 101
- Di Teodoro & Fraternali (2015) Di Teodoro, E. M., & Fraternali, F. 2015, MNRAS, 451, 3921
- Emsellem et al. (2001) Emsellem, E. et al. 2001, 2001, A&A, 368, 52
- Esquej et al. (2014) Esquej, P., et al. 2014, ApJ, 780, 86
- Fischer et al. (2013) Fischer, T. C., Crenshaw, D. M., Kraemer, S., B., & Schmitt, H. R. 2013, ApJS, 209, 1
- Fuller et al. (2016) Fuller, L., et al. 2016, MNRAS, 462, 2618
- Gallimore et al. (2016) Gallimore, J. F. et al., 2016, ApJ, 829, L7
- García-Burillo et al. (2005) García-Burillo, S., Combes, F., Schinnerer, E., Boone, F., Hunt, L. K. 2005, A&A, 441, 1011
- García-Burillo et al. (2014) García-Burillo, S. et al. 2014, A&A, 567, A125
- García-Burillo et al. (2016) García-Burillo, S. et al. 2016, ApJ, 823, L12
- Gómez-Guijarro et al. (2017) Gómez-Guijarro, C., et al. 2017, MNRAS, 469, 2720
- González-Martín et al. (2013) González-Martín, O. et al. 2013, A&A, 553, A35
- Greenhill et al. (2003) Greenhill, L. J. et al. 2003, ApJ, 582, L11
- Guainazzi et al. (2004) Guainazzi, M., Rodriguez-Pascual, P., Fabian, A. C., Iwasawa, K., Matt, G. 2004, MNRAS, 355, 297
- Hicks et al. (2009) Hicks, E. K. S., et al. 2009, ApJ, 696, 448
- Hicks et al. (2013) Hicks, E. K. S., et al. 2013, ApJ, 768, 107
- Ho et al. (2011) Ho, L. C., Li, Z.-H., Barth, A. J., Seigar, M. S., Peng, C. Y. 2011, ApJS, 197, 21
- Hönig et al. (2010) Hönig, S. F., et al. 2010, A&A, 515, A23
- Hopkins & Quataert (2010) Hopkins, P. F. & Quataert, E. 2010, MNRAS, 407, 1529
- Ichikawa et al. (2015) Ichikawa, K., et al. 2015, ApJ, 803, 57
- Imanishi et al. (2018) Imanishi, M., Nakanishi, K., Izumin, T., & Wada, K. 2018, ApJ, 853, L24
- Izumi et al. (2016) Izumi, T., Kawakatu, N., Kohno, K. 2016, ApJ, 827, 81
- Jungwiert et al. (1997) Jungwiert, B., Combes, F., & Axon, D. J. 1997, A&AS, 125, 479
- Krause et al. (2007) Krause, M., Fendt, C., Neininger, N. 2007, A&A, 467, 1037
- Krips et al. (2007) Krips, M. et al. 2007, A&A, 468, L63
- Leipski et al. (2006) Leipski, C., Falcke, H., Bennert, N., Hüttemeister, S. 2006, A&A, 455, 161
- Lequeux (1983) Lequeux, J. 1983, A&A, 125, 394
- Lin et al. (2016) Lin, M.-Y., et al. 2016, MNRAS, 458, 1375
- López-Gonzaga et al. (2014) López-Gonzaga, N., Jaffe, W., Burtscher, L., Tristram, K. R., W., Meisenheimer, K. 2014, A&A, 565, A71
- Maciejewski (2004) Maciejewski, W. 2004, MNRAS, 354, 892
- Martí-Vidal et al. (2014) Martín-Vidal, I., Vlemmings, W. H. T., Muller, S., Casey, S. 2014, A&A, 563, A136
- Martini et al. (2003) Martini, P., Regan, M. W., Mulchaey, J. S., Pogge, R. W. 2003, ApJ, 589, 774
- McMullin et al. (2007) McMullin, J. P., Waters, B., Schiebel, D., Young, W., & Golap, K. 2007, in Astronomical Society of the Pacific Conference Series, Vol. 376, Astronomical Data Analysis Software and Systems XVI, ed. R. A. Shaw, F. Hill, & D. J. Bell, 127
- Monje et al. (2011) Monje, R. R., Blain, A. W., Phillips, T. G. 2011, ApJS, 195, 23
- Morris et al. (1985) Morris, S., Ward, M., Whittle, M., Wilson, A. S., & Taylor, K. 1985, MNRAS, 216, 193
- Mouri (1994) Mouri, H. 1994, ApJ, 427, 777
- Mulchaey et al. (1997) Mulchaey, J. S., Regan, M. W., & Kundu, A. 1997, ApJS, 110, 299
- Querejeta et al. (2016) Querejeta, M., et al. 2016, A&A, 593, 118
- Quillen et al. (1999) Quillen, A. C., Alonso-Herrero, A., Rieke, M. J., Rieke, G. H., Ruiz, M., Kulkarni, V. 1999, ApJ, 527, 696
- Ramos Almeida et al. (2011) Ramos Almeida, C., et al. 2011, ApJ, 731, 92
- Ramos Almeida et al. (2016) Ramos Almeida, C., et al. 2016, MNRAS, 461, 1387
- Regan & Mulchaey (1999) Regan, M. W., & Mulchaey, J. S. 1999, AJ, 117, 2676
- Ricci et al. (2015) Ricci, C. et al. 2015, ApJ, 815, L13
- Riffel et al. (2014) Riffel, R. A., Storchi-Bergmann, T. & Riffel, R. 2014, ApJ, 780, L24
- Sakamoto et al. (1999) Sakamoto, K., Okumura, S. K., Ishizuki, S., Scoville, N. Z. 1999, ApJS, 124, 403
- Salak et al. (2017) Salak, D., Tomiyasu, Y., Nakai, N., Kuno, N. et al. 2017, ApJ, 849, 90
- Sandstrom et al. (2013) Sandstrom, K. M. et al. 2013, ApJ, 777, 5
- Sani et al. (2012) Sani, E., et al. 2012, MNRAS, 424, 1963
- Schinnerer et al. (2000) Schinnerer, E., Eckart, A., Tacconi, L. J. 2000, ApJ, 533, 826
- Simpson et al. (1997) Simpson, C., Wilson, A. S., Bower, G. et al. 1997, ApJ, 474, 121
- Tacconi et al. (1994) Tacconi, L. J. et al. 1994, ApJ, 426, L77
- Tristram et al. (2009) Tristram, K. R. W. et al. 2009, A&A, 502, 67
- Wada et al. (2016) Wada, K., Schartmann, M., & Meijerink, R., 2016, ApJ, 828, L19
- Wada et al. (2018) Wada, K., Fukushige, R., Izumi, T., Tomisaka, K. 2018, ApJ, 852, 88
- Wong et al. (2004) Wong, T., Blitz, L., & Bosma, A. 2004, ApJ, 605, 183
- Zschaechner et al. (2016) Zschaechner, L. K. et al. 2016, ApJ, 832, 142