The Maximum Stellar Surface Density Due to the Failure of Stellar Feedback
Abstract
A maximum stellar surface density is observed across all classes of dense stellar systems (e.g. star clusters, galactic nuclei, etc.), spanning orders of magnitude in mass. It has been proposed that this characteristic scale is set by some dynamical feedback mechanism preventing collapse beyond a certain surface density. However, simple analytic models and detailed simulations of star formation moderated by feedback from massive stars argue that feedback becomes less efficient at higher surface densities (with the star formation efficiency increasing as ). We therefore propose an alternative model wherein stellar feedback becomes ineffective at moderating star formation above some , so the supply of star-forming gas is rapidly converted to stars before the system can contract to higher surface density. We show that such a model – with taken directly from the theory – naturally predicts the observed . because the gas consumption time is longer than the global freefall time even when feedback is ineffective. Moreover the predicted is robust to spatial scale and metallicity, and is preserved even if multiple episodes of star formation/gas inflow occur. In this context, the observed directly tells us where feedback fails.
keywords:
galaxies: formation – galaxies: evolution – galaxies: active – galaxies: star formation – cosmology: theory – galaxies: star clusters: general1 Introduction
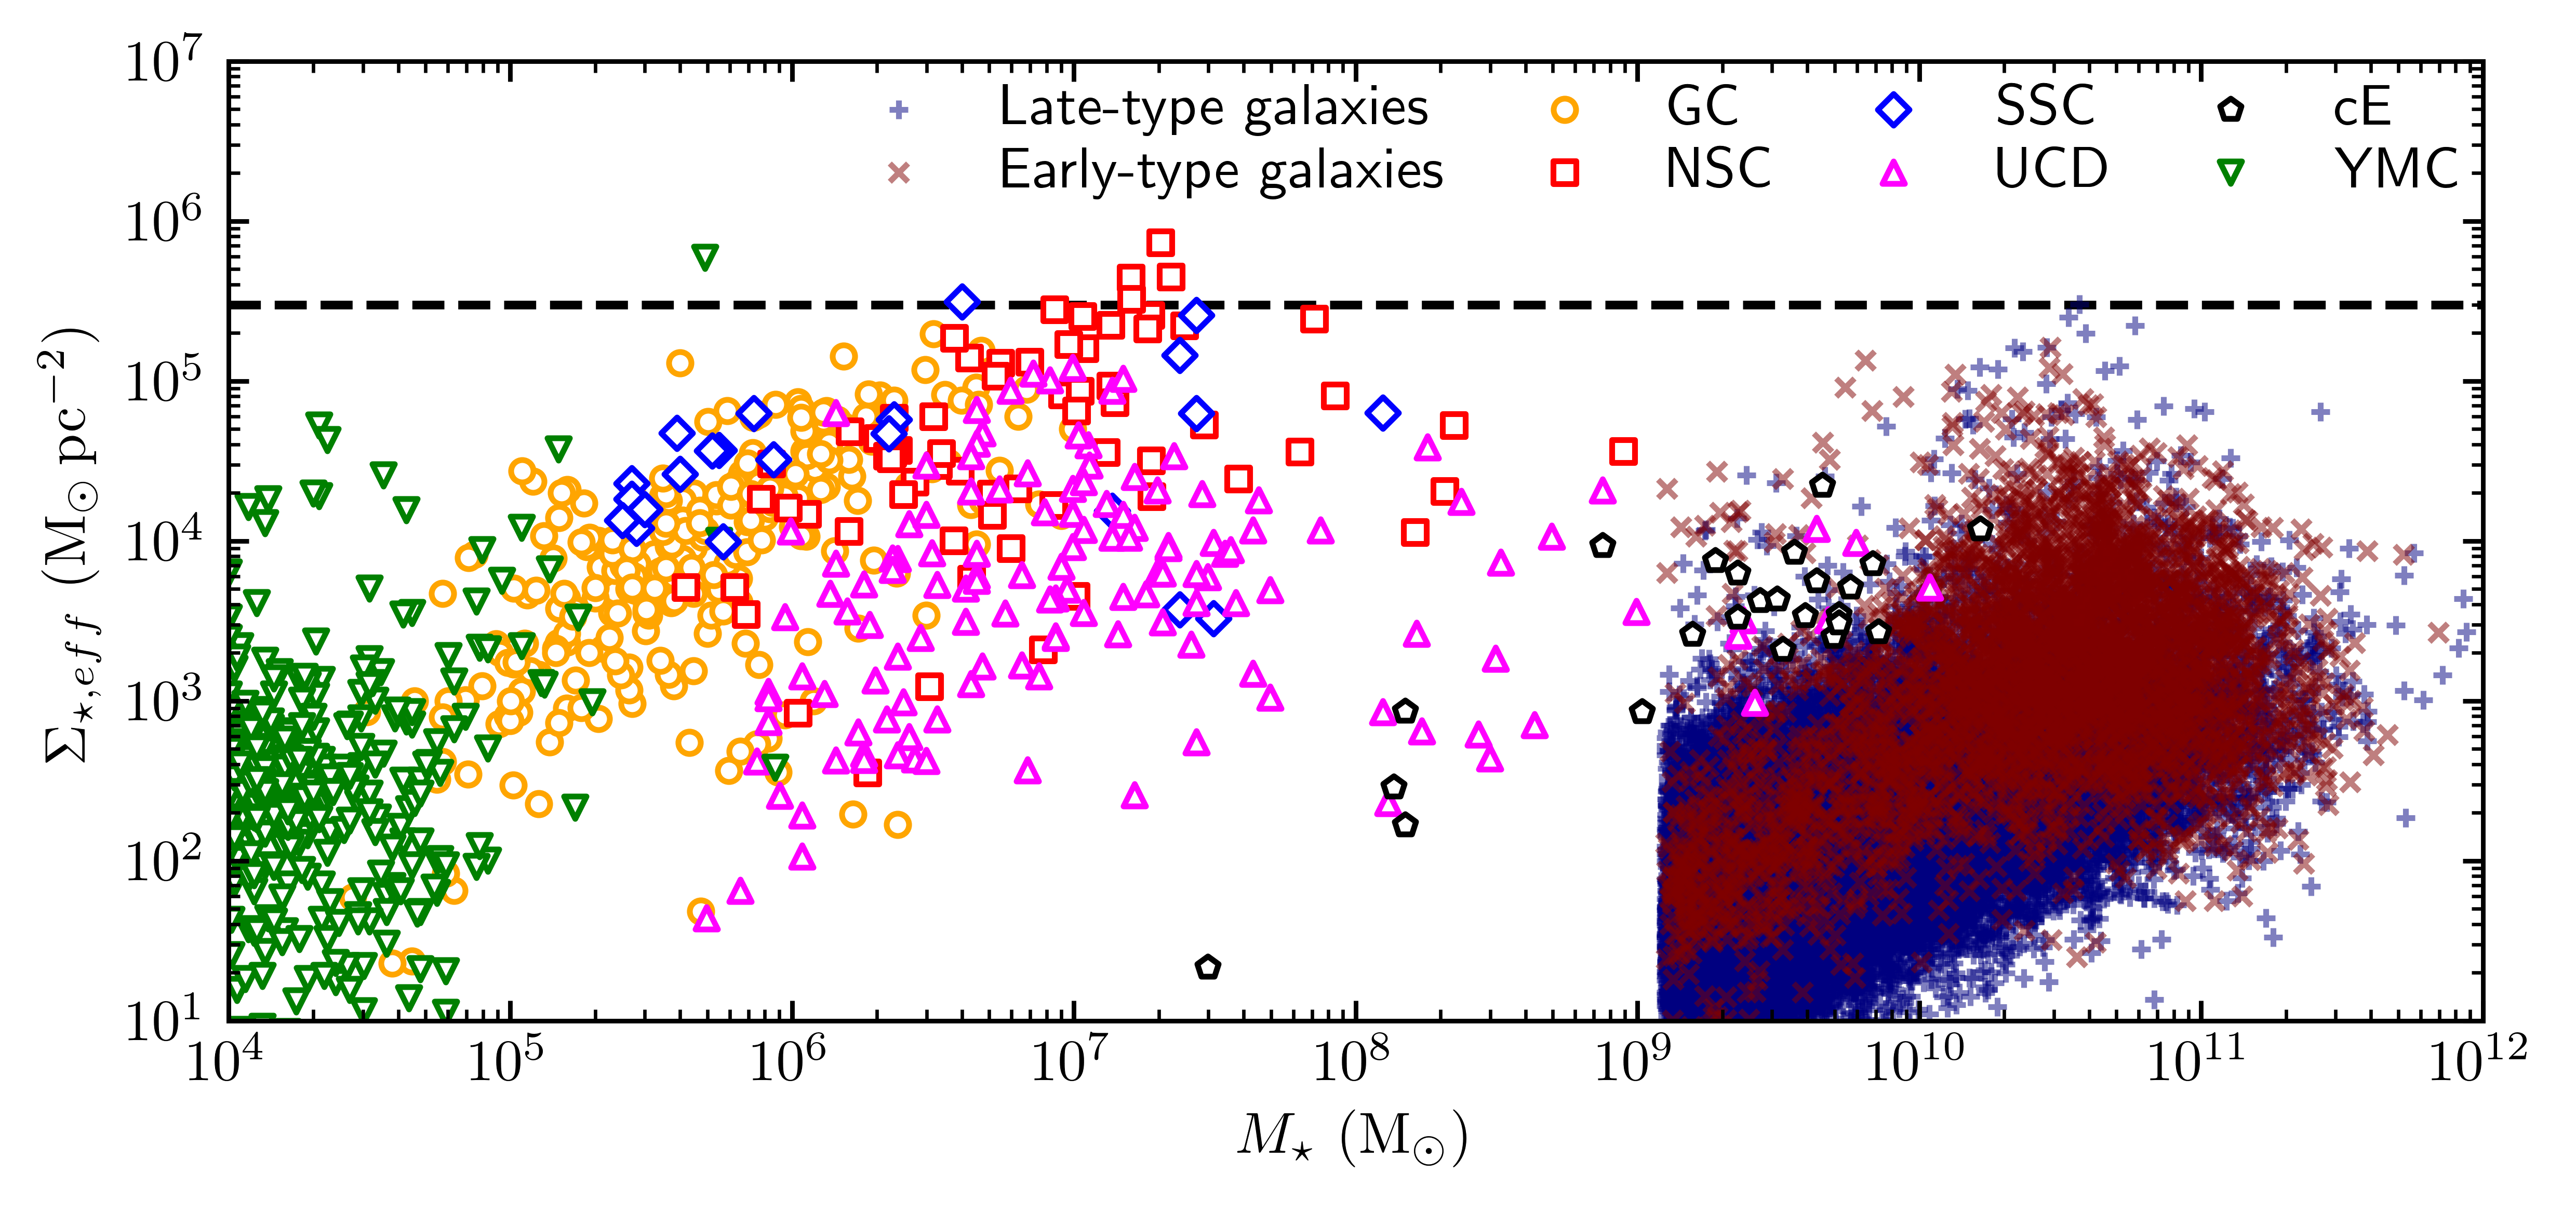
Hopkins et al. (2010) (hereafter Paper I) showed that the central surface densities of essentially all dense stellar systems exhibit the same apparent upper limit . This includes globular clusters (GCs), super star clusters (SSCs), dwarf and late-type galaxy nuclear star clusters (NSCs), young massive clusters (YMCs), ultra-compact dwarfs (UCDs), compact ellipticals (cEs), galactic bulges, nearby and high-redshift early-type/elliptical galaxies, even nuclear stellar disks around Sgr A∗ and the Andromeda nuclear black hole. These span mass scales of , spatial sizes , three-dimensional densities (free-fall times yr), -body relaxation times yr, escape velocities , metallicities , and formation redshifts , yet agree in .
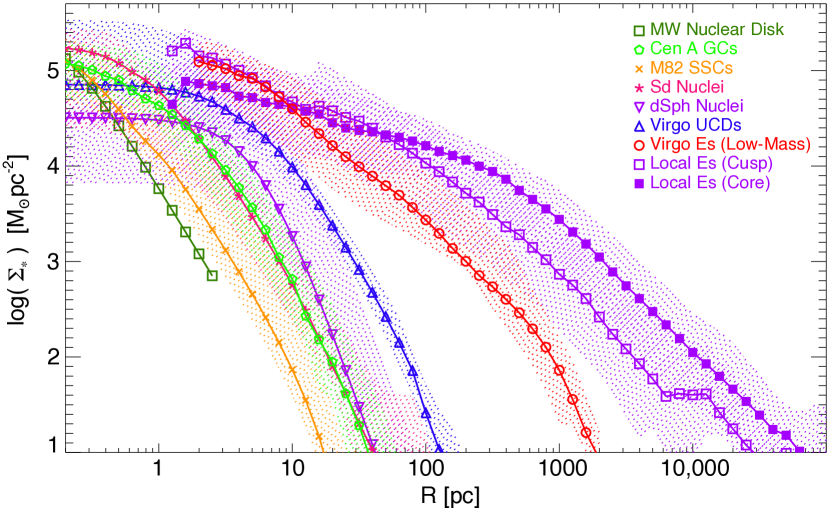
In Figure 1 we compile more recent observations of dense stellar systems of all classes, and find that this still holds largely true, although some nuclear star clusters exceeding the fiducial value of by a factor of a few have since been found. Figure 2 is adapted from the original compilation of mass profiles of individual objects in Paper I – it shows that even many systems with “effective” surface densities (measured at ) have central surface densities which approach but do not appear to exceed (at least where resolved).
Paper I speculated that the universality of might owe to stellar feedback processes.111They also discussed some possible explanations related to e.g. mergers, angular momentum transport processes, or dynamical relaxation, which they showed could not explain across the wide range of systems observed (e.g. dynamical relaxation cannot dominate the systems with relaxation times much longer than a Hubble time, and global processes unique to galaxy mergers cannot explain star cluster interiors). After all, it is widely-recognized that feedback plays an important role regulating star formation (SF) in cold, dense molecular clouds (see Kennicutt & Evans, 2012, for a review). As gas collapses and forms stars, those stars inject energy and momentum into the ISM via protostellar heating and outflows, photoionization and photoelectric heating from UV photons, stellar winds, radiation pressure and supernova explosions. All of these mechanisms may moderate SF, either by contributing to the disruption of molecular clouds (Larson, 1981; Murray et al., 2010; Hopkins et al., 2012; Krumholz et al., 2014; Grudić et al., 2018) or the large-scale support of galaxies against vertical collapse (Thompson et al., 2005; Ostriker & Shetty, 2011; Faucher-Giguère et al., 2013; Hopkins et al., 2014; Orr et al., 2017). These mechanisms have various roles on different scales, but stellar feedback is generally is the only force strong enough to oppose gravity in dense, star-forming regions, so the characteristic scale of a newly-formed stellar system should be determined by the balance point of feedback and gravity.
The specific possibility discussed in Paper I was that multiple-scattering of IR photons might build up radiation pressure to exceed the Eddington limit for dusty gas. However, the value of predicted according to this argument is inversely proportional to metallicity, so does not explain why is apparently the same in SSCs in metal-rich starbursts (Keto et al., 2005; McCrady & Graham, 2007) (or super-solar massive elliptical centers) and in metal-poor GCs (or metal-poor high-, low-mass compact galaxies). The argument therein also relied on scalings between IR luminosity and star formation rate (SFR) valid only for continuous-star forming populations with duration longer than Myr, which exceeds the dynamical times of many of these systems. Finally, Norris et al. (2014) noted that this effect cannot prevent the system from exceeding if SF occurs in multiple episodes.
Since then, various theoretical works have noted the importance of surface density in setting the ratio between the momentum-injection rate from massive stars and the force of self-gravity in a star forming cloud (Fall et al., 2010; Murray et al., 2010; Dekel & Krumholz, 2013; Thompson & Krumholz, 2016; Raskutti et al., 2016; Grudić et al., 2018). For a cloud with total mass and stellar mass ,
| (1) |
where is the specific momentum injection rate from stellar feedback assuming a simple stellar population with a well-sampled IMF, which is for the first after SF, and is the characteristic surface density that parametrizes the strength of feedback. If the final SF efficiency (SFE) is ultimately set by the balance of feedback and gravity, one expects that for (Fall et al., 2010). The detailed simulations of Grudić et al. (2018) (Paper II) showed that this argument is valid across a wide range of metallicities, surface densities and spatial scales, and the final SFE of a molecular cloud is a function mainly of , with weak dependence upon other factors. Paper II also found that the final ratio of stellar mass to initial gas mass, , is proportional to the fraction of gas converted to stars within a freefall time, , because a GMC always tends to form enough stars to destroy itself within a few freefall times. Thus, should parametrize the per-freefall efficiency of SF in a manner insensitive to spatial scale and metallicity.
In this paper, we show that if gas contracts globally (for any reason), as it becomes denser ( increases), and gravity becomes stronger relative to stellar feedback, gas is converted more and more rapidly into stars (above a characteristic surface density ). This exhausts the gas supply, preventing any significant fraction of the inflow from reaching surface densities . We calculate in terms of and show that the observed is naturally predicted by the value set by feedback from massive stars (Fall et al., 2010; Grudić et al., 2018).
2 Derivation
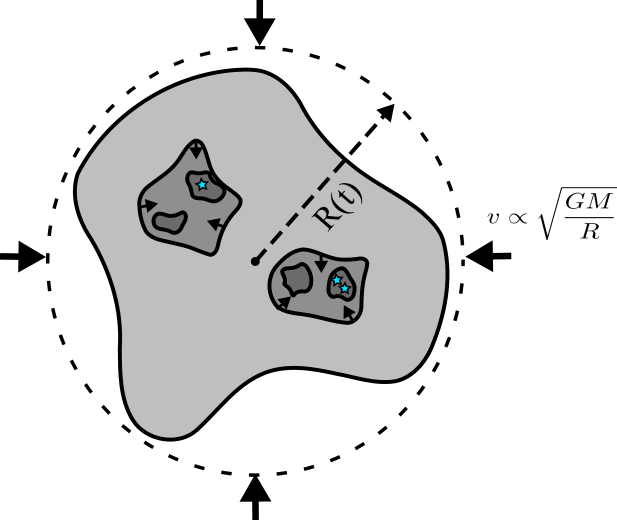
Consider a discrete SF episode involving a finite collapsing gas mass , as illustrated in Figure 3. At a give time, the mass is localized within a radius , so that its mean surface density is:
| (2) |
It is forming stars at some SFR, which we can parameterize with the SFE:
| (3) |
where is the (possibly variable) per-freefall SFE and is the freefall time.
Now, since we are only interested in the maximum stellar surface density such a system might reach, we will assume the “best-case” scenario for forming a dense stellar system. Specifically, assume:
-
1.
The gas cloud is collapsing at a speed on the order of the escape velocity:
(4) where is a constant of order unity.
-
2.
There is no support against collapse from large-scale turbulent motions,222Note that some amount of turbulence must be assumed if stars are forming. We assume that such turbulent eddies are small compared to , and thus are advected with the large-scale collapse without strongly opposing it. tidal forces, rotation, shear, magnetic fields, cosmic rays, or the dynamical effects of stellar feedback. We neglect all of these because we are interested in the best-case scenario for producing a dense stellar system according to a give SFE law – any of these may be present, but they will only slow collapse, making a lower-density system in the end.
This is an idealization, but Kim et al. (2017) did find that bound star clusters do form in a coherent collapse with velocity on the order of the freefall velocity in cosmological simulations, and stellar feedback does not greatly affect the dynamics until a significant fraction of the gas mass has been converted to stars.
We shall assume that has some explicit dependence upon , as is motivated by previous work. Accounting for radiation pressure, stellar winds, photoionization heating, and SN explosions, Paper II found
| (5) |
where is set by the strength of these feedback mechanisms. The dimensionless quantity is the maximum per-freefall SFE attained as . In star-forming clouds supported at a fixed mean surface density, Paper II (see their Eq. 13 and Fig. 5) found that (where is the fraction of gas turned into stars over the entire integrated SF history, which of course just saturates at as ). However, this was the median over the entire SF history including initial collapse and eventual blowout. Therefore – in our “best-case” coherent collapse scenario, we are only interested in the “peak SFR” event, so should be somewhat greater, (see Paper II, Figure 3), and subject to further order-unity corrections due to the different collapse geometry from these simulations. In general, should be similar that predicted by turbulent molecular cloud simulations that do not include stellar feedback, which have generally found in the limit of large turbulent Mach number and realistic turbulent forcing (Federrath & Klessen, 2012).
The SFR of the cloud is
| (6) |
where is the gas mass that has not been converted to stars at time . The differential equation for the gas mass converted to stars when the cloud has radius follows:
| (7) |
The solution for the fraction of the gas mass surviving to radii is
| (8) |
Thus, as we see that , ie. the gas is exhausted as the system contracts to surface densities . The stellar system formed will subsequently undergo a period of relaxation, but energy conservation requires that the stars remain on orbits with apocentres on the order of the radius at which they formed 333We have verified with collisionless Monte Carlo simulations that the functional form Equation 8 does closely match the final stellar mass distribution after violent relaxation to virial equilibrium, provided that the initial virial parameter .. We may thus construct a radial stellar density profile as the superposition of the top-hat mass distributions formed at each radius. The corresponding projected stellar surface density profile is
| (9) |
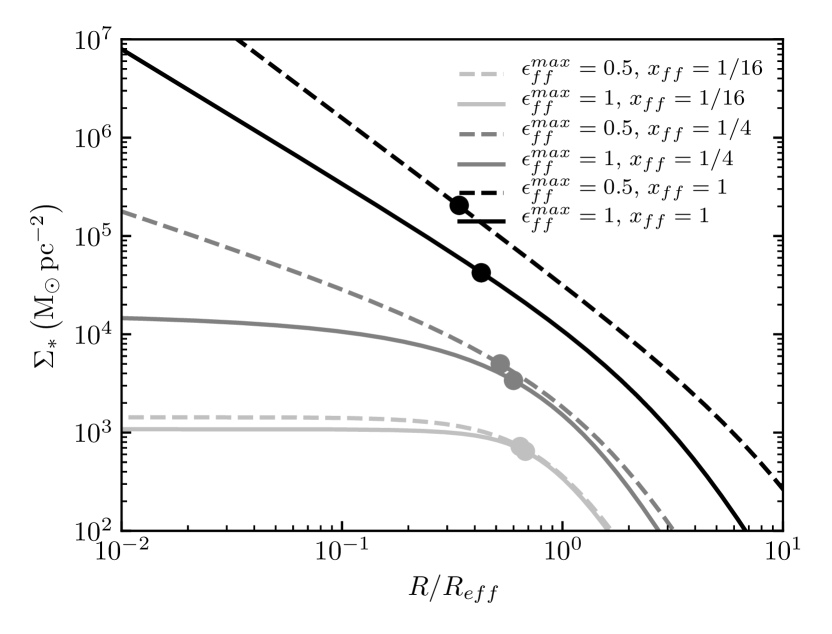
which we plot for various values of and in Figure 4. In general, we find that the characteristic stellar surface densities for plausible values of and span the range of surface densities found in dense stellar systems (Figs. 1 and 2). Furthermore, if then effective surface densities are obtained, corresponding to the maximum observed.
It should be noted that the inner surface density profile plotting in Figure 4 is , which is nearly as steep as for the physically-plausible parameters and , ie. the profile has nearly constant mass per interval in . In such a case a non-negligible fraction of the mass can be concentrated on scales . Such a high degree of central concentration is not generally found in any type of stellar system, so the inner profiles in this model are an unphysical artifact of the imposed condition of unopposed, spherically-symmetric collapse. This is never realized in nature because even an initially-monolithic supersonic collapse is unstable to fragmentation (Guszejnov et al. 2018, in prep.), and the subsequent violent relaxation of stars produces a much shallower (typically flat) inner density profile (Klessen & Burkert, 2001; Bonnell et al., 2003; Grudić et al., 2017). Thus, our free-collapse model lacks the physics necessary to establish a hard limit upon the central stellar surface density 444Indeed, there is at least one YMC in M83 with central surface density in excess of in the catalogue of (Ryon et al., 2015), suggesting that the same bound for central surface density might not strictly hold., although it should scale in a similar way to the effective surface density when combined with the action of the scale-free physics of gravity and turbulence during star formation.
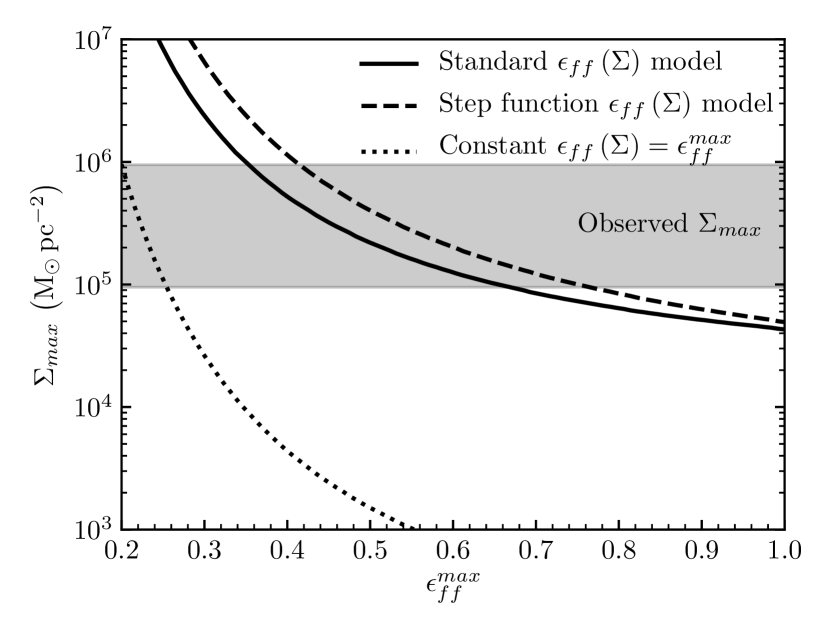
In Figure 5, we consdier the maximally-freefalling case to plot the depedence of on . We find that if and the plausible range for is , the predicted lies within an order of magnitude of the observed (Figure 1). We also present results for two alternate models for : a constant value, and a step-function equal to (e.g. Kennicutt, 1998; Krumholz et al., 2012) below and above . First, we note that while our preferred model gives independently of initial cloud surface density, these do not – we therefore take the initial density to be , typical of local GMCs (Bolatto et al., 2008). Second, we see the “ constant” model predicts a that is more sensitive to the chosen (and the “preferred” value, , is small). The step-function model, however, gives very similar results to our default model, so we see that the conclusions are not specific to the details of how scales, so long as is small when and grows to a value of order unity above . Ultimately, the separation between and can be understood as follows: the system forms stars slowly until reaching , and only then does significant star formation happen, during which global collapse still proceeds. Thus this system is significantly denser than at the median star formation time.
3 Discussion
We have shown that the observed, apparently universal maximum stellar surface density of dense stellar systems is a natural consequence of feedback-regulated SF physics. Specifically, assuming standard stellar evolution and feedback physics (from e.g. the combination of stellar winds, radiation pressure, SNe, etc.), then as surface densities () increase, the strength of gravity relative to feedback (assuming some fixed fraction of gas has turned into stars) increases in direct proportion to (Eq. 1; see references in § 1). Essentially, the strength of gravity scales , while the strength of feedback is proportional to the number of massive stars . So SF becomes more efficient, until the gas depletion timescale becomes comparable to the free-fall time, and the gas is exhausted before it can collapse to yet higher densities (even if it is getting denser as rapidly as possible, by collapsing at the escape velocity). Adopting standard scalings for the efficiency of feedback from simulations of star-forming clouds that span the relevant range of densities (Paper II), we show this predicts a in good agreement with that observed.
This explanation has several advantages over the previously-proposed explanations of the maximum surface density from Paper I. As Paper II found that the parameters and were insensitive to spatial scale below , our explanation applies equally well across the entire range of sizes of observed stellar systems in Figure 1. Paper II also found SFE to be relatively insensitive to metallicity, so the we calculate is not specific to a particular metallicity. The main effect of metallicity in is the aforementioned opacity to reprocessed FIR emission, but radiation hydrodynamics simulations of SF in the IR-thick limit (Skinner & Ostriker, 2015; Tsz-Ho Tsang & Milosavljevic, 2017) have shown that this can only reduce by , down to levels consistent with Paper II. At fixed , this explanation is also insensitive to the three-dimensional density, -body relaxation time, formation redshift, and escape velocity of the stellar systems (see e.g. Fig. 4 in Paper II).
This model also explains why SF in a pre-existing dense stellar system does not generally drive beyond – in other words, if one continuously or repeatedly “trickled” gas into e.g. a galaxy center, why could one not continuously add new stars to the central cusp, eventually exceeding ? The key here is that the pre-existing stellar mass still contributes to the binding force of gravity: recall, in our model is the total mass, of gas+stars. This drives up the SFE whenever the total surface density exceeds . Thus, for example, if fresh gas falls coherently into the centre of a bulge or dwarf nucleus with , then the total surface density will exceed out at larger radii, driving the SFE to high values and exhausting the gas. Multiple SF episodes would therefore be expected to build up the stellar mass by increasing the radius inside of which , not by increasing .
We also stress, of course, that is not a “hard” limit, either in observations (Figs. 1-2), or in our model (Fig. 4). Some gas can survive to reach higher densities (and must, to fuel super-massive black holes, for example), and some gas may be re-injected by stellar mass loss in these dense nuclei. And the key parameters of our model (the efficiency of feedback, which appears in , and ) are not expected to be precisely universal, as e.g. variations in IMF sampling (since massive stars dominate the feedback) will alter and the exact geometry of collapse will alter (at the tens of percent level).
Acknowledgements
We thank Arjen van der Wel for providing the galaxy size and mass data from van der Wel et al. (2014). Support for MG and PFH was provided by an Alfred P. Sloan Research Fellowship, NASA ATP Grant NNX14AH35G, and NSF Collaborative Research Grant #1411920 and CAREER grant #1455342. Numerical calculations were run on the Caltech compute clusters ‘Zwicky’ (NSF MRI award PHY-0960291) and ‘Wheeler’.
References
- Bastian et al. (2006) Bastian N., Saglia R. P., Goudfrooij P., Kissler-Patig M., Maraston C., Schweizer F., Zoccali M., 2006, A&A, 448, 881
- Bastian et al. (2013) Bastian N., Schweizer F., Goudfrooij P., Larsen S. S., Kissler-Patig M., 2013, MNRAS, 431, 1252
- Böker et al. (2004) Böker T., Sarzi M., McLaughlin D. E., van der Marel R. P., Rix H.-W., Ho L. C., Shields J. C., 2004, AJ, 127, 105
- Bolatto et al. (2008) Bolatto A. D., Leroy A. K., Rosolowsky E., Walter F., Blitz L., 2008, ApJ, 686, 948
- Bonnell et al. (2003) Bonnell I. A., Bate M. R., Vine S. G., 2003, MNRAS, 343, 413
- Dekel & Krumholz (2013) Dekel A., Krumholz M. R., 2013, MNRAS, 432, 455
- Evstigneeva et al. (2007) Evstigneeva E. A., Gregg M. D., Drinkwater M. J., Hilker M., 2007, AJ, 133, 1722
- Fall et al. (2010) Fall S. M., Krumholz M. R., Matzner C. D., 2010, ApJ, 710, L142
- Faucher-Giguère et al. (2013) Faucher-Giguère C.-A., Quataert E., Hopkins P. F., 2013, MNRAS, 433, 1970
- Federrath & Klessen (2012) Federrath C., Klessen R. S., 2012, ApJ, 761, 156
- Geha et al. (2002) Geha M., Guhathakurta P., van der Marel R. P., 2002, AJ, 124, 3073
- Grudić et al. (2017) Grudić M. Y., Guszejnov D., Hopkins P. F., Lamberts A., Boylan-Kolchin M., Murray N., Schmitz D., 2017, preprint, (arXiv:1708.09065)
- Grudić et al. (2018) Grudić M. Y., Hopkins P. F., Faucher-Giguère C.-A., Quataert E., Murray N., Kereš D., 2018, MNRAS, 475, 3511
- Hopkins et al. (2010) Hopkins P. F., Murray N., Quataert E., Thompson T. A., 2010, MNRAS, 401, L19
- Hopkins et al. (2012) Hopkins P. F., Quataert E., Murray N., 2012, MNRAS, 421, 3488
- Hopkins et al. (2014) Hopkins P. F., Keres D., Onorbe J., Faucher-Giguere C.-A., Quataert E., Murray N., Bullock J. S., 2014, MNRAS, 445, 581
- Kennicutt (1998) Kennicutt Jr. R. C., 1998, ApJ, 498, 541
- Kennicutt & Evans (2012) Kennicutt R. C., Evans N. J., 2012, ARA&A, 50, 531
- Keto et al. (2005) Keto E., Ho L. C., Lo K.-Y., 2005, ApJ, 635, 1062
- Kim et al. (2017) Kim J.-h., et al., 2017, preprint, (arXiv:1704.02988)
- Klessen & Burkert (2001) Klessen R. S., Burkert A., 2001, ApJ, 549, 386
- Kormendy et al. (2009) Kormendy J., Fisher D. B., Cornell M. E., Bender R., 2009, ApJS, 182, 216
- Krumholz et al. (2012) Krumholz M. R., Dekel A., McKee C. F., 2012, ApJ, 745, 69
- Krumholz et al. (2014) Krumholz M. R., et al., 2014, Protostars and Planets VI, pp 243–266
- Larson (1981) Larson R. B., 1981, MNRAS, 194, 809
- Lauer et al. (2007) Lauer T. R., et al., 2007, ApJ, 664, 226
- Lu et al. (2009) Lu J. R., Ghez A. M., Hornstein S. D., Morris M. R., Becklin E. E., Matthews K., 2009, ApJ, 690, 1463
- McCrady & Graham (2007) McCrady N., Graham J. R., 2007, ApJ, 663, 844
- Murray et al. (2010) Murray N., Quataert E., Thompson T. A., 2010, ApJ, 709, 191
- Norris et al. (2014) Norris M. A., et al., 2014, MNRAS, 443, 1151
- Orr et al. (2017) Orr M., et al., 2017, preprint, (arXiv:1701.01788)
- Ostriker & Shetty (2011) Ostriker E. C., Shetty R., 2011, ApJ, 731, 41
- Portegies Zwart et al. (2010) Portegies Zwart S. F., McMillan S. L. W., Gieles M., 2010, ARA&A, 48, 431
- Raskutti et al. (2016) Raskutti S., Ostriker E. C., Skinner M. A., 2016, ApJ, 829, 130
- Rejkuba et al. (2007) Rejkuba M., Dubath P., Minniti D., Meylan G., 2007, A&A, 469, 147
- Ryon et al. (2015) Ryon J. E., et al., 2015, MNRAS, 452, 525
- Schweizer & Seitzer (2007) Schweizer F., Seitzer P., 2007, AJ, 133, 2132
- Skinner & Ostriker (2015) Skinner M. A., Ostriker E. C., 2015, ApJ, 809, 187
- Thompson & Krumholz (2016) Thompson T. A., Krumholz M. R., 2016, MNRAS, 455, 334
- Thompson et al. (2005) Thompson T. A., Quataert E., Murray N., 2005, ApJ, 630, 167
- Tsz-Ho Tsang & Milosavljevic (2017) Tsz-Ho Tsang B., Milosavljevic M., 2017, preprint, (arXiv:1709.07539)
- van der Wel et al. (2014) van der Wel A., et al., 2014, ApJ, 788, 28