Influence Estimation on Social Media Networks Using Causal Inference
Abstract
Estimating influence on social media networks is an important practical and theoretical problem, especially because this new medium is widely exploited as a platform for disinformation and propaganda. This paper introduces a novel approach to influence estimation on social media networks and applies it to the real-world problem of characterizing active influence operations on Twitter during the 2017 French presidential elections. The new influence estimation approach attributes impact by accounting for narrative propagation over the network using a network causal inference framework applied to data arising from graph sampling and filtering. This causal framework infers the difference in outcome as a function of exposure, in contrast to existing approaches that attribute impact to activity volume or topological features, which do not explicitly measure nor necessarily indicate actual network influence. Cramér-Rao estimation bounds are derived for parameter estimation as a step in the causal analysis, and used to achieve geometrical insight on the causal inference problem. The ability to infer high causal influence is demonstrated on real-world social media accounts that are later independently confirmed to be either directly affiliated or correlated with foreign influence operations using evidence supplied by the U.S. Congress and journalistic reports. ††footnotetext: *This material is based upon work supported by the Assistant Secretary of Defense for Research and Engineering under Air Force Contract No. FA8721-05-C-0002 and/or FA8702-15-D-0001. Any opinions, findings, conclusions or recommendations expressed in this material are those of the authors and do not necessarily reflect the views of the Assistant Secretary of Defense for Research and Engineering.
Index Terms— Estimation on graphs, influence estimation, causal inference, social networks, graph analytics, network detection, Cramér-Rao bounds on graph estimation
1 INTRODUCTION
Social media is now used by a majority of individuals across the industrialized world, and in 2018 is estimated to overtake traditional media in the U.S. [35]. This large-scale growth of worldwide social media networks is built upon their essential features of universal access, immediacy, and power to communicate with and influence others. These key design features have also created a potent new medium and an enabling technology for disinformation and propaganda [13, 14, 31, 36, 38, 46]. Detecting and estimating influence on social media networks is the problem of inferring the impact of an input at one node on the rest of the network. This is an important theoretical and practical problem that arises in marketing on social media [13, 24], influence maximization [12, 19], information diffusion [20, 23, 26, 46], and the spread of both information and disinformation in social networks [10, 13, 14, 17, 27, 31, 36, 38, 45].
This paper introduces a novel approach to influence estimation on social media networks and applies it to the real-world problem of characterizing online influence operations [9, 11, 29]. The new framework contains the generality to account for influence on populations with and without observed outcomes, which addresses the issue of biased sampling. Both groups contain individuals that are receptive to influence, or not receptive, the latter defined as having outcomes invariant to the influence exposure. The approach also subsumes the important case of a network engaged in a specific narrative. The estimation problem is posed using Bayesian inference with these distinctive aspects of social media networks:
-
•
(Sampled) graph data of social network interactions
-
•
Heterogeneous natural language and multi-media data
-
•
Causal relationship among interactions
1.1 Contributions
The new influence estimation approach proposed here aims to attribute impact by accounting for causal narrative propagation over the network, while addressing the challenge of discriminating between actual social influence and mere homophily [39, 36]. Statistical inferential methods are used to estimate model parameters for causal influence on social networks. This causal framework infers the difference in outcome as a function of exposure, in contrast to existing approaches that attribute impact to activity volume or topological features, which do not explicitly measure nor necessarily indicate actual network influence. Cramér-Rao estimation bounds are derived for this parameter estimation problem and used for geometrical insight on the causal inference problem. Natural language processing tools are used to filter the network data into specific narrative contexts for influence estimation, and to classify the sampled graph data into case/non-case data.
This approach is applied to publicly available Twitter data collected over the 2017 French presidential elections, during which there was an active influence operation campaign targeting these elections [9, 11, 29]. The ability to infer high causal influence is demonstrated on real-world social media accounts that were later independently confirmed to be either directly affiliated or correlated with foreign influence operations by evidence supplied by the U.S. Congress [42] and journalistic reports [25]. Furthermore, the new approach is shown to reveal influential accounts that are not obvious based upon simple activity statistics. These results support the utility of the proposed framework.
2 GRAPH SAMPLING USING TARGETED CONTEXT
The vast majority of social media interactions are irrelevant to a intended context of interest for influence estimation. Therefore, an appropriate graph sampling mechanism is needed. Ideally, the sampling mechanism must efficiently capture relevant examples of both the influence network and associated content, under rate-limited server queries. In this paper we use a content-based approach for network graph sampling based on a method for optimum network detection [33, 34].
First, potentially relevant social media content (e.g. hashtags or keywords) and user account handles are identified using prior knowledge and subject matter expertise about the targeted context, similar to Berger’s approach [8]. Second, publicly available information associated with these prior cues are collected. Relevance is determined by a set of hashtags, keywords, and user account handles whose content is aligned with hypothesized influence campaigns. Third, graph sampling is performed by selectively collecting content prioritized by a threat propagation model on the graph [33, 34].
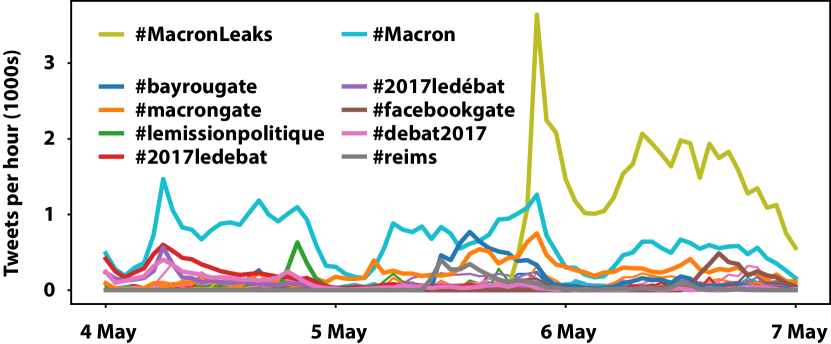
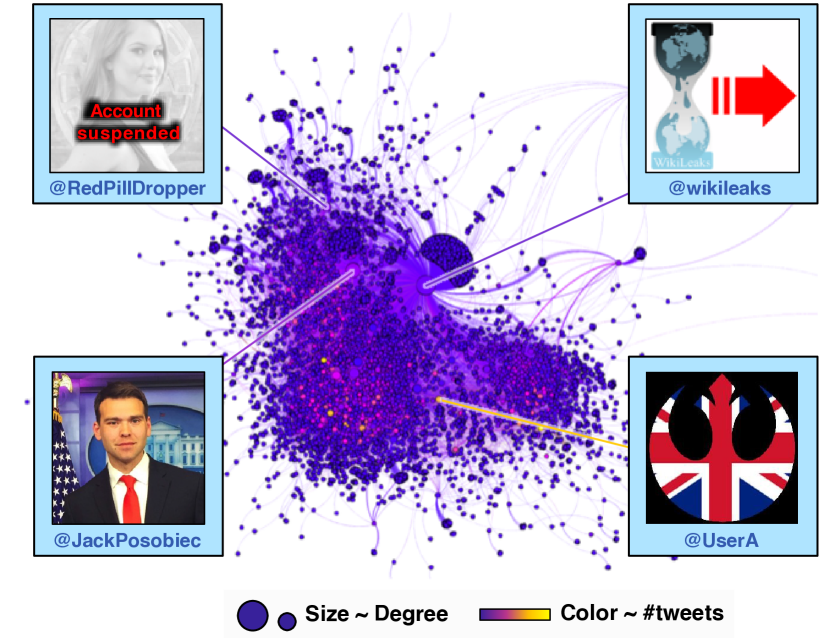
More than 20 million tweets and 2 million user account handles of potential relevance to foreign influence operations in the 2017 French presidential elections were collected using the Twitter public application programming interface (API) [41] during April and May 2017. This data set includes accounts that are positively identified as part of the foreign influence campaign [42]; however, no affiliation is implied or ascribed to any specific account without independent corroboration. Fig. 1 shows a plot of the top Twitter hashtag narrative frequencies collected during this period. The prominent #MacronLeaks narrative, referring to thousands of leaked documents, dominated election-related social media discussions hours before the mandatory French media blackout for the second round on 7 May [9, 25]. In Section 4, the network associated with this narrative will be used to demonstrate estimation of the most influential accounts. Fig. 2 illustrates this narrative graph (5,370 accounts, 124,259 interactions) and highlights potentially influential accounts based upon activity levels and subsequent journalistic reports [25]. Some of these accounts will be shown to possess high levels of causal influence, whereas others are estimated to have much less influence, underscoring the insight that high activity is not necessarily correlated with high influence.
3 GRAPH FILTERING USING NARRATIVES
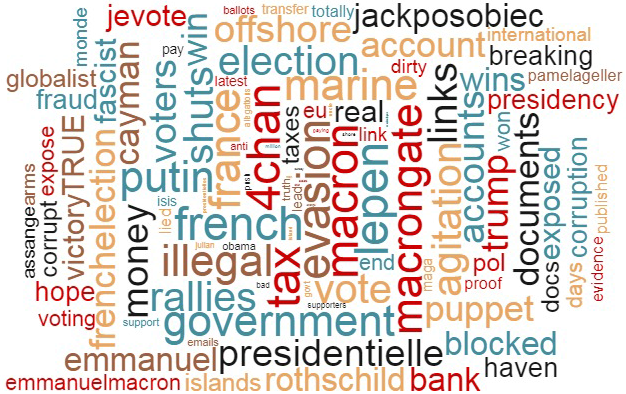
Social influence occurs within a specific context. The sampled data must be filtered by a characterization of the narrative prior to influence estimation. This may be as simple as searching for a single keyword, utilizing natural language processing to focus on a specific narrative, or community detection approaches to filter the graph, or some combination of these. E.g. Stewart et al. use an Infomap clustering algorithm to perform community detection on a retweet graph [36]. One narrative derived from the content of the #MacronLeaks tweets [9] is illustrated by the wordcloud in Fig. 3. For example, an account @Pamela_Moore13 known to be tied to foreign influence operations [42] is observed to promote this and many other hashtag-based divisive narratives aligned with these operations.
![[Uncaptioned image]](/html/1804.04109/assets/x3.png) |
The #MacronLeaks narrative example is prominent and well-defined; therefore, a simple keyword search is an adequate filter. In general, combining content-based narrative detection with community detection is expected to be necessary to estimate influence in broader contexts than provided by a single hashtag.
4 GRAPH INFLUENCE ESTIMATION
The proposed causal framework for influence estimation introduced in this section infers the difference in outcome as a function of exposure, in contrast to approaches that attribute impact to activity volume or topological features. Existing approaches are based on network topology [20, 23, 31], node degree or activity [27, 45], information diffusion [19, 24, 26], and cascade lengths [10, 12, 14, 23, 24]. None of these metrics explicitly measure nor necessarily indicate actual network influence. For example, an account that tweets little can be highly influential, and vice-versa. Examples of this claim are demonstrated with real data below. The proposed causal inference approach aims to quantify influence by accounting for causal narrative propagation over the entire network, including the timing of the tweets and the position of the influencer in the network. It also accounts for several potential confounders (e.g. community membership, popularity) and removes their effects from the causal estimation. The impact of an individual account on the narrative network [Fig. 2] is defined as the average (per vertex) number of additional tweets generated by its participation [Fig. 4]. This impact is estimated using a recent network causal inference framework [18], itself based upon Rubin’s causal framework [16]. This approach is related to other work in causal inference on networks [37, 40, 43]; it is unique in its inference methodology that uses the network potential outcomes.
4.1 Causal Influence Estimation on Networks
Let be a graph with vertices , whose edges are denoted by the observed interactions between and , let be an -by- matrix of social influence of on with Poisson rate determined by the graph data , and be a binary -vector of narrative sources (a.k.a. treatment vector). The fundamental quantity is the network potential outcome of each individual vertex, denoted , under exposure to the narrative through the source vector and influence network . In the analysis below, vertices are user accounts in the narrative network, edges are retweets relevant to the narrative, and the potential outcomes are the number of tweets in the narrative. The impact of each vertex on the narrative is defined using the network potential outcomes,
| (1) |
This causal estimand is the average difference between the individual potential outcomes with as a source s.t. , versus not a source s.t. . This impact is the average (per vertex) number of additional tweets generated by a vertex ’s participation. The source is uniquely impactful if it is the only source.
It is impossible to observe the potential outcomes at each vertex with both exposure conditions under source vectors and ; therefore, the missing potential outcomes must be estimated. This can be accomplished by modeling the potential outcomes. After estimating the model parameters from the observed outcomes and vertex covariates, missing potential outcomes in the causal estimand can be imputed using the fitted model.
In this analysis, potential outcomes are modeled using a conditional Poisson generalized linear model (GLM) with the canonical log link function and linear predictor coefficients corresponding to the source indicator , -hop exposure vector , the covariate vector , and the baseline outcome. The first two parameters and account for influence from the source(s), and the second two parameters and account for individual baseline propensity. The covariate vector has elements corresponding to the number of observed or inferred covariates on each vertex, including the potential social confounders such as popularity and community membership. The conditional GLM model for the potential outcomes is,
| (2) |
with . The first term in the linear predictor represents the primary effect of the source. The second term represents the accumulative social influence effect from -hop exposures to the source, where each coefficient captures the decay of the effect over each additional hop. The third term in Eq. (2) is the effect of the vertex covariates including the potential social confounders such as popularity and community membership. In the analysis below, two confounders are used: popularity, based on vertex degree, and community membership, based on language. The fourth term, , is the baseline effect on the entire population. The last term gives independent and identically distributed variation for heterogeneity between the units. The amounts of social exposure at the th hop are determined by . This captures all exposure to the sources propagated on the influence network. Lastly, to model the diminishing return of additional exposures, the (nonnegative) log-exposure is used, .
Joint Bayesian inference of the model parameters , , , , and the social influence matrix is done through Markov chain Monte Carlo (MCMC) with Bayesian regression updates [15], in which the observations are used to compute samples of the posterior density . The samples are used to impute potential outcomes via Eq. (2). Gibbs sampling is used to sequentially update individual model parameter estimates, conditioned on estimates of the others. Weakly informative, truncated priors are chosen to reduce the prior assumption’s effect on the posterior density, and to improve MCMC robustness and convergence.
4.2 Influence Estimation Accuracy
The lower bound on the sampling variance of the influence estimate is an important quantity to compute because it indicates both the best precision achievable, and provides geometric insight into the dependency of the influence estimate on both the data and parameters [32]. The Cramér-Rao lower bound on the model parameter sampling covariance is computed from the inverse of the Fisher information matrix of the proposed Poisson GLM,
| (3) |
where are the observed potential outcomes and is the log-likelihood function. For the simplest form of the proposed Poisson-GLM model with -hop exposure, a scalar vertex covariate, and conditional independence between vertices, the Fisher information matrix is,
| (4) |
where .
| Screen name | T | TRT | MRT | F | 1st time | PR | Impact* |
| @JackPosobiec | 95 | 47k | 5k | 261k | 18:49 | 2.84 | 5.60 |
| @RedPillDropper | 32 | 8k | 3k | 8k | 19:33 | 2.86 | 1.80 |
| @UserA† | 256 | 59k | 8k | 1k | 19:34 | 27.08 | 0.05 |
| @UserB† | 260 | 54k | 8k | 3k | 20:25 | 57.05 | 4.84 |
| @wikileaks | 25 | 63k | 7k | 5515k | 20:32 | 2.80 | 4.18 |
| @Pamela_Moore13 | 4 | 4k | 2k | 54k | 21:14 | 2.79 | 4.16 |
| @UserC† | 1305 | 51k | 8k | 1k | 22:16 | 6.36 | 0.80 |
| *Influence estimate from Eq. (1) applied to data | |||||||
| †Anonymized screen names of currently active accounts | |||||||
The precision of the impact estimates on depends primarily on the variances of the primary effect coefficient and the social effect coefficient , because they drive the total effect of exposures to the sources. The first and second diagonal terms ( and ) of the information matrix quantify the information content on and , so maximizing these two terms leads to smaller sampling variances and therefore more precise impact estimates. By inspection, these two terms are maximized when vertices with large expected outcomes () receive a large amount of peer exposures (). This happens when sources are on vertices with high out-degrees and clustered around vertices with large expected outcomes. For parsimony, this analysis is on the simplest proposed model, but can be easily generalized to multi-hops and multi-vertex-covariate situations, with similar resulting intuition.
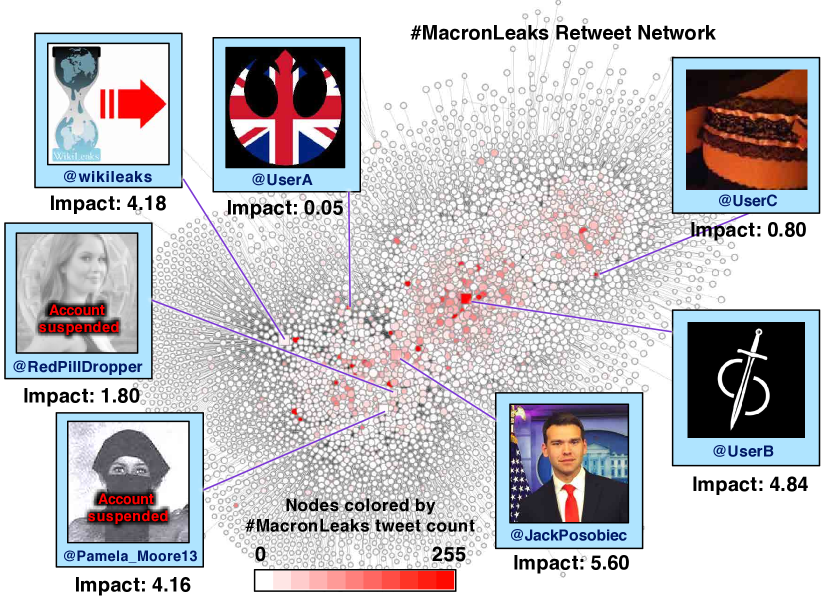
The results of the causal impact estimation approach on the #MacronLeaks narrative network is shown in Fig. 4 and Table 1, where the impact of example participatory accounts are highlighted. Vertex color indicates the number of times each account tweets #MacronLeaks; vertex size is the out-degree (i.e. the number of retweets on each account). Among the accounts with high estimated impact, there exists independent confirmation on the prominence of the accounts @wikileaks and @JackPosobiec in pushing the #MacronLeaks narrative [25]. A new finding is the high impact in the social media network discussing the 2017 French presidential elections of an account known to be tied to foreign influence operations: @Pamela_Moore13 [42].
These results highlight the ability of causal influence estimation to infer high impact beyond statistics based upon activity- and topologically-based statistics, e.g. PageRank centrality [21, 28]. Compare @UserA to @UserB, whose statistics are very similar, yet @UserB is estimated to have much greater impact because it serves as a bridge into the predominantly French-speaking subgraph (the cluster seen in the middle of Fig. 4). The highly active accounts @UserA and @UserC tweeted about #MacronLeaks many times, but were not estimated to have high impact. In contrast, some accounts with only a few #MacronLeaks tweets and lower centrality are estimated to have very high causal impact. As observed in Fig. 4, higher out-degree is correlated with impact, but provides only partial information for influence estimation. E.g. @Pamela_Moore13 has much lower out-degree count than @wikileaks, @JackPosobiec, or @UserB, but nevertheless has high impact from her strong influence on the vertices near her in the retweet network.
Additional analysis is necessary to address important issues and potential limitations of these specific results and the current approach. Specifically, this analysis uses a uniquely impactful source per causal influence estimate; generalizing the source vector would include the effect of exposure to multiples sources on outcomes. The analysis also relies upon a specific potential outcome model. Rigorous model checking and tuning must be performed. Because one cannot depend on knowing the true potential outcome model in real-world studies, the biasing effects of confounding covariates may not be removed entirely through modeling. Additional mitigation should be done through selecting and weighing observed outcomes to balance the confounding covariates across different exposure groups to address biased sampling effects [30]. Lastly, this analysis focuses on the population engaged in the narrative. The effect of this selection bias can be addressed by including the population that is not engaged, but receptive to influence. Fortuitously, the narrative filtering step of Section 3 can provide data on this type of population.
5 CONCLUSIONS
A novel approach to influence estimation on social media networks is introduced and applied to the problem of characterizing online influence operations. The approach uses a network causal inference framework applied to social media network data arising from graph sampling and filtering. The causal framework directly infers influence as a function of exposure. The Cramér-Rao lower bound on the model parameter covariance is computed, providing insight about the effect of the social media network on estimation precision. Twitter data collected during the 2017 French presidential elections are used to demonstrate influence estimation performance. A new finding is the high impact of an account known to be tied to foreign influence operations in social media discussions of the French elections. Independent confirmation of the ability to infer high causal influence is provided from subsequent evidence from the U.S. Congress and journalistic reports.
References
- [1]
- [2]
- [3]
- [4]
- [5]
- [6]
- [7]
- [8] Berger J.M. (2017). The methodology of the Hamilton 68 dashboard [online]. Accessed January 2018. Available: http://securingdemocracy.gmfus.org/publications/methodology-hamilton-68-dashboard
- [9] Borger J. (9 May 2017). US official says France warned about Russian hacking before Macron leak, The Guardian [online]. Accessed January 2018. Available: https://www.theguardian.com/technology/2017/may/09/us-russians-hacking-france-election-macron-leak
- [10] Budak C., Agrawal D., and El Abbadi A. (2011). Limiting the spread of misinformation in social networks. In Proc. ACM WWW pp. 665–674. doi: 10.1145/1963405.1963499
- [11] Col. Chekinov S.G. and Lt. Gen. Bogdanov S.A. [Чекинов С.Г. и Богданов С.А.] (2013). On the nature and content of new generation warfare [О характере и содержании войны нового поколения], Military Thought [Военная Мысль] 10 : 13–24. Available: http://www.eastviewpress.com/Files/MT_FROM%20THE%20CURRENT%20ISSUE_No.4_2013.pdf
- [12] Chen W., Wang Y., and Yang S. (2009). Efficient influence maximization in social networks. In Proc. ACM SIGKDD. doi: 10.1145/1557019.1557047
- [13] Confessore N., Dance G.J.X., Harris R., and Hansen M. (27 Jan. 2018). The follower factory, The New York Times [online]. Accessed January 2018. Available: https://www.nytimes.com/interactive/2018/01/27/technology/social-media-bots.html
- [14] Fan L., Wu W., Zhai X., et al. (2014). Maximizing rumor containment in social networks with constrained time, Soc. Netw. Anal. Min. 4 : 214. doi: 10.1007/s13278-014-0214-4
- [15] Gelman A., Carlin J.B., Stern H.S., Dunson D.B., Vehtari A., and Rubin D.B. (2013). Bayesian Data Analysis, 3d ed., Chapman & Hall/CRC. doi: 10.1111/j.1467-985X.2014.12096_1.x
- [16] Imbens G.W. and Rubin D.B. (2015). Causal Inference for Statistics, Social, and Biomedical Sciences, Cambridge University Press. doi: 10.1017/CBO9781139025751
- [17] Jin F., Dougherty E., Saraf P., Cao Y., and Ramakrishnan N. (2013). Epidemiological modeling of news and rumors on Twitter. In Proc. ACM SNAKDD. doi: 10.1145/2501025.2501027
- [18] Kao E.K. (2017). Causal Inference Under Network Interference: A Framework for Experiments on Social Networks, Ph.D. thesis, Harvard U. arxiv: 1708.08522
- [19] Kempe D., Kleinberg J., and Tardos É. (2015). Maximizing the spread of influence through a social network, Theory of Computing 11 (4) : 105–147. doi: 10.4086/toc.2015.v011a004
- [20] Kimura M. and Saito K. (2006). Tractable models for information diffusion in social networks. In Proc. European PKDD pp. 259–271. doi: 10.1007/11871637_27
- [21] Langville A.N. and Meyer C.D. (2005). A survey of eigenvector methods for web information retrieval. SIAM Rev. 47 (1) : 135–161. doi: 10.1137/S0036144503424786
- [22] Leskovec J. and Faloutsos C. (2006). Sampling from large graphs, in Proc. ACM SIGKDD. doi: 10.1145/1150402.1150479
- [23] Leskovec J., Krause A., Guestrin C., Faloutsos C., VanBriesen J., and Glance N. (2007). Cost-effective outbreak detection in networks. In Proc. ACM SIGKDD. doi: 10.1145/1281192.1281239
- [24] Li S., Zhu Y., and Li D. (2014). Influence maximization in social networks with user attitude modification. In Proc. 2014 IEEE ICC, Sydney, Australia. doi: 10.1109/ICC.2014.6883932
- [25] Marantz A. (7 May 2017). The far-right American nationalist who tweeted #MacronLeaks, The New Yorker. Accessed January 2018. Available: https://www.newyorker.com/news/news-desk/the-far-right-american-nationalist-who-tweeted-macronleaks
- [26] Myers S.A. and Leskovec J. (2012). Clash of the contagions: Cooperation and competition in information diffusion, In Proc. 2012 IEEE 12th Intl. Conf. Data Mining, Brussels, pp. 539–548. doi: 10.1109/ICDM.2012.159
- [27] Nguyen D.T., Nguyen N.P., and Thai M.T. (2012). Sources of misinformation in online social networks: Who to suspect?, In Proc. MILCOM. doi: 10.1109/MILCOM.2012.6415780
- [28] Peixoto T.P. (2014). The graph-tool python library [online]. Accessed January 2018. Available: http://graph-tool.skewed.de. doi: 10.6084/m9.figshare.1164194
- [29] ADM Rogers M.S. (2017). Cybersecurity threats and defense strategy [video file], C-SPAN. Accessed January 2018. Available: https://www.c-span.org/video/?428023-1/nsa-director-rogers-russia-poses-threat-congressional-elections
- [30] Rosenbaum P.R. and Rubin D.B. (1983). The central role of the propensity score in observational studies for causal effects, Biometrika 70 (1) : 41–55. doi: 10.1093/biomet/70.1.41
- [31] Shah D. and Zaman T. (2011). Rumors in a network: Who’s the culprit?, IEEE Trans. Information Theory 57 (8) : 5163–5181. doi: 10.1109/TIT.2011.2158885
- [32] Smith S.T. (2005). Covariance, subspace, and intrinsic Cramér-Rao bounds, IEEE Trans. Signal Processing 53 (5) : 1610–1630. doi: 10.1109/TSP.2005.845428
- [33] Smith S.T., Kao E.K., Senne K.D., Bernstein G., and Philips S. (2014). Bayesian discovery of threat networks, IEEE Trans. Signal Proc. 62 (20) : 5324–5338. doi: 10.1109/TSP.2014.2336613
- [34] Smith S.T., Caceres R.S., Senne K.D., McMahon M. and Greer T. (2018). Network discovery using content and homophily, in Proc. IEEE ICASSP, pp. 5925–5929. doi: 10.1109/ICASSP.2017.7953293
- [35] Statista: We Are Social, IAB Singapore, and MediaPost. (n.d.) Global social network penetration rate as of January 2017, by region; Time spent per day with digital versus traditional media in the United States from 2011 to 2018. Statista. Accessed January 2018. Available: https://www.statista.com/statistics/269615/social-network-penetration-by-region; https://www.statista.com/statistics/565628/time-spent-digital-traditional-media-usa
- [36] Stewart L.G., Arif A., and Starbird K. (2018). Examining trolls and polarization with a retweet network, in Proc. ACM WSDM, Workshop on Misinformation and Misbehavior Mining on the Web (to appear). Accessed January 2018. Available: https://faculty.washington.edu/kstarbi/examining-trolls-polarization.pdf
- [37] Sussman D.L. and Airoldi E.M. (2017). Elements of estimation theory for causal effects in the presence of network interference. arxiv: 1702.03578
- [38] Tambuscio M., Ruffo G., Flammini A., and Menczer F. (2015). Fact-checking effect on viral hoaxes: A model of misinformation spread in social networks. In Proc. ACM WWW. doi: 10.1145/2740908.2742572
- [39] Shalizi C.R. and Thomas A.C. (2011). Homophily and contagion are generically confounded in observational social network studies, Sociological Methods & Research 40 (2) : 211–239. doi: 10.1177/0049124111404820
- [40] Toulis P. and Kao E.K. (2013). Estimation of causal peer influence effects, in Proc. ICML, PMLR 28 (3) : 1489–1497. Available: http://citeseerx.ist.psu.edu/viewdoc/summary?doi=10.1.1.310.4838
- [41] Twitter, Inc. API overview [online]. Accessed January 2018. Available: https://dev.twitter.com/overview/api
- [42] U.S. House Permanent Select Committee on Intelligence. (1 November 2017). Exhibit of the user account handles that Twitter has identified as being tied to Russia’s “Internet Research Agency.” Accessed January 2018. Available: https://democrats-intelligence.house.gov/uploadedfiles/hpsci_minority_exhibits_memo_11.1.17.pdf; https://democrats-intelligence.house.gov/uploadedfiles/exhibit_b.pdf
- [43] Ugander J., Karrer B., Backstrom L., and Kleinberg J. (2013). Graph cluster randomization: network exposure to multiple universes. In Proc. 19th ACM SIGKDD. pp. 329–337. doi: 10.1145/2487575.2487695
- [44] Varol O., Ferrara E., Davis C., Menczer F., Flammini A. (2017). Online human-bot interactions: Detection, estimation, and characterization, in Proc. AAAI ICWSM, pp. 280–289. arxiv: 1703.03107
- [45] Wen S., Haghighi M.S., Chen C., Xiang Y., Zhou W., and Jia W. (2015). A sword with two edges: Propagation studies on both positive and negative information in online social networks, IEEE Trans. Computers 64 (3) : 640–653. doi: 10.1109/TC.2013.2295802
- [46] Zhang H., Zhang H., Li X., Thai M.T. (2015). Limiting the spread of misinformation while effectively raising awareness in social networks. In Computational Social Networks, CSoNet 2015. Lecture Notes in Computer Science 9197, Springer. doi: 10.1007/978-3-319-21786-4_4