Comparing scientific and technological impact of biomedical research
Abstract
Traditionally, the number of citations that a scholarly paper receives from other papers is used as the proxy of its scientific impact. Yet citations can come from domains outside the scientific community, and one such example is through patented technologies—paper can be cited by patents, achieving technological impact. While the scientific impact of papers has been extensively studied, the technological aspect remains less known in the literature. Here we aim to fill this gap by presenting a comparative study on how 919 thousand biomedical papers are cited by U.S. patents and by other papers over time. We observe a positive correlation between citations from patents and from papers, but there is little overlap between the two domains in either the most cited papers, or papers with the most delayed recognition. We also find that the two types of citations exhibit distinct temporal variations, with patent citations lagging behind paper citations for a median of 6 years for the majority of papers. Our work contributes to the understanding of the technological impact of papers.
keywords:
patent-to-paper citation, non-patent reference, technological impact1 Introduction
Scientific research builds upon existing knowledge, and such reliance is often manifested by citing previous scientific papers. Citation flows among papers therefore have long been used to study the scientific enterprise, such as mapping knowledge domains [Rosvall & Bergstrom, 2008], tracking the evolution of science and the emergence of new fields [Rosvall & Bergstrom, 2010, Sinatra et al., 2015], understanding the formation of scientific consensus [Shwed & Bearman, 2010], allocating credit in science [Shen & Barabási, 2014], among many others. Citation-based metrics have been increasingly adopted to assess the scientific impact of various entities in the scientific community, from papers [Wang et al., 2013] and authors [Hirsch, 2005, Sinatra et al., 2016] to journals [Stigler, 1994, Varin et al., 2016], institutions [Davis & Papanek, 1984], and nations [King, 2004]. Yet scholarly papers can have their impact that reaches domains beyond the scientific community. Here, we focus on one such domain—patented technologies—to study the technological impact of papers, as patents are the most widely used ones to represent technological advance [Fleming & Sorenson, 2004, Meyer, 2002]. Although such representation is limited by the possibility that not all patentable inventions have been patented, scholars have long used patent data to understand innovative activities and the development of technologies.
Papers that are cited by a patent are listed in the non-patent references (NPRs) section of a patent application and considered relevant to the application by either the applicant or the patent examiner. Apart from papers, many other types of documents may also be listed as NPRs, such as books, Web pages, etc. Patent law imposes an obligation on patent applicants to submit relevant “prior art” of which they are aware, including both patents and non-patent materials, and failure to do so may result in the application unpatentable. Patent examiner who reviews the application may find prior art themselves, generating additional citations, and then determines the patentability of the invention.
Studies about the analysis of patent-to-paper citation linkages started already in the 1980s. Narin & Olivastro [1992] reported a statistical analysis on the types of NPRs and the time and nation dimension of scientific NPRs. Scholars have proposed several interpretations about the patent-to-paper citation linkages. One of the most adopted ones is that the linkage signals direct knowledge flows [Jaffe et al., 1993, Azoulay et al., 2011], that is, the occurrence of citations to a patent or a paper is argued to indicate that the inventors have benefited from the patent or the paper. This interpretation, although subject to debate [Meyer, 2000] and limited by the fact that patent examiners can also add citations [Alcácer & Gittelman, 2006, Alcácer et al., 2009, Lemley & Sampat, 2012], has been the basis of many studies that attempt to demonstrate how publicly-financed research contributes to technological advances and private-sector innovations [Narin et al., 1997, McMillan et al., 2000, Ahmadpoor & Jones, 2017, Azoulay et al., 2017, Li et al., 2017], motivating further public support for scientific research. Fleming & Sorenson [2004] argued that the mechanism through which science increases the rate of invention is that science leads inventors’ search process more directly to useful combinations. Other scholars have argued that patent-to-paper citations signal relatedness between science and technology [Callaert et al., 2014].
Our work shifts the attention from interpreting the linkage to assessing the technological impact of papers. In this regard, a related line of literature is the examination of the broader impact of research beyond the traditional scientific community. Existing work has examined how papers are covered by news media [Phillips et al., 1991], used in the development of drug products [Williams et al., 2015], referenced in clinical guidelines [Grant et al., 2000], and mentioned on the social Web (e.g., Twitter and Wikipedia) [Thelwall et al., 2013], among many other outlets. Our work extends this line of literature by focusing on the technological community, which hitherto has been less explored, and investigates how papers are cited by patents. Moreover, we emphasize citation growth over time rather than simple citation counts at a particular time point, allowing us to explore the dynamics of the utilization of scientific research for technology development. The only study that is similar to our work is the one by Ding et al. [2017]. However, we not only look at the entire citation history of papers as opposed to two five-year time windows considered by them, but also make a comparison of citations received from patents and from papers.
Based on the cohort of biomedical papers that have received citations from U.S. patents, we perform a comparative study on how they are cited by patents and by other papers over time. We report a set of stylized facts about the two types of citations. First, similar to paper citations, patent citations are also heterogeneously distributed. Yet, highly-cited papers in the two domains have small overlap. Second, there are delayed-recognition papers that achieve high popularity among patents after years of dormant. Third, patent citations generally lag behind paper citations for the majority of papers.
2 Data and methods
For each paper, we assembled two types of citations, namely those from other papers and from patents. We first describe the patent citation case. We focused only on U.S. patents, due to the public availability of patent bibliographic data over a long period of time. To get citation information from patents, we downloaded the front page bibliographic data of all utility patents granted by the United States Patent and Trademark Office (USPTO) between and from https://bulkdata.uspto.gov, and excluded withdrawn patents (https://www.uspto.gov/patents-application-process/patent-search/withdrawn-patent-numbers). Each patent included a list of references containing previously issued patents and optional NPRs that can refer to essentially anything, including books, papers, patent applications, online resources, etc. As we are interested in papers, we further excluded patents without any NPR, ending up with patents.
We then matched their NPRs with papers indexed in MEDLINE, a large-scale bibliographic database for biomedical research literature maintained by the National Library of Medicine (NLM). The matching steps are as follows:
-
1.
We submitted a search query to PubMed where the search term is the entire NPR text, with the URL following: https://www.ncbi.nlm.nih.gov/pubmed/?term=[NPR]&report=uilist&format=text, which returned the matched PMID.
-
2.
If the first step failed, we then extracted relevant bibliographic information, such as author, title, journal, volume, number, pages, and year, available in the NPR text, using the AnyStyle parser (https://anystyle.io/). It employs a machine learning technique called Conditional Random Fields to parse citation text with any style, which is achieved by pre-training the model with different styles of labeled citation text.
-
3.
After the extraction, we searched PubMed using the ECitMatch E-utility (https://dataguide.nlm.nih.gov/eutilities/utilities.html#ecitmatch), which accepts 5 types of information as input, namely journal, year, volume, first page, and author name, and returns the matched PMID. When searching, we first used all the 5 fields and, if failed, all the 5 possible combinations of 4 fields.
To validate our matching results, we manually matched randomly selected NPRs, and Table 1 reports the confusion matrix. For cases, hand labeling and the matching method found the same paper (true positives); for cases, both agreed that there was no paper matched (true negatives); and for cases, our matching method deemed that there was no paper matched but manual labeling found one (false negatives). A total of unique papers were matched.
| True positive = 117 | False positive = 0 |
| False negative = 6 | True negative = 85 |
After this integration step, we counted, for a paper published in calendar year , the number of patent citations it received in the -th (; ; ) year after its publication, denoted as . Note that the citing patents in each year (calender year ) are those issued at time rather than those whose applications were submitted at . The total number of patent citations it received until the end of the observation period is . Here we do not distinguish between citations generated by applicants or examiners, as we do not concern about knowledge spillover and examiner-added citations may also indicate the impact of papers.
To get the number of citations from papers, we turn to the Web of Science (WoS) database, as citation data is available only for PubMed Central papers. We used a version of WoS currently housed at the Indiana University Network Science Institute to retrieve the paper citation data. To locate MEDLINE papers in WoS, we used the mapping data between PMID (PubMed ID) and UT (Accession Number), which are the two identifiers used in their respective database, and successfully found () MEDLINE papers in WoS. When counting citations, we only considered the following types of documents: article, review, editorial, note, and letter. For each of the papers under consideration, we denote its yearly number of citations from other papers as , and is the total number of paper citations it received by .
For analysis that involved the entire MEDLINE database, we used a snapshot in that contained papers. To get the fields of papers, we chose to use the NLM Catalog data (https://www.ncbi.nlm.nih.gov/nlmcatalog), as it is specifically created to be used in conjunction with other databases such as MEDLINE maintained by NLM. It assigns each indexed journal to one or more categories called Broad Subject Terms (e.g., Biochemistry, Cell Biology, Nursing, Health Services Research).
3 Results
The overarching goal of the present study is to examine how patent citations of papers are different from paper citations. To this end, we present four sets of results. First, we report in Section 3.1 descriptive statistics on the types of papers that get cited by patents, journals where these papers were published, and fields to which they belong, given that these statistics are not well-known in the existing literature. Second, in Section 3.2, we examine how total patent and paper citations differ. Next, Section 3.3 examines how patent and paper citations change over time by focusing on the delayed recognition phenomenon. Finally, Section 3.4 performs a lead-lag analysis of citation dynamics.
3.1 Fields and journals
The papers that get patent citations only account for a very small portion () of all MEDLINE papers published until . Our estimation is similar to the one obtained from a recent study where papers in WoS rather than MEDLINE were considered: out of million, or of, WoS papers were cited by USPTO-issued patents [Ahmadpoor & Jones, 2017].
Table 2 shows the distribution of document types assigned by WoS for the MEDLINE papers indexed there. Articles contribute to the largest portion (), followed by review, note, editorial, and letter.
| Type | Count | |
|---|---|---|
| Article | ||
| Review | ||
| Note | ||
| Editorial | ||
| Letter | ||
| Others |
Table 3 displays the top most cited biomedical research fields, as defined by NLM as Broad Subject Terms, which in total account for of patent citations. For each field, we derived three statistics: (1) the total number of patent citations of all papers published in journals that belong to the field, (2) the unique number of papers that are cited by patents, and (3) the fraction of papers that are cited by patents among all papers published there. While the first two are of retrospective, the third one is of prospective, since each journal publishes different amounts of papers. Biochemistry is the most cited field, attracting of citations from patents, followed by Science (), Molecular Biology (), Allergy and Immunology (), Cell Biology (), and Chemistry (). Here “Science” covers multi-disciplinary journals like Nature and Science, similar to the Multidisciplinary Science designated in Journal Citation Reports (JCR).
| Field | # Cites | % Cites | # Papers | % Papers | % Published | Category |
|---|---|---|---|---|---|---|
| Biochemistry | 12.86 | 12.26 | 11.58 | Basic | ||
| Science | 10.57 | 4.88 | 9.64 | – | ||
| Molecular Biology | 6.02 | 5.37 | 11.19 | Basic | ||
| Allergy and Immunology | 5.18 | 5.03 | 11.09 | Clinical | ||
| Cell Biology | 4.23 | 3.59 | 10.30 | Basic | ||
| Chemistry | 3.74 | 3.77 | 7.96 | – | ||
| Pharmacology | 3.57 | 3.96 | 7.11 | Clinical | ||
| Neoplasms | 3.48 | 3.91 | 6.64 | – | ||
| Medicine | 3.38 | 3.26 | 1.69 | Clinical | ||
| Biotechnology | 2.71 | 1.94 | 14.04 | – | ||
| Neurology | 2.16 | 2.76 | 3.62 | Clinical | ||
| Biophysics | 2.08 | 2.36 | 6.62 | Basic | ||
| Virology | 1.77 | 1.73 | 13.83 | Basic | ||
| Physiology | 1.77 | 2.16 | 4.25 | Basic | ||
| Cardiology | 1.77 | 1.70 | 3.61 | – | ||
| Microbiology | 1.67 | 2.16 | 6.78 | Basic | ||
| Ophthalmology | 1.60 | 1.90 | 5.74 | Clinical | ||
| Vascular Diseases | 1.53 | 1.66 | 5.14 | – | ||
| Biology | 1.51 | 1.68 | 4.19 | – | ||
| General Surgery | 1.47 | 1.32 | 1.80 | Clinical |
The second observation from Table 3 is that the share of citations for each field is roughly proportional to the share of the number of unique papers cited, except for the Science category. This means that multidisciplinary journals accrue patent citations disproportionately, suggesting a larger-than-average number of patent citations for papers published there.
When looking at the fraction of cited papers among all papers published (“% Published” column), we observe that the overall tendency to be cited by patents varies across fields. Among these most cited fields, Biotechnology has the largest portion () of papers cited by patents. Virology, Biochemistry, Molecular Biology, Allergy and Immunology, and Cell Biology all have more than of such papers. On the other hand, only of papers belonging to Medicine get patent citations, which is similar for General Surgery. Cardiology, Neurology, Biology, and Physiology also generate a small fraction of patent-cited papers.
The last column in Table 3 indicates whether these fields belong to basic research or clinical medicine, as categorized by Narin et al. in the pioneering work on the structure of biomedical literature [Narin et al., 1976]. Although the number of basic research fields is similar to the ones belonging to clinical medicine, basic research surpass clinical medicine once we weight by total citations or unique papers. This resonates with previous results [Narin et al., 1997, McMillan et al., 2000].
Next, we delve into journals. Table A.1 reports the top field-specific journals that received the most patent citations. For each journal, we present the same set of statistics as in Table 3. We see from Table A.1 that papers that obtained patent citations were published in leading journals. Across fields, PNAS, Journal of Biological Chemistry (JBC), a journal with a long publishing history, and Science are the top three most cited journals. They are also the three journals that published the largest number of papers that are cited by patents. Other highly-cited journals include Nature, Journal of Medicinal Chemistry, Nucleic Acids Research, and Cell.
Similar to what has been observed in Table 3, most journals attract patent citations proportionate to their share of cited papers. But this is not the case for Cell: only of Cell Biology papers were published in Cell, yet they account for of citations to the field. Other prominent examples, although to a lesser extent, include Nucleic Acids Research, Journal of Medicinal Chemistry, Nature, and Science.
Table A.1 also provides results from a prospective analysis. Across these fields, Annual Review of Immunology has the highest fraction () of papers that are cited by patents, followed by Journal of Medicinal Chemistry (), Cell (), and EMBO Journal (). On the other hand, Nature and Science have a relatively low fraction, which could simply due to the fact that they are multidisciplinary journals that publish non-biomedical papers.
A final point regarding both Tables 3 and A.1 is that these results are limited by the fact that MEDLINE is a database for the biomedical research literature. As such, it may have low coverage of papers in other disciplines such as physics and engineering, especially if papers in these disciplines are not directly related to biomedicine. This may to some extent dictate our results. For example, in a seminal work by Narin et al. [1997] that studied citations from U.S. patents to papers, they found that Tetrahedron is among the top most cited Chemistry journals. However, it fails to make it top in Table A.1, because MEDLINE only has a limited coverage of papers in Tetrahedron. Future work therefore is needed to compare how our results are different from the ones based on other databases like WoS.
3.2 Total citations
How many citations does a paper receive from patents? How does it compare to citations from other papers? In this section, we investigate total citations. Tables A.2 and A.3 list the top papers by total patent citations and paper citations , respectively. The paper with the highest number of paper citations in our sample happens to be the most cited one of all time [Noorden et al., 2014].
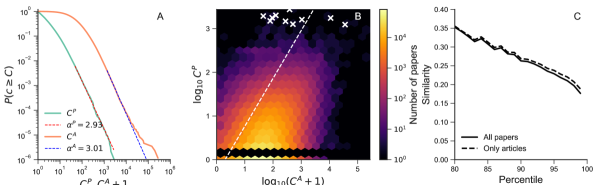
Heterogeneity in the number of patent citations is present for the cohort of papers that got cited by patents, as evidenced from Fig. 1A where we plot the survival distribution of . Although () papers have only one patent citation, there exists papers that are cited by thousands of patents. We fitted the distribution with the power-law function, giving us exponent . For comparison, we also show in Fig. 1A the distribution of , the total number of paper citations, and the power-law fit yields exponent . This suggests that despite paper citations are larger than patent citations—which could simply due to the fact that there is a larger pool of papers than that of patents—they exhibit similar speed of decay.
We further compare total patent and paper citations. Fig. 1B plots against in the form of heat map, where the color encodes the frequency of papers. The map features a broad band with an upward slope, indicating that papers under our consideration that have more paper citations in general tend to attract more patent citations as well. The Spearman’s rank correlation coefficient between and is . Such a positive correlation persists (coefficient ) if we consider all the MEDLINE papers that can be found in WoS. We also observe that the region of the highest density is located in the lower left of the heat map, corresponding to the case where most papers have paper citations less than and patent citations less than . The map indicates that the vast majority of papers have less patent citations than paper citations, but () papers exhibit the opposite, among which of the top papers with most patent citations are in this case. A total of () papers are cited by patents but got zero paper citation.
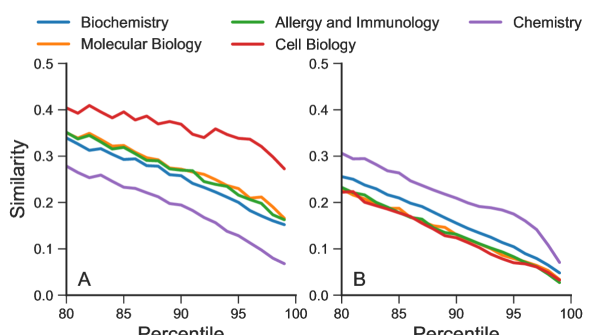
Are papers that are highly cited in the scientific community also highly cited in the patent sphere? We quantified the extent of overlap between the two sets of top cited papers using a similarity measure. Formally, let () be the set of papers with the number of patent (paper) citations no less than the threshold corresponding to a given percentile, and the similarity between and is defined as , which measures the fraction of top cited papers by patents that are also top cited by papers. Fig. 1C shows that similarity steadily decreases as we increase the percentile. Only of the top most cited papers by patents are also in the top by the number of paper citations, indicating a small overlap of papers that are highly cited in both the scientific and the technology community. This pattern is consistent if we consider only research articles (Fig. 1C) or papers in one filed (Fig. A.1A).
3.3 Delayed recognition papers
The previous section has examined the total number of citations measured at the end of our observation period , but how it reached to that number can be diverse. We now look at time-dependent citation growth. From now on, we only restrict our analysis to the cohort of papers that (1) were published from and onward, since patent citation data is available only starting from , and (2) had at least one paper citation (), since we are interested in the comparison between and .
We first focus on a class of papers—the so-called “Sleeping Beauty” papers that lie dormant in a long period of time after their publication and then suddenly become highly cited. This notion has been mostly constrained within the scientific community, that is, citation curves based on which SBs are discovered are derived from how many other scientific papers have cited the focal one. Recent work has started to extend this notion to the technology domain [van Raan, 2017], and here we investigate whether there are also SBs that are perceived as late boomer by the technology community.
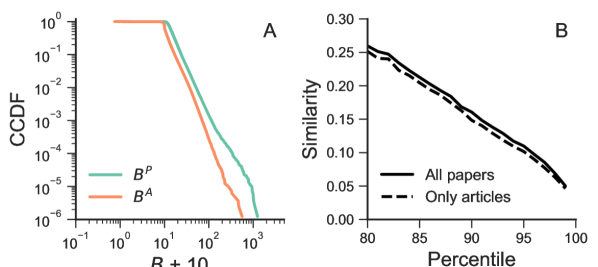
To do so, we calculated the Beauty Coefficient based on the and curve of each paper [Ke et al., 2015], denoted as and , respectively. Tables A.4 and A.5 report the top SBs by and , respectively. Fig. 2A, which plots the distributions of and , indicates that the extent of delayed recognition of papers perceived by both the scientific and technology community spans three orders of magnitude, similar to what has been observed before [Ke et al., 2015]. Regarding individual papers, there is a negligible correlation between their and values (Spearman correlation coefficient ). There is a low overlap of top SBs recognized by the two communities, as shown in Fig. 2B: only of the top SBs measured from patent citations also rank in the top SBs measured from paper citations. This observation still holds even if we consider only articles (Fig. 2B) or papers in one field (Fig. A.1B). These results suggest different life-cycles of patent and paper citations.
3.4 Time-dependent citation accumulation
Having looked at a particular type of papers, we now characterize the temporal variation of citations. To do so, we introduce the following parameters to describe a given citation dynamics curve :
-
1.
. It measures the number of years taken to obtain the first citation;
-
2.
. It is the number of years taken to obtain the maximum yearly citations;
-
3.
. It indicates whether the yearly citations have decreased to half of the maximum;
-
4.
. The first case captures the number of years that the curve has stayed above after reaching its maximum, given that the curve has not fallen below half of the maximum. The second case measures the number of years taken to fall below the half of the maximum, where is the time when drops below for the first time.
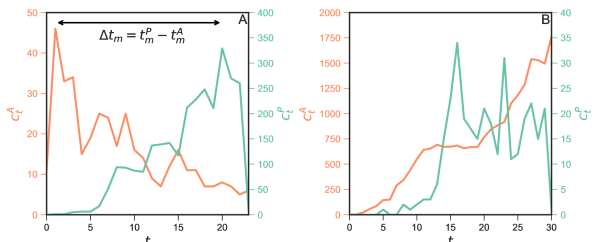
While the first two summarize how reaches the maximum, the latter two characterize how decrease after that. As each paper is associated with two time-series, namely and , we further compute two additional parameters: and , capturing how many years the first and the maximum patent citation lag behind the paper citation case.
As illustration, Fig. 3 shows and for two papers. For the first paper [Bowie et al., 1990], which was published in , its yearly paper citations reached its maximum quickly (, ) and then faded away steadily (, ), whereas the patent citations kept increasing for years (, ) and then quickly died out (, ), therefore and . For the second paper [Mosmann, 1983], published in , its yearly paper citations reached the peak at the end of the observation period (, ), whereas the patent citations climbed to the peak years after publication, yielding .
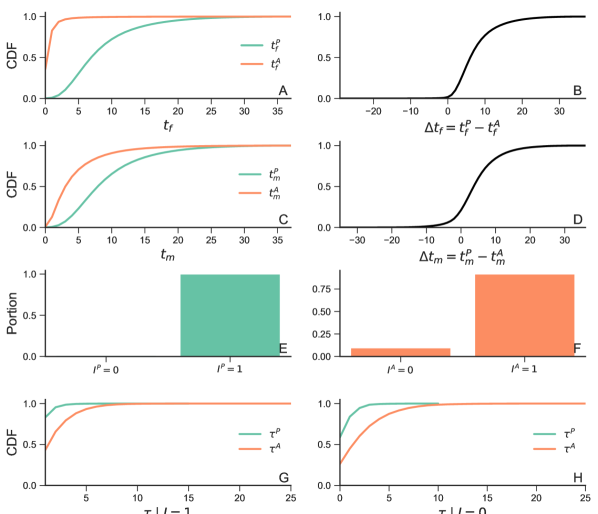
We calculated the introduced parameters for each paper in our cohort. Fig. 4 presents the distributions of these parameters across all papers, allowing us to probe overall patterns of their citation dynamics. First, Fig. 4A, which shows the cumulative distribution of and , indicates that almost all papers obtained their first paper citation during years after publication, while only of papers got cited by patents in years. In general, we observe from Fig. 4B that first patent citation occurred after first paper citation was obtained () for almost all papers, and the median lag is years.
Focusing on , Fig. 4C indicates that the median number of years taken to reach maximum yearly citations is and years for paper and patent citations, respectively. Fig. 4D shows that the majority () of papers obtained maximum yearly patent citations after the same event happened to paper citations (), and median lag is years for those papers.
Focusing on how citations decrease after the peak, for only papers, their patent citations have not dropped below half of the maximum (; Fig. 4E); and for the paper citation case (; Fig. 4F). Fig. 4H indicates that most papers belonging to this category obtain maximum citations very recently—within and years close to the end of the observation period for the patent and paper citation case, respectively.
For the remaining and papers whose yearly patent and paper citations have decreased below , Fig. 4G shows that such decay is very rapid for both and , taking less than and years for patent and paper citations, respectively.
4 Discussion
The increasing availability of large-scale datasets that systematically record how scholarly papers are referenced and mentioned in different channels has opened new possibilities for searching for the broader impact of research beyond the traditional scientific community. Previous studies have focused on news media, clinical guidelines, policy documents, and the social Web. In this work, we looked at another domain—patented technologies—that has received little attention so far in the literature, and studied the technological impact of papers.
Based on a newly-created dataset that links millions of non-patent references made by U.S. patents to MEDLINE papers, we compared citation statistics derived from patent references with traditional citations from papers. We found that only a small fraction——of papers ever got cited by patents. These papers are mainly from Biochemistry, Molecular Biology, Allergy and Immunology, Cell Biology, and Chemistry, and are published in leading biomedical journals. For these papers, there is a positive correlation between the number of patent and paper citations, although the magnitude is low, leaving much variations to be explained by other factors. The comparison between the curves of yearly patent and paper citations reveals that the majority of papers got their first and maximum paper citation before obtaining patent citations, highlighting different life-cycles of citation dynamics.
Future work is needed to uncover factors that explain the difference between patent and paper citations and examine more closely the context of patent citations. E.g., what are the technological classes of citing patents and what are the fields of cited papers? To what extent publicly-financed papers are cited by private-sector patents? Answers to these questions would contribute further to the understanding of the technological impact of scientific research.
Acknowledgments
I thank the anonymous referees for helpful comments and suggestions and Aditya Tandon for helping with retrieving Web of Science data, which is provided by the Indiana University Network Science Institute.
Appendix A
| Biochemistry | Science | ||||||||||
|---|---|---|---|---|---|---|---|---|---|---|---|
| Journal | # C | % C | # P | % P | % Pub. | Journal | # C | % C | # P | % P | % Pub. |
| J. Biol. Chem | 24.26 | 23.99 | 20.73 | PNAS | 42.66 | 47.79 | 23.72 | ||||
| Nucleic Acids Res. | 10.43 | 5.69 | 22.12 | Science | 29.51 | 21.70 | 7.60 | ||||
| Biochemistry | 7.63 | 6.83 | 16.05 | Nature | 23.79 | 20.17 | 11.53 | ||||
| Biochem. Biophys. Res. Commun. | 5.90 | 6.29 | 12.00 | Ann. N. Y. Acad. Sci. | 2.09 | 5.91 | 7.15 | ||||
| Biochim. Biophys. Acta | 4.24 | 5.19 | 8.08 | Scientific American | 0.54 | 407 | 0.71 | 7.87 | |||
| Anal. Biochem. | 3.83 | 3.17 | 18.17 | Nat. Mater. | 0.39 | 318 | 0.56 | 12.55 | |||
| FEBS Lett. | 3.75 | 4.05 | 13.42 | Experientia | 0.33 | 589 | 1.03 | 2.88 | |||
| Biochem. J. | 2.97 | 3.71 | 9.91 | Clinical Science | 0.24 | 395 | 0.69 | 5.60 | |||
| Methods Enzymol. | 2.85 | 2.02 | 15.79 | Die Naturwissenschaften | 494 | 0.10 | 105 | 0.18 | 2.06 | ||
| FEBS J. | 2.60 | 3.00 | 16.01 | PloS ONE | 336 | 0.07 | 236 | 0.41 | 0.29 | ||
| Molecular Biology | Allergy and Immunology | ||||||||||
| Journal | # C | % C | # P | % P | % Pub. | Journal | # C | % C | # P | % P | % Pub. |
| EMBO J. | 10.72 | 7.94 | 29.59 | J. Immunol. | 22.43 | 20.22 | 19.82 | ||||
| Mol. Cell. Biol. | 9.43 | 8.34 | 24.78 | J. Exp. Med. | 12.13 | 8.50 | 22.59 | ||||
| Gene | 9.18 | 6.69 | 24.91 | Infect. Immun. | 9.93 | 10.98 | 22.07 | ||||
| J. Mol. Biol. | 8.64 | 6.35 | 13.56 | J. Immunol. Methods | 4.96 | 4.50 | 25.14 | ||||
| Nat. Med. | 4.59 | 2.86 | 23.04 | Eur. J. Immunol | 4.28 | 4.09 | 17.38 | ||||
| Oncogene | 4.13 | 5.07 | 19.70 | Vaccine | 3.61 | 4.01 | 14.88 | ||||
| Genes Dev. | 3.54 | 3.01 | 27.42 | Mol. Immunol. | 2.43 | 1.84 | 16.72 | ||||
| Plant Molecular Biology | 3.05 | 2.83 | 28.14 | Immunol. Today | 2.00 | 681 | 1.16 | 23.23 | |||
| Mol. Pharmacol. | 2.32 | 2.77 | 16.39 | Annu. Rev. Immunol. | 1.99 | 430 | 0.73 | 53.95 | |||
| Mol. Microbiol. | 2.29 | 2.94 | 16.41 | Immunology | 1.67 | 2.15 | 10.96 | ||||
| Cell Biology | Chemistry | ||||||||||
| Journal | # C | % C | # P | % P | % Pub. | Journal | # C | % C | # P | % P | % Pub. |
| Cell | 31.13 | 14.92 | 37.77 | J. Med. Chem. | 39.56 | 24.51 | 42.95 | ||||
| Mol. Cell. Biol. | 13.43 | 12.48 | 24.78 | J. Am. Chem. Soc. | 9.11 | 11.34 | 10.96 | ||||
| J. Cell Biol. | 8.39 | 8.91 | 18.63 | Bioorganic Med. Chem. Lett. | 7.03 | 7.35 | 17.92 | ||||
| Plant Cell | 4.05 | 3.29 | 27.59 | J. Org. Chem. | 5.54 | 6.80 | 13.98 | ||||
| Exp. Cell Res. | 2.79 | 4.13 | 8.72 | Chem. Pharm. Bull. | 4.16 | 4.56 | 14.26 | ||||
| Plant Journal | 2.62 | 2.66 | 19.59 | J. Neurochem. | 3.60 | 4.85 | 8.61 | ||||
| J. Cell. Physiol. | 1.93 | 2.75 | 9.88 | Angewandte Chemie | 2.94 | 3.95 | 8.49 | ||||
| J. Cell Sci. | 1.93 | 3.03 | 9.78 | Bioorganic Med. Chem. | 2.90 | 3.43 | 13.74 | ||||
| Cytometry | 1.61 | 737 | 1.75 | 26.26 | Chem. Rev. | 2.66 | 630 | 1.43 | 25.70 | ||
| J. Cell. Biochem. | 1.45 | 811 | 1.93 | 10.67 | Chemistry Biology | 2.24 | 649 | 1.47 | 22.31 | ||
| PMID | Author | Title | Year | Journal | ||
|---|---|---|---|---|---|---|
| 2315699 | 2748 | 385 | JU Bowie | Deciphering the message in protein sequences: tolerance to amino | 1990 | Science |
| acid substitutions | ||||||
| 8844166 | 2014 | 125 | Y Eshed | Less-than-additive epistatic interactions of quantitative trait loci | 1996 | Genetics |
| in tomato | ||||||
| 3285178 | 1938 | 44 | E Lazar | Transforming growth factor alpha: mutation of aspartic acid 47 | 1988 | Mol. Cell. Biol. |
| and leucine 48 results in different biological activities | ||||||
| 1699952 | 1770 | 92 | WH Burgess | Possible dissociation of the heparin-binding and mitogenic | 1990 | J. Cell Biol. |
| activities of heparin-binding (acidic fibroblast) growth factor-1 | ||||||
| from its receptor-binding activities by site-directed mutagenesis | ||||||
| of a single lysine residue | ||||||
| 1172191 | 1749 | 11000 | G Köhler | Continuous cultures of fused cells secreting antibody of predefined | 1975 | Nature |
| specificity | ||||||
| 9305836 | 1604 | 1053 | IM Verma | Gene therapy – promises, problems and prospects | 1997 | Nature |
| 10631780 | 1499 | 78 | J Skolnick | From genes to protein structure and function: novel applications | 2000 | Trends Biotechnol. |
| of computational approaches in the genomic era | ||||||
| 11325474 | 1473 | 276 | SR Vippagunta | Crystalline solids | 2001 | Adv. Drug Deliv. Rev. |
| 2271534 | 1266 | 506 | JA Wells | Additivity of mutational effects in proteins | 1990 | Biochemistry |
| 2231712 | 1235 | 35800 | SF Altschul | Basic local alignment search tool | 1990 | J. Mol. Biol. |
| PMID | Author | Title | Year | Journal | ||
|---|---|---|---|---|---|---|
| 14907713 | 247 | 275527 | OH Lowry | Protein measurement with the Folin phenol reagent | 1951 | J. Biol. Chem. |
| 5432063 | 942 | 198137 | UK Laemmli | Cleavage of structural proteins during the assembly of the head of | 1970 | Nature |
| bacteriophage T4 | ||||||
| 942051 | 568 | 145074 | MM Bradford | A rapid and sensitive method for the quantitation of microgram | 1976 | Anal. Biochem. |
| quantities of protein utilizing the principle of protein-dye binding | ||||||
| 271968 | 1164 | 62573 | F Sanger | DNA sequencing with chain-terminating inhibitors | 1977 | PNAS |
| 2440339 | 569 | 59607 | P Chomczynski | Single-step method of RNA isolation by acid guanidinium | 1987 | Anal. Biochem. |
| thiocyanate-phenol-chloroform extraction | ||||||
| 388439 | 360 | 50513 | H Towbin | Electrophoretic transfer of proteins from polyacrylamide gels to | 1979 | PNAS |
| nitrocellulose sheets: procedure and some applications | ||||||
| 13428781 | 51 | 41232 | J Folch | A simple method for the isolation and purification of total lipides | 1957 | J. Biol. Chem. |
| from animal tissues | ||||||
| 7984417 | 158 | 38418 | JD Thompson | CLUSTAL W: improving the sensitivity of progressive multiple | 1994 | Nucleic Acids Res. |
| sequence alignment through sequence weighting, position-specific | ||||||
| gap penalties and weight matrix choice | ||||||
| 2231712 | 1235 | 35800 | SF Altschul | Basic local alignment search tool | 1990 | J. Mol. Biol. |
| 18156677 | 2 | 34459 | GM Sheldrick | A short history of SHELX | 2008 | Acta Crystallogr. A |
| PMID | Author | Title | Year | Journal | ||||
|---|---|---|---|---|---|---|---|---|
| 6804947 | 1244 | 0 | 1180 | 96 | S Rudikoff | Single amino acid substitution altering antigen-binding specificity | 1982 | PNAS |
| 1353878 | 1084 | 2 | 318 | 10 | PC Huettner | Neu oncogene expression in ovarian tumors: a quantitative study | 1992 | Mod. Pathol. |
| 8404593 | 1013 | 1 | 325 | 28 | B Freyschuss | Induction of the estrogen receptor by growth hormone and | 1993 | Endocrinology |
| glucocorticoid substitution in primary cultures of rat hepatocytes | ||||||||
| 1463873 | 993 | 0 | 294 | 6 | E Hähnel | Expression of the pS2 gene in breast tissues assessed by | 1992 | Breast Cancer Res. Treat. |
| pS2-mRNA analysis and pS2-protein radioimmunoassay | ||||||||
| 7507349 | 981 | 4 | 314 | 17 | E Jacquemin | Developmental regulation of acidic fibroblast growth factor | 1993 | Int. J. Dev. Biol. |
| (aFGF) expression in bovine retina | ||||||||
| 833720 | 939 | 116 | 1012 | 211 | SM Berge | Pharmaceutical salts | 1977 | J. Pharm. Sci. |
| 8048062 | 935 | 0 | 323 | 82 | ME Hahn | Regulation of cytochrome P4501A1 in teleosts: sustained induction | 1994 | Toxicol. Appl. Pharmacol. |
| of CYP1A1 mRNA, protein, and catalytic activity by | ||||||||
| 2,3,7,8-tetrachlorodibenzofuran in the marine fish Stenotomus chrysops | ||||||||
| 8275492 | 922 | 0 | 322 | 172 | I Husain | Elevation of topoisomerase I messenger RNA, protein, and catalytic | 1994 | Cancer Res. |
| activity in human tumors: demonstration of tumor-type specificity | ||||||||
| and implications for cancer chemotherapy | ||||||||
| 7741759 | 856 | 1 | 325 | 64 | J George | Pre-translational regulation of cytochrome P450 genes is responsible | 1995 | Biochem. Pharmacol. |
| for disease-specific changes of individual P450 enzymes among | ||||||||
| patients with cirrhosis | ||||||||
| 6136691 | 808 | 30 | 131 | 16 | P Svedman | Irrigation treatment of leg ulcers | 1983 | Lancet |
| PMID | Author | Title | Year | Journal | ||||
|---|---|---|---|---|---|---|---|---|
| 3899825 | 47 | 553 | 18 | 11308 | DR Matthews | Homeostasis model assessment: insulin resistance and beta-cell | 1985 | Diabetologia |
| function from fasting plasma glucose and insulin concentrations | ||||||||
| in man | ||||||||
| 728692 | 32 | 464 | 3 | 2683 | RC Young | A rating scale for mania: reliability, validity and sensitivity | 1978 | Br. J. Psychiatry |
| 477100 | 11 | 448 | 2 | 1553 | TA Gruen | “Modes of failure” of cemented stem-type femoral components: | 1979 | Clin. Orthop. Relat. Res. |
| a radiographic analysis of loosening | ||||||||
| 976387 | 27 | 374 | 12 | 658 | AJ Friedenstein | Fibroblast precursors in normal and irradiated mouse | 1976 | Exp. Hematol. |
| hematopoietic organs | ||||||||
| 4028566 | 13 | 322 | 2 | 1167 | Y Tegner | Rating systems in the evaluation of knee ligament injuries | 1985 | Clin. Orthop. Relat. Res. |
| 7018783 | 24 | 313 | 27 | 800 | M Jarcho | Calcium phosphate ceramics as hard tissue prosthetics | 1981 | Clin. Orthop. Relat. Res. |
| 843571 | 31 | 287 | 4 | 13251 | JR Landis | The measurement of observer agreement for categorical data | 1977 | Biometrics |
| 70454 | 13 | 267 | 2 | 89 | GW Zack | Automatic measurement of sister chromatid exchange frequency | 1977 | J. Histochem. Cytochem. |
| 776922 | 22 | 241 | 8 | 264 | ML Landsman | Light-absorbing properties, stability, and spectral stabilization | 1976 | J. Appl. Physiol. |
| of indocyanine green | ||||||||
| 641088 | 20 | 220 | 4 | 569 | GE Lewinnek | Dislocations after total hip-replacement arthroplasties | 1978 | J. Bone Jt. Surg |
References
- Ahmadpoor & Jones [2017] Ahmadpoor, M., & Jones, B. F. (2017). The dual frontier: Patented inventions and prior scientific advance. Science, 357, 583–587. doi:10.1126/science.aam9527.
- Alcácer & Gittelman [2006] Alcácer, J., & Gittelman, M. (2006). Patent citations as a measure of knowledge flows: The influence of examiner citations. Review of Economics and Statistics, 88, 774–779. doi:10.1162/rest.88.4.774.
- Alcácer et al. [2009] Alcácer, J., Gittelman, M., & Sampat, B. (2009). Applicant and examiner citations in U.S. patents: An overview and analysis. Research Policy, 38, 415–427. doi:10.1016/j.respol.2008.12.001.
- Alstott et al. [2014] Alstott, J., Bullmore, E., & Plenz, D. (2014). powerlaw: A python package for analysis of heavy-tailed distributions. PLOS ONE, 9, e85777. doi:10.1371/journal.pone.0085777.
- Azoulay et al. [2017] Azoulay, P., Zivin, J. S. G., Li, D., & Sampat, B. N. (2017). Public R&D Investments and Private-sector Patenting: Evidence from NIH Funding Rules. Working Paper 20889 National Bureau of Economic Research. doi:10.3386/w20889.
- Azoulay et al. [2011] Azoulay, P., Zivin, J. S. G., & Sampat, B. N. (2011). The diffusion of scientific knowledge across time and space: Evidence from professional transitions for the superstars of medicine. In The Rate and Direction of Inventive Activity Revisited (pp. 107–155). University of Chicago Press. URL: http://www.nber.org/chapters/c12350.
- Bowie et al. [1990] Bowie, J., Reidhaar-Olson, J., Lim, W., & Sauer, R. (1990). Deciphering the message in protein sequences: tolerance to amino acid substitutions. Science, 247, 1306–1310. doi:10.1126/science.2315699.
- Callaert et al. [2014] Callaert, J., Pellens, M., & Looy, B. V. (2014). Sources of inspiration? making sense of scientific references in patents. Scientometrics, 98, 1617–1629. doi:10.1007/s11192-013-1073-x.
- Clauset et al. [2009] Clauset, A., Shalizi, C. R., & Newman, M. E. J. (2009). Power-law distributions in empirical data. SIAM Review, 51, 661–703. doi:10.1137/070710111.
- Davis & Papanek [1984] Davis, P., & Papanek, G. F. (1984). Faculty ratings of major economics departments by citations. American Economic Review, 74, 225–230.
- Ding et al. [2017] Ding, C. G., Hung, W.-C., Lee, M.-C., & Wang, H.-J. (2017). Exploring paper characteristics that facilitate the knowledge flow from science to technology. Journal of Informetrics, 11, 244–256. doi:10.1016/j.joi.2016.12.004.
- Fleming & Sorenson [2004] Fleming, L., & Sorenson, O. (2004). Science as a map in technological search. Strategic Management Journal, 25, 909–928. doi:10.1002/smj.384.
- Grant et al. [2000] Grant, J., Cottrell, R., Cluzeau, F., & Fawcett, G. (2000). Evaluating “payback” on biomedical research from papers cited in clinical guidelines: applied bibliometric study. BMJ, 320, 1107–1111. doi:10.1136/bmj.320.7242.1107.
- Hirsch [2005] Hirsch, J. E. (2005). An index to quantify an individual’s scientific research output. Proceedings of the National Academy of Sciences, 102, 16569–16572. doi:10.1073/pnas.0507655102.
- Jaffe et al. [1993] Jaffe, A. B., Trajtenberg, M., & Henderson, R. (1993). Geographic localization of knowledge spillovers as evidenced by patent citations. Quarterly Journal of Economics, 108, 577–598. doi:10.2307/2118401.
- Ke et al. [2015] Ke, Q., Ferrara, E., Radicchi, F., & Flammini, A. (2015). Defining and identifying Sleeping Beauties in science. Proceedings of the National Academy of Sciences, 112, 7426–7431. doi:10.1073/pnas.1424329112.
- King [2004] King, D. A. (2004). The scientific impact of nations. Nature, 430, 311–316. doi:10.1038/430311a.
- Lemley & Sampat [2012] Lemley, M. A., & Sampat, B. (2012). Examiner characteristics and patent office outcomes. The Review of Economics and Statistics, 94, 817–827. doi:10.1162/REST_a_00194.
- Li et al. [2017] Li, D., Azoulay, P., & Sampat, B. N. (2017). The applied value of public investments in biomedical research. Science, 356, 78–81. doi:10.1126/science.aal0010.
- McMillan et al. [2000] McMillan, G. S., Narin, F., & Deeds, D. L. (2000). An analysis of the critical role of public science in innovation: the case of biotechnology. Research Policy, 29, 1–8. doi:10.1016/S0048-7333(99)00030-X.
- Meyer [2000] Meyer, M. (2000). Does science push technology? patents citing scientific literature. Research Policy, 29, 409–434. doi:10.1016/S0048-7333(99)00040-2.
- Meyer [2002] Meyer, M. (2002). Tracing knowledge flows in innovation systems. Scientometrics, 54, 193–212. doi:10.1023/A:1016057727209.
- Mosmann [1983] Mosmann, T. (1983). Rapid colorimetric assay for cellular growth and survival: Application to proliferation and cytotoxicity assays. Journal of Immunological Methods, 65, 55–63. doi:10.1016/0022-1759(83)90303-4.
- Narin et al. [1997] Narin, F., Hamilton, K. S., & Olivastro, D. (1997). The increasing linkage between U.S. technology and public science. Research Policy, 26, 317–330. doi:10.1016/S0048-7333(97)00013-9.
- Narin & Olivastro [1992] Narin, F., & Olivastro, D. (1992). Status report: Linkage between technology and science. Research Policy, 21, 237–249. doi:10.1016/0048-7333(92)90018-Y.
- Narin et al. [1976] Narin, F., Pinski, G., & Gee, H. H. (1976). Structure of the biomedical literature. Journal of the American Society for Information Science, 27, 25–45. doi:10.1002/asi.4630270104.
- Noorden et al. [2014] Noorden, R. V., Maher, B., & Nuzzo, R. (2014). The top 100 papers. Nature, 514, 550–553. doi:10.1038/514550a.
- Phillips et al. [1991] Phillips, D. P., Kanter, E. J., Bednarczyk, B., & Tastad, P. L. (1991). Importance of the lay press in the transmission of medical knowledge to the scientific community. New England Journal of Medicine, 325, 1180–1183. doi:10.1056/NEJM199110173251620.
- van Raan [2017] van Raan, A. F. J. (2017). Sleeping beauties cited in patents: Is there also a dormitory of inventions? Scientometrics, 110, 1123–1156. doi:10.1007/s11192-016-2215-8.
- Rosvall & Bergstrom [2008] Rosvall, M., & Bergstrom, C. T. (2008). Maps of random walks on complex networks reveal community structure. Proceedings of the National Academy of Sciences, 105, 1118–1123. doi:10.1073/pnas.0706851105.
- Rosvall & Bergstrom [2010] Rosvall, M., & Bergstrom, C. T. (2010). Mapping change in large networks. PLOS ONE, 5, e8694. doi:10.1371/journal.pone.0008694.
- Shen & Barabási [2014] Shen, H.-W., & Barabási, A.-L. (2014). Collective credit allocation in science. Proceedings of the National Academy of Sciences, 111, 12325–12330. doi:10.1073/pnas.1401992111.
- Shwed & Bearman [2010] Shwed, U., & Bearman, P. S. (2010). The temporal structure of scientific consensus formation. American Sociological Review, 75, 817–840. doi:10.1177/0003122410388488.
- Sinatra et al. [2015] Sinatra, R., Deville, P., Szell, M., Wang, D., & Barabási, A.-L. (2015). A century of physics. Nature Physics, 11, 791–796. doi:10.1038/nphys3494.
- Sinatra et al. [2016] Sinatra, R., Wang, D., Deville, P., Song, C., & Barabási, A.-L. (2016). Quantifying the evolution of individual scientific impact. Science, 354, aaf5239. doi:10.1126/science.aaf5239.
- Stigler [1994] Stigler, S. M. (1994). Citation patterns in the journals of statistics and probability. Statistical Science, 9, 94–108. doi:10.1214/ss/1177010655.
- Thelwall et al. [2013] Thelwall, M., Haustein, S., Larivière, V., & Sugimoto, C. R. (2013). Do altmetrics work? twitter and ten other social web services. PLOS ONE, 8, e64841. doi:10.1371/journal.pone.0064841.
- Varin et al. [2016] Varin, C., Cattelan, M., & Firth, D. (2016). Statistical modelling of citation exchange between statistics journals. Journal of the Royal Statistical Society: Series A (Statistics in Society), 179, 1–63. doi:10.1111/rssa.12124.
- Wang et al. [2013] Wang, D., Song, C., & Barabási, A.-L. (2013). Quantifying long-term scientific impact. Science, 342, 127–132. doi:10.1126/science.1237825.
- Williams et al. [2015] Williams, R. S., Lotia, S., Holloway, A. K., & Pico, A. R. (2015). From scientific discovery to cures: Bright stars within a galaxy. Cell, 163, 21–23. doi:10.1016/j.cell.2015.09.007.