Saturation in regular, exotic and random pore networks
Abstract
Porcolation simulations were carried out on various networks; both regular and irregular. The saturation curve was obtained for cubic networks, localized and completely random 3D networks and networks based on exotic graphs like Sierpiński triangle and carpet. For the random graph generation a modification of the cell list algorithm was introduced, which is capable of generating local random graphs efficiently. With the help of this graph generation method, the effect of locality was investigated, and it was proven to be an important property of random networks from the viewpoint of liquid propagation. The saturation curves of local random networks with different prescribed pore degree distributions were also obtained.
1 Introduction
Liquid propagation in porous medium is a much-studied topic. Research in this area is important, for example, for the petroleum industry [1, 2], for groundwater contamination studies [3, 4] and for road construction [5].
A porous medium can be imagined to have pores (cavities) and capillaries (throats) connecting the pores. The invading fluid needs different external pressure to enter into different sized throats or pores. This so-called entry pressure can be calculated from the Washburn equation [6]
| (1) |
where is the surface tension of invading phase, is the contact angle between the non-wetting invading phase and the material and is the characteristic radius of the capillary (or throat).
There are two main computational approaches to model liquid propagation in porous materials [7]: the continuum and the pore network approach. Commercial packages like Fluent and Comsol utilize the continuum approach, in which the porous material is treated as a volume-averaged continuum. The fairly low computational cost of this approach however means that the microscale features of the material are not resolved, limiting the method to problems in which the connectivity of the pore space does not play a major role.
Pore network (discrete) modeling resolves the microscale features of the medium at the expense of larger computational cost. The porous medium can be modeled as a graph, where the vertices and edges correspond to the pores and capillaries, respectively. These pore-scale models date back to the work of Fatt [8, 9, 10]. The transport inside the network is modeled using finite difference schemes. This approach is widely used to simulate the multiphase flows in fuel cell electrodes [11]. OpenPNM (an open-source pore network modeling package) [12] also applies this approach. The advantages of pore network modeling compared to continuum approach is presented in [13, 14].
The distribution of pore sizes is a crucially important property of porous materials. Mercury porosimetry [15] is a commonly used method to determine the pore size distribution of rock samples. During this process mercury is forced into the samples using increasing external pressure. The volume of the injected mercury as the function of the pressure is the so-called saturation curve.
The modeling of mercury porosimetry was first studied by Chatzis and Androutsopoulos [16, 17, 18]. An external pressure driven access-limited invasion percolation model called porcolation was introduced in [19].
The porcolation method can be used for real networks provided that the statistical information required for the network generation is available. According to recent studies [20], the modeling of granular porous media can be effectively and accurately done based on processing 2D/3D images.
The main objective of the current work is to study saturation properties of both regular and irregular networks. We carried out porcolation simulations on square/cubic networks, networks based on exotic graphs like the Sierpiński triangle and carpet, and also on localized and completely random networks. Saturation curves were determined with OpenPNM.
This paper is structured as follows: in Section 2 the theoretical background of different percolation models is presented. Section 3 presents saturation curves of porcolation simulations on square and cubic networks. In Section 4 saturation curves for Sierpiński triangle and Sierpiński carpet networks are shown. In Section 5 the locality properties of irregular 3D networks were investigated with a newly developed graph generation model and saturation curves were also obtained for networks with different pore degree distribution. Section 6 concludes the paper.
2 Percolation models
Percolation theory was introduced in 1957 by Broadbent and Hammersley [21]. They investigated how the random properties of a medium influence the percolation of a fluid through it. In the following four percolation models are presented.
2.1 Ordinary Percolation
There are two fundamentally different types of the ordinary percolation model: bond-percolation and site-percolation [22] (Figure 1).
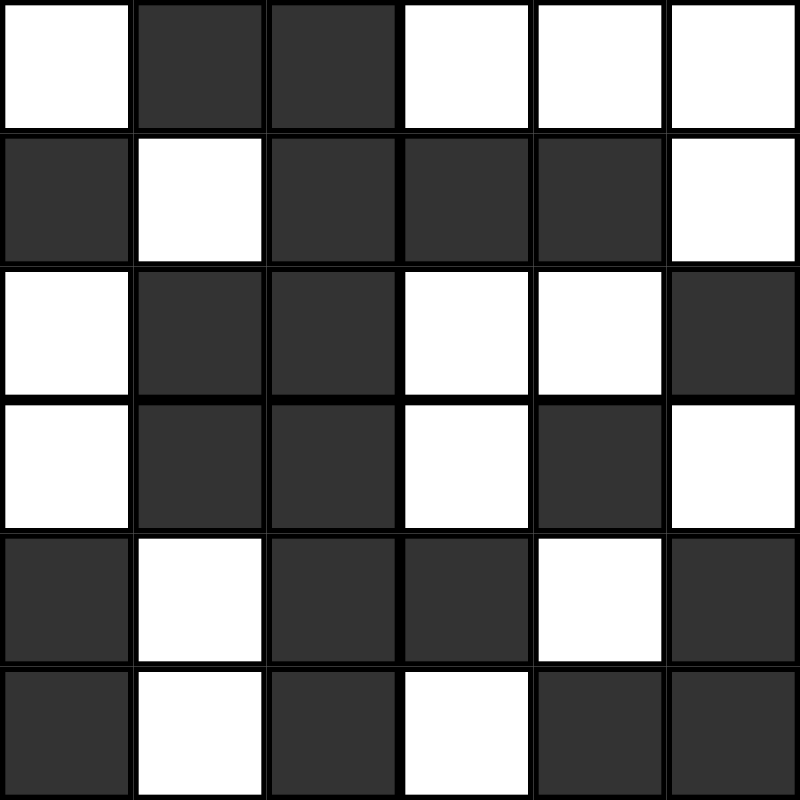
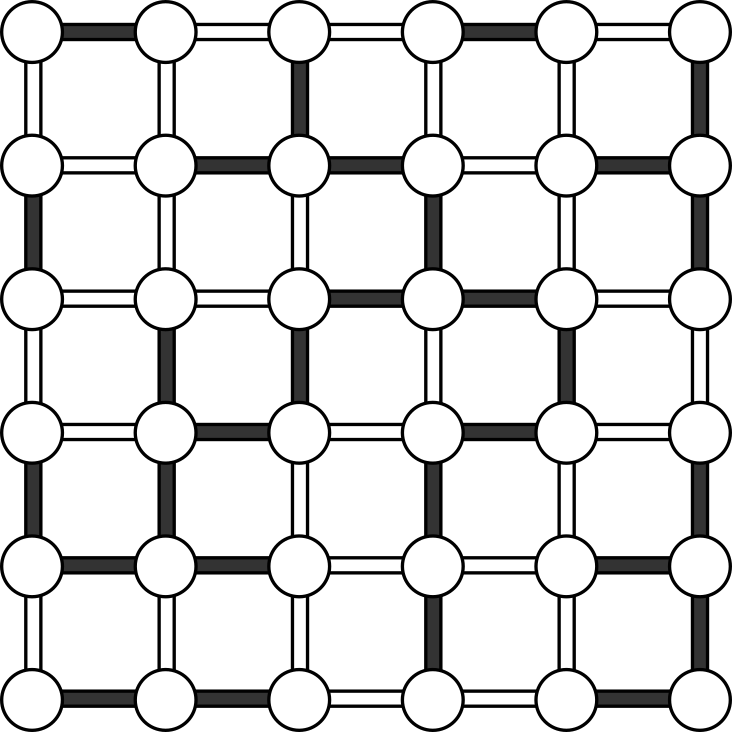
In site-percolation (Figure 1) each lattice site is occupied with some probability . Occupied sites having one common side are called neighbors [23], while a group of neighboring occupied sites is called a cluster. Clusters have a crucial role in percolation theory, since the existence of spanning cluster (a cluster that connects opposite boundaries) means that the invading fluid (the fluid that enters the medium under pressure) can percolate through the medium. If the occupation probability is small, there is only a slight chance of having a spanning cluster. On the other hand, if is nearly 1, there will almost certainly be a spanning cluster. The critical value of occupation probability (), at which an infinite cluster appears in an infinite lattice is [24] and [25] for two dimensional square and three dimensional cubic networks, respectively.
2.2 Invasion Percolation
The existence of a spanning cluster in ordinary percolation is a static property, thus ordinary percolation does not say anything about the dynamics of cluster growth (i.e. liquid propagation). Invasion percolation was introduced in [28, 29], as a variant of the ordinary percolation to fulfill the need of describing the dynamics of liquid propagation in porous medium. Invasion percolation can also be site- or bond-based.
The basic idea of invasion percolation is that every site (or bond) has an invasion resistance value . The invading phase starts from a prescribed region (set of sites), and at every step it occupies the most easily “accessible” site, i.e. the site that is a neighbor of an already invaded site with the lowest resistance.
2.3 Porcolation and Drainage
The porcolation model (PORisometry perCOLATION) is an access limited site-percolation model introduced in [19]. The idea of this model came from porosimetry experiments, where the injection pressure of the invading non-wetting fluid is gradually increased. The sites from where the fluid is injected into the medium are called the starting set.
In the porcolation model, each site has a volume and an invasion resistance (entry pressure value ) as shown in Figure 2. The throat defines the connection between and sites. This process is driven by an external pressure . For a given pressure , all sites with invasion resistance get occupied, provided they are connected to the starting set through a chain of neighboring sites having resistances . Hence, the main difference from invasion percolation is that in porcolation all accessible sites can be invaded simultaneously.

Drainage is an access limited bond-percolation model. In drainage, sites are connected by throats , which have individual entry pressure values . In this case the accessible throats are the ones that are connected with already occupied bonds to the starting set. A site that has a connecting occupied bond is also occupied instantly.
The mapping from a porcolation graph to a drainage graph (also shown in Figure 2) is quite simple by assigning to a bond the maximum of the two connected pore entry pressure values, i.e.
| (2) |
The physical meaning of this equation is that a throat becomes occupied only if both connected pores become occupied.
3 Porcolation simulations with OpenPNM
The total volume of pores in the porcolation model is (the index runs through all the pores)
| (3) |
The saturation is the ratio of occupied volume and total volume
| (4) |
The porcolation simulations were carried out in OpenPNM whose built-in drainage model is used with the correspondence described in Section 2.3, i.e. the throat entry pressure values were obtained by Equation (2).
3.1 Validation on regular graphs
Porcolation simulations were carried out on square and cubic lattices ( vertices for both). The pore entry pressure values were independently, uniformly generated from . Unit volume was assigned for each pore, i.e. . Two different starting sets were considered for both the two dimensional and three dimensional cases (Figure 3).
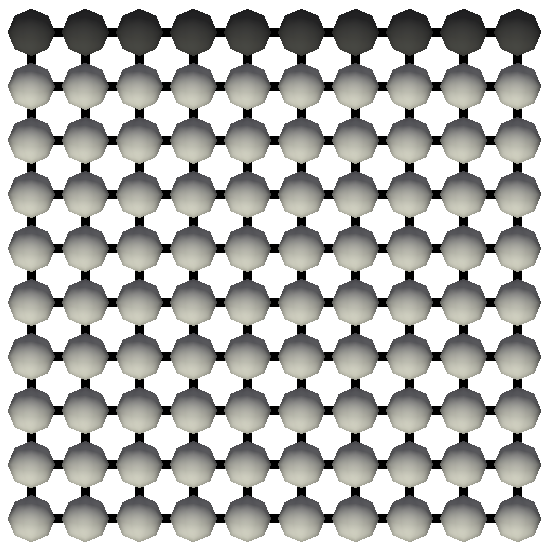
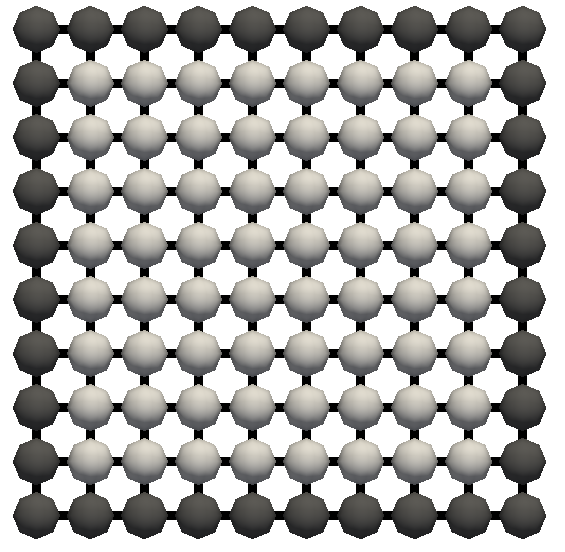
Fifty equidistant pressure steps were taken in the range. 100 simulations were run for each case taking about 3 hours on a 3rd generation, GHz Intel processor; the CPU time depends only on the number of pores and connections, it is independent of the dimension of the graphs. Since the pores have unit volume, the saturation for a given pressure is simply the ratio of the number of occupied pores and all pores.


The average saturation curves are shown on Figure 4. The inflection points of these saturation curves correspond to the critical probability () of ordinary percolation. The inflection point for the square network for one-sided porcolation is (0.16% difference from the theoretical 0.593). For the cubic network the inflection point is (1.3% difference from the theoretical 0.312).
The inflection point of the square network in the case of four-sided invasion is around (% difference) and the inflection point of the cubic network in the case of six-sided invasion is around (% difference). Figure 5 shows the histogram of the saturation values for (square lattice, one-sided).
4 Porcolation on exotic graphs
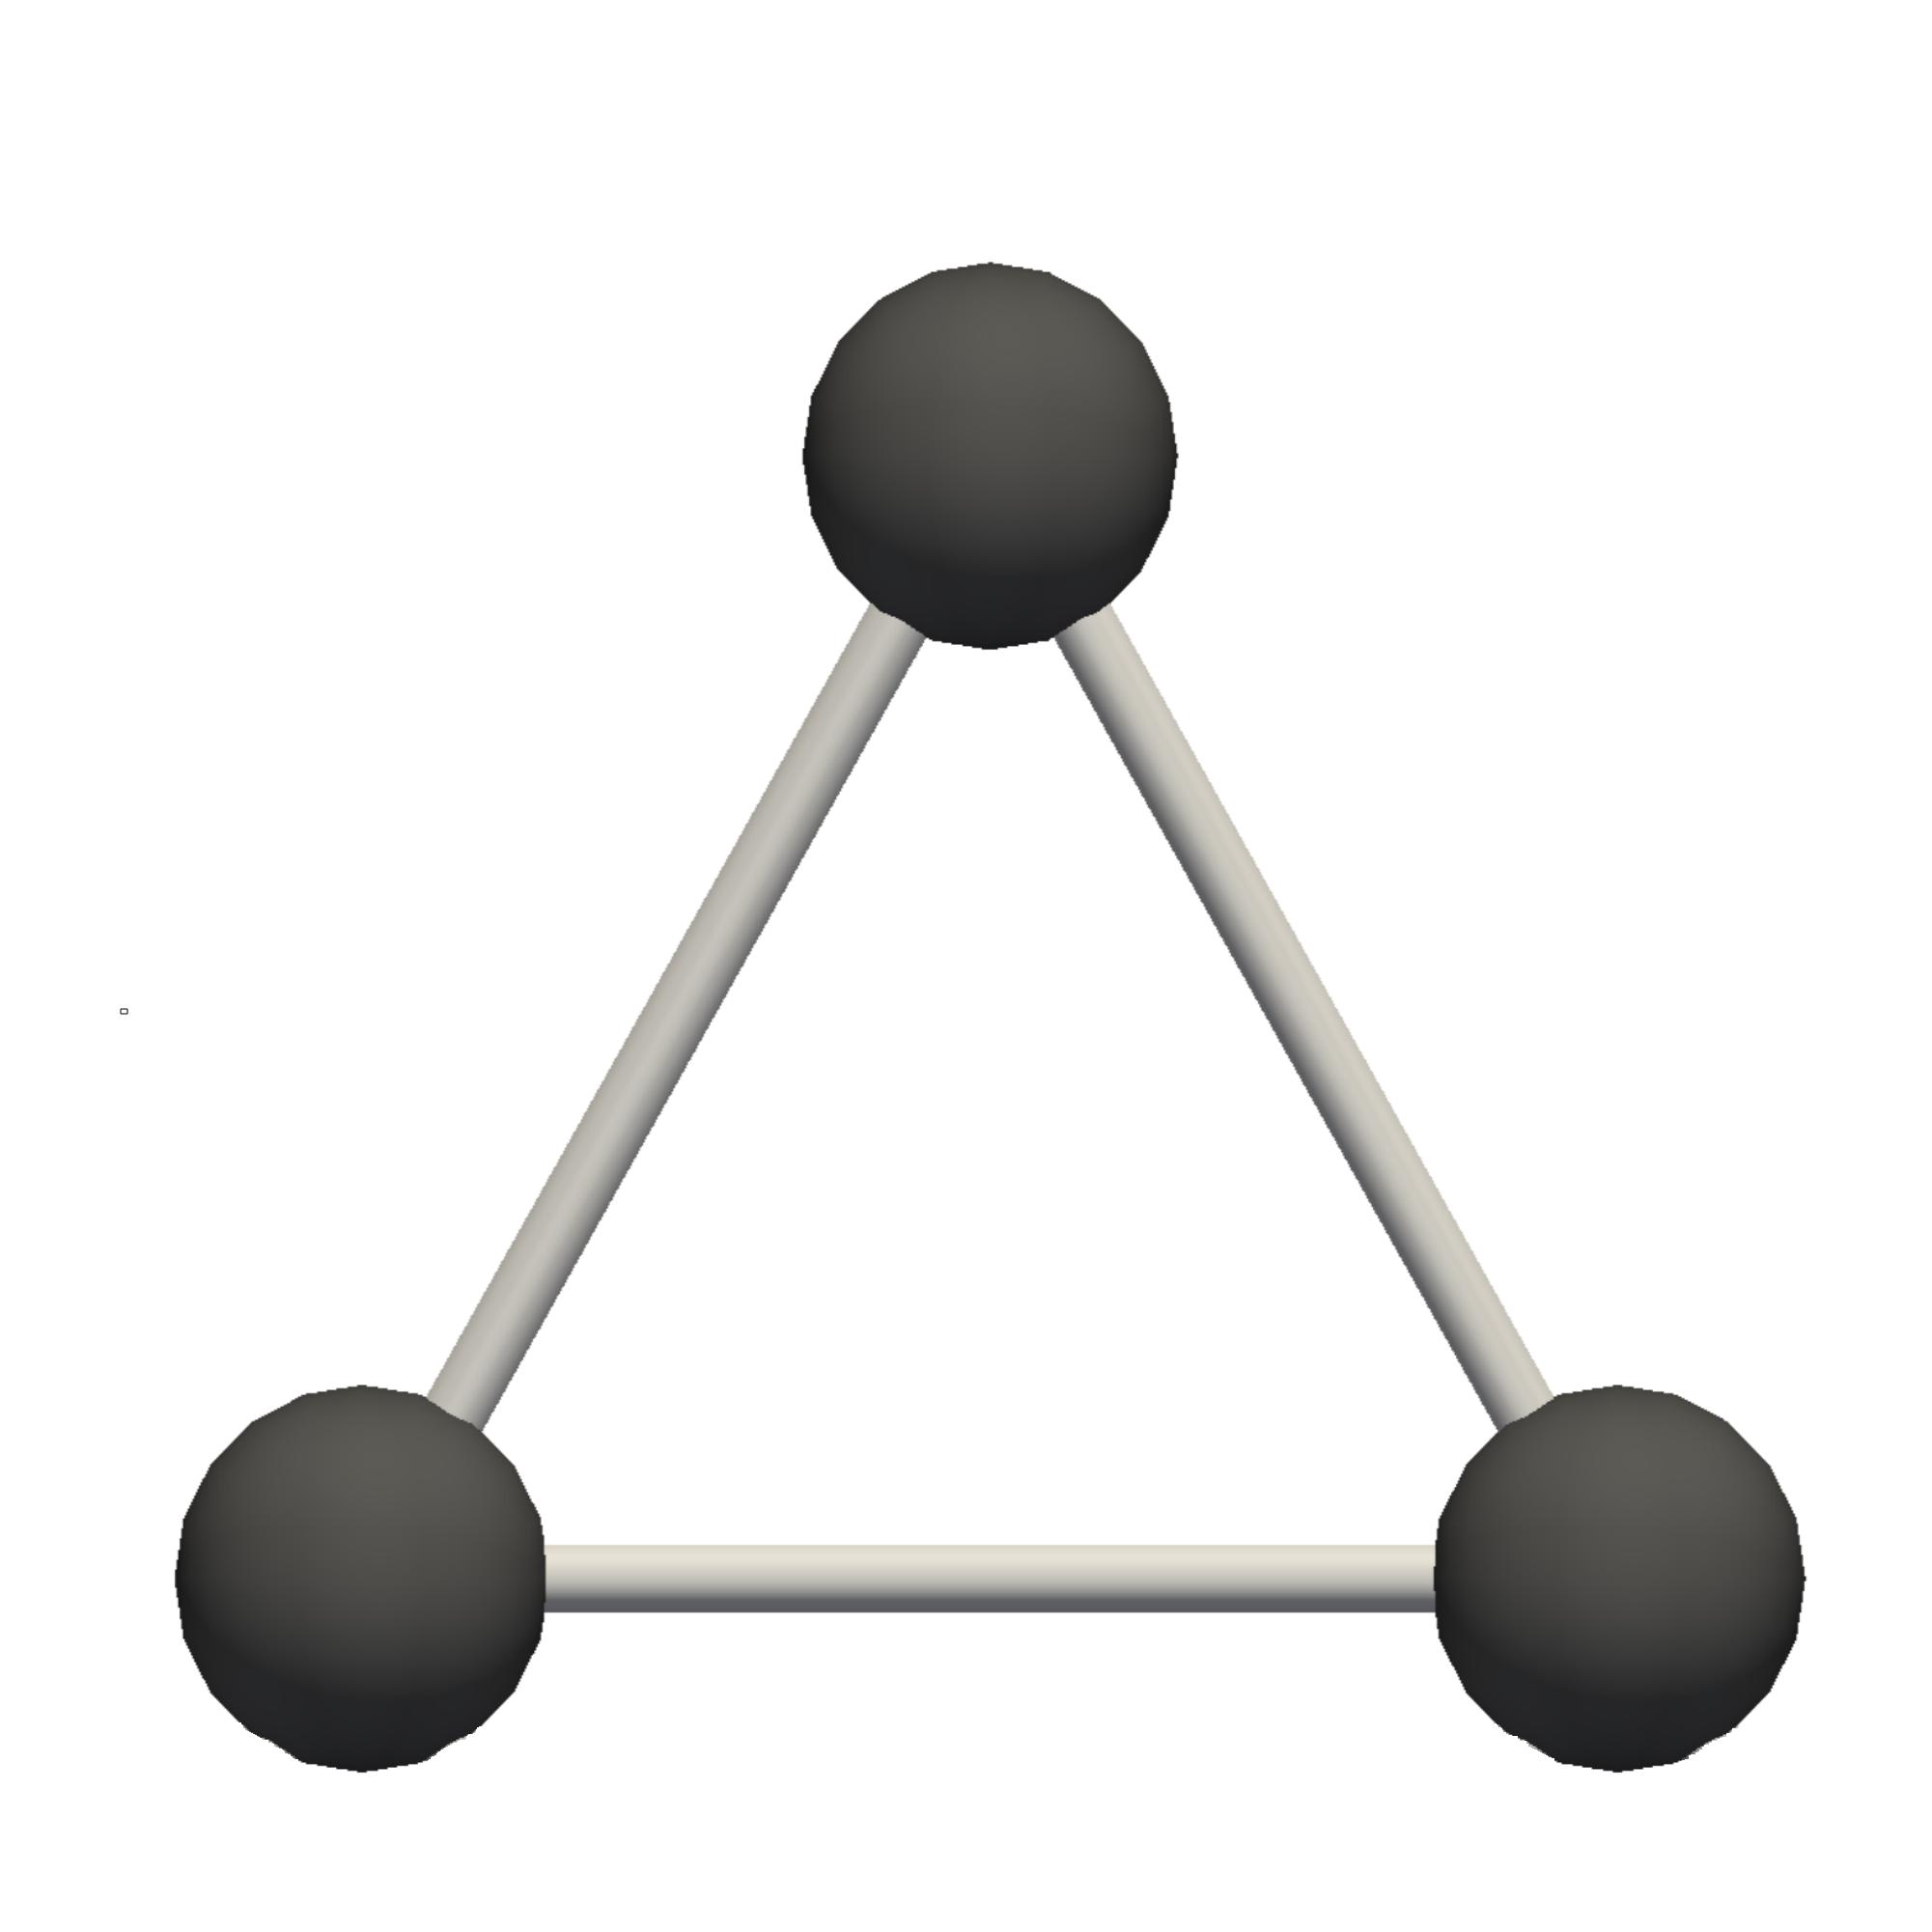
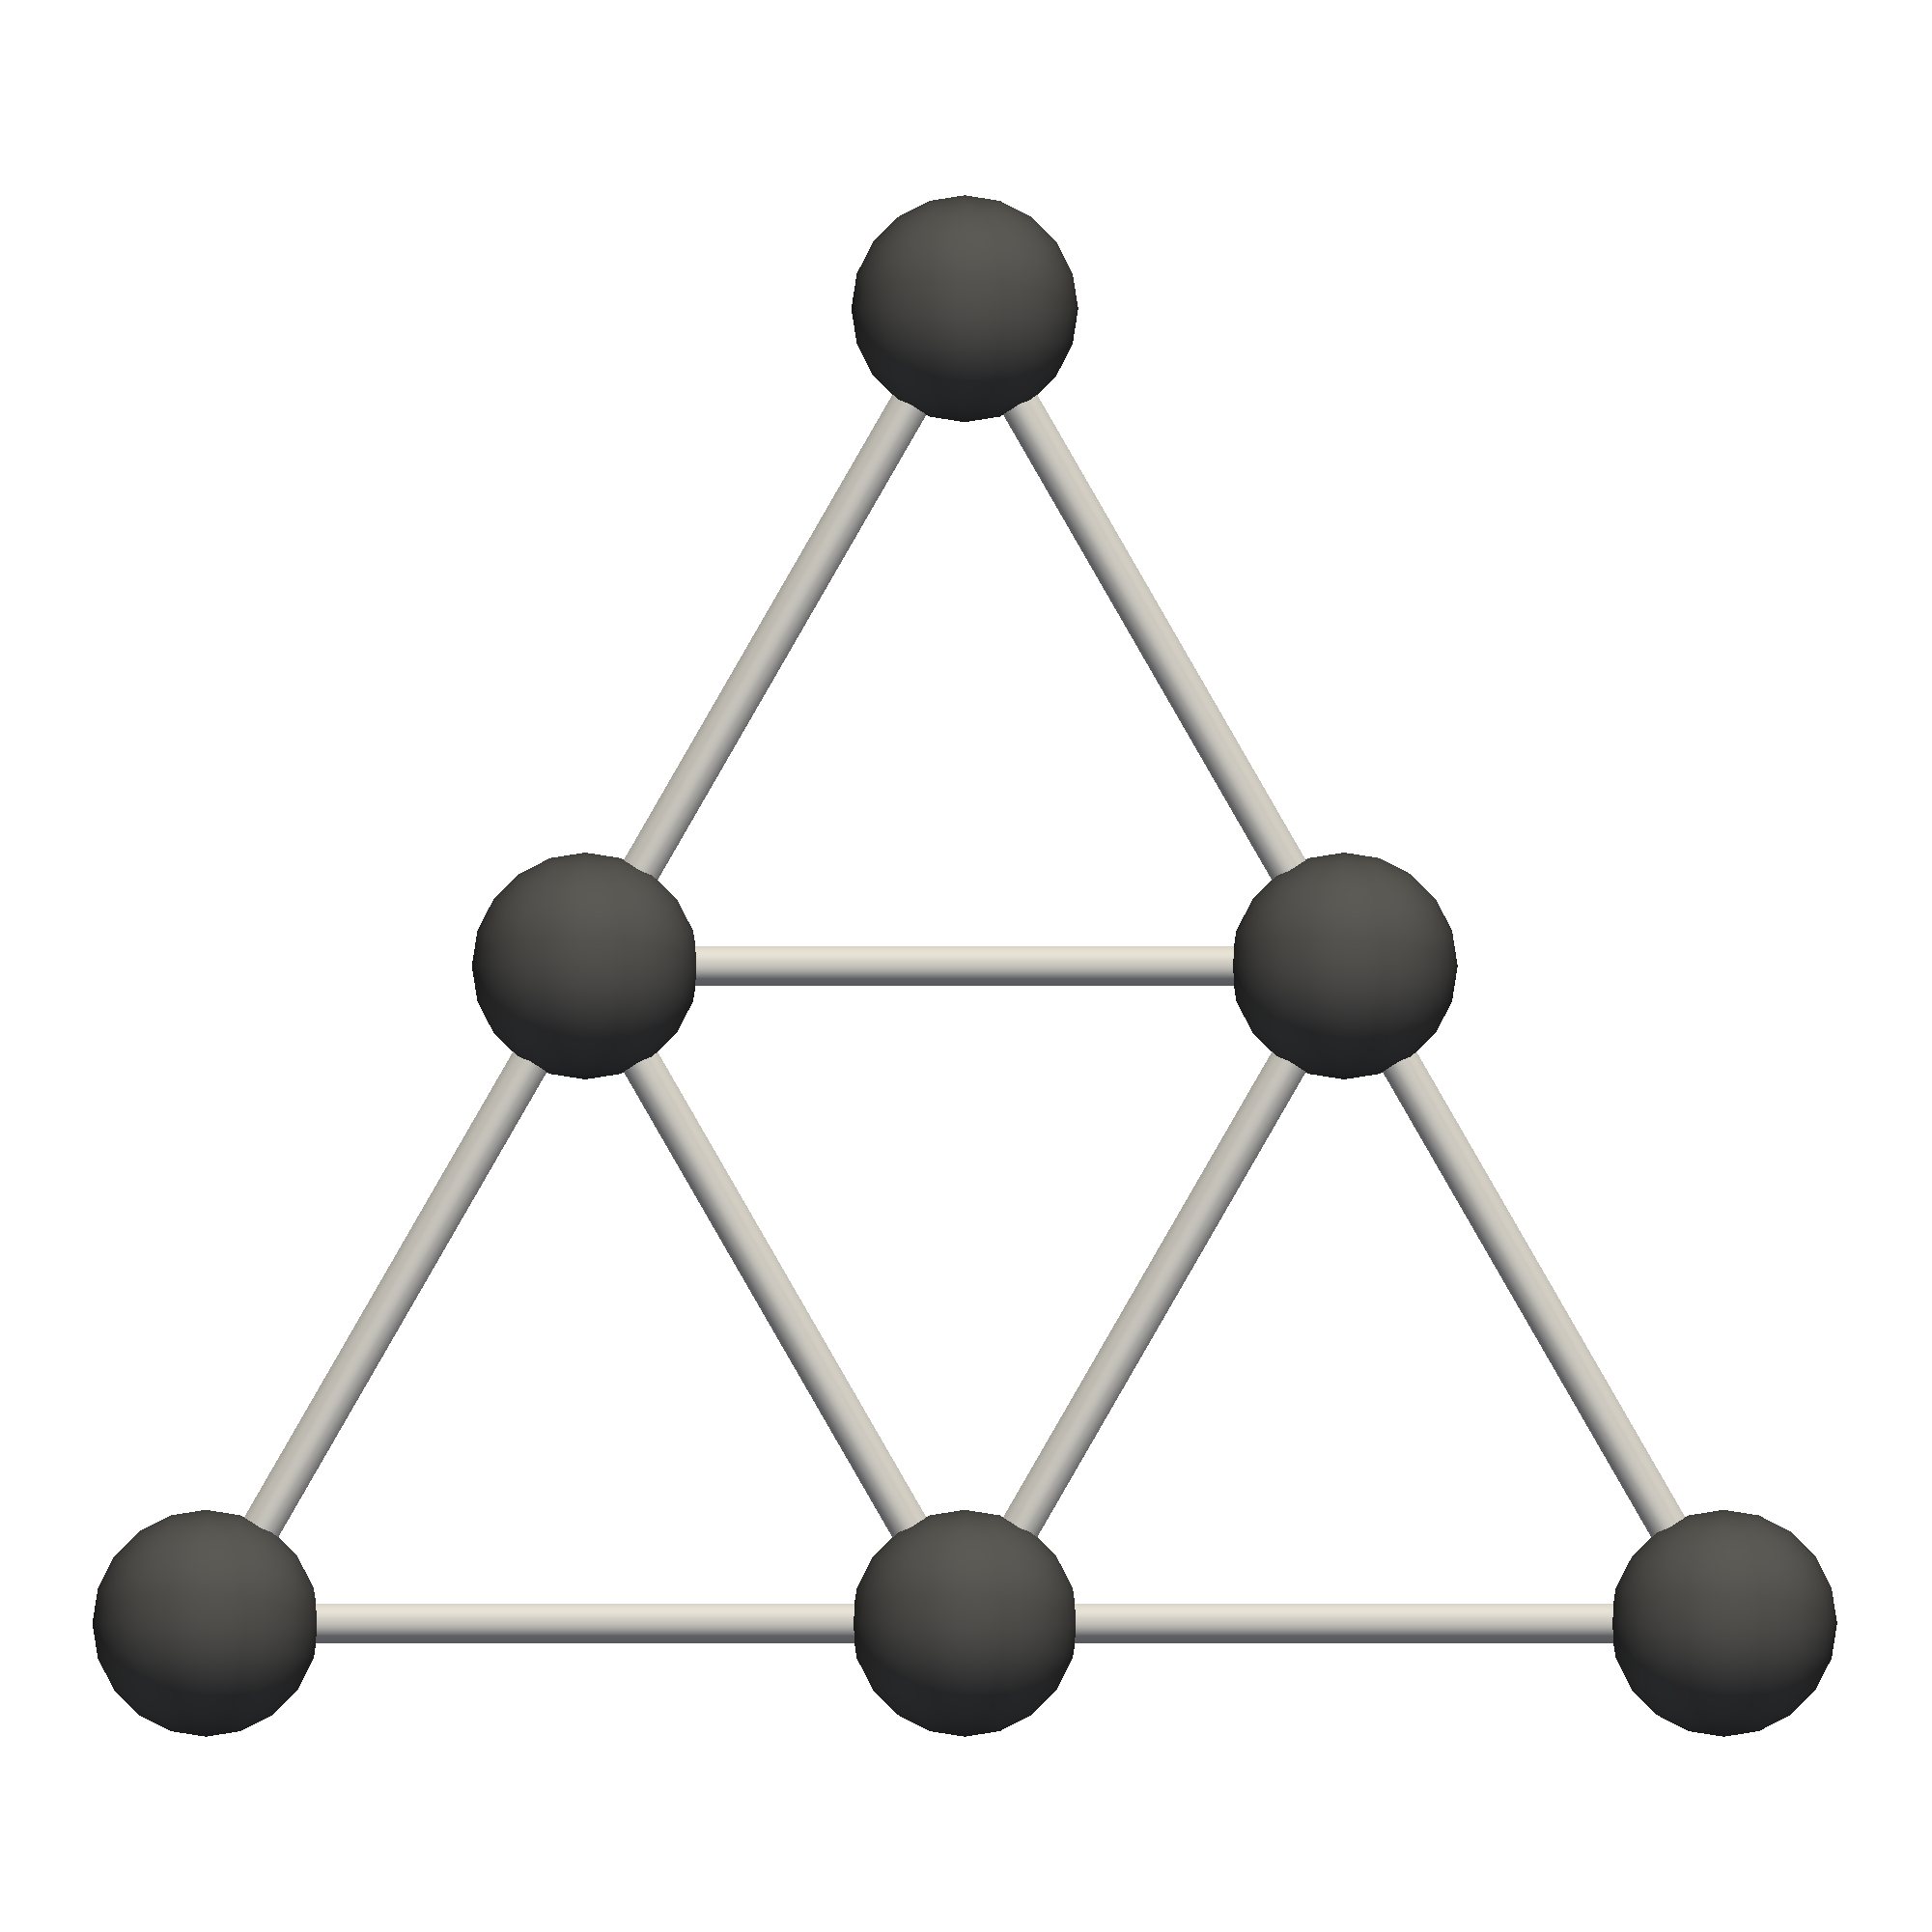
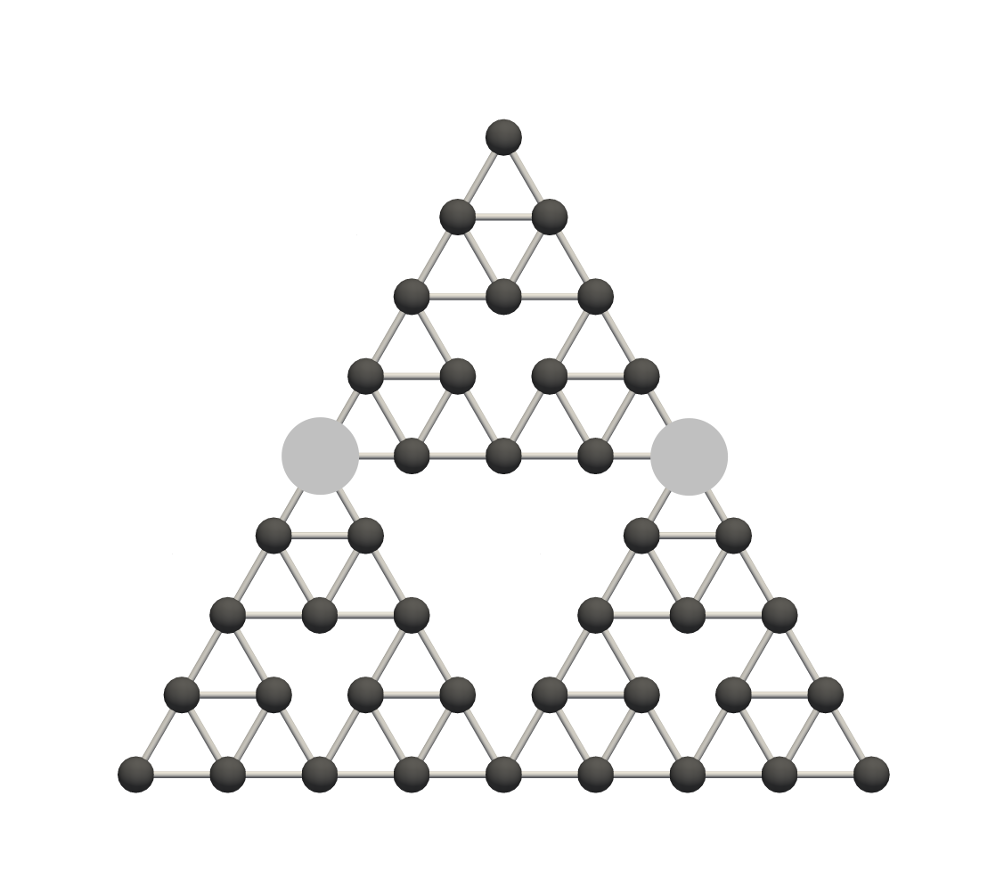
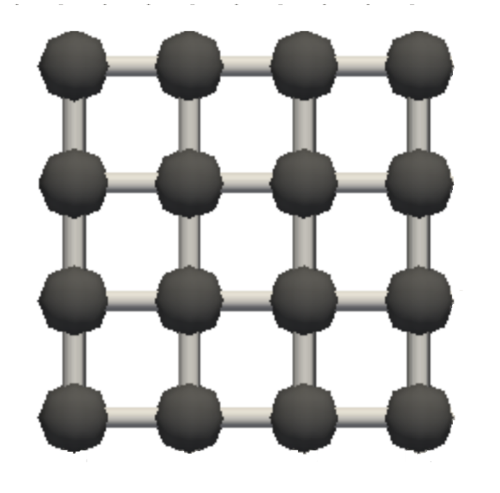
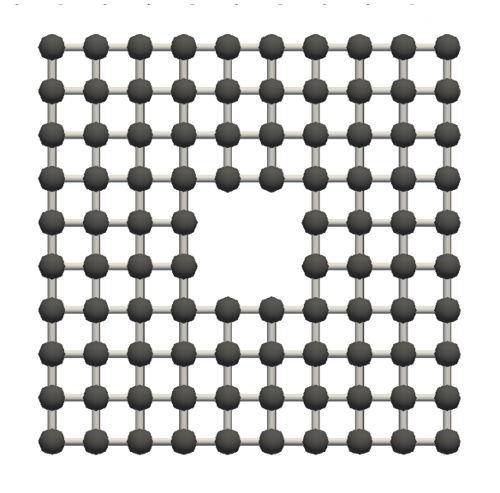
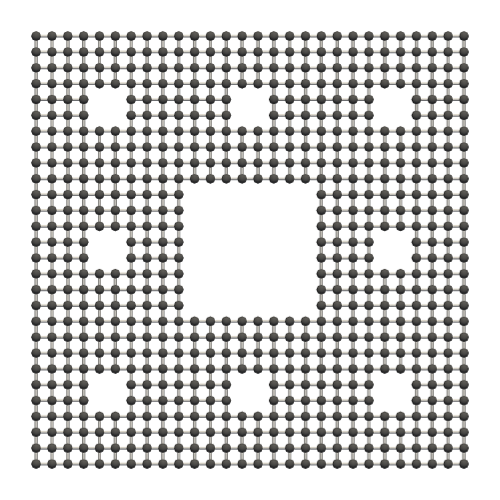
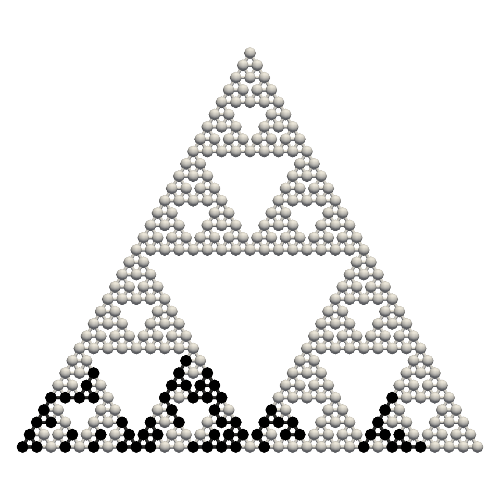
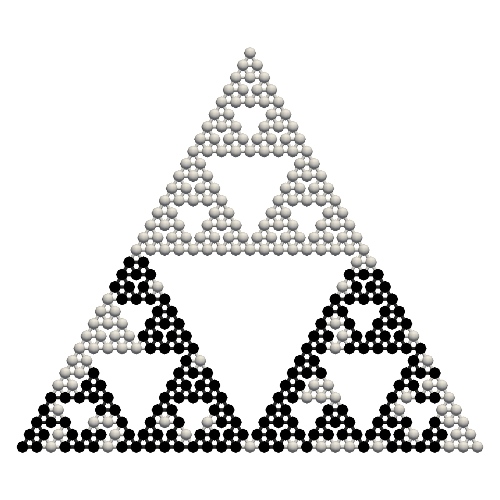
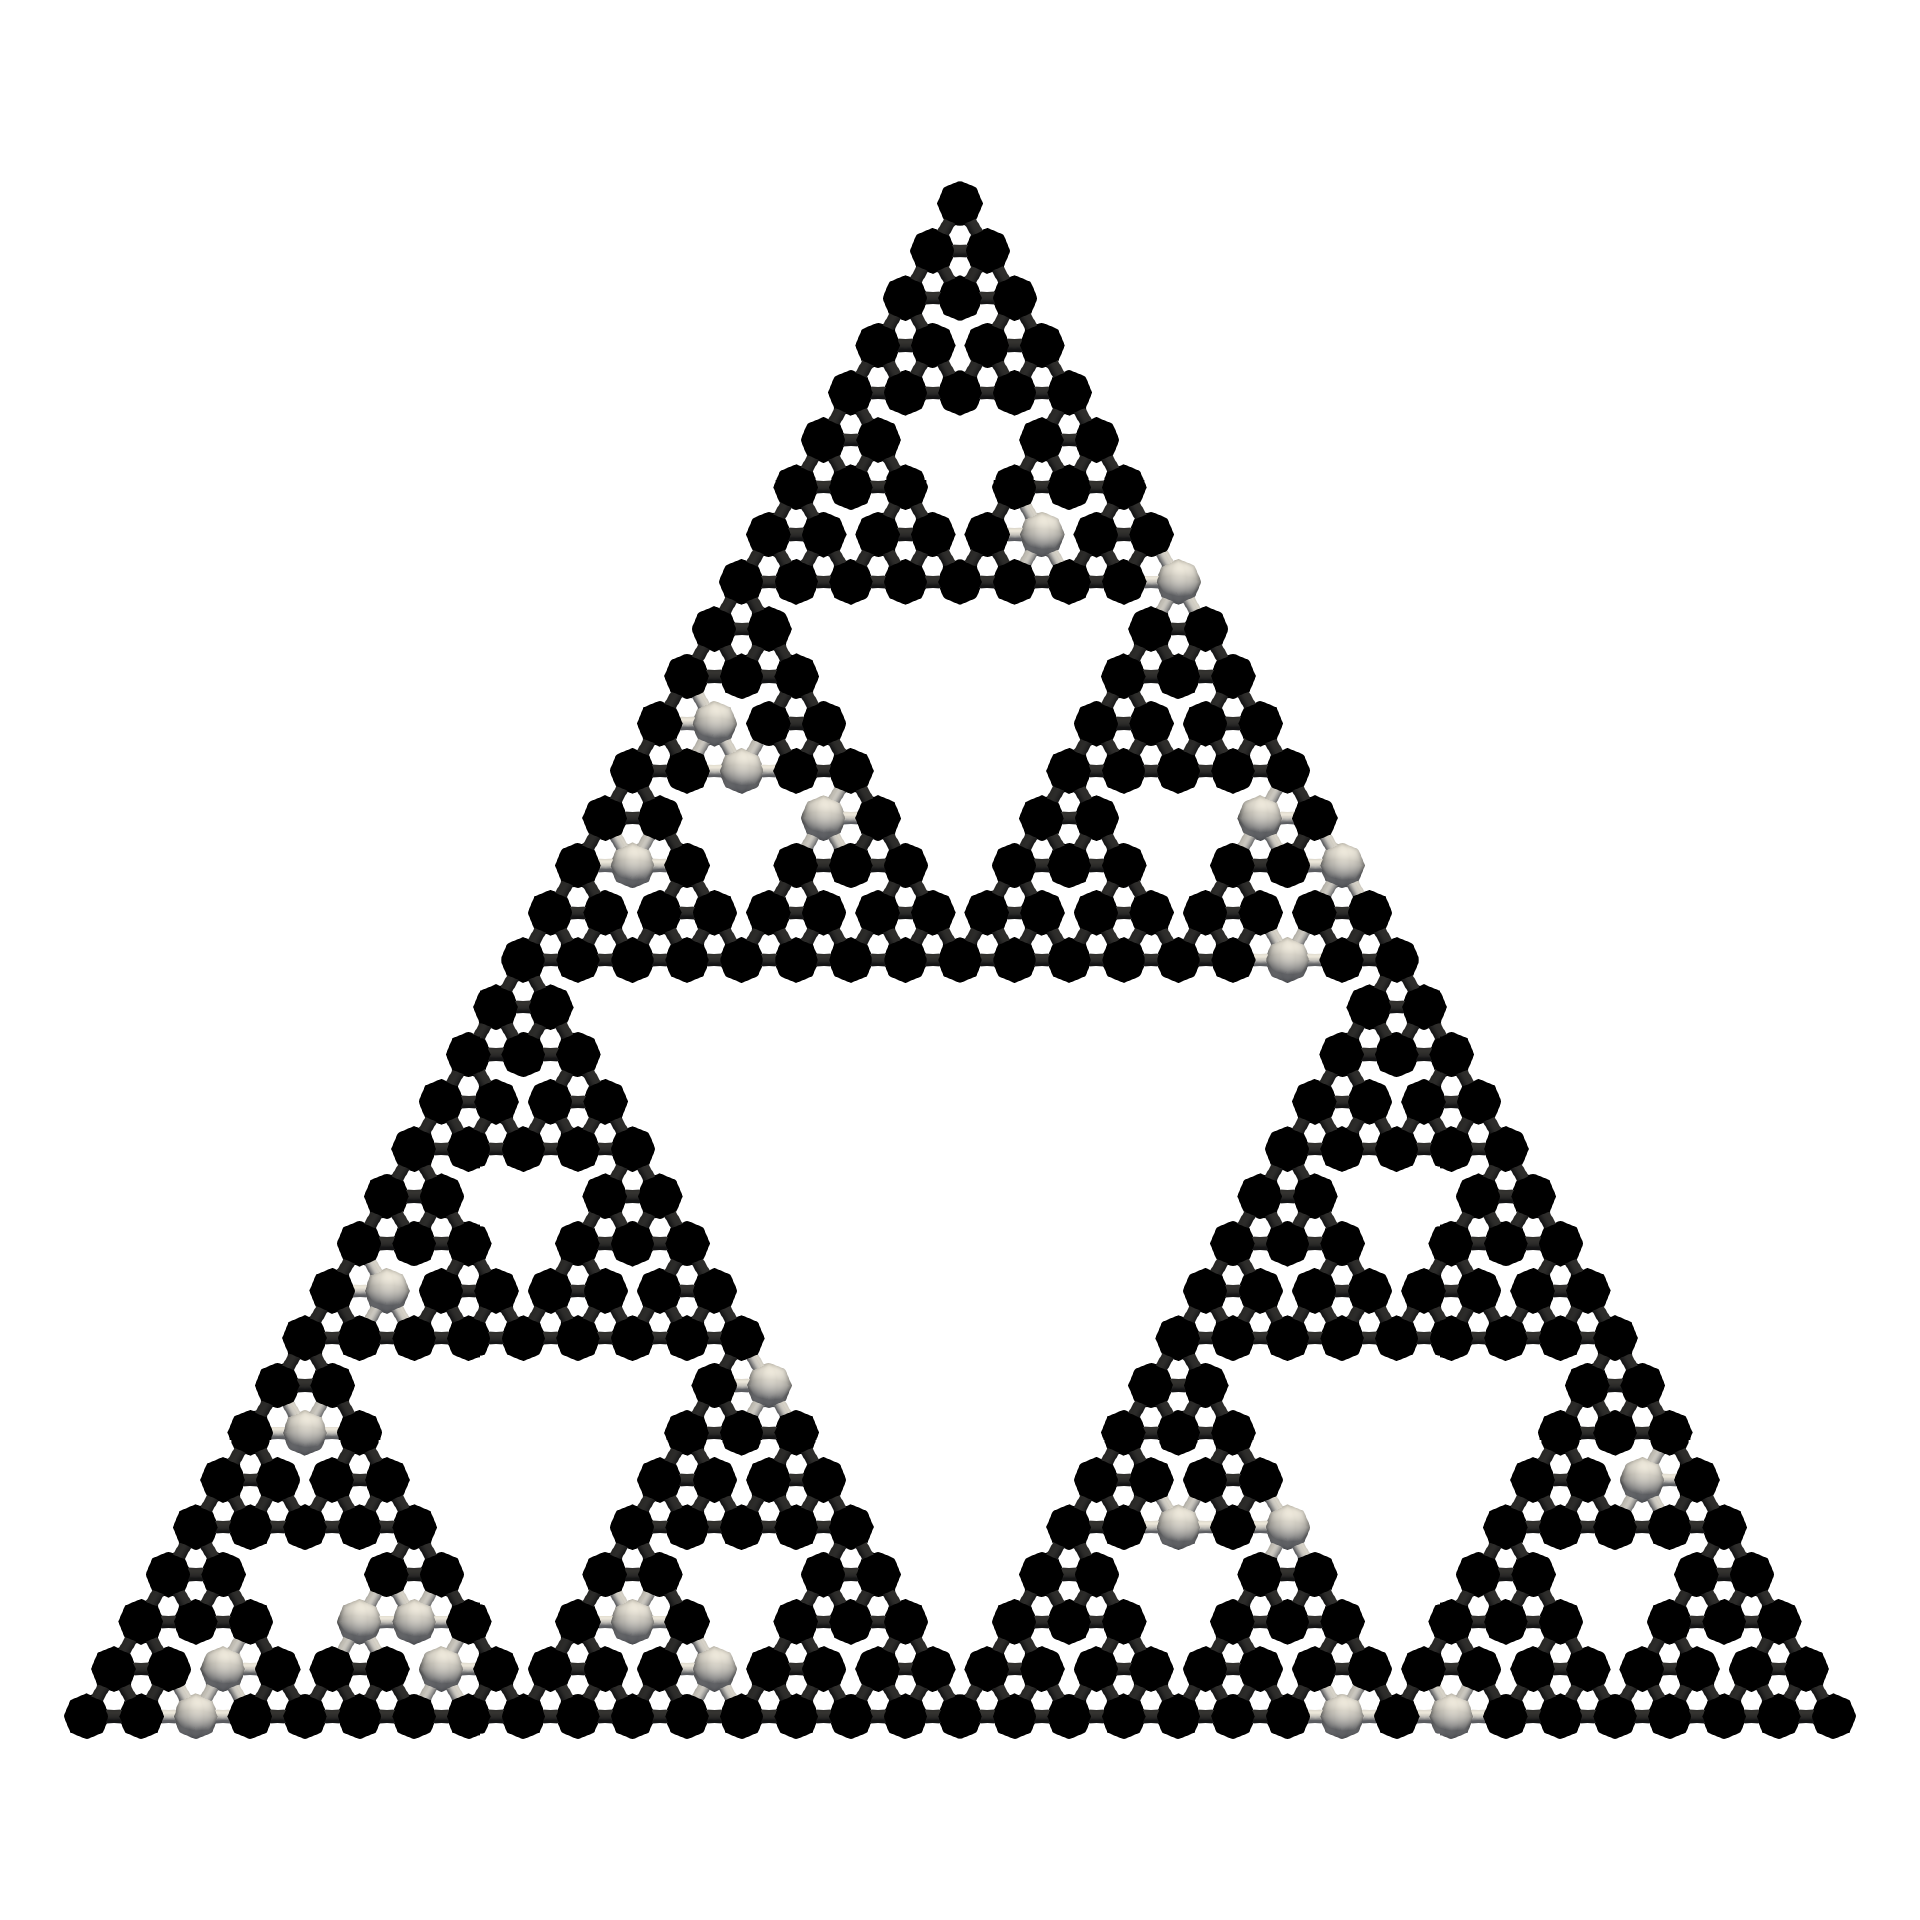
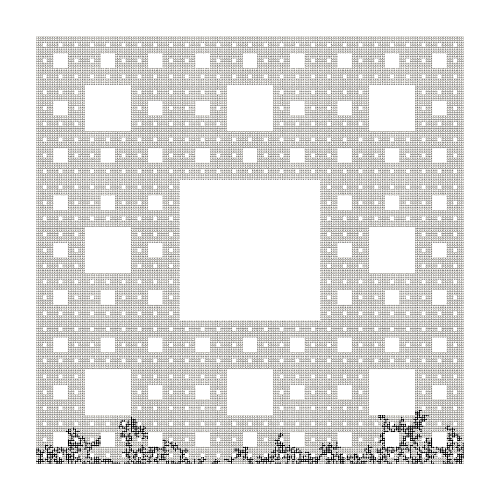
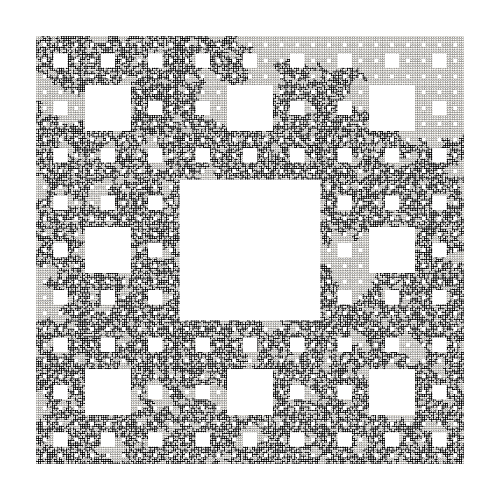
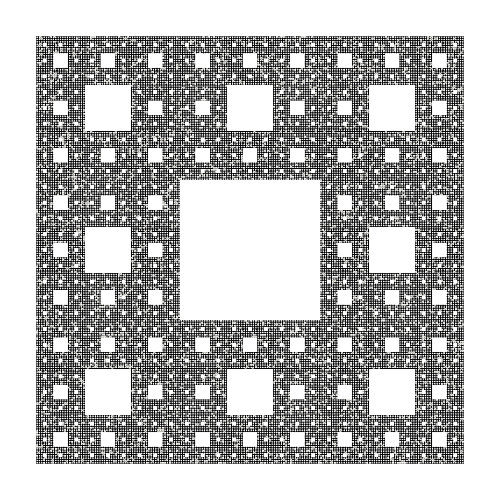
We investigated porcolation on Sierpiński triangle and Sierpiński carpet style graphs. Percolation simulation on the Sierpiński carpet were applied for financial calculations in [30]. Finite realizations of Sierpiński triangle and Sierpiński carpet style graphs are shown in Figures 6 and 7, where the level of the graph is the number of iterations required to build the graph from entities of the previous level.
For the simulations the entry pressure values were generated from a uniform distribution in and the pore volumes were taken as unity. The starting set was the bottom side of the graphs.
The saturation curves for porcolation simulations on Sierpiński triangle with levels 8-13 are presented in Figure 8. The percolation thresholds are significantly higher than for simple square networks. This can be explained by a special characteristic of the Sierpiński triangle. Some vertices (highlighted in Figure 6 with lighter color and bigger size) are critical from the perspective of porcolation, since there is no other path to reach the new region. These vertices form an articulation set, since if they are removed, the graph falls apart, hence it is not a robust graph.
We also observe that the saturation curves are shifted towards the dimensionless pressure as the graph level is increased. The reason for this shift is also connected to the articulation set, since as the graph level is increased the number of such critical vertices is also increasing. The inflection points (corresponding to the percolation thresholds ) of the saturation curves are shown in Figure 8. The occupation of sites for the Sierpiński triangle graph are shown in Figure 9 at different time steps.
Saturation curves of Sierpiński carpet with levels 3-6 are shown in Figure 10. These curves are not shifted towards dimensionless pressure as the graph level is increased because these graphs are more robust. The percolation thresholds remain almost the same for different graph levels, they are all in the range [0.65, 0.67] as shown in 10. The occupation of sites for the Sierpiński carpet graph are shown in Figure 11 at different time steps.




5 Porcolation on random graphs
Real porous medium has irregularly distributed pores, therefore we also studied porcolation on irregular (random) networks with arbitrary pore degree distributions.
There are two fundamental ways to generate random networks: edge cutting (removing) and edge adding methods. The edge cutting method starts from an existing network and removes edges until the prescribed pore degree distribution is reached. The edge adding method starts from a set of nodes and adds edges until the prescribed pore degree distribution is obtained. Due to its flexibility the edge adding method was chosen.
5.1 Random pore network generation
The so-called “configuration model” [31] creates random networks of a given pore degree distribution. First, the desired number of pores are created with assigned coordination number (pore degree) with the given distribution. The prescribed pore degree at each pore can be imagined as attached “stubs”. Randomly chosen stubs are connected until each vertex has the prescribed number of neighbors. In real porous media usually only spatially close pores are connected, but this characteristic is not taken into account in the configuration model. A pure graph model does not contain an inherent distance metric, a Euclidean graph (a pure graph embedded into Euclidean space) is the appropriate object to represent a real pore-throat network.

To efficiently generate Euclidean pore networks we developed a modified version of the cell list algorithm [32]. In this method the 3-dimensional Euclidean space is partitioned into non-overlapping cells (for computational simplicity our cells were cubes). Two cells are called neighbors if their intersection has a positive area. A given number of points (representing pores) are added to each cell. Throats are then added to connect pores only in neighboring cells.
There are two extreme cases of the modified cell list algorithm: when only one cell is defined, and when every cell contains only one pore. The single cell case is equivalent to the configuration model, while the case when every pore has it’s own cell is equivalent to the simple cubic network. These extreme cases are depicted in 2D on the right and left side of Figure 12. The middle part shows the 4 pores/cell setup of modified cell list algorithm. This method is capable of generating 3D graphs as well.
The pure graph created by the configuration model is a “global” network because there is no spatial restriction for the neighboring pores, while the one made with the developed cell list algorithm is a “local” network because only the spatially close pores can be connected.
5.2 Influence of locality on saturation
We can imagine a porous rock sample as pores and throats connecting them. Connected pores generally are not too far from each other, this is the localized nature of real pore networks. Graph locality can be quantified by the statistics of pores in each cell. We examined the effect of graph locality in porcolation simulations using the introduced modified cell list algorithm for graph generation.
Simulations were performed on cubic networks (125000 pores) with one invading side and the results were averaged over 100 simulations. The entry pressure values were generated from uniform distribution in the range of [0, 1]. The 1, 2, 3, 5, 10, and 125000 pores/cell setups were investigated, these resulted in 6, 13, 20, 34, 69, and 124999 possible pore neighbors, respectively. The saturation curves are shown in Figure 13.
As we see, network locality has a significant role in porcolation, more local pore network means higher percolation threshold values. We also conclude that the modified cell list algorithm is capable of generating more realistic pore networks than the original Britton et al. algorithm.

5.3 Experiments with different pore degree distributions
The modified cell list algorithm is also capable of generating random networks with a prescribed pore degree distribution. It was tested with 4 different pore degree distributions: is the uniform distribution, emphasizes low pore degrees, embraces the middle range and is a distribution where the high pore degrees are dominant (see Figure 14).
The 4 pore/cell setup was used for the modified cell list algorithm to generate the pore networks. Simulations were performed on networks with one invading side and the results were averaged over 100 simulations, as before. The entry pressure values were generated from uniform distribution in the range of [0, 1]. The saturation curves are shown in Figure 15.
The results for the (uniform) and the (middle dominant) pore degree distributions are almost the same. The results for the (low dominant) and the (high dominant) pore degree distributions are remarkably different as we expected. This is caused by the high difference between the number total connection in the pore networks.


6 Conclusion
In order to obtain saturation curves for different networks we implemented the porcolation model in OpenPNM with the built-in drainage simulation. The first porcolation simulations were carried out on square and cubic networks to validate the model: the inflection points of the saturation curves correspond well with the theoretical percolation threshold values.
The saturation curves were also determined for networks based on Sierpiński triangle and Sierpiński carpet. If the graph level of the Sierpiński triangle is increased, the inflection of the saturation curve is shifted to the higher dimensionless pressure values. This phenomenon is caused by the increasing number of vertices in the articulation set, which removal would disconnect the graph.
We developed a network generation method (based on the cell list algorithm) which is capable of efficiently generating local pore networks with random pore degree distribution. We showed that the locality of pore networks has major effect on the saturation curves and we also done porcolation simulations on pore networks with random pore degree distributions.
References
- [1] Guy Chavent and Jérôme Jaffré. Mathematical models and finite elements for reservoir simulation: single phase, multiphase and multicomponent flows through porous media, volume 17. Elsevier, 1986.
- [2] Keith H Coats, LK Thomas, RG Pierson, et al. Compositional and black oil reservoir simulation. SPE Reservoir Evaluation & Engineering, 1(04):372–379, 1998.
- [3] Jacob Bear and Arnold Verruijt. Modeling groundwater flow and pollution, volume 2. Springer Science & Business Media, 2012.
- [4] George F Pinder. A galerkin-finite element simulation of groundwater contamination on long island, new york. Water Resources Research, 9(6):1657–1669, 1973.
- [5] Robert M Roseen, Thomas P Ballestero, James J Houle, Joshua F Briggs, and Kristopher M Houle. Water quality and hydrologic performance of a porous asphalt pavement as a storm-water treatment strategy in a cold climate. Journal of Environmental Engineering, 138(1):81–89, 2011.
- [6] Edward W Washburn. The dynamics of capillary flow. Physical review, 17(3):273–283, 1921.
- [7] Muhammad Sahimi. Flow and transport in porous media and fractured rock: from classical methods to modern approaches. John Wiley & Sons, 2011.
- [8] I. Fatt. The network model of porous media. I. capillary pressure characteristics. Transactions of the American institute of mining and metallurgical engineers, 207(7):160–163, 1956.
- [9] I. Fatt. The network model of porous media. II. dynamic properties of a single size tube network. Transactions of the American institute of mining and metallurgical engineers, 207(7):144–159, 1956.
- [10] I. Fatt. The network model of porous media III. dynamic properties of networks with tube radius distribution. Transactions of the American institute of mining and metallurgical engineers, 207:164–181, 1956.
- [11] Andreas Putz, James Hinebaugh, Harold Day, Mahmoudreze Aghighi, Aimy Bazylak, and Jeffery T Gostick. Introducing openpnm: An open source pore network modeling framework for general scientific applications. In Meeting Abstracts, number 15, pages 1256–1256. The Electrochemical Society, 2013.
- [12] OpenPNM. An open source pore network modeling package. http://openpnm.org/.
- [13] Andreas Putz, James Hinebaugh, Mahmoudreza Aghighi, Harold Day, Aimy Bazylak, and Jeffery T Gostick. Introducing openpnm: An open source pore network modeling software package. ECS Transactions, 58(1):79–86, 2013.
- [14] Jeff Gostick, Mahmoudreza Aghighi, James Hinebaugh, Tom Tranter, Michael A Hoeh, Harold Day, Brennan Spellacy, Mostafa H Sharqawy, Aimy Bazylak, Alan Burns, et al. Openpnm: a pore network modeling package. Computing in Science & Engineering, 18(4):60–74, 2016.
- [15] Herbert Giesche. Mercury porosimetry: a general (practical) overview. Particle & particle systems characterization, 23(1):9–19, 2006.
- [16] Ioannis Chatzis, Francis AL Dullien, et al. Modelling pore structure by 2-d and 3-d networks with applicationto sandstones. Journal of Canadian Petroleum Technology, 16(01):97–108, 1977.
- [17] GP Androutsopoulos and R Mann. Evaluation of mercury porosimeter experiments using a network pore structure model. Chemical Engineering Science, 34(10):1203–1212, 1979.
- [18] Ioannis Chatzis and F.A.L. Dullien. The modelling of mercury porosimetry and relative permeability of mercury in sandstones using percolation theory. Int. Chem. Eng.; (United States), 25:1:47–66, 01 1985.
- [19] Bendegúz Dezső Bak and Tamás Kalmár-Nagy. Porcolation: An invasion percolation model for mercury porosimetry. Fluctuation and Noise Letters, 16(01):1750008, 2017.
- [20] Pejman Tahmasebi, Muhammad Sahimi, and José E Andrade. Image-based modeling of granular porous media. Geophysical Research Letters, 44(10):4738–4746, 2017.
- [21] S. R. Broadbent and J. M. Hammersley. Percolation processes: I. crystals and mazes. Mathematical Proceedings of the Cambridge Philosophical Society, 53(3):629––641, Jul 1957.
- [22] Kim Christensen. Percolation theory. Imperial College London, 2002.
- [23] Dietrich Stauffer and Ammon Aharony. Introduction to percolation theory. CRC press, 1994.
- [24] T Gebele. Site percolation threshold for square lattice. Journal of Physics A: Mathematical and General, 17(2):L51–L54, 1984.
- [25] P Grassberger. Numerical studies of critical percolation in three dimensions. Journal of Physics A: Mathematical and General, 25(22):5867–5888, 1992.
- [26] J van den Berg. A note on percolation theory. Journal of Physics A: Mathematical and General, 15(2):605–610, 1982.
- [27] Michael E Fisher and John W Essam. Some cluster size and percolation problems. Journal of Mathematical Physics, 2(4):609–619, 1961.
- [28] R. Lenormand and S. Bories. Description of a bond percolation mechanism used for the simulation of drainage with trapping in porous-media. Comptes Rendus Hebdomadaires Des Seances De L Academie Des Sciences Serie B, 291(12):279–282, 1980.
- [29] David Wilkinson and Jorge F Willemsen. Invasion percolation: a new form of percolation theory. Journal of Physics A: Mathematical and General, 16(14):3365–3376, 1983.
- [30] Anqi Pei and Jun Wang. Volatility behaviors of financial time series by percolation system on Sierpinski Carpet lattice. Fluctuation and Noise Letters, 14(02):1550015, 2015.
- [31] Tom Britton, Maria Deijfen, and Anders Martin-Löf. Generating simple random graphs with prescribed degree distribution. Journal of Statistical Physics, 124(6):1377–1397, 2006.
- [32] Michael P Allen and Dominic J Tildesley. Computer simulation of liquids. Oxford university press, 2017.